MACD Pro Suite (Zeiierman)█ Overview
MACD Pro Suite (Zeiierman) redefines the classical MACD by transforming it into an adaptive market-behavior engine, instead of relying on a static fast–slow EMA configuration, the suite channels price through an efficiency matrix, a momentum acceleration core, and a multi-regime normalization layer. The result is a MACD architecture capable of shifting seamlessly between a volatility-conditioned oscillator, a probabilistic compression model, or a smooth, distribution-aware trend profiler, all emerging from the same underlying structure.
The MACD Pro Suite extends far beyond traditional MACD behavior by interpreting market structure in real time and adapting its responses to shifting conditions. It can detect subtle momentum transitions, quantify trend stability, reveal hidden inefficiencies in price movement, and highlight early regime shifts that standard oscillators completely overlook. Its dynamic normalization engine ensures consistency across different market environments, allowing the signal to remain clear during high volatility, low volatility, compression phases, expansions, and trend accelerations.
The system is designed to identify high-quality momentum turns, confirm trend continuity, and expose weakening market pressure before it becomes visible in price. It also reveals imbalances, impulses, and structural breaks with a level of precision that makes it valuable for discretionary traders seeking refined context and for systematic traders building rule-based models.
A built-in dashboard consolidates these behavioral states into an intuitive visual panel, making it easy to read market conditions at a glance and convert complex internal analysis into actionable insight.
⚪ Why This One Is Unique
MACD Pro Suite runs on a Hybrid Efficiency–Momentum engine that reshapes how the MACD responds to trend quality, noise, and impulse strength. This engine can operate in three distinct modes, letting the indicator shift between efficiency-driven behavior, momentum-driven behavior, or a balanced hybrid.
A multi-regime normalization system transforms the MACD into a stable, adaptive signal. It can operate as a volatility-balanced measure, a probability-styled compression model, a distribution-aware signal, or an ultra-smooth structural trend reader, all from the same core data. A real-time acceleration mechanism continuously adjusts the internal smoothing weights based on momentum intensity, giving the engine dynamic responsiveness as market conditions evolve.
Additional layers enhance this behavioral core:
Divergence mapping
Price inefficiency detection
Impulse markers
Adaptive exit structures
Significant move gradient zones
A multi-timeframe dashboard for immediate state awareness
█ Main Features
⚪ Efficiency Sources
Each efficiency source delivers a different style of structural interpretation, letting the MACD engine emphasize trend, pressure, or cyclical rotation depending on the chosen configuration and market environment.
Hybrid Efficiency–Momentum Core
In this mode, the MACD engine blends an efficiency-weighted price stream with momentum-based acceleration. The indicator adapts simultaneously to trend cleanliness, directional strength, and impulse intensity, giving it a balanced and highly reactive behavior profile.
Enhanced Momentum Core
Here, the engine uses raw price as the base input but applies a dynamic acceleration mechanism that adjusts internal EMA responsiveness in real time. The MACD becomes more reactive during strong momentum phases and more controlled during choppy, low-quality movement.
Efficiency Core
This framework routes the input through an efficiency pipeline where price, directional strength, or cyclic momentum is transformed into a cumulative efficiency path before MACD is calculated. It emphasizes structural clarity by suppressing noise and amplifying meaningful movement within the market.
⚪ MACD Shaping & Normalization Framework
Volatility Balanced Modes
These modes transform the MACD into a volatility-adjusted signal that automatically adapts to changing market conditions. The result is a cleaner and more stable read that adjusts naturally to expanding and contracting volatility while still preserving clear directional intent.
Tight Compression Modes
These shaping options re-scale MACD into compact 0 to 1 style ranges that are re-centered into a clean negative one to positive one structure. They produce a tightly controlled oscillator that highlights relative movement rather than raw amplitude.
Position Centered Modes
Here, the MACD is normalized using distribution-based scaling, allowing it to understand where it sits within its own movement range. This makes shifts in pressure and momentum easier to read and highlights when the indicator is moving into unusually strong or weak conditions.
Distribution Aware
These modes apply distribution-based transforms and robust statistical scaling. They stabilize MACD during irregular or skewed market conditions while preserving high-quality turning points
Volatility Filtered and Ultra Smooth Modes
These variants use multi-component volatility estimates and smoothed normalization to produce an exceptionally smooth MACD line. They maintain structure and trend behavior while filtering out low-value noise.
Robust Volatility Filtered
Ultra-Smooth Volatility Filter
⚪ Significant MACD Move
The Significant MACD module identifies when the MACD line enters a meaningful high-importance zone by evaluating its recent amplitude and confirming that momentum has held inside a defined activity region. Once active, a thicker overlay highlights periods where MACD is operating within this significant regime, while neutral phases use a base color for clear visual separation.
These highlights show when MACD is pressing into one of its internal pressure zones, helping you distinguish between ordinary momentum rotation and moments when the underlying push becomes strong enough to deserve attention. It is especially useful for spotting expansion phases, confirming breakouts, or identifying trend legs with real follow-through potential.
⚪ Signals
The suite includes directional signals that track meaningful shifts in market pressure and help highlight emerging turns or continuation strength, offering clear guidance when the market begins to turn or strengthen.
⚪ Divergences
When enabled, the suite automatically scans for regular bullish and bearish divergence between MACD and price. It identifies and marks structural pivot points where momentum and price begin to disagree. Because the MACD engine is built on efficiency and momentum rather than raw price alone, it can surface uncommon or non-traditional divergence structures that do not appear on standard indicators, often with noticeably higher accuracy.
Regular Bullish Divergence
MACD forms a higher low while price sets a lower low, signaling potential upward rotation.
Regular Bearish Divergence
MACD forms a lower high while price sets a higher high, indicating possible weakening momentum.
⚪ Price Inefficiency
The Price Inefficiency engine evaluates how balanced or imbalanced market movement is by analyzing a composite stream built from price, normalized MACD, normalized Signal, and smoothed structure. It measures how efficiently the market is progressing and identifies when movement becomes unstable, irregular, or out of sync with its underlying trend profile.
Blue diamonds plotted along the MACD zero line highlight periods where inefficiency is detected. This layer exposes subtle structural imbalances that often precede volatility bursts, failed moves, or regime transitions, giving traders early insight into when the market is behaving cleanly and when it is slipping into disorder.
⚪ Impulse Markers
The Impulse module identifies statistically extreme expansions in a smoothed, price-derived momentum stream. It highlights moments when momentum surges beyond normal behavior, marking them as either positive or negative impulses.
⚪ Visual Multi-Timeframe Dashboard
Along the right edge of the pane, a compact dashboard summarizes the MACD environment across 5M, 15M, 1H, 2H, 4H, and 1D. Each column reflects a key behavioral element derived from the MACD Pro Suite:
MACD Value – raw MACD pressure showing strength, weakness, or extreme displacement
MACD Signals – directional bias such as Long, Short, or neutral transitions
Histogram Signals – bull/bear momentum pulses extracted from the histogram structure
Divergence – bullish or bearish conflicts between MACD behavior and price movement
Inefficiency – imbalance zones where price behaves unstably or inefficiently
Impulse Moves – active bullish or bearish momentum bursts detected in real time
Think of it as a “MACD climate map.” Instead of flipping through multiple charts, you get an instant visual read on whether lower timeframes support the higher-timeframe environment or move against it. This makes multi-timeframe alignment straightforward and helps you decide when conditions favor aggressiveness, patience, or stepping aside entirely.
█ How to Use
The MACD Pro Suite is built to be exceptionally flexible. Because its core engine adapts to trend quality, volatility conditions, structural efficiency, and momentum strength, it can be shaped into almost any style of MACD behavior you need. From smooth trend-profiling to tight compression signals, from volatility-balanced structure to aggressive momentum tracking, the suite can be tuned to match your strategy, timeframe, and market environment.
Rather than forcing you into one interpretation of MACD, the framework gives you a set of behavioral modes that respond intelligently to changing conditions. It can act as a trend tool, a reversal detector, a structure mapper, or a regime classifier depending on how you configure it. This agility is what makes the suite useful for discretionary traders and system builders alike.
⚪ Classic MACD Trading
In its traditional form, MACD is used to track shifts in momentum and trend direction. The MACD line crossing above the Signal line often signals upward pressure, while crossing below suggests momentum is weakening or rotating downward. The histogram shows the distance between the two, making acceleration or deceleration easy to see at a glance.
These same interpretations apply directly within the MACD Pro Suite. Even with its advanced engines and normalization layers, the MACD and Signal lines still behave intuitively: crossovers mark directional shifts, zero-line transitions indicate broader trend bias, and histogram contractions or expansions reveal early momentum changes. This means you can trade it just like a classic MACD while benefiting from a far more adaptive and stable internal engine.
⚪ Fading Momentum Trading
MACD helps you spot fading momentum by watching the MACD line lose its slope and drift back toward the signal line. When the line stops accelerating and starts flattening, it’s a clear sign the trend is running out of strength. You also see fading momentum when both lines start moving back toward the midline, showing the impulse behind the trend is weakening even if the price hasn’t reversed yet.
Fading Momentum + Signals
If you spot fading momentum together with one of our Signals, it becomes a much stronger confirmation that the move is losing strength. When MACD momentum fades at the same time a Signal fires, the probability of a pullback or reversal increases significantly.
Fading Momentum + Divergences
The same applies when fading momentum aligns with divergences. If price makes a new high or low but the MACD line or histogram makes a weaker high/low, the divergence confirms that momentum is not supporting the move. Combined with fading MACD momentum, this is one of the strongest early warnings of an upcoming reversal.
⚪ Volatility and Breakout Trading
Volatility and breakout trading focus on how the market expands and contracts rather than on direction alone, and MACD Pro reacts beautifully to these shifts. When volatility increases, the MACD line tends to widen, steepen, or oscillate more aggressively. This makes it easier to see when the market is entering a high-energy phase that can lead to sharp breakouts or fast directional moves. As volatility cools, the MACD Pro begins to tighten and compress, with both the line and histogram pulling back toward equilibrium. This compression signals a contraction phase, often the calm before the next expansion.
You can spot volatility expansion when the MACD line or histogram behaves noticeably differently from recent behavior, such as sudden widening, rapid swings, or strong impulse signatures. These changes often highlight a volatility burst building beneath the surface. When that burst fades and the MACD compresses again, the market is usually preparing for a decisive move.
Settings used for Volatility and Breakout Trading:
Example Setting 1
MACD Moving average type: WMA
MACD Shaping: Raw MACD Behaviour
Momentum Multiplier: 6
Example Settings 2
MACD Shaping: Robust Volatility Filter
Momentum Multiplier: Increase toward 5
Example Setting 3
MACD Shaping: Distribution Balanced
Increase Momentum Multiplier: to exaggerate volatility bursts
Increase Efficiency Length: to filter minor fluctuations
⚪ Overbought / Oversold Trading
Overbought and oversold trading focuses on identifying when the price has stretched too far and is likely to rotate back toward balance. With the right shaping, the MACD can behave more like a bounded oscillator, making it easier to spot exhaustion on both sides of the range. When using tighter shaping or position-weighted behavior, the MACD becomes more responsive to market extremes while suppressing noise.
You can interpret overbought conditions when the MACD begins pressing into the upper region of its shaping range, showing that bullish momentum is becoming stretched. When it leans into the lower region, it signals oversold conditions and weakening bearish pressure. These zones help highlight exhaustion points, mean-reversion opportunities, and areas where a reversal or rotation is becoming increasingly likely.
Example settings:
MACD Shaping: Volatility Balanced
MACD Shaping: Tight 0–1 Band
MACD Shaping: Position Weighted
█ How It Works
⚪ Hybrid Efficiency–Momentum Engine
The core engine blends efficiency analysis with momentum dynamics, creating an adaptive MACD input stream that shifts between efficiency-centric, momentum-driven, or hybrid behavior depending on the selected mode.
Calculation: Builds the MACD input from either an efficiency-weighted cumulative path or a momentum-driven price stream, chosen by the engine mode.
⚪ Adaptive Momentum Response
A real-time responsiveness layer adjusts how quickly MACD reacts based on changes inside its structure. It becomes more responsive during fast-moving phases and naturally smooths itself during slower or noisy conditions.
Calculation: Computes a normalized responsiveness factor from structural deviation and injects it into the smoothing weights of the MACD EMAs.
⚪ Normalization & Behavior Shaping
A multi-regime shaping system re-scales and re-centers MACD using volatility filters, distribution transforms, compression modes, and ultra-smooth normalization to create consistent behavior across assets and volatility regimes.
Calculation: Applies shaping formulas to both MACD and Signal, then re-centers outputs to zero for unified interpretation.
⚪ Directional Signals
A lightweight structural reversal system highlights meaningful directional shifts, assisting with entries, exits, and bias confirmation during momentum transitions.
Calculation: Uses volatility-adjusted logic to detect directional flips and plot Up or Down markers.
⚪ Divergence Layer
The divergence engine detects structural disagreement between MACD and price, often surfacing uncommon divergence patterns thanks to the efficiency–momentum architecture.
Calculation: Identifies MACD pivots, aligns them with price pivots, and validates divergence through comparative structural thresholds.
⚪ Price Inefficiency Engine
This module evaluates imbalance in market structure by merging price behavior with internal MACD signals, highlighting unstable or disordered movement phases.
Calculation: Computes an inefficiency score from a blended composite source and maps imbalance intensity through adaptive thresholds.
⚪ Impulse Module
A momentum-intensity detector reveals statistically significant bursts in directional pressure, marking early expansion phases or exhaustion points.
Calculation: Extracts local extremes from a smoothed momentum field and confirms persistent surges through a cluster-based filter.
⚪ Significant MACD
This layer isolates high-importance momentum zones, making strong structural moves stand out clearly against routine oscillation.
Calculation: Evaluates MACD’s recent amplitude range and confirms when it enters a significant activity region, then applies enhanced visual styling.
-----------------
Disclaimer
The content provided in my scripts, indicators, ideas, algorithms, and systems is for educational and informational purposes only. It does not constitute financial advice, investment recommendations, or a solicitation to buy or sell any financial instruments. I will not accept liability for any loss or damage, including without limitation any loss of profit, which may arise directly or indirectly from the use of or reliance on such information.
All investments involve risk, and the past performance of a security, industry, sector, market, financial product, trading strategy, backtest, or individual's trading does not guarantee future results or returns. Investors are fully responsible for any investment decisions they make. Such decisions should be based solely on an evaluation of their financial circumstances, investment objectives, risk tolerance, and liquidity needs.
Signals

Stochastic Pro Suite (Zeiierman)█ Overview
Stochastic Pro Suite (Zeiierman) is a full stochastic trading framework built on top of an Efficient Price engine. Instead of feeding the oscillator with raw price data, the script first converts price into a volatility-aware, efficiency-weighted path called Efficient Price and then builds a stochastic on that foundation. Every major component, including EP Stochastic, Significant Stochastic Moves, divergence logic, inefficiency regimes, momentum impulses, and the multi-timeframe dashboard, reads from this refined stream.
The result is a stochastic that still behaves like the familiar 0–100 %K/%D oscillator, but with far more context behind every move. It doesn’t simply tell you where the price is within a recent high–low range; it tells you how reliable that move is, how clean the underlying regime is, and when the internal rotation is stretched. The tool works equally well for traders who like classic overbought/oversold swings and those who prefer higher-level context such as pressure bands, regime shifts, and impulse-driven moves.
⚪ Why This One Is Unique
Most stochastic indicators calculate %K and %D directly from the recent high–low range. Stochastic Pro Suite goes a step earlier in the chain. It first runs the chosen EP source (Close, Mean-reversion, or Trend) through a two-stage Efficient Price model that adapts to volatility, filters out random zigzags, and emphasizes directional quality. Only then is the stochastic calculation applied.
This means that when the oscillator hugs the top of its range, it’s not just reacting to any move up; it’s reacting to price movement that has already passed through an efficiency filter. Shallow, noisy moves tend to be down-weighted; clean, committed pushes stand out more. Around this EP Stochastic core, the script layers:
Significant Stochastic Moves to track internal pressure zones,
Divergence detection based on EP-Stochastic pivots,
An inefficiency layer that flags distorted regimes,
A momentum impulse engine focused on unusually strong surges, and
A dashboard that stitches everything together across multiple timeframes.
█ Main Features
⚪ EP-Based Stochastic
At the core is an EP-Stochastic built on Efficient Price instead of raw highs and lows. The oscillator keeps the classic stochastic look:
0–100 scale,
Upper and lower tension zones,
A midline representing balance,
Signal line via several moving-average types.
What changes is the input: instead of loosely tracking every tick, the EP engine compresses noisy swings and lets structured moves dominate the signal. This makes the stochastic more stable in directionally clean phases and more revealing when the market truly rotates.
You can choose between three EP behaviors to shape how the oscillator responds:
Close
The engine follows price almost one-to-one, but with the benefit of efficiency filtering. This setting is ideal if you want a familiar, general-purpose stochastic feel with fewer random spikes and more meaningful tests of the bands.
Mean-reversion
Here, the EP source emphasizes swing turns and back-and-forth rotation. The stochastic becomes a dedicated swing tool: transitions between upper and lower zones become more pronounced, and range-bound behavior is easier to read. This mode is well-suited for traders who fade extremes or trade oscillations inside a broader sideways structure.
To get better mean-reversal signals, increase the Stochastic Length to 200 and the Efficiency Length to 20.
Trend
In Trend mode, the EP source is smoothed to emphasize directional movement. When a trend is strong, the oscillator stays mostly in one half of its range and usually remains there until the trend begins to weaken. This makes it easier to see whether a pullback is just a pause in the trend or a sign that the structure is starting to roll over.
If you increase the EP Length, a more filtered trend will appear.
⚪ Significant Stochastic Moves
Instead of only watching fixed numerical levels like “80” or “20,” the suite identifies where the oscillator is trading within its own evolving range. Significant Stochastic Moves appear when the EP Stochastic pushes into internally important zones, areas where the market has historically shown heightened reaction or follow-through.
These highlights show when the stochastic is pressing into one of its key pressure zones. This helps you distinguish between normal rotation and moments where the internal push becomes strong enough to deserve attention. To identify significant moves, switch to Mean-reversion mode.
⚪ Divergence Detection
The script includes automatic detection of regular bullish and bearish divergences between the EP-Stochastic and price:
Bullish divergence: price makes a lower low while the EP-Stochastic prints a higher low.
Bearish divergence: price makes a higher high while the EP-Stochastic prints a lower high.
These are drawn directly on the oscillator pane with clear labels. Because the oscillator is driven by Efficient Price, many of the “random” divergences you see with standard stochastic are filtered out, leaving fewer but more structurally relevant signals, especially around extended trends, tight ranges, and turning points. To detect divergence, switch to Mean Reversion mode.
Since this divergence function is based on price-efficiency rather than traditional momentum swings, some divergences may appear a bit unconventional; however, the accuracy is on an entirely different level.
⚪ Momentum Impulses
Momentum impulses focus on moments when the oscillator accelerates unusually quickly relative to its own recent behavior.
Green circles near the upper region highlight powerful bullish surges.
Red circles near the lower region highlight powerful bearish surges.
The underlying logic exaggerates only the strongest deviations and ignores routine oscillation. These impulses often coincide with breakout thrusts, exhaustion spikes, sharp squeezes, or capitulation moves, places where the market briefly abandons its usual rhythm. They’re not a stand-alone trading system, but a visual cue that something unusually strong just happened in the stochastic structure.
⚪ Inefficiency Regime
The inefficiency engine monitors how orderly or distorted the combined price–stochastic behavior is. When the internal regime becomes noisy, spiky, or unbalanced, the script marks blue diamonds around the mid-region of the oscillator.
These diamonds tend to cluster when:
A previously clean trend starts to fragment,
A range becomes unstable and prone to fake breakouts,
Moves extend beyond what the recent structure would consider “normal.”
Used together with Significant Stochastic Moves, impulses, and divergence, these inefficiency markers help you distinguish between healthy follow-through and movement that is increasingly fragile.
⚪ Visual Multi-Timeframe Dashboard
On the right edge of the pane, a compact dashboard summarizes several key elements across 5M, 15M, 1H, 2H, 4H, and 1D:
Signals: immediate directional bias from the stochastic context,
OB/OS flags: stretched conditions by timeframe,
Divergence: where the structure disagrees with price,
Impulse: active momentum bursts,
Inefficiency: unstable or imbalanced regimes,
Explosive: high-energy conditions highlighted by Significant Stochastic Moves.
Think of it as a “stochastic climate map.” Instead of checking six separate charts, you get a quick snapshot of whether lower timeframes are in sync with the higher backdrop, or whether they are fighting each other. This is extremely helpful for multi-timeframe alignment and for deciding when to be aggressive versus when to stay defensive.
█ How to Use
⚪ Classic Stochastic Trading
Interpreting EP-Stochastic is similar to classic stochastic, but cleaner:
Sustained time above the midline signals a bullish rotational bias in the Efficient Price space.
Sustained time below the midline signals a bearish rotational bias.
When the oscillator repeatedly leans against the upper zone with a strong signal line, it indicates firm buyer control; when it leans against the lower zone with a soft or falling signal line, it indicates firm seller control.
When using “Close” as the EP Source, consider increasing the Efficiency Length to above 10 to produce more trend-like behavior.
⚪ Trend Trading
For trend trading, Trend mode is your core setting:
Use Trend mode with a moderate or slightly longer stochastic length.
Watch whether the oscillator lives mostly in the top or bottom half of its range.
Use the dashboard to see if higher timeframes show similar directional signals and OB/OS flags.
Impulse markers and Significant Stochastic Moves can be treated as continuation confirmations when they appear in the direction of the trend. Inefficiency diamonds and fading impulses act as early warnings that the current leg is losing coherence and may transition into consolidation or reversal. Inefficiency diamonds also signal imbalance in the market, where price can move quickly as the structure becomes unstable.
⚪ Pullback Trading
One useful workflow:
Run EP-Stochastic in Trend mode to define the dominant direction and regime.
Overlay a shorter, standard stochastic to spot pullbacks inside that regime.
When the EP-Stochastic clearly favors one side (mostly upper-half behavior in an up move, lower-half in a down move), wait for the short stochastic to cycle into its opposite extreme (oversold in an uptrend, overbought in a downtrend).
Entries during those counter-swings, especially when they coincide with impulse exhaustion in the opposite direction, often give cleaner, better-timed participation in the ongoing trend.
⚪ Overbought/Oversold Trading
Overbought zones represent strong buying pressure. When the stochastic becomes overbought, start watching for signs that buying pressure is fading.
If buying pressure continues, it typically indicates a strong bullish trend.
If the stochastic starts to decline and crosses back under the upper band, it can signal that buying pressure is weakening and a potential reversal is forming.
Oversold zones represent strong selling pressure. When the stochastic becomes oversold, start looking for signs that selling pressure is easing.
If selling pressure persists, it usually indicates a strong bearish trend.
If the stochastic begins to rise and crosses back above the lower band, it can signal that selling pressure is fading and a potential reversal is developing.
⚪ Mean-reversion Trading
Switch to Mean-reversion mode, increase the EP Source Length to 200, and reduce the Stochastic Length to 20 when you’re primarily focused on turning points and range rotation.
Look for clear spikes or peaks in the indicator, short-term bursts that quickly reverse. These moments often signal market conditions with a high likelihood of mean reversion, making a snapback in the opposite direction more likely.
⚪ Divergence Trading
When you want to focus on structural turning points rather than trend following:
Enable divergence detection.
Focus on divergences that form after extended moves or near the outer zones of the oscillator.
Bullish divergences emerging from deep lower regions can confirm early long ideas or justify scaling in as pressure transitions from aggressive selling to rotational buying. Bearish divergences out of extended upper regions can support profit-taking or exploratory short positions. The EP-Stochastic basis helps reduce “false” divergences that arise from random noise.
To get more divergence signals, consider switching to Mean-reversion mode and increasing the Efficiency Length to 20. Keep in mind that some divergences may appear “weird” or different from traditional divergence patterns—this is because they are based on Efficient Price, which uses a completely different detection engine in the background.
⚪ Breakout Trading
For breakout and breakdown scenarios, use:
Significant Stochastic Moves as evidence of a meaningful internal shift,
Impulse markers to confirm that the move is carried by strong momentum,
Inefficiency diamonds to recognize when the structure is becoming unstable.
When price breaks a level and the EP Stochastic prints a Significant Move in the direction of the break, backed by fresh impulses, it signals that the breakout is supported by internal strength.
⚪ Reversal Trading
Enable the reversal signals to identify potential turning points. Use them together with quick peaks in the stochastic oscillator. If the oscillator forms a peak and a reversal signal appears nearby, it strengthens the case for a reversal. However, if a reversal signal prints while the stochastic is simply leaning toward the upper or lower band without forming a clear peak, the signal carries less significance.
⚪ Interpreting Inefficiency Diamonds
Inefficiency diamonds highlight imbalance points in the market. When they appear, they signal that price and order flow are no longer in harmony, creating unstable conditions. These imbalance points often lead to sharp or sudden moves as the market snaps to correct the inefficiency.
Clusters of diamonds indicate a stronger imbalance and a higher likelihood of fast movement or abrupt shifts in direction.
⚪ Overview Panel
Use the multi-timeframe dashboard as a context checklist rather than a mechanical entry system. It quickly answers:
Are lower and higher timeframes pointing in the same direction?
Are multiple frames overbought or oversold at once?
Are impulses and inefficiency regimes showing up in isolation or in clusters?
█ How It Works
⚪ EP Source and Pre-EP Layer
The system begins by selecting an internal driver such as Close, Mean-reversion, or Trend. This source is evaluated through an efficiency model that measures how clean or noisy recent movement has been. Each increment is weighted by its structural quality and volatility conditions, producing a preliminary Efficient Price stream that favors meaningful directional progress over random chop.
Calculation: Applies efficiency weighting, volatility normalization, and adaptive length control. The output is a first-stage EP path that encodes directional reliability.
⚪ Main EP Engine and Adaptive Refinement
The preliminary EP stream is passed through a second refinement stage. This step smooths irregularities, boosts consistent movement, and remains sensitive to shifts in volatility regimes. The result is a fully refined Efficient Price path that forms the input for the EP-Stochastic rather than using raw highs and lows.
Calculation: Uses a second ER pass with volatility moderation and cumulative weighting. The output is the core Efficient Price trajectory used to build the EP-Stochastic.
⚪ EP-Stochastic Construction
Instead of calculating %K from raw price highs and lows, the oscillator is derived from where the refined Efficient Price sits within its own recent EP range. This keeps the stochastic familiar in shape but far more structurally coherent.
Calculation: Determines the EP range over the selected window, computes %K from EP’s position within that range, and applies optional smoothing for the signal line.
⚪ Inefficiency–Trend
This component evaluates the Efficient-Price-driven stochastic through two behavioral lenses: inefficiency and trend. Inefficiency highlights spike-driven, unstable, or imbalanced movement, while the trend component captures underlying slope, persistence, and regime strength. A smooth transition blends these two views depending on the system’s efficiency state.
Calculation: Computes an inefficiency score from ER deviation and a trend score from normalized regression slope. A smoothstep blend transitions between them, and diamond markers appear when the oscillator confirms it is operating inside an inefficiency regime.
⚪ Momentum Impulse
Momentum impulses isolate powerful rotations inside the EP-Stochastic. Only the sharpest acceleration bursts make it through, while routine oscillation is suppressed.
Calculation: Applies chained non-linear transforms to exaggerate extreme deviations, compares them to local historical envelopes, performs a cluster check to avoid false bursts, and marks impulses only when the deviation is structurally significant.
-----------------
Disclaimer
The content provided in my scripts, indicators, ideas, algorithms, and systems is for educational and informational purposes only. It does not constitute financial advice, investment recommendations, or a solicitation to buy or sell any financial instruments. I will not accept liability for any loss or damage, including without limitation any loss of profit, which may arise directly or indirectly from the use of or reliance on such information.
All investments involve risk, and the past performance of a security, industry, sector, market, financial product, trading strategy, backtest, or individual's trading does not guarantee future results or returns. Investors are fully responsible for any investment decisions they make. Such decisions should be based solely on an evaluation of their financial circumstances, investment objectives, risk tolerance, and liquidity needs.

RSI Pro Suite (Zeiierman)█ Overview
RSI Pro Suite (Zeiierman) is a complete RSI ecosystem built on an Efficient Price foundation. Instead of feeding RSI with the standard close, the script first converts price into an adaptive, efficiency-weighted trajectory known as Efficient Price. All major components of the tool, including the Efficient Price RSI, Significant RSI Moves, the divergence engine, the inefficiency layer, the momentum impulse system, and the multi-timeframe dashboard, are built on top of this refined data stream.
The result is an RSI that looks and behaves like a familiar oscillator while reflecting deeper qualities of the market, such as regime stability, volatility behavior, and directional consistency. It supports both discretionary and systematic workflows, whether you rely on classic overbought and oversold readings or more advanced interpretations such as significant internal RSI pressure, inefficiency clusters, divergence structures, and momentum bursts.
⚪ Why This One Is Unique
RSI Pro Suite does not treat RSI as a simple calculation on price. It embeds RSI inside a two-stage Efficient Price framework that reshapes how trend, rotation, and reversal pressure are interpreted. The chosen EP source (Close, Mean-reversion, or Trend) is first processed through an adaptive efficiency model that filters noise and enhances structural meaning. A second refinement pass produces the foundation for the EP-RSI, giving it a cleaner and more context-aware behavior than standard RSI.
Around this core, the script layers several specialized systems. Significant RSI Moves identify internal pressure zones where momentum stretches, revealing shifts that often occur before they appear on price.
█ Main Features
⚪ EP- Based RSI
The core of RSI Pro Suite is an RSI built on a refined Efficient Price rather than raw price, providing a cleaner and more structurally meaningful oscillator. It maintains the classic RSI visual style with 70/30 bands, a 50 midline, and soft gradient fills that express overbought and oversold tension. A smoothing layer allows several moving-average options for the RSI. This creates an intuitive environment for reading trend strength, exhaustion, and mean-reversion with far greater clarity than a standard RSI.
The Efficient Price engine can be driven by three behavioral modes that reshape the character of the RSI, allowing the indicator to adapt to different market conditions and trading styles.
Close
This mode follows price action directly, mirroring the natural rhythm of the market. It is the most general-purpose option and provides a balanced read of both trend and rotation, making it suitable for the majority of market environments.
Mean-reversion
Mean-reversion mode focuses on swing turns and snap-back behavior, emphasizing RSI-based cyclical reversals. It highlights oscillatory structures, swing reactions, and fading opportunities, making it highly effective for traders who target reversal setups or rotational markets.
Trend
The Trend mode uses a trend-smoothed input that emphasizes directional drift and sustained momentum. It provides clearer insight into trend continuation, trend maturity, and structural strength, helping traders stay aligned with broader directional moves.
⚪ Significant RSI Moves
RSI Pro Suite detects when RSI trades within its most important internal zones—areas where price has historically shown elevated reaction potential. The system continuously evaluates the structure of the RSI range and identifies moments when internal pressure becomes meaningful. When these conditions align, the indicator highlights Significant RSI Movements, revealing subtle but powerful structural shifts before they appear on price itself.
⚪ Divergence Detection
The suite includes regular bullish and bearish divergence detection between EP-RSI and price. It identifies clear pivot structures, marks them directly on the RSI pane, and labels each as Bull or Bear. Because divergences are evaluated using the Efficient Price RSI, the signals appear cleaner and less noisy, making them more reliable during both trend reversals and continuation setups.
⚪ Impulse
Momentum impulses appear when the RSI and Price exhibits unusually strong acceleration. Green circles near the upper region indicate sharp upside bursts, while red circles near the lower region reveal powerful downside surges. These impulses highlight moments of expansion, exhaustion, or sudden strength that stand out from typical RSI behavior.
⚪ Inefficiency Diamonds
Whenever the internal logic detects an inefficiency regime, the indicator plots blue diamonds on the mid-level. These diamonds mark structurally imbalanced or spiky conditions that often precede reaction swings, failed pushes, or key turning points in momentum.
⚪ Visual Multi-Timeframe Dashboard
A right-side dashboard provides a compact real-time overview of multiple structural signals across 5M, 15M, 1H, 2H, 4H, and 1D timeframes:
Directional Signals (up or down arrow)
OB/OS flags
Divergence state
Impulse activity
Inefficiency state
Explosive conditions
█ How to Use
⚪ Classic RSI Trading
Interpreting it is similar to a classic RSI but with structurally cleaner input. Sustained movement above the 50 midline reflects a bullish regime in the Efficient Price environment; persistent movement below 50 reflects a bearish regime. When EP-RSI repeatedly leans against the upper band near 70 while its smoothing line rises, it indicates strong upside control; repeated engagement with the lower band near 30 with a falling smoother indicates strong downside control.
⚪ Trend Trading
Use the Trend EP mode to smooth the RSI and track directional movement more clearly. When the RSI holds above the midline during an uptrend or below it during a downtrend, stay aligned with the direction. The multi-timeframe dashboard helps confirm trend strength by showing whether higher-timeframe signals agree with your chart.
Look for impulse markers and clean directional signals as continuation cues, and use inefficiency or weakening impulses as early signs to scale out or tighten stops.
⚪ Pullback Trading
Enable Trend mode and increase the length to 20 or higher. Then enable the Standard RSI and set it to 7. This configuration helps you track broader trends with the EP-RSI while using the shorter-period standard RSI to identify pullback opportunities within that trend.
When the EP-RSI is clearly green or red, indicating an established trend, begin watching the standard RSI for oversold or overbought conditions. These signals often mark clean pullbacks within the larger move. Entering during these moments allows you to participate in the continuation of the trend with improved timing and reduced risk.
⚪ Overbought/Oversold Trading
Treat the 70/30 regions as pressure zones, not automatic reversal signals. Use OB/OS flags on the dashboard to check whether multiple timeframes are stretched in the same direction. When price enters an overextended area, watch for Significant RSI Moves or impulse exhaustion markers to time entries or exits more precisely. This approach helps you avoid fading strong trends and instead focus on moments where reactions or pauses are more likely.
⚪ Mean-reversion Trading
Switch to Mean-reversion mode when focusing on turning points. This mode emphasizes snap-back behavior and makes reversal zones clearer. Combine reversal attempts with divergence signals, Significant RSI Moves, and impulse exhaustion markers. When several of these appear at once, especially across multiple timeframes on the dashboard, you have a stronger reversal setup.
⚪ Divergence Trading
Enable divergence detection when you want to focus on turning points rather than trend following. Bullish divergence occurs when price prints a lower low but the EP-RSI prints a higher low at a labeled pivot; bearish divergence occurs when price prints a higher high but the EP-RSI prints a lower high.
These divergences are most effective when they form near the 30 and 70 regions or after extended runs. A bullish divergence emerging from an oversold region can be used as confirmation to scale into long ideas; a bearish divergence near overbought regions can support profit-taking or contrarian short setups.
⚪ Breakout Trading
In breakout conditions, Significant RSI Moves and impulse markers work together as confirmation tools. When price pushes through a resistance level and the RSI prints a Significant RSI Move at the same time, it shows that internal momentum has shifted decisively in favor of the breakout. If this move is supported by green upper impulse markers, it strengthens the case that buyers are driving the move with conviction rather than the breakout occurring on weak momentum.
During a retest of the breakout zone, these signals become even more valuable. A Significant RSI Move forming at the retest, especially when paired with a fresh impulse burst, often marks strong rejection from the level and signals that the breakout structure is holding. This combination highlights areas where buyers are stepping in aggressively to defend the level.
The same concepts apply in reverse during breakdowns. A Significant RSI Move occurring at support alongside red downside impulses confirms heavy selling pressure and adds confidence to continuation entries. If such signals appear after an extended move, they can also highlight capitulation points that precede sharp reversals.
This makes Significant RSI Moves and impulse markers highly effective for validating breakouts, evaluating retests, and timing continuation or rejection trades with much greater precision.
⚪ Reversal Trading
Use contrarian signals to identify areas that may offer attractive reversal opportunities. These signals highlight moments when the market is stretched and showing signs of exhaustion, which can develop into a broader shift in direction. Combine them with Significant RSI Moves and impulse markers to gauge the strength and credibility of the potential reversal, especially around key levels or after extended trends.
⚪ Interpreting Inefficiency Regime
Watch the diamonds associated with the inefficiency regime as contextual signals. When they cluster following a smooth, steady trend, they often mark zones where the process shifts from “clean trend” to “noisy” or “imbalanced” behavior. Combined with EP-RSI rolling over from an extreme or divergence labels appearing nearby, such clusters can highlight high-value inflection areas.
⚪ Overview Panel
Use the right-hand dashboard as a quick alignment guide rather than a direct signal generator. Each row represents a different structural component of the market, and each column represents a timeframe from 5M to 1D. The Signals row shows immediate directional bias, OB/OS highlights stretched conditions, Divergence marks structural disagreement, Impulse reveals bursts of momentum, Inefficiency identifies unstable movement and Explosive highlights higher-timeframe volatility conditions.
The panel is most useful as a mental checklist. When several timeframes show similar characteristics, such as multiple signals pointing in the same direction or impulses aligning across the lower timeframes, the context for the trade becomes stronger. Mixed readings indicate hesitation or imbalance in the market, helping you avoid forcing trades during unclear conditions.
With coverage across 5M, 15M, 1H, 2H, 4H and 1D, the dashboard gives you an instant sense of whether momentum, pressure and structure are working together or pushing against each other, allowing you to judge at a glance whether the environment favors continuation, rotation or caution.
█ How It Works
⚪ EP Source and Pre-EP Layer
The system begins by selecting a core behavioral driver such as Close, Mean-Reversion, or Trend. This source is transformed into a stability-aware stream that evaluates how consistently the price is moving relative to its own volatility environment. Each movement is weighted by its structural quality rather than raw magnitude, producing a preliminary Efficient Price that reflects directional reliability instead of noise.
Calculation: Applies efficiency-based weighting and volatility normalization to the raw source, accumulating the results into a first-stage Efficient Price that represents structural strength and directional quality.
⚪ Main EP Engine and Adaptive Refinement
This first-stage Efficient Price is processed again through a second refinement pass, smoothing irregularities and further aligning the trajectory with coherent directional flow. The result is a fully refined Efficient Price that responds to meaningful structural shifts while avoiding the instability of raw price oscillation.
Calculation: Uses a second adaptive efficiency pass with volatility moderation, cumulative weighting, and slope extraction. This acts as a two-layer filter, favoring persistent movement while remaining sensitive to regime changes.
⚪ Inefficiency–Trend Blending
This component evaluates the EP-RSI through two behavioral lenses: inefficiency and trend. Inefficiency highlights spike-driven, imbalanced movement, while the trend component captures underlying directional slope and stability. A smooth blending mechanism transitions between these modes depending on where the system sits within efficiency space.
Calculation: Computes an inefficiency score from ER deviation and a trend score from normalized regression slope. A smoothstep transition blends them, and diamond markers appear when the oscillator confirms it is inside an inefficiency regime.
⚪ Momentum Impulse Modeling
Momentum impulses isolate moments when acceleration becomes unusually strong. The system exaggerates extreme RSI deviations while muting ordinary fluctuations, allowing only the sharpest bursts to stand out. A small clustering check eliminates transient noise, marking impulses only when structurally meaningful.
Calculation: Runs RSI through chained non-linear transforms, compares outputs against their own historical envelopes, evaluates local dominance, and emits impulse markers when deviations exceed cluster thresholds.
-----------------
Disclaimer
The content provided in my scripts, indicators, ideas, algorithms, and systems is for educational and informational purposes only. It does not constitute financial advice, investment recommendations, or a solicitation to buy or sell any financial instruments. I will not accept liability for any loss or damage, including without limitation any loss of profit, which may arise directly or indirectly from the use of or reliance on such information.
All investments involve risk, and the past performance of a security, industry, sector, market, financial product, trading strategy, backtest, or individual's trading does not guarantee future results or returns. Investors are fully responsible for any investment decisions they make. Such decisions should be based solely on an evaluation of their financial circumstances, investment objectives, risk tolerance, and liquidity needs.

Kaufman AMA Binary Wave [ChuckBanger]This is Kaufman AMA Binary Wave with buy and sell zones. It’s pretty simple: when the line is over zero = buy zone, below zero = sell, at zero = neutral. You can experiment with the filter and length settings to suit your environment.
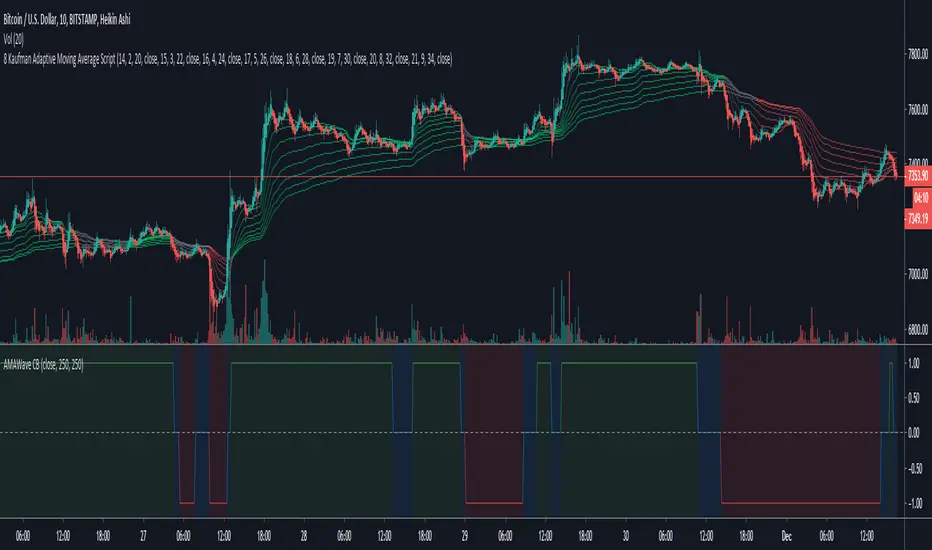
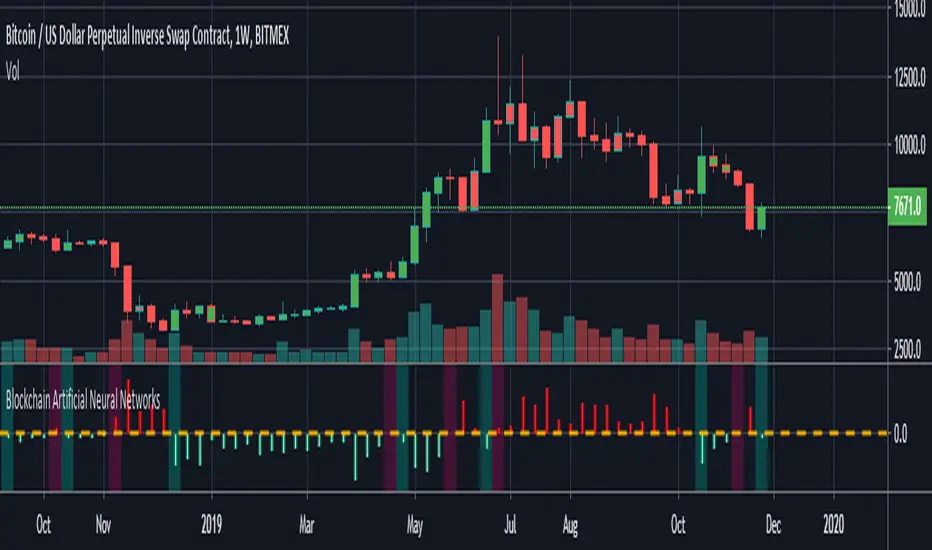
Blockchain Artificial Neural NetworksI found a very high correlation in a research-based Artificial Neural Networks.(ANN)
Trained only on daily bars with blockchain data and Bitcoin closing price.
NOTE: It does not repaint strictly during the weekly time frame. (TF = 1W)
Use only for Bitcoin .
Blockchain data can be repainted in the daily time zone according to the description time.
Alarms are available.
And you can also paint bar colors from the menu by region.
After making reminders, let's share the details of this interesting research:
INPUTS :
1. Average Block Size
2. Api Blockchain Size
3. Miners Revenue
4. Hash Rate
5. Bitcoin Cost Per Transaction
6. Bitcoin USD Exchange Trade Volume
7. Bitcoin Total Number of Transactions
OUTPUTS :
1. One day next price close (Historical)
TRAINING DETAILS :
Learning cycles: 1096436
AutoSave cycles: 100
Grid :
Input columns: 7
Output columns: 1
Excluded columns: 0
Training example rows: 446
Validating example rows: 0
Querying example rows: 0
Excluded example rows: 0
Duplicated example rows: 0
Network :
Input nodes connected: 7
Hidden layer 1 nodes: 5
Hidden layer 2 nodes: 0
Hidden layer 3 nodes: 0
Output nodes: 1
Controls :
Learning rate: 0.1000
Momentum: 0.8000
Target error: 0.0100
Training error: 0.010571
The average training error is really low, almost worth the target.
Without using technical analysis data, we established Artificial Neural Networks with blockchain data.
Interesting!
Alerts on OnePunch Algo StudyIn this study you will be able to get alerts based on the OnePunch Algo Strategy Version 1 and 2.
How To Use:
Open Alerts and Pick Alerts on OnePunch Algo Study option.
For buy alerts, pick Buy Signal option
For sell alerts, pick Sell Signal option
Simple as that. This script will provide buying and selling alerts to your email and mobile app notifications.

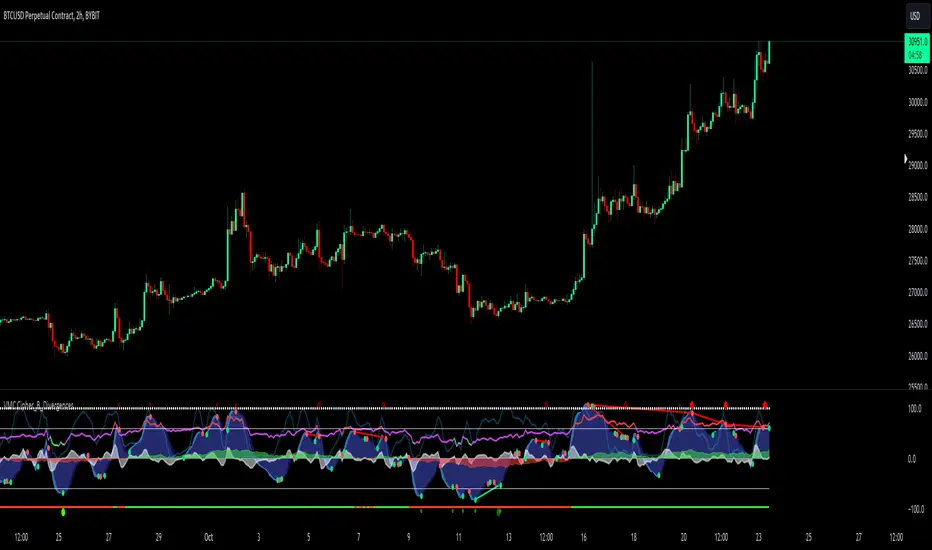
RealTime Wave Divergence SignalsThis indicator comes from the same algo family as our CryptoWave Pro and SmartWave, but focuses on real time divergence detection.
Unlike the divergence detection in CryptoWave Pro (and pretty much all divergence scripts here on TradingView), this one does not have a 2 bar delay.
The pros of this is that you can catch moves much earlier, but also the main con being that at times you will get faked out.
Using proper risk and trade management this can work out to be a great strategy to use for either manual or automated trading.
Signals produced are entries for Longs and Shorts, but can also be used as exits if you wish.

Market Thrust IndicatorThe Market Thrust indicator is a powerful measure of the stock market's internal strength or weakness. There are four components to this indicator:
1-Advancing Issues on the New York Stock Exchange (NYSE) – $ADV
2-Advancing Volume on the NYSE – $UVOL
3-Declining Issues on the NYSE – $DECL
4-Declining Volume on the NYSE – $DVOL
The formula for Market Thrust is given below:
($ADV x $UVOL)-($DECL x $DVOL)
When used for day-trading, the trend of the Market Thrust indicator is what is most important.
Rising Market Thrust Indicator: Considered a bullish sign; can act as a confirmation signal when combined with a rising stock, index ETF, or stock index future's price.
Falling Market Thrust Indicator: Considered a bearish sign; can act as a confirmation signal of a decreasing market price.
The Market Thrust indicator could be used for detecting divergences in trends. Divergences occur when:
- Price is trending higher, but the Market Thrust indicator is not moving higher or is even going down.
- Price is trending lower, however, the Market Thrust technical analysis tool is not trending lower, it is either not trending or is trending higher.
Add a fully configurable trend line over MTI.
Read more at: commodity.com

Leledc Exhaustion Bar V4 PLUSLeledc Exhaustion Bar indicator created by glaz converted to Pine 4, plotshape was added.

ANN Forecast MACD [Noldo] In this script, I tried to convert ANN MACD to MACD Forecast.
It took me quite a while, but it was fun.
After selecting the ticker, select the instrument from the menu and the system will automatically turn on the appropriate Forecast MACD system.
The system is trained with ANN values of ANN MACD 25 in 1.
But because the system is overloaded, only the most popular instruments are left.
The others were unfortunately eliminated.
The only difference is that it was built on the forecast algorithm of my own creation.
The Forecast algorithm is not open-source.
The codes are a nice framework for some of my most valuable systems about ANN . (Working on them. )
But I'm never remove this script.
You can use it forever for free.
As you can see in the presentation, although it is in the same period, it is more accurate and agile than normal MACD.
I think even a bar is important in trade.
For those who don't see that command,listed instruments with alternative tickers and error rates:
WTI : West Texas Intermediate (WTICOUSD , USOIL , CL1! ) Average error : 0.007593
BRENT : Brent Crude Oil ( BCOUSD , UKOIL , BB1! ) Average error : 0.006591
GOLD : XAUUSD , GOLD , GC1! Average error : 0.012767
SP500 : S&P 500 Index ( SPX500USD , SP1! ) Average error : 0.011650
EURUSD : Eurodollar ( EURUSD , 6E1! , FCEU1!) Average error : 0.005500
ETHUSD : Ethereum ( ETHUSD , ETHUSDT ) Average error : 0.009378
BTCUSD : Bitcoin ( BTCUSD , BTCUSDT , XBTUSD , BTC1! ) Average error : 0.01050
GBPUSD : British Pound ( GBPUSD , 6B1! , GBP1!) Average error : 0.009999
USDJPY : US Dollar / Japanese Yen ( USDJPY , FCUY1!) Average error : 0.009198
USDCHF : US Dollar / Swiss Franc ( USDCHF , FCUF1! ) Average error : 0.009999
USDCAD : Us Dollar / Canadian Dollar ( USDCAD ) Average error : 0.012162
SOYBNUSD : Soybean ( SOYBNUSD , ZS1! ) Average error : 0.010000
CORNUSD : Corn ( ZC1! ) Average error : 0.007574
NATGASUSD : Natural Gas ( NATGASUSD , NG1! ) Average error : 0.010000
SUGARUSD : Sugar ( SUGARUSD , SB1! ) Average error : 0.011081
WHEATUSD : Wheat ( WHEATUSD , ZW1! ) Average error : 0.009980
XPTUSD : Platinum ( XPTUSD , PL1! ) Average error : 0.009964
XU030 : Borsa Istanbul 30 Futures ( XU030 , XU030D1! ) Average error : 0.010727
VIX : S & P 500 Volatility Index (VX1! , VIX ) Average error : 0.009999
ES : S&P 500 E-Mini Futures ( ES1! ) Average error : 0.010709
SSE : Shangai Stock Exchange Composite (Index ) ( 000001 ) Average error : 0.011287
XRPUSD : Ripple (XRPUSD , XRPUSDT ) Average error : 0.009803
Extras :
- Crossover and crossunder alerts
- Switchable barcolor
NOTE :
Australian Dollar / US Dollar (AUDUSD ) removed due to high average error. (Average error > 0.013 )
Timeframe advice :
I suggest you to use that system TF >= 1D
My favorite is 1 week bars. (1W)
Info about forecast series :
www.sciencedirect.com
Special thanks :
Special thanks to dear wroclai for his great effort .

Experimental Entry Interface (Buy Arrows with TP & SL)This script provides high probability entry points and includes Take Profit and Stop Loss targets.
It attempts to predict when the market conditions are set to move up, and prints long positions.
In addition to Long Entry Arrows, it will print Take Profit / Stop Loss targets.
This indicator is highly adjustable. Hence the name 'Experimental' in the title. Experiment with it to find the results you want.
Designed for use on the 1H timeframe in Forex, but could possibly be useful elsewhere. Do your own testing.
This indicator can repaint. It is best used with alerts set for once per bar close, so that your alerts do not repaint and your trades are solid.
Not ever signal is a winner. Backtest thoroughly. Adjust accordingly.
Arrows
Four sets of colored arrows are included.
💵 💶 Green and Blue Entry Arrows are formed when the market is in an uptrend, and has a momentary pullback.
💴 💷 Yellow and Purple Entry Arrows are formed when the market is just starting to recover from being severely oversold.
Backtest Mode
Turn on Backtest Mode to easily see if an entry ended up as a winner or loser. A Take Profit and Stop Loss line will be drawn to show results.
Take Profit & Stop Loss Targets
You have two options for this.
Price will show you where your TP/SL exits should be placed. These values will show up under the arrow, based on your Risk/Reward ratio.
Pips are much more simple, and will only show you the market entry point and how many pips up/down to place your SL/TP. Warning: This is fixed at a 1:1 RRR .
Risk/Reward Adjustment
Each entry arrow color allows custom risk/reward ratio adjustment.
Dollar Amounts Displayed
Change your account value and leverage to see how much you would have won on each trade.
How to trade with it?
(Forex, 1H) Open the settings, and turn on all the arrow entries. Turn on Backtest mode to see how past trades would have played out. Turn on TakeProfit/StopLoss Targets to see where to set your targets, for each arrow. Set an alert to notify you once per candle close when there is an Entry. Trade happy!
Bill Williams Alligators are also included, if you want. Not necessary though. Some of the calculations depend on them for trend direction analysis.

RSI with Moving Averages[UO]This RSI indicator is one of my favorite indicators. This powerful indicator is implemented by Phi-Deltalytics. I modified the drawing so that it is easier (at least for me) to see the signals and trends (it would not matter if you're doing algorithmic trading).
Trends and signals. For detailed instructions and tutorial see Phi-Deltalytics page

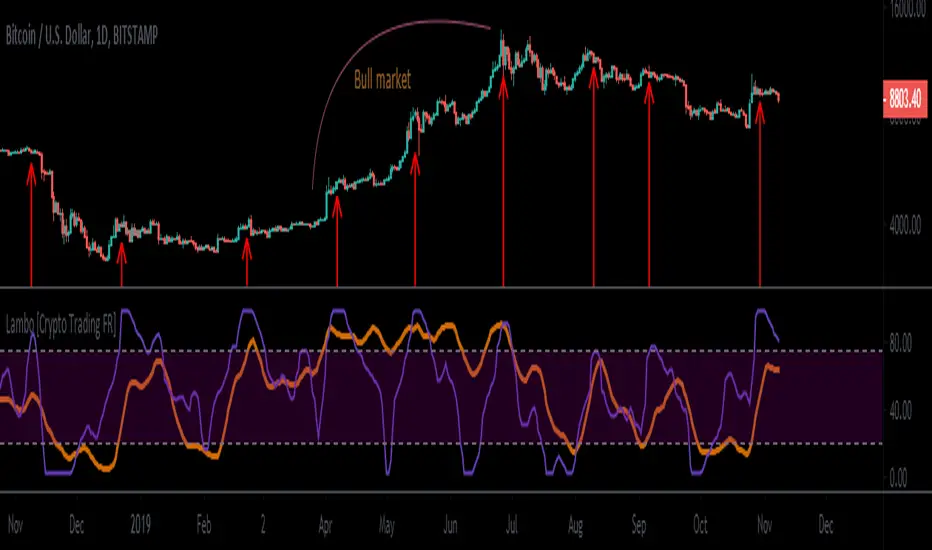
Lambo indicator [Crypto Trading FR]Lambo indicator is probably one of the best indicator you can use to spot the trend and make money.
It is a momentum oscillator contains two signals line :
- The lambo moving average (orange line) for momentum
- The huracan (purple line) perfect in showing market bottoms and tops
The combination of both line give you the perfect timing to buy or sell any assets.
If you look after a way where you can identify market regime shift from low volatility zone to high volatility zone and vice versa, it is certainly the indicator you need!
Lambo indicator works on all timeframe but better use it with higher ones 4H, 8H, 1D, 1W etc.
Let me know if you like it.
Enjoy and make money guys!!!
6Hours swingalgo by BiO-618Hey, I want to share you this algo I remade for a bullish market.
*It uses about 11 indicators, 3 of them made by me to avoid BUYs on the start of a big dump.
*It was added ghost pivots for weekly and monthly values, really useful!
Let me know any suggestion, I will keep working to improve it
Relative Volume RVOL AlertsRelative Volume or RVOL is an indicator used to help determine the amount of volume change over a given period of time.
It is often used to help traders determine how in-play a ticker is.
General rule of thumb is the higher the RVOL, the more in play a stock is.
I myself like to use it as a substitute of the volume indicator itself.
Basic Calculation:
Relative Volume = Current Volume / Average Volume
Crossover Signals:
Any time there is a volume spike which causes a crossover of the user set 'Smoothed Moving Average' or 'Threshold' a green/red dot will appear at the top. The color of the dot is dependent on closing of the candle. Therefore it does not necessarily mean price will continue in that direction since volume spikes often happen in peaks or valleys.
Threshold:
The level at which custom alerts and signal can be set. The higher the value, the more volume required to trigger.
Built in Alerts:
You can set custom alerts for the crossovers of the adjustable threshold, or the average RVOL band.

Stochastic RSI 3in1 & Volatility peaks + ADX by AGUDescription:
3 Lines are Stochastic RSI's, strongest move is when all crosses and moves to one direction (from top or bottom).
Orange is original Stochastic of the timeline. (Live movement of price).
Green is original Stoch x 6. (Short term movement).
Red is original Stoch x27 (Long term price movement).
Transparent columns are ADX signal.
Higher the mountain, stronger the signal. When the mountain tops, trend usually change.
And finally the volatility peaks. Green peak HIGHEST volatility , RED peak LOWEST volatility .
I use it on 1 min BTC chart. But it works on all.
TIPS >> 3HCQ41cRpxcq2MJdRUSYoq9N1RnEy98xD2

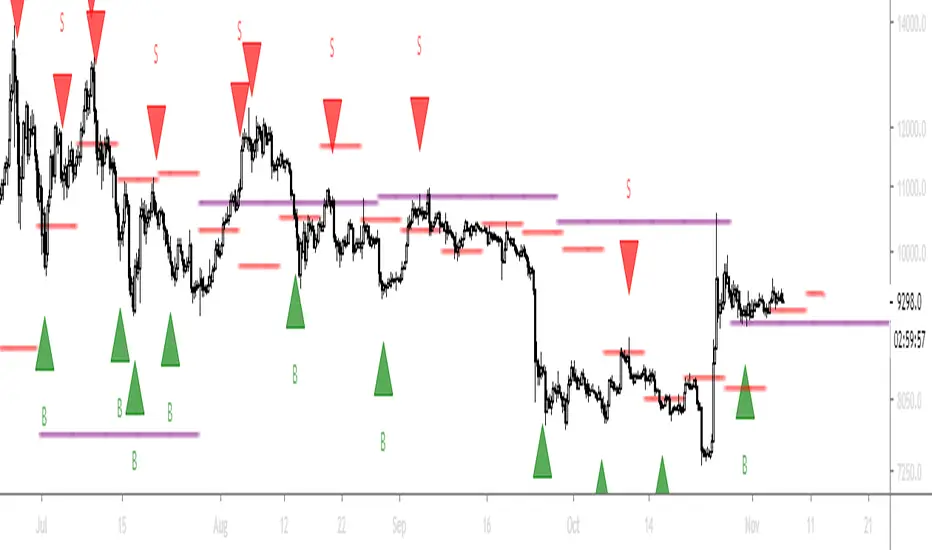
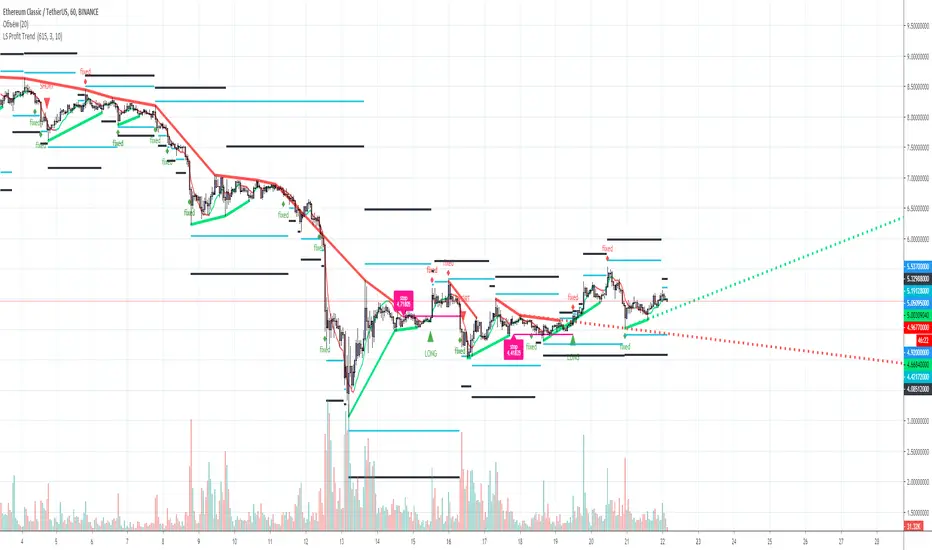
L&S PROFIT SCALP Indicator for scalp trades for TF 1-15 minutes. 1-4 signals per day depending on the currency pair. Suitable for all crypto exchanges, Forex, binary options. Signals+ take profit Levels.

L&S PROFIT TREND Trend indicator for TF from 1 hour and above, for any trading pair, any exchange, binary options. Signals+ Take profit levels. 90% good signal and take profit 1.
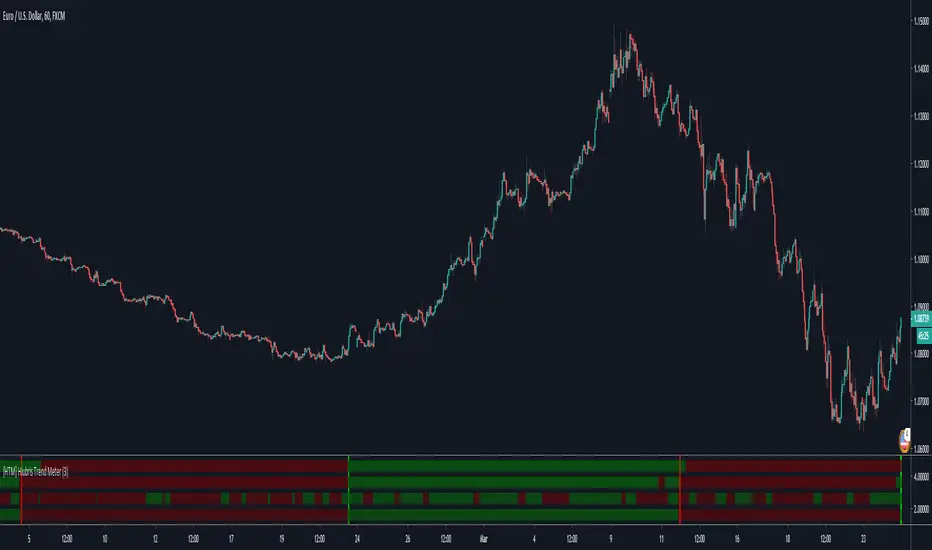
[HTM] Hiubris Trend MeterHOW IT WORKS
This indicator consists of 4 Different Trend Indicators: Gann HILO Activator , Trend Wave Oscillator and 2 Parabolic SAR’s
HOW TO USE
1. When the majority of the meters turn green, it is a sign the market is heading up.
2. When the majority of the meters turn red, it is a sign the market is going down.
- The user has the option to select how many meters must allign for a signal to show
- The indicator also has the ability to setup Alerts when the selected number of meters turn green or red. This feature is also signaled by the red or green vertical lines.
NOTES
This is script is meant to be used as an auxiliary Indicator to confirm your entries, but it is as good on it's own, as you can see in the Backtesting Results
We used the best combination of indicators so you can be sure that, no matter what ticker you're trading (Forex, Stocks or Crypto) - when you get a full green, or full red meter, the price is 100% trending in that direction!
* This indicator does NOT Repaint! None of our published indicators repaint!
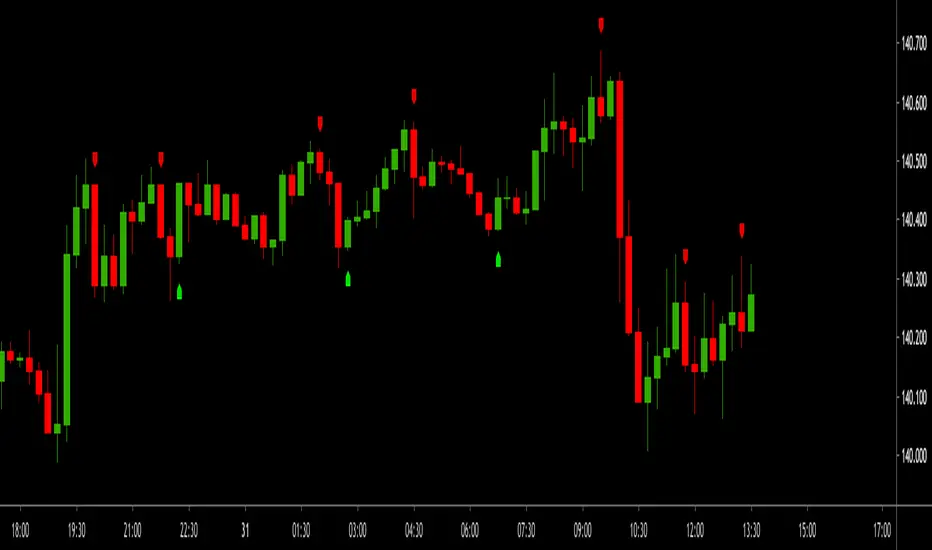
ButterflyPattern_ULTRA V1 - auto lines drawing inclusive alerts
HI BIG PLAYERS AROUND THE WORLD,
this script allow to draw automatically lines of Butterfly pattern. The Butterfly pattern is part of Harmonic Pattern.
Parallel to the automatic drawing, the indicator can give signals as soon as the typically Fibonacci extension immediately reached or has been reached. This allows the indicator ButterflyPattern_ULTRA V1 to give early signals. In the default settings, the signals are displayed with a blue background on the chart.
ButterflyPattern_ULTRA V1 is offered for sale. More information can be found below in the signature.
However, anyone can test this indicator for once without any registration in a 3 day trial. You can request access with a simple message to me.
Another trial of 7 days is included in the offer on my website - before the first payment will done.
In the settings it is possible to change the degree of details. This is sometimes necessary because TradingView limited only 55 lines per indicator in Pinescript Version 4.
In extreme cases it is therefore possible to change the settings that the Butterfly pattern represent waves only with 5 lines. This allows the indicator to detect far more Butterfly pattern on the same chart.
For more great indicators everyone is invited to follow me on TradingView.
Kind regards
NXT2017

10X Trading System10X Trading System (Non Repaint)
TradingView Account Needed: Free
Not satisfied with your trading results so far? This may help:
The 10X Trading System helps you identify tops, bottoms and market direction — quickly and accurately.
The strategy behind its accuracy is the fact that it combines price action and multiple market timing algorithms to determine these significant turning points in the markets.
That way, you can be sure you have the best chance to get the best entry and exit points with perfect timing, and hopefully extract more profits from the markets than anybody else.
Once the 10X Trading system has spotted a possible top or bottom, it clearly displays these Buy or Sell alerts on your charts… showing you exactly where this may occur.
You can activate alerts to never miss a signal.
How to use the signals and alerts:
10X Trading System automatically analyze price action and multiple market timing algorithms to give you a signal when there's a good trade.
Works on all markets on all time frames so it's suitable for binary, scalping, day and swing trading.
10X Trading System allow you to get the best entry and exit points with perfect timing.
If you want more details, the link is in the signature.
Disclaimer:
Past performance is not indicative of future performance. No representation is being made that any results discussed within the service and its related media content will be achieved. All opinions, news, research, analyses, prices or other information is provided as general market commentary and not as investment advice. TradingWalk, their members, shareholders, employees, agents, representatives and resellers do not warrant the completeness, accuracy or timeliness of the information supplied, and they shall not be liable for any loss or damages, consequential or otherwise, which may arise from the use or reliance of the TradingWalk service and its content. © 2019 TradingWalk.
TradingWalk indicators are built for TradingView. TradingWalk is on no way a part of TradingView.
RSI with an Opinion (UO)This RSI has a very clear idea about when to buy and sell. It plots buy and sell signals. It is an expert system. Yes, of course, it can make some errors. You should have used stop-loss
