Pre-ScalperHello all,
It is an artificial intelligence indicator that can generate future predictions based on trend tracking and historical data analysis.
It will be in a period of continuous improvement to achieve the highest success rates.
You can use in all market in all time period.
This indicator does not contain any investment advice, it is only a helpful tool in your investments.
BINANCE:AAVEUSDTPERP
Short!!!!

Daily Scalping Moving AveragesThis is a technical analysis study based on the most fit leading indicators for short timeframes like EMA and SMA.
At the same time we have daily channel made from the last 2 weeks of ATR values, which will give us the daily top and bottom expected values(with 80%+ confidence)
We have 3 groups of lengths for short length, medium length and a bigger length.
At the same time we combine it with the daily vwap values .
In the end we are going to have a total of 7 indicators telling us the direction.
The way we can use it :
The max ratings that we can have are +7 for long and -7 for short
In general once we have at least 5 indicators(fast and medium ones) giving us a direction, there is a high chance that we can scalp that trend and then we can exit either when we will be at +7 or close to neutral point
At the same time is very important to be aware of the current position inside of the TOP/BOTTOM channel that we have.
For example lets assume we are at 40k on BTC and our top channel is around 41-42k while the bottom is around 38k. In this case the margin that we have for long is much smaller than for short, so we should be prepared to exit once we reach the top values and from there wait and see if there is a huge continuation or a reversal. If the top channel was hit and the market started the rebounce going downwards and the moving averages confirms it, then we have a huge advantage using the top points as a STOP LOSS and continue the short movements, giving us an amazing risk/reward ratio .
If you have any questions let me know !

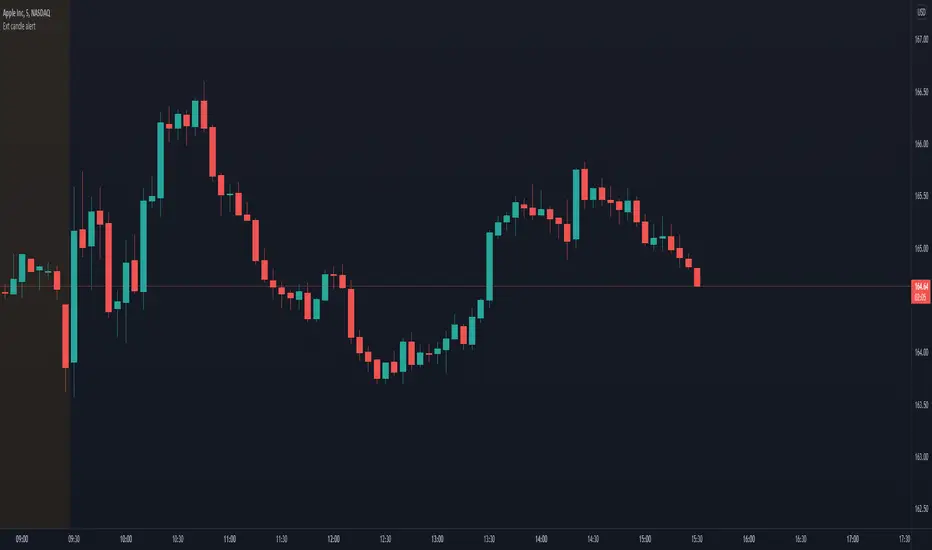
Extended candle alertThis indicator lets you set an alert that triggers when a candle body has got a specific % extension.
Customizable settings
Extension % threshold: the % of the candle extension that has to trigger the alert
Instructions to make it work
Add the indicator to your layout
Set the desidered extension % threshold
Create an alarm (Alt + A)
In the first condition toolbox select "Ext candle alert"
In the second condition toolbox select either long or short condition
Press create (unless you want to change secondary stuff like notification settings)
MoonFlag DailyThis is a useful indicator as it shows potential long and short regions by coloring the AI wavecloud green or red.
There is an option to show a faint white background in regions where the green/red cloud parts are failing as a trade from the start position of each region.
Its a combination of 3 algos I developed, and there is an option to switch to see these individually, although this has lots of info and is a bit confusing.
It does have alerts and there are text boxes in the indicator settings where a comment can be input - this is useful for webhooks bots auto trading.
Most useful in this indicator is that at the end of each green/long or red/short region there is a label that shows the % gain or loss for a trade.
The label at the end of the chart shows the % of winning longs/shorts and the average % gain or loss for all the longs/shorts within the set test period (set in settings)
So, I generally set the chart initially on a 15min timeframe with the indicator timeframe (in settings) set to run on say 30min or 1hour. I then select a long test period (several plus months) and then optimize the wavelcloud length (in settings) to give the best %profit per trade. (Longs always seem to give better results than shorts)
I then, change the chart timeframe to much faster, say 1min or 5min, but leave the indicator timeframe at 1 hour. In this manner - the label only shows a few trades however, the algo is run at every bar close and when this is set to 1min, this means that losses will be minimised at the bot exits quickly. In comparison - if the chart is on a 15min timeframe - it can take this amount before the bot will exit a trade and by then there could be catastrophic losses.
It is quite hard to get a positive result - although with a bit of playing around - just as a background indicator - I find this useful. I generally set-up on say 4charts all with different timeframes and then look for consistency between the long/short signal positions. (Although when I run as a bot I use a fast timeframe)
Please do leave some comments and get in touch.
MoonFlag (Josef Tainsh PhD)

DIX Short Sale VolumeThis indicator combines all the short sale volumes from NASDAQ, NYSE and BATS exchanges and calculates Short Vol % to Total Volume across these 3 exchanges. Use it on Daily Timeframe as shown in the above chart.
For more information on Short Sale Volumes refer to www.finra.org
Usage
When short sale volume data is rising rapidly, it indicates bullishness in the underlying as market makers do not have the shares to sell which results in short sale
When a stock gets dumped by institutions, short sale %age is normally very low and trend is downwards


BTC 1D Safety tradeImportant: use only the BTC/USD pair on the 1D timeframe
The indicator is designed to determine the zones for entry to buy or sell, as well as for closing deals.
The indicator is based on a moving average with a period of 12.
The parameters are not changeable, since the optimal settings (Safety trade) were used for the BTC/USD pair on the 1D timeframe.
The code is open, please change it according to your parameters.
Upper zones for closing long or opening short.
Lower zones for opening long or closing short.

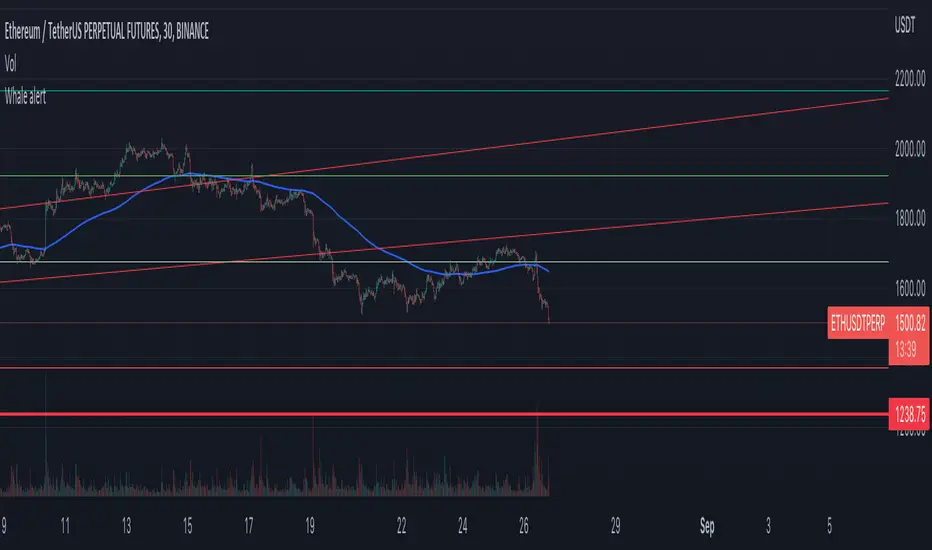
Whale Alert CryptoBase on BTC
Green Tag: Whale buy in/FOMO
Red Tag: Whale build short position (Lighten up)
Purple Tag: just run
NEXT Strategy VisualizerAs suggestive by its name, NEXT Strategy Visualizer enables traders to discover, configure, and plot strategy signals (in the form of arrows) based on any of our NEXT TradingView indicators, as well as other TradingView indicators (built-in and 3rd party). It is intended to be a visual strategy builder, primarily for discretionary trading. Historic and real-time signals are plotted when strategy conditions are met. NEXT add-ons can be used standalone or as part of a broader trading system (e.g. validation or enter / exit signal only). As of this writing, NEXT Strategy Visualizer fully supports our first TradingView add-on, NEXT RSI , a volume-weighed RSI indicator. All future NEXT indicators (and we have many planned) will also be fully compatible and pluggable into Strategy Visualizer. Below is an example of a NEXT RSI (Length 9, P/V Weighing 3) overbought/oversold (contra-trend, momentum) strategy plotted on EURUSD 10-Range chart via NEXT Strategy Visualizer.
Input Parameters
Signal Source: This should be set to whichever NEXT add-on strategy you wish to visualize. In the example above, it is NEXT RSI. Signal Source will also take any other built-in or 3rd party TradingView indicator.
LE Level: When this level is crossed from below, a long entry signal is displayed on the chart. In the EURUSD example above, we used 10. Putting it together: when the NEXT RSI line (as selected in the Signal Source) crosses above 10, an up arrow, representing a long signal, is drawn.
SE Level: when this level is crossed from above, a short entry signal is displayed on the chart. In the EURUSD example above, we used 90. Putting it together: when the NEXT RSI line (as selected in the Signal Source) crosses below 90, a down arrow, representing a short signal, is drawn.
Use LX/SX: Checking this box will enable the next 2 parameters, LX Level and SX Level, intended for long exit and short exit signals.
LX Level: When this level is crossed from above, a long exit signal, in the form of a green "X", is displayed on the chart. For example, if we wanted to exit a long signal when RSI reaches and retraces under 75, we would set this value to 75. This way, an up arrow would be drawn at 10 and an "X" at 75.
SX Level: When this level is crossed from below, a short exit signal, in the form of a red "X", is displayed on the chart. For example, if we wanted to exit a short signal when RSI reaches and retraces over 25, we would set this value to 25. This way, a down arrow would be drawn at 90 and an "X" at 25.
Remember, all Level values are relative to the Signal Source . For example, the NEXT RSI scale runs 0 to 100 so numbers in that range make sense. Setting levels to any other number would cause the Strategy Visualizer to never draw a signal.
Important: In order to effectively use the NEXT Strategy Visualizer you must attach both the indicator you wish to visualize (NEXT RSI in our example) and the NEXT Strategy Visualizer indicator itself.
All strategy ideas and tutorials for individual NEXT indicators will be powered by NEXT Strategy Visualizer and published on our TradingView page under Ideas .

[astropark] Trend Skywalker V2 [alarms]Dear Followers,
today I'm glad to present you Trend Skywalker V2 , the evolution of Trend Skywalker V1 indicator that you can see here below:
This indicator works on every timeframe and market, it's quite responsive to market movements, so it's especially good on volatile markets.
In this new version you have 3 trend clouds available :
a short-term one (yellow)
a mid-term one (green)
a long-term one (blue)
You can also enable an option to show all trend clouds as one, the result will be similar to a special bollinger bands tool.
Of course you can edit trend clouds analysis period and color, also you can turn on or off the cloud that you prefer.
The indicator can run 4 different kinds of strategy : one for each trend cloud individually or a mixed one.
Also the indicator tracks for you a peak profit from entry: this tracker is a suggestion for you to take profits while price goes up!
All red-green circles you see in the chart is a reminder that a peak profit label was there in the past: what does this tell you?
if price starts losing the short-term trend and you had a lot of TP suggestions, maybe trend ended and you should start consider closing your trade before you give back all your profit.
This indicator will let you set alerts on each buy/sell/close/tp label.
For backtesting, you can use the indicator here below:
This is a premium indicator , so send me a private message in order to get access to this script.

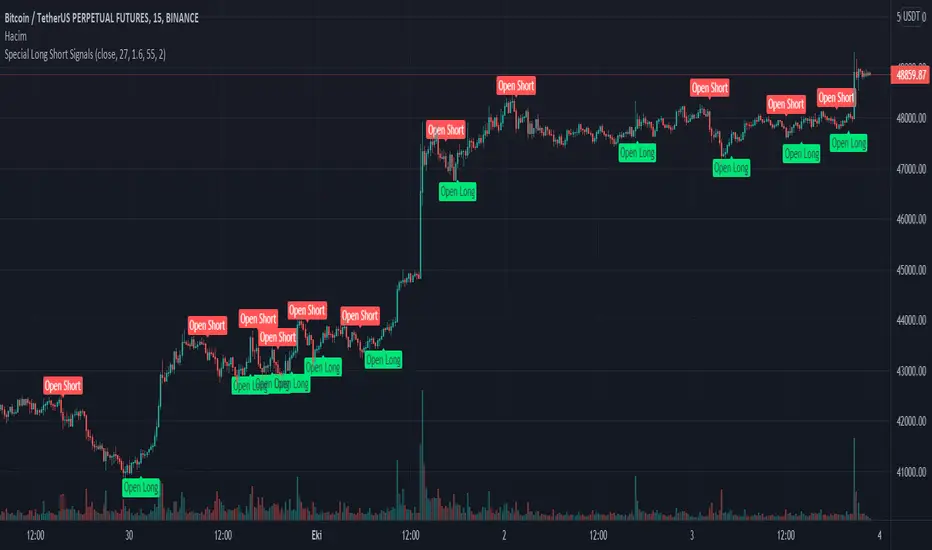
Special Long Short ConditionsIt generates buy and sell signals using a special algorithm when various moving averages approach and diverge from the price. It aims to stay in the trend as long as possible. Please control the risks of your investments well. It is not investment advice.
It calculates using fast, slow period and distance and near distance units. You can adapt it by changing the parameters, but too much optimization is not recommended.
Cesitli hareketli ortalamalarin fiyata yakinlasmasi ve uzaklasmasi durumunda ozel bir algoritma kullanarak al ve sat sinyalleri uretir. Trendde mumkun olabildigince kalabilmeyi amaclar. Lutfen yatirimlarizda risklerini iyi kontrol edin. Yatirim tavsiyesi degildir.
Hizli,yavas periyot ve uzak, yakin uzaklik birimlerini kullanarak hesaplama yapar. Parametreleri degistirerek kendinize uyarlayabilirsiniz fakat cok fazla optimizasyon tavsiye edilemez.
Pivot TrackerThis script finds swing lows and swing highs based on input criteria for lookback and lookforward periods, and plots letters accordingly.
Helps identify trend or lacktherof
HH = higher high
LH = lower high
HL = higher low
LL = lower low

Trend System Oscillator Averages RatingThis is a trend system made with multiple oscillator averages designed especially for trending markets such as stocks or crypto.
It can be used with any timeframe.
Its made of multiple moving oscillators such as
RSI
Stochastic
ADX
CCI
AO
MACD
MOM
STOCH RSI
WPR
BP
UO
Avg of all oscillators
It has also a rating, making an avg from all of the oscillators , going from -100 (all ma's are telling to go short ) to 100 ( all ma are telling to go long).
If you have any questions let me know !

KV Box v1.0 - Buy / Sell signalKV BOX is a trading indicator. It combines Darvas box theory (developed by Nicolas Darvas), breakout strategy, multi-timeframe trading and ALMA (Arnaud Legoux Moving Averages). This indicator helps identify BUY signals when the price is in the entry zone and SELL when the price breaks out of the uptrend.
---
How to use?
KV BOX can be used in both SPOT and FUTURE (Long/Short) trading
BUY (LONG):
• Entry: When the BUY signal appears.
• Stop loss: LOWER than LOW of first and second candlestick IN THE BOX WHERE BUY SIGNAL APPEARS of 1H, 4H, 1D timeframe.
• Take profit: When the SELL signal appears.
SELL (SHORT):
• Entry: When the SELL signal appears.
• Stop loss: HIGHER than the HIGH of first and second candlestick IN THE BOX WHERE SELL SIGNAL APPEARS of 1H, 4H, 1D timeframe.
• Take profit: When a BUY signal appears.
---
Attention:
KV BOX is only displayed on 1H, 4H and 1D timeframe. 1H for short-term trades (a few days), 4H for mid-term trades (a few weeks), 1D for long-term trades (weeks to months).
---
Options setting:
- Kelvin box on: KV BOX activates
- ALMA mode on: KV BOX activation according to Arnaud Legoux Moving Average (ALMA) method
- Pinbar indicator: activate the indicator when the pinbar candlestick appears
- Supertrend: trend continuation or reversal indicator
============================
KV BOX là 1 chỉ báo mua / bán kết hợp giữa nguyên lý hộp Darvas, phương pháp phá vỡ (break out), giao dịch đa khung thời gian và đường trung bình ALMA (Arnaud Legoux Moving Averages). Chỉ báo này giúp xác định tín hiệu mua khi giá ở vùng entry và bán khi giá phá vỡ khỏi trend tăng (up trend).
---
Cách sử dụng:
KV box có thể dùng trong giao dịch SPOT và FUTURE (Long/Short).
Mua khi có tín hiệu BUY, bán khi có tín hiệu SELL.
MUA:
• Entry: Khi có tín hiệu BUY.
• Cắt lỗ: thấp hơn giá thấp nhất cùa 2 nến đầu tiên trong hộp xuất hiện tín hiệu BUY của khung 1H, 4H, 1D.
• Chốt lời: Khi có tín hiệu SELL xuất hiện.
BÁN:
• Entry: Khi có tín hiệu SELL.
• Cắt lỗ: cao hơn giá cao nhất của 2 nến đầu tiên trong hộp xuất hiện tín hiệu SELL cùa khung 1H, 4H, 1D.
• Chốt lời: Khi có tín hiệu BUY xuất hiện.
---
Chú ý:
KV BOX chỉ hiển thị trên khung 1H, 4H và 1D. 1H cho giao dịch ngắn hạn (vài ngày), 4H cho giao dịch trung hạn (vài tuần), 1D cho giao dịch dài hạn (vài tuần đến vài tháng).
---
Tùy chọn setting:
- Kelvin box on: kích hoạt KV BOX
- ALMA method on: kích hoạt KV box theo phương pháp Arnaud Legoux Moving Averages (ALMA)
- Pinbar indicator: kích hoạt chỉ báo khi xuất hiện nến pinbar đảo chiều
- Supertrend: chỉ báo xu hướng tiếp diễn hoặc đảo chiều

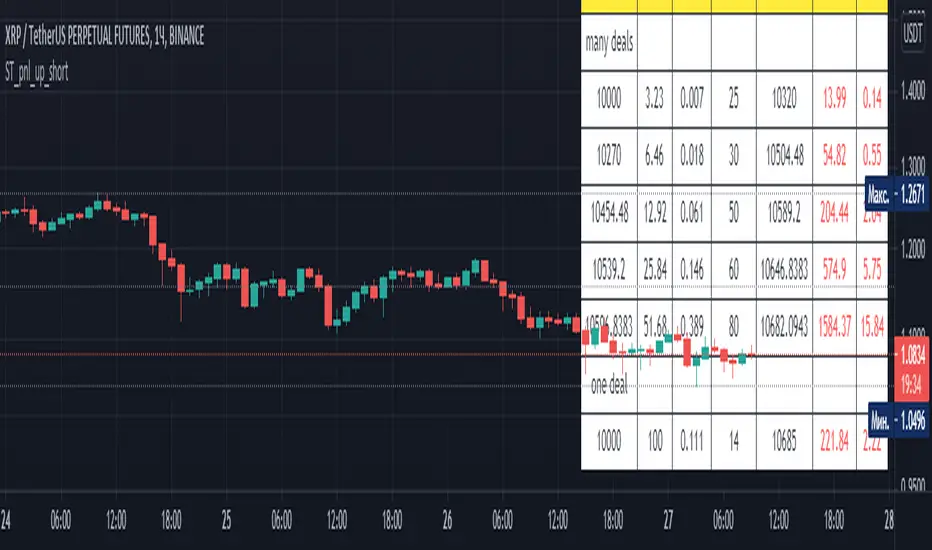
Alferow_pnl_up_shortThis script allows you to determine the leverage required to enter one position based on the set entry price, the price of the expected take profit, stop loss and risk per transaction. It also allows you to schedule this transaction for 5 possible transactions, with different shoulders and a martingale coefficient for each subsequent gain at the same risk, allowing you to qualitatively improve the pnl of the transaction with price fluctuations after entering the transaction. The script is designed for short positions.
Percentage Oscillator SwingThe percentage price oscillator (PPO) is a technical momentum indicator.
It shows the relationship between the close of a candle and the highest/lowest point with a specific lenght in percentage terms.
Rules
The higher percentage on the values upwards, compared to those downwards, the higher the power of the bull trend.
The higher percentage on the values downwards, compared to those upwards, the higher the power of the bear trend.

Boom Hunter ProBoom Hunter Pro is the ultimate indicator for targeting perfect long entries and epic shorts. Boom Hunter comes with a super fast oscillator that uses Ehlers Early Onset Trend (EOT). This is the Center Of Gravity Oscillator (COG) with a super smoothing filter and a roofing filter. This indicator is tuned for 1 hour charts but can be used on any time frame.
Colored bars can be turned on to assist in finding an entry. Purple signifies a drag and potential dump.
Fibonacci lines can be turned on to track price action and find entries/exit.
This indicator follows the same rules as COG. For more information please see my COG HOWTO here:

xGhozt Consecutive Candle CountxGhozt Candle Count simply counts consecutive positive or negative candles, and allows you to get the live statistics of how many times this consecutive candle series occurred in the past, with the probabilities of the next candle to be a reversal, and the average past gains from that reversal. You can select the number of consecutive candles you're tracking, and select a start and end date. When your desired pattern is met by the indicator, it will indicate you on the chart if it's worth shorting or longing the next candle.

[astropark] Moon Phases [alarms]Dear Followers,
today I'm glad to present you an indicator which calculates Moon Phases and let's you set an alert over it.
This is a public free indicator based on the public one by @paaax:
I added my usual alert system logic, plus some more customization inputs for easy coloring.
The lower the timeframe you use it and set your alerts on, the more precise the alert value you get.
Here below the script for backtesting it:
Enjoy!
-- astropark

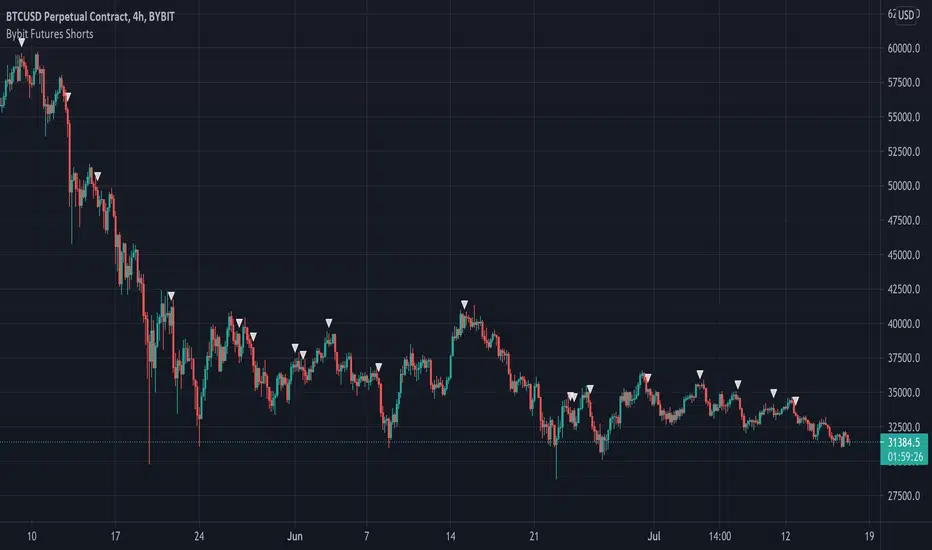
Bybit Futures ShortsThe whales love to short! This indicator emulates a strategy used by institutions to find short entries. It is designed for use on the Bybit exchange 4hr futures contracts but can be used on any timeframe on any Bybit contract. This is a great way to short with the whales. Please note this only works with Bybit.
Below is an example on 4hr chart:
Below is an example on 1hr chart:
Below is an example on Daily chart:
Good Luck!
nonoiraq indicator it's very strong i edit this indicator to connect it with my bot to auto trading and he take the info from the volume, so when he is give me a single the bot take just 0.50% to 1% for 3 - 5 trade in day and this perfect, if u use a manual trading this indicator can reach to from 10% to 80% in some point .
the indicator have 3 line
(Red , Purple, Yellow)
1- The yellow line it's high sensitivity this mean it's when rich to the -3 or 3 you can open the order when the bar is close and the signal be sure
and u need to watch the your order because in some case he is reach to 0.30% to 2% and the price reflected to loss and when you wait the price reflected to but my advice you take profit and close the order directly.
2- The purple circles it's medium sensitivity this mean when the purple hit the 2.5 or 3 from down or up in indicator with yellow line you open the order when bar close and the signal is be sure , like example in the photo
3- The red circles it's low sensitivity and this one when reach to 3.0 with any line (yellow or purple) you open directly short or long , like the example in the photo
i am sorry for my english it's not very good
please support me to share other idea or script

Target Price for KuCoin FuturesWhen trading on KuCoin, it can be difficult to determine what you're exit price should be.
This script solves this issue by giving you an exit price based on a given entry price, a base margin, and a target profit %.
USE CASES:
No Entry Price:
If you have no position in KuCoin, then this use case could be more helpful. With no entry price inputted, two lines will be drawn above and below the current closing price.
The blue line represents your exit price for if you were to enter into a long at the current close.
The orange line represents your exit price if you were to enter into a short at the current close.
With Entry Price:
If you're already in a position in KuCoin, then this case might be more helpful.
The green line represents your exit price for a long from your entry price
The red line represents your exit price for a short from your entry price
The yellow line represents your entry price itself.

Tolueno StrategyTolueno Strategy is a help tool for the average trader of tradingview. This tool facilitates the interpretation of entries either long or short.
The use of magic trend has been implemented, in addition to different types of ema and fully configurable signals.
Soon the use of more sophisticated support and resist will be added to be used for inputs and outputs. RR will be improved too.
The tool has alerts
The tool has a dashboard that shows current signal (LONG / SHORT), shows a recommended take profit (not mandatory), recommended stop loss (not mandatory) and the profit that the current operation is achieving, all this to help the trader and his emotions do not harm him.
The tool is constantly updated and will be gradually improved over time with feedback from tradingview users.
Any questions ask in the comment box or by pm.
This indicator is not for sale, it is not a commercial publication.
