Buy / Sell Signals With Take Profits (Non-Repaint)This indicator generates automatic BUY/SELL flip signals based on trend direction, volatility status, and ATR dynamics.
Labels are placed based on actual High/Low and do not shift.
Features
✔ Dynamic ATR Multipliers
✔ Volatility Stretch (calm market → narrow, aggressive → wide)
✔ Trend Memory (25-bar direction memory)
✔ Automatic TP1–TP5 (%1 – %5) calculation
✔ Desktop & Mobile compatible TP Panel
✔ Bull/Bear Flip labels
✔ TradingView alert support
Suitable Markets
Forex, Crypto, Stocks, Indices, Gold, Oil
Works on all timeframes (5min – 1min – 4min – Daily).
⚠ Important Note
This tool is not investment advice.
It does not provide any buy–sell recommendations.
All trading decisions are yours; risk management is entirely the user's responsibility.
Sellsetup

Engineer_Invest Target SellEngineer_Invest Target Sell is a Simple and Affordable Tool for Exiting a Deal
Engineer_Invest Target Sell is an indicator that helps you quickly determine the best levels for profit taking. It is designed in such a way that it is easy for even a beginner to understand when it is worth selling an asset.
The way it works:
1. Two levels for sale:
The indicator calculates two key points (or lines) on the chart where it is beneficial to lock in profits. This helps you see where you can reduce your risk and lock in revenue.
2. Three modes for different market moods:
Depending on the market volatility, the setup is divided into three modes:
Target Sell 3 (High Volatility): for fast market movements.
Target Sell 2 (Average Volatility): for balanced conditions.
Target Sell 1 (Low Volatility): for quiet trading sessions.
This separation allows the indicator to be adapted to any market conditions.
Simple settings:
You can choose the type of moving average (SMA or EMA) and adjust the transparency and color of the labels so that the information on the chart is as clear and easy to understand as possible.
Ease of use:
Visibility:
The indicator draws lines and marks directly on the chart, which allows you to immediately see the key levels for exiting a trade.
Adaptability:
Three modes allow you to adjust to the current market conditions — from rapid dynamics to a calm trend.
Easy to use:
Minimal settings and intuitive visualization allow you to quickly learn how to use the tool and make informed decisions.

TrendLine CrossThis indicator "TrendLine Cross", is designed to plot trend lines so you can spot potential trend reversal points on the charts. The main function is to draw several lines on the chart and identify the crossings between these lines, which can be significant indicators for trading. The lines are based on different periods which can be changed in the settings tabs.
Let's see the characteristics of the trend lines:
_Low Line Color(Green Line): This line connects the lowest point of low prices in the "low_time" period with the lowest point of low prices in the "high_time" period. Indicates a possible short-term support level on the chart.
_Liquidity Up Line Color (Golden Line): This line connects the lowest point of low prices in the "low_time" period with the highest point of low prices in the same period. It represents a liquidity zone and an important resistance in the chart.
_Lower Line Color (Blue Line): This horizontal line connects the lowest point of low prices in the "LowerLine_period" with the lowest point of low prices in the "high_time" period. Indicates a possible long-term support level.
_Upper Line Colorr: This line represents a connection between the highest points of the "high_time" period and the lowest point of the "LowerLine_period". Indicates a possible long-term resistance level.
_Up Line Color (Red Line): This line connects the highest point of high prices in the "high_time" period with the highest point of high prices in the "LowerLine_period". It represents a possible long-term resistance level.
_Liquidity Down Line Color(Golden Line): This line connects the highest point of high prices in the "high_time" period with the highest point of low prices in the "low_time" period. It represents a liquidity point and an important support zone.
The indicator becomes particularly interesting when the lines make crossings. These crossovers could suggest a potential trend change in the market. For example:
Change from Bearish to Bullish: If the "long-term" line (black) crosses the "short- or long-term" line (green or blue) from top to bottom, it could indicate a shift from a bearish to a bullish market , suggesting the opportunity for long positions.
_Changing from Bullish to Bearish: If the "long-term" line (blue) crosses the "short-term" line (red or black) from bottom to top, it could indicate a shift from a bullish to a bearish market, suggesting the opportunity for short positions.
Generally speaking, crossings between these lines can be key points of interest for traders, as they can signal significant changes in price direction.

TriexDev - SuperBuySellTrend (PLUS+)Minimal but powerful.
Have been using this for myself, so thought it would be nice to share publicly. Of course no script is correct 100% of the time, but this is one of if not the best in my basic tools. (This is the expanded/PLUS version)
Github Link for latest/most detailed + tidier documentation
Base Indicator - Script Link
TriexDev - SuperBuySellTrend (SBST+) TradingView Trend Indicator
---
SBST Plus+
Using the "plus" version is optional, if you only want the buy/sell signals - use the "base" version.
## What are vector candles?
Vector Candles (inspired to add from TradersReality/MT4) are candles that are colour coded to indicate higher volumes, and likely flip points / direction changes, or confirmations.
These are based off of PVSRA (Price, Volume, Support, Resistance Analysis).
You can also override the currency that this runs off of, including multiple ones - however adding more may slow things down.
PVSRA - From MT4 source:
Situation "Climax"
Bars with volume >= 200% of the average volume of the 10 previous chart TFs, and bars
where the product of candle spread x candle volume is >= the highest for the 10 previous
chart time TFs.
Default Colours: Bull bars are green and bear bars are red.
Situation "Volume Rising Above Average"
Bars with volume >= 150% of the average volume of the 10 previous chart TFs.
Default Colours: Bull bars are blue and bear are blue-violet.
A blue or purple bar can mean the chart has reached a top or bottom.
High volume bars during a movement can indicate a big movement is coming - or a top/bottom if bulls/bears are unable to break that point - or the volume direction has flipped.
This can also just be a healthy short term movement in the opposite direction - but at times sets obvious trend shifts.
## Volume Tracking
You can shift-click any candle to get the volume of that candle (in the pair token/stock), if you click and drag - you will see the volume for that range.
## Bollinger Bands
Bollinger Bands can be enabled in the settings via the toggle.
Bollinger Bands are designed to discover opportunities that give investors a higher probability of properly identifying when an asset is oversold (bottom lines) or overbought (top lines).
>There are three lines that compose Bollinger Bands: A simple moving average (middle band) and an upper and lower band.
>The upper and lower bands are typically 2 standard deviations +/- from a 20-day simple moving average, but they can be modified.
---
Base Indicator
## What is ATR?
The average true range (ATR) is a technical analysis indicator, which measures market volatility by decomposing the entire range of an asset price for that period.
The true range indicator is taken as the greatest of the following:
- current high - the current low;
- the absolute value of the current high - the previous close;
- and the absolute value of the current low - the previous close.
The ATR is then a moving average, generally using 10/14 days, of the true ranges.
## What does this indicator do?
Uses the ATR and multipliers to help you predict price volatility, ranges and trend direction.
> The buy and sell signals are generated when the indicator starts
plotting either on top of the closing price or below the closing price. A buy signal is generated when the ‘Supertrend’ closes above the price and a sell signal is generated when it closes below the closing price.
> It also suggests that the trend is shifting from descending mode to ascending mode. Contrary to this, when a ‘Supertrend’ closes above the price, it generates a sell signal as the colour of the indicator changes into red.
> A ‘Supertrend’ indicator can be used on equities, futures or forex, or even crypto markets and also on daily, weekly and hourly charts as well, but generally, it will be less effective in a sideways-moving market.
Thanks to KivancOzbilgic who made the original SuperTrend Indicator this was based off
---
## Usage Notes
Two indicators will appear, the default ATR multipliers are already set for what I believe to be perfect for this particular (double indicator) strategy.
If you want to break it yourself (I couldn't find anything that tested more accurately myself), you can do so in the settings once you have added the indicator.
Basic rundown:
- A single Buy/Sell indicator in the dim colour; may be setting a direction change, or just healthy movement.
- When the brighter Buy/Sell indicator appears; it often means that a change in direction (uptrend or downtrend) is confirmed.
---
You can see here, there was a (brighter) green indicator which flipped down then up into a (brighter) red sell indicator which set the downtrend. At the end it looks like it may be starting to break the downtrend - as the price is hitting the trend line. (Would watch for whether it holds above or drops below at that point)
Another example, showing how sometimes it can still be correct but take some time to play out - with some arrow indicators.
Typically I would also look at oscillators, RSI and other things to confirm - but here it held above the trend lines nicely, so it appeared to be rather obvious.
It's worth paying attention to the trend lines and where the candles are sitting.
Once you understand/get a feel for the basics of how it works - it can become a very useful tool in your trading arsenal.
Also works for traditional markets & commodities etc in the same way / using the same ATR multipliers, however of course crypto generally has bigger moves.
---
You can use this and other indicators to confirm likeliness of a direction change prior to the brighter/confirmation one appearing - but just going by the 2nd(brighter) indicators, I have found it to be surprisingly accurate.
Tends to work well on virtually all timeframes, but personally prefer to use it on 5min,15min,1hr, 4hr, daily, weekly. Will still work for shorter/other timeframes, but may be more accurate on mid ones.
---
This will likely be updated as I go / find useful additions that don't convolute things. The base indicator may be updated with some limited / toggle-able features in future also.

Trend IdentifierTrend Identifier for 1D BTC.USD
It smoothens a closely following moving average into a polynomial like plot.
And assumes 4 stage cycles based on the first and second derivatives.
Green: Bull / Exponential Rise
Yellow: Distribution
Red: Bear / Exponential Drop
Blue: Accumulation
Red --> Blue --> Green: indicates the start of a bull market
Green --> Yellow --> Red: indicates the start of a bear market
Green --> Yellow: Start of a distribution phase, take profits
Red --> Blue: Start of a accumulation phase, DCA

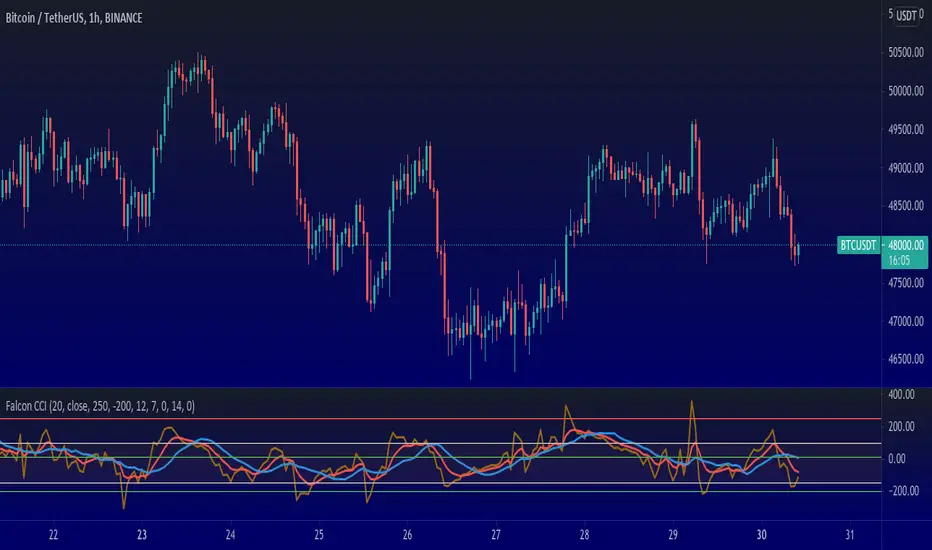
Falcon Commodity Channel IndexFalcon CCI indicator is a superb indicator for anyone who wants to dig deep and still float. The trading lifestyle requires you to be one step ahead of everyone else, while doing so, you want to manage risk, enter at correct positions and perhaps exit at correct positions too.
Exiting at correct positions is so over rated, people tend to forget that exit is as important as entry and therefore we need to make sure that we use a good indicator setup that helps us to do that.
Falcon CCI Indicator is a receipe developed by me during recent Bitcoin slump, where we really needed something more to help us get pass through ups and downs, sudden movements and volatility in the market.
This indicator is perfect even for the swing and trend traders, intra day and day traders who want a quick win, rather than invest for long term.
Here are entry and exit plans based on this indicator:-
Setup: I keep CCI at 20, MA at 14 and EMA at 7 but I change it depending on the stock or crypto. Truth is, you can play with it and find what is best for your trading setups, but once you are done, it really works.
Buy: Buy when CCI crosses above MA or EMA , but CCI should be below 50
Sell: Sell when CCI crosses below MA or EMA (You need to choose), CCI should be above 150
There can be other entry and exit based on just CCI values, and therefore I have added some max and min inputs too in the indicator, e.g. Buy when CCI is -180 and sell when CCI is 300.
Trading is a long process.
To all my friends who have lost in futures , or anywhere else in the market, don't worry, just follow the process and follow your own rules. Don't break them.
You can connect with me on Trading View, message me to discuss this further. Happy to take your questions.
P.S you can also add linear regression to this to give you certain price points, for market tops or bottoms within the time frame.
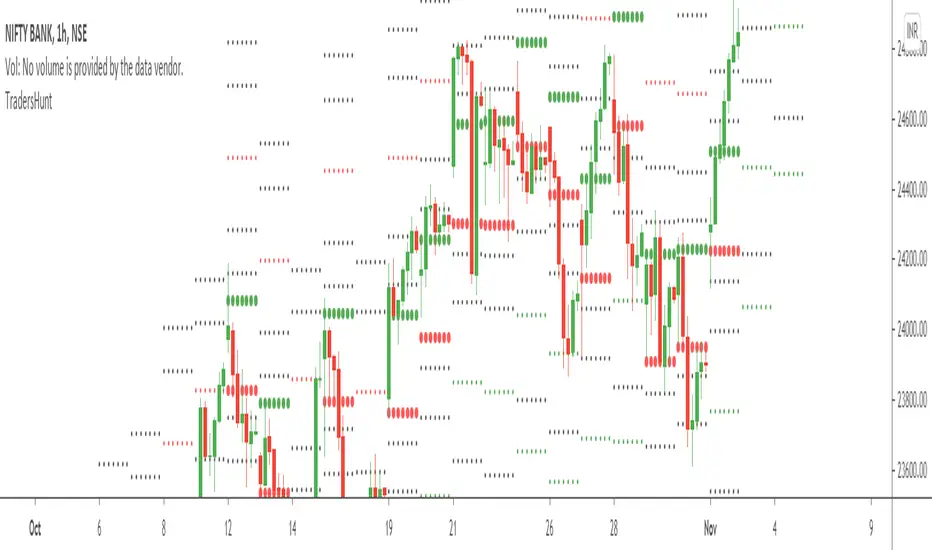
TradersHunt Buy & Sell Levels IndicatorThis indicator will plot dot lines that represent the support and resistance points or a key price where favourable action may take place.
This indicator is based on the concept of Fibonacci ratios. The dotted line represents different Fibonacci ratios of the script. The calculation for the ratios is arrived by considering a range based on the volatility of the script.
You may think it's another Pivot Point or Camarilla type level indicator, no, it is not, it is different.
It follows the Fibonacci ratio which makes it unique amongst all the available indicators.
How to Trade:
It can be used by traders to identify possible areas of support and resistance, which can then be used to determine optimal positions for stop-loss or profit target orders.
Green Level indicates buy price, a trader should wait for 15min candle to close above it and Red level can be used as SL if the trader is taking a long position. The Black colored levels above Green are Targets for taken Long Position. Similarly, a red-colored level indicates Sell value, and levels below it are targets for a short position.
It's not just the breakout indicator, but also a reversal indicator. which means if you are a safe trader you can wait for the breakout above the green line or breakdown below the red line.
However, if you are familiar with little technical analysis then you can treat the red dotted line as the buy zone and the green dotted zone as the sell zone based on the trend of the script.
You can keep trailing you Stop Loss once script moves into your direction. First step to do is to make our SL Cost to Cost and when it moves above TGT2, we can trail SL to TGT1 and so on. So, Keep your money management in check.
Fibonacci are earlier market turning points. Hence, they are natural choices for projecting support and resistance levels. Every fibo ratio is a potential support or resistance level. However, for effective trading, focus on major ratios which are highlighted with bold dotted lines.
Ttaner_RSI ExinMerhaba arkadaşlar yapmış olduğum indikatör RSI alım ve satış bölgelerini gösterip işlem açmanızda yardımcı olacaktır.
Rsı yüksek bölgede kırmızı satış gelebilir ifade etmektedir.
Düşük bölgede ise yeşil güvenli alı ifade etmektedir.
Kullanacak arkadaşlara bol kazançlar diliyorum.
Destek olmak ve yeni indikatörler için takip edebilirsiniz.
Hello friends, the indicator I have made will help you to show the RSI buying and selling regions and open a transaction.
Rsi indicates that red sales may come in the high region.
In the low region, green means safe buying.
I wish good luck to the friends to use.
You can support and follow up for new indicators.

Ace Pro Short Indicator - 1 Minute BTCUSD Bitcoin Chart The Ace Pro Short calculates overbought and oversold conditions.
It focuses on momentum to identify whether the market is overbought or oversold.
If it detects that the market is overbought, it gives an alert of “Short Entry”
If it detects that the market is oversold, it gives an alert of “Close Short”
Users are also able to set notifications on Tradingview with this version of the indicator.
To set an alert, after adding the indicator, at the top left of the chart where the indicator is listed, click on the "more" option (three dots), and then select "Add alert."
Please note the following:
The Ace Pro Short indicator is designed only for use on the 1 minute Bitstamp BTCUSD chart.
It is only to be used for opening and closing short positions.
It is not recommended for use with long positions.
It is not recommended for use with time frames other than the 1 minute.
In a sideways market, or during a violent move, it is likely to produce false signals.
Traders must use confluence from their technical analysis to enter trades.
Because this is an invite only script, users with a free Tradingview account will not be able to obtain access.
Traders must use confluence from their technical analysis to enter trades.

GR-Moving Average CrossA simple indicator that contains all the main Moving Averages you'll probably need.
This indicator can be used on any time frame you wish.
The default periods for the moving averages are 5, 10, 20, 50, 100 & 200.
However you can set these values to whatever works for you, for example 5, 8, 10, 21, etc.
Please let me know in the comments below which values you use the most, so that I can adjust the defaults accordingly.
The lines get darker and thinker the more periods the MA covers.
You can easily adjust the colours of the lines and their thickness too.
The current colours seem to work OK on both the light and dark TradingView themes, but please do make suggestions for better default value.
You can also choose between 7 different ways of calculating the moving averages:
!None = You don't want to see this line
SMA ( Simple Moving Average )
EMA ( Exponential Moving Average )
WMA ( Weighted Moving Average )
DEMA ( Double Exponential Moving Average )
TEMA (Triple Moving Average
HMA ( Hull Moving Average )
This indicator can also show basic buy & sell zones.
They work well after steep trends, but will give lots of poor signals in a sideways moving market.
I find that the sell signal is more reliable than the buy signal.
Use these indications with caution and definitely combine them with other data/indicators as they are only based on the moving averages.
Comments and suggestions are most welcome.
I'm available for hire to create custom indicators or to work on more complex projects.

Patrones de entrada/salida V.1.0 -BETA-Este algoritmo intenta identificar patrones o fractales dentro de los movimientos de precios para dar señales de compra o venta de activos.
