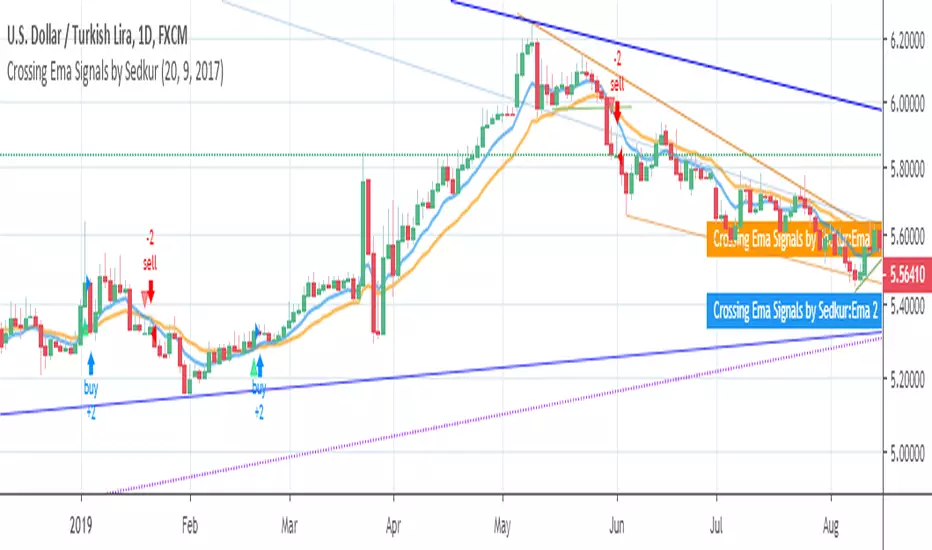
Crossing Ema Signals by SedkurGives an signals when 2 Ema's cross. You can - change EMA values - change the signal start yearStrategi Pine Script®oleh sedatkurbanDiupdate 33408
Cryptosnipper2019Update version of cryptosnipper 2 by bitexchangersIndikator Pine Script®oleh fidubit99932
Setup 9.1 by Larry Williams Setup 9.1 by Larry Williams. The indicator will give text signal and change the color of the signal candle, being based exclusively on the setup 9.1 ----------//--------------- PT-BR Setup 9.1 do Larry Williams. O indicador irá dar sinal de texto e alterar a cor do candle de sinal, se baseando exclusivamente no setup 9.1Indikator Pine Script®oleh Coringa33706
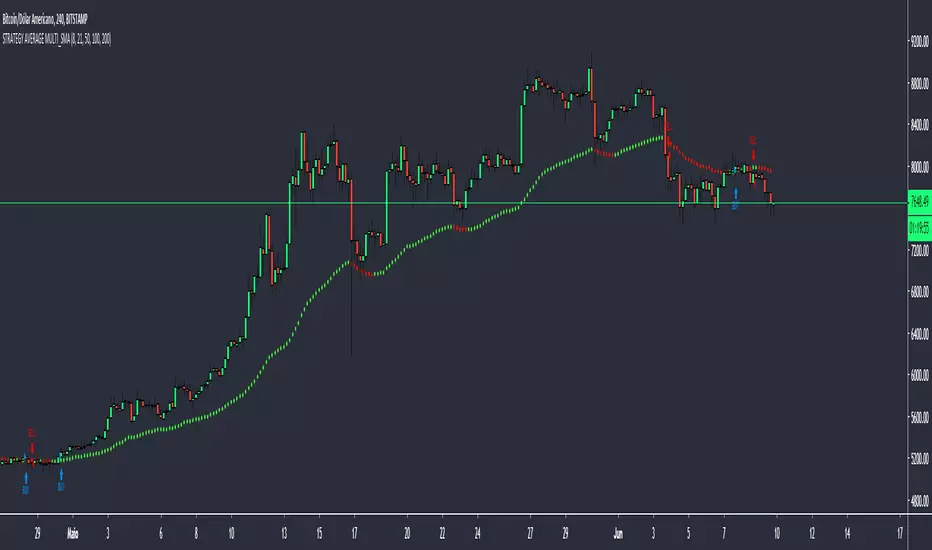
STRATEGY AVERAGE MULTI_SMAThis strategy is based on my script "AVERAGE MULTI_SMA" The strategy is based on the created media, giving BUY signal when the price closes above the average and the average is rising. For the SELL signal the price closes below the average with the average falling. For those who are interested in how the "AVERAGE MULTI_SMA" script works, I ask you to analyze it there, because I explain how it works. Please do not use the indicator as the only factor to do your operations, try to use more as a study. ____PTBR_____ Essa estrategia é baseada no meu script "AVERAGE MULTI_SMA" A estrategia é baseada na media criada, para o sinal de compra(BUY) o preço fecha acima da média e a média está subindo. Para o sinal de venda(SELL) o preço fecha abaixo da média e a média caindo. Para quem se interessar em saber como funciona o script "AVERAGE MULTI_SMA", peço que analise ele lá, pois explico como funciona. Peço que não use o indicador como único fator para fazer suas operações, tente usar mais como um estudo.Strategi Pine Script®oleh Coringa11260
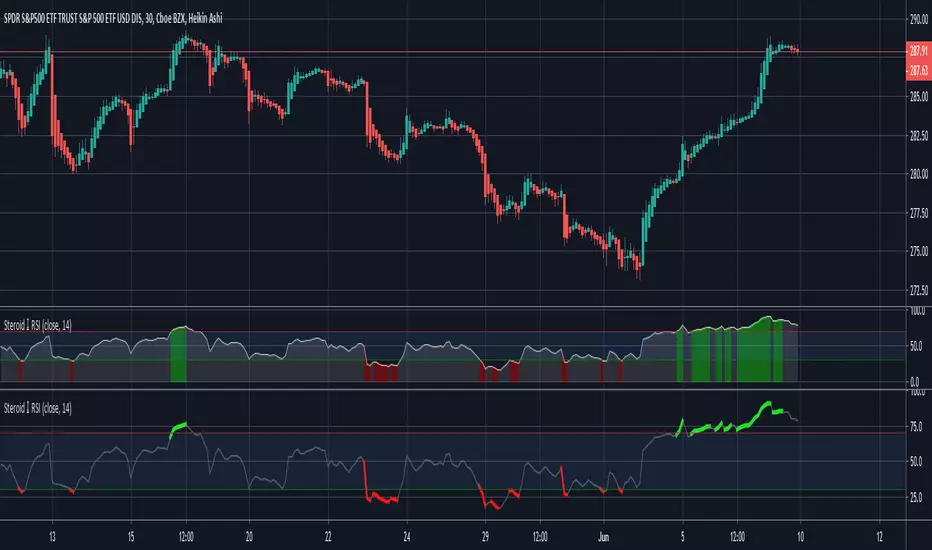
Steroid RSI w/ Overbought & Oversold Alert/@version=2 //By Tantamount //RSI with overbought and oversold alert features! Highly configurable indicator that includes a Topography map feature, used to detect & easily show threshold crossovers. //RSI is used to measure the velocity and change of directional price movements. It is very useful to help determine when an asset is reaching an overbought or oversold condition. //This RSI tool comes loaded with features and is easily configurable back to standard RSI or configure with your own preferences. Customize to your liking: Topo map view or standard with highlighted crossover color. If you like this tool and would like to DONATE/TIP: Stellar XLM address: GA5XIGA5C7QTPTWXQHY6MCJRMTRZDOSHR6EFIBNDQTCQHG262N4GGKTM Bitcoin BTC address: 3QwPUnZvAKBXBMU7WMckNgDyfv6PApYduA Indikator Pine Script®oleh tantamount44667
Multi-TF Avg BBandsMULTI-TF AVERAGE BBANDS - with signals (BETA) Overall, it shows where the price has support and resistance, when it's breaking through, and when its relatively low/high based on the magic of standard deviation. created by gamazama. send me a shout if u find this useful, or if you create something cool with it. %BB: The price's position in the boilinger band is converted to a range from 0-1. The midpoint is at 0.5 Description of parameters "BB:Window Length" is the standard BB size of 20 candles. The indicator plots up to 7 different %BB's on different timescales They are calculated independently of the timescale you are viewing eg 12h, 3d, 30m will be the same output You can enter 7 timescales, eg. if you want to plot a range of bbands of the 12h up to 3d graphs, enter values between 0.5 and 3 (days) - you can also select 0 to disable and use less timescales, or select hours or minutes Take note if you eg. double the main multiplier to 40, it is the same as doubling all your timescales You can turn the transparency of the 7 x %BB's to 100 to hide them, their average is plotted as a thick cyan line "Variance" is a measure of how much the 7 BB's agree, and changes colour based on the thresholds used for the strategy ---- TO START FROM SCRATCH ---- - set all except one to ZERO (0), set to 0, and everything after to 0. Turn ON and right click -> move the indicator to a new pane - this will show you the internal workings of the indicator. Then there is a few standard settings "Source Smoothing Amount" applies a basic small sma on the price. It should be turned down when viewing candles with less information, like 1D or more. Standard BBands use an SMA, there one uses a blend between VWMA or SMA Volume Weight settings, the same as SMA at 0, and the same as VWMA at 1 BB^2 is a bband drawn around the average %BB. Adjust the to change its window length The BB^2 changes color when price moves up or down Now its time to look at the parameters which affect the buy/sell signals turn on "show signal range" - you see some red lines buy and sell each have 4 settings min/max variance will affect the brigtness of the signal range range adjust will move the range up/down mix BB^2 blends between a straight line (0) and BB^2's top or bottom (1) a threshold of "variance" and "h/l points" is available to generate weaker signals. these thresholds can be increased to show more weak signals ONCE YOU ARE HAPPY WITH THE SIGNALS being generated, you can turn OFF , and move it back to the price pane the indicator then draws a bband around the price to maps some info into the chart: fills a colour between 0.5 & the mid BB^2 and converts relative to the price chart draws a line in the middle of the midband. controls how much these lines diverge from the price - adjust it to reduce noise converts the signal range (red lines) to be relative to the price chart if you like, you can adjust the sell & buy signals in the tab from and to and to match the picture. It messes with auto-scaling when moving back to though enjoy, I hope that is easy enough to understand, still trying to make this more user-friendly. If you want to send me some token of appreciation - btc: 33c2oiCW8Fnsy41Y8z2jAPzY8trnqr5cFu I promise it will put a fat smile on my face Indikator Pine Script®oleh gamazama44714
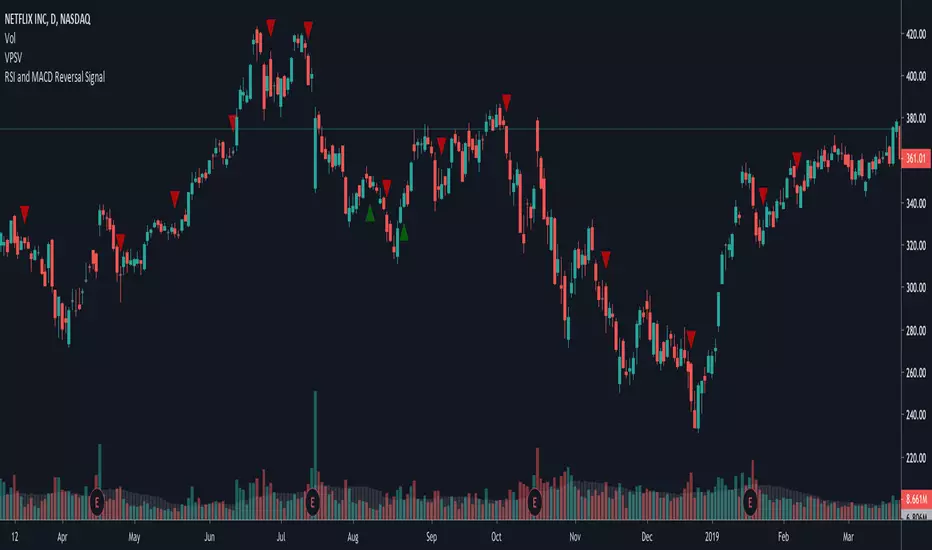
~RMCF~ RSI and MACD Reversal SignalFor AkibaDeep. Checks if RSI < 30 recently and if MACD diverges, placing a buy signal. Then, places a sell signal when MACD converges back.Indikator Pine Script®oleh reaganmcfDiupdate 11245
Sell / Buy RatesThis script finds sell / buy rates and adds its linear regression to the chart. its aim is finding buying and selling power, then you can try to find trend reversals. Also you can find divergences, it's very important signal for trend reversal. Linear regression is a basic and commonly used type of predictive analysis. if you choose lower periods then it will be more sensitive. I choose 34 as it's one of fibonnaci number. If you find my works useful, please consider a donation BTC: 16XRqyS3Vgh1knAU1tCcruqhUrVm4QWWmR Indikator Pine Script®oleh LonesomeTheBlueDiupdate 3838 8.1 K
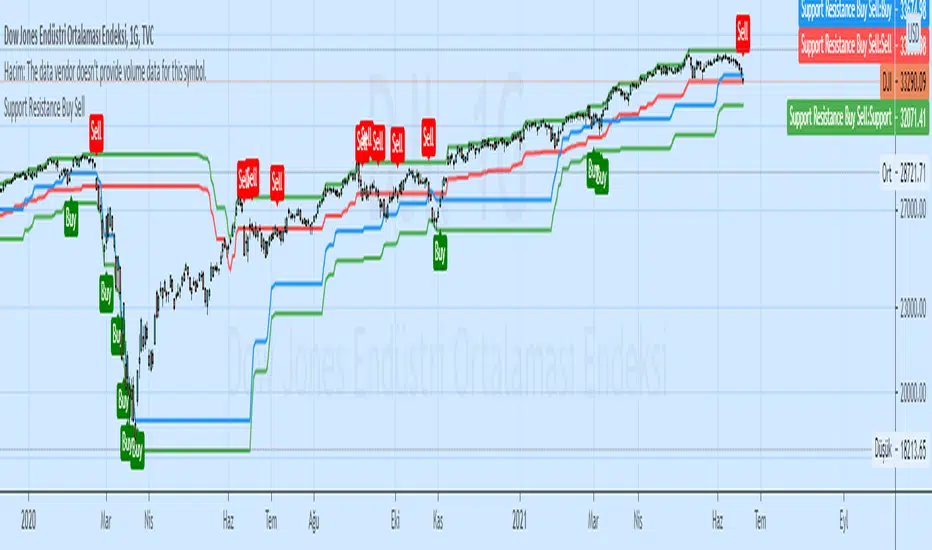
Support Resistance Buy SellSupport Resistance Buy SellIndikator Pine Script®oleh ceyhunDiupdate 88933
Steroid CCI w/ Overbought & Oversold Alert//@version=2 //By Tantamount //Channel Commodity Index (CCI) with overbought and oversold alert features! Highly configurable indicator that includes a Topography map feature, used to detect & show minute threshold crosses. //CCI is a momentum based technical trading tool used to help determine when an asset is reaching an overbought or oversold condition and is an great alternative to RSI. //This CCI tool comes loaded with features and is easily configurable back to standard CCI or with your own preferences. Customize to your liking: Simple alert signals The full enchilada, with Topo map view! Stand alone CCI oscillator Indikator Pine Script®oleh tantamountDiupdate 33813
Renko Strategy Open_CloseSimple Renko strategy, very profitable. Thanks to vacalo69 for the idea. Rules when the strategy opens order at market as follows: - Buy when previous brick (-1) was bearish and previous brick (-2) was bearish too and actual brick close is bullish - Sell when previous brick (-1) was bullish and previous brick (-2) was bullish too and actual brick close is bearish Rules when the strategy send stop order are the same but this time a stop buy or stop sell is placed (better overall results). Note that strategy open an order only after that condition is met, at the beginning of next candle, so the actual close is not the actual price. Only input is the brick size multiplier for stop loss and take profit: SL and TP are placed at (brick size)x(multiplier) Or put it very high if you want startegy to close order on opposite signal. Adjust brick size considering: - Strategy works well if there are three or more consecutive bricks of same "color" - Expected Profit - Drawdown - Time on trade This strategy uses Renko charts with TRADITIONAL bricks, so no repaint. Study with alerts, MT4 expert advisor and jforex automatic strategy are available at request. Please use comment section for any feedback. Strategi Pine Script®oleh 03.freemanDiupdate 3939 1.9 K
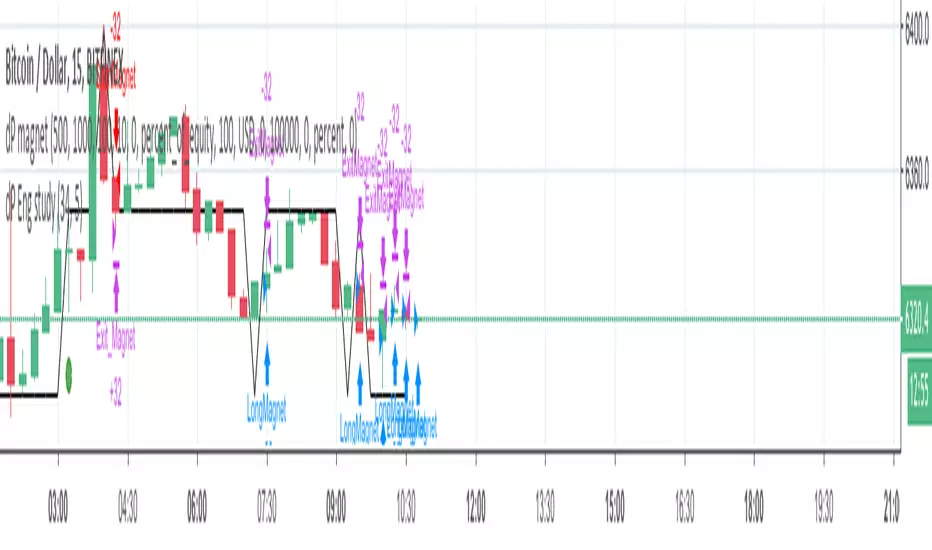
dP magnet//Strategy based on the idea that stop loss and take profit are often placed at full price levels or round numbers, whcih acts as resistance and supports levels //Buy Rules: //Actual price (close) is above round number. //Round number level was not touched in previous ten bars (arbitrary value). //Place a buy and follow the order with a trail step because price can bounce at round number (support) or can go through it. //Sell Rules are the same of buy rules but inverted. // //Need improvement on conditions' logic and round numbers definitionsStrategi Pine Script®oleh 03.freeman33144
HA.MACD.MA.TradeSetupsHi probably trade setups indicator intended to be used with Heikin Ashi candles. It uses fibo EMAs and MACD to signal longs/shorts. Intended for scalping high cap coin with high volume on lower time frames.Indikator Pine Script®oleh emkill2005Diupdate 11170
Bullish/Bearish Candelstick patternHey! This time I took the pattern recognizer from a previous script I worked. It overlays the Arrows on the chart. Legend: #Maroon colour: Strong bearish signal #Red colour: Bearish signal #Dark Green colour: Strong bullish signal #Lime: Bullish signal NOTE: Also, you can untick the patterns you don't find useful, but I kept every pattern to get a complete script. I unticked: Morning Star Evening Star Shooting Star Bullish Harami (too bearish on corrective phase) Hanging Man Red Cloud Cover Indikator Pine Script®oleh BiO-618Diupdate 44377
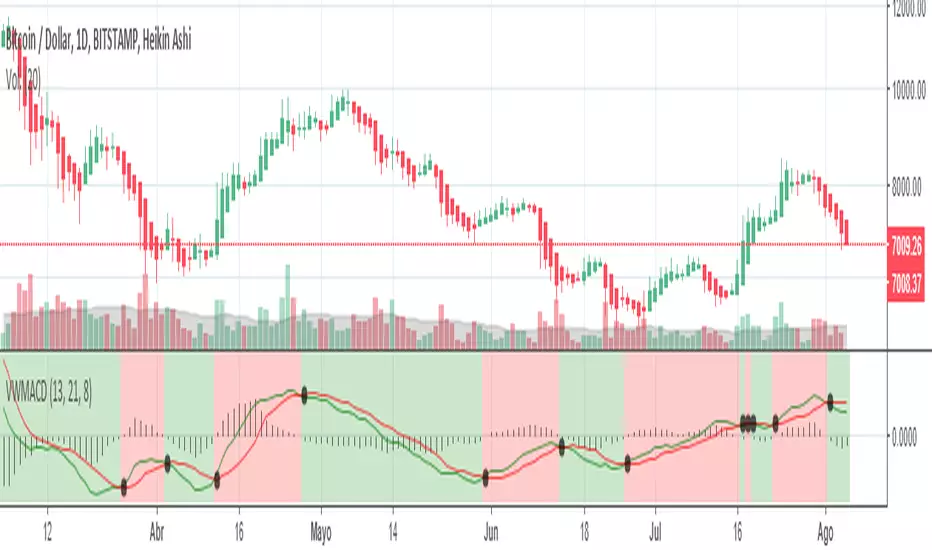
Volume Weighted MACD + x-SignalingThis is a script I remade from 2 previous TDuser's scripts. Thanks community for sharing, I hope you find it useful. φ!Indikator Pine Script®oleh BiO-61811637
CryptogramTR with OPEN CODEIndicator is obtained by importing RSI(14) into HULL moving average source with 2 different periods, as one is long period and the other is short. When green line (short period) cross upward the red line (long period) , this is a BUY; vice versa it is a SELL. When HMA Short Period is set to 1 (one), yielding line is absolutely the same line of RSI (14). You can change it into 8(eight) preferably. İndikatör, RSI(14) indikatörünün, hull hareketli ortalamasının kod kaynağı olarak atanması ile elde edilmiştir. Uzun ve kısa olmak üzere 2 ayrı periyot kullanılmıştır. Yeşil çizgi yani kısa periyotlu çizgi, kırmızı yani uzun periyotlu olanı yukarı keserse AL, tersi durum SAT olarak düşünülmelidir. Hull Kısa Periyodu 1 iken oluşan yeşil çizgi, RSI(14) indikatörünü vermektedir. Kısa periyot olarak tercihinize göre bu değeri 8 olarak da kullanabilirsiniz.Indikator Pine Script®oleh lordofcodes171
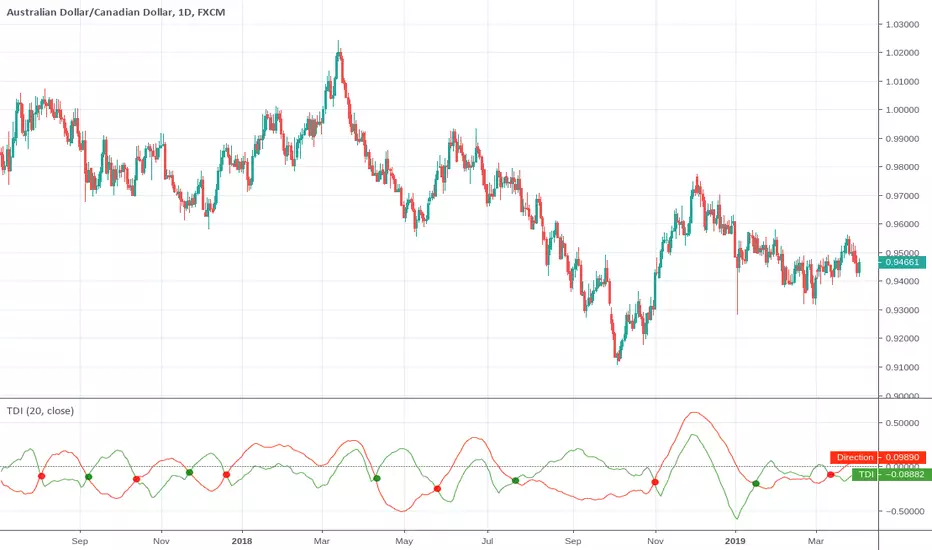
Trend Detection IndexTrend Detection Index indicator script. This indicator was originally developed by M.H. Pee (Stocks & Commodities V. 19:10 (54-61): Trend Detection Index).Indikator Pine Script®oleh evergetDiupdate 11568
Vdub FX SniperVX3 / sdudy alertsthis is the same as the strategy but with alerts Indikator Pine Script®oleh jakester2122146
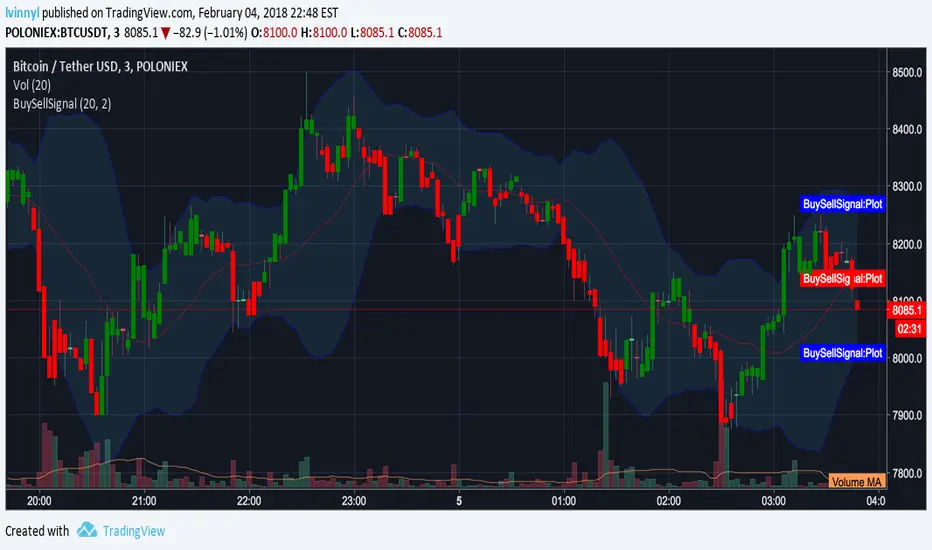
GreenRedSignal with Alerts by lvinnyl// Script created by JoinFree // Modified by lvinnyl to trigger alerts // Click on image below for original script... Indikator Pine Script®oleh prosum_solutions55949
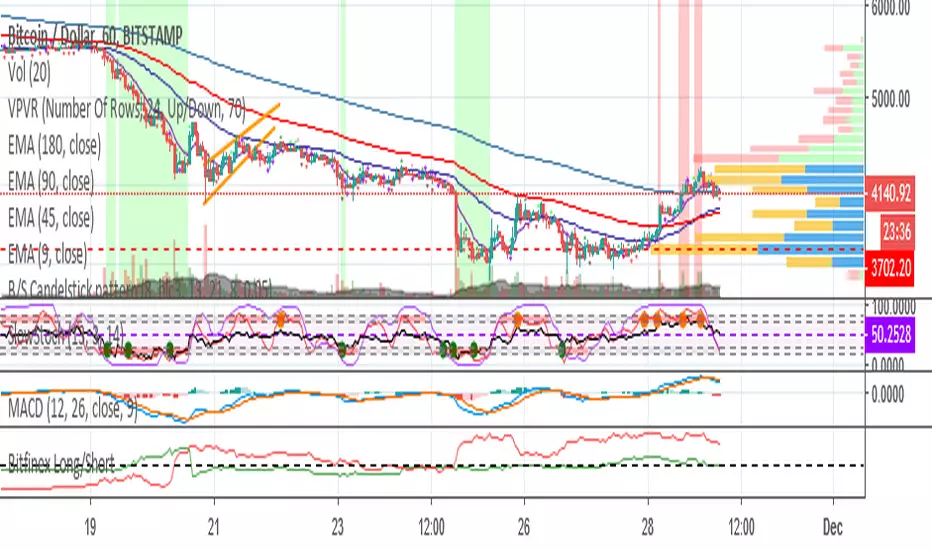
BTC Buy Sell Guide (BSG) - MA & RSIhi BTChes, green is when the price drops below the 100 day MA red is the intensity of the 14 day RSI BUY @ green SELL @ the second or third RSI spike most importantly, keep in mind fundamentals :) -joie Indikator Pine Script®oleh joiepDiupdate 44229
Patrones de entrada/salida V.1.0 -BETA-Este algoritmo intenta identificar patrones o fractales dentro de los movimientos de precios para dar señales de compra o venta de activos.Indikator Pine Script®oleh aponce33152
Operación con Pivotes V.1.0 -BETA-Permite identificar puntos pivote diario, semanal y mensual e implementa la estrategia de Day of Reversal con RSI para identificar puntos de inflexión (compra o venta) en los instrumentos.Indikator Pine Script®oleh aponce11129
Multiple Moving AveragesPlotting Multiple Moving Averages in one indicatorIndikator Pine Script®oleh Mahesh-LeoDiupdate 1212 1.7 K