Cycle Channel Oscillator [LazyBear]Here's an oscillator derived from my previous script, Cycle Channel Clone ().
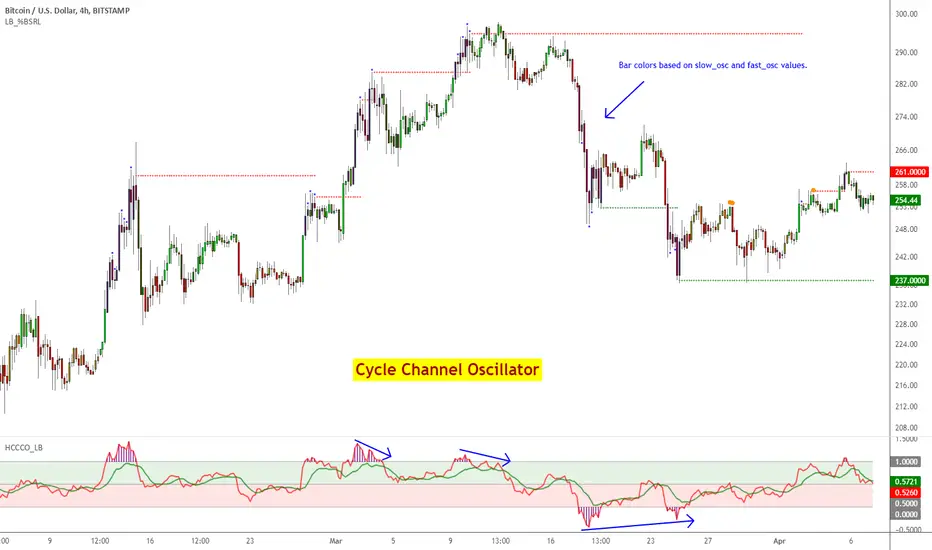
There are 2 oscillator plots - fast & slow. Fast plot shows the price location with in the medium term channel, while slow plot shows the location of short term midline of cycle channel with respect to medium term channel.
Usage of this is similar to %b oscillator. The slow plot can be considered as the signal line.
Bar colors can be enabled via options page. When short plot is above 1.0 or below 0, they are marked purple (both histo and the bar color) to highlight the extreme condition.
This makes use of the default 10/30 values of Cycle Channel, but may need tuning for your instrument.
More info:
List of my free indicators: bit.ly
List of my app-store indicators: blog.tradingview.com (More info: bit.ly)
Cari skrip untuk "金十数据4月9日讯,美国总统特朗普签署煤炭相关(金十数据APP)"
Hurst Cycle Channel Clone [LazyBear]Cycle Channel is loosely based on Hurst's nested channels. Basic idea is to identify and highlight the shorter cycles, in the context of higher degree cycles.
This indicator plots the shorter term (red) & medium term (green) cycles as channels. Some things to note:
As you can see the red channel keeps moving with in the bounds of green channel. When green breaches red channel, it usually signifies extreme market condition.
Both red & green channels provide support/resistance levels. Also, the green channel provides S/R levels to the inner red channel.
Movement of red channel with reference to green highlights reversal points, reducing momentum et al. For ex., point "(x)" in the chart shows how red channel failed to reach the upper green channel line and highlighted the local top.
Use this just like other bands/channels. I have more indicators derived from this idea, will post them later.
Some more examples:
---------------------------------
MSFT 1M:
DXY 1M:
IWM 1M:
More info:
------------
cyclicwave.blogspot.com
List of my free indicators: bit.ly
List of my app-store indicators: blog.tradingview.com
(Support doc: bit.ly)

Insync Index [LazyBear]BB Support + Histo mode
-------------------------------
Code: pastebin.com
Show enclosing BB
Show Insync as Histo:
v02 - Configurable levels
---------------------------------
Small update to allow configuring the 95/75/25/5 levels.
Latest source code: pastebin.com
v01 - orginal description
---------------------------------
Insync Index, by Norm North, is a consensus indicator. It uses RSI, MACD, MFI, DPO, ROC, Stoch, CCI and %B to calculate a composite signal. Basically, this index shows that when a majority of underlying indicators is in sync, a turning point is near.
There are couple of ways to use this indicator.
- Buy when crossing up 5, sell when crossing down 95.
- Market is typically bullish when index is above 50, bearish when below 50. This can be a great confirmation signal for price action + trend lines.
Also, since this is typical oscillator, look for divergences between price and index.
Levels 75/25 are early warning levels. Note that, index > 75 (and less than 95) should be considered very bullish and index below 25 (but above 5) as very bearish. Levels 95/5 are equivalent to traditional OB/OS levels.
The various values of the underlying components can be tuned via options page. I have also provided an option to color bars based on the index value.
More info: The Insync Index by Norm North, TASC Jan 1995
drive.google.com
List of my free indicators: bit.ly
List of my app-store indicators: blog.tradingview.com
(Support doc: bit.ly)
