Cari skrip untuk "足球日本vs中国"

Open Interest:CME e-o-d vs CFTC e-o-wCFTC only publishes total OI on fridays, related to last Tuesday.
But what happened since last Tuesday?
CME Vol & Open Interest data is recorded&exported daily by quandl.com to tradingview
via the che CHRIS/CME datasets
www.quandl.com
Eg. Nat Gas next outstanding cntract n. 20, field n. 7(OI)
@quandl.com:
www.quandl.com
is exported @tradingview:
www.tradingview.com
Every outstanding contract's OI & vol is exported (black column), but not the total (yellow line):
tiny.cc
This script sums up all the existing outstanding contract's OI for the future (the black column), so one can have an idea of the total OI for the day (Yellow line).
As numer of outstanding contracts varies from future to future,Eg:
E-mini (ES) has 4 contracts, Gold(GC) 16 cntrcts, NatGas(NG) has 43, WTI(CL) has 38 etc
the scrips tries to guess how many exist for it and sums them up, to have the total OI for tha day
Number ofoutstanding contracts exported by quandl.com to tradingview is taken from
s3.amazonaws.com
There are 2 params you can enter on the script:
* override the ticket symbol on the chart ,if script cannot guessit or you need a different one
* enter the "preliminary" OI that is published by CME early the next day, butb not yet exported by quandl to tradingview
This script is Open so anyone can copy and modifyit for its use.
Please post comments and ideas if you find it useful
I try to keep a log of my work here:

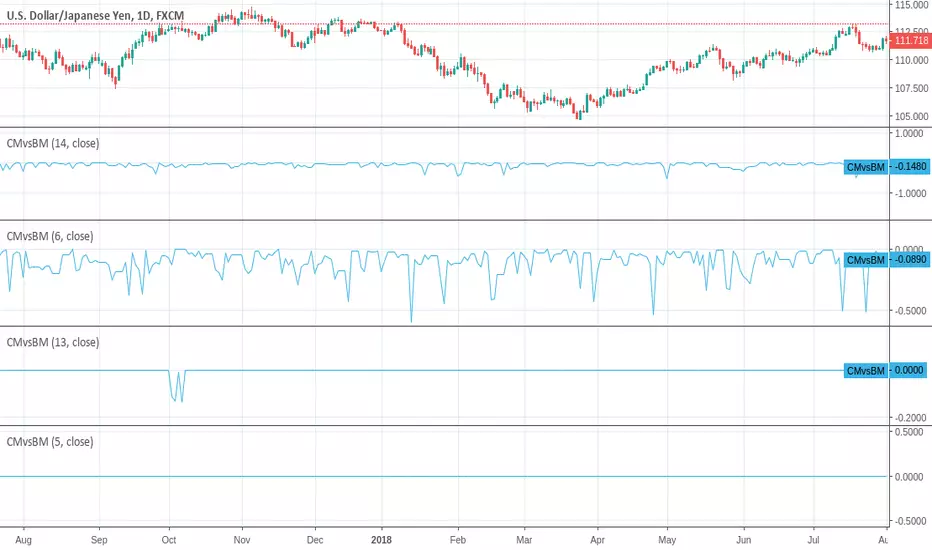
CRMI - Comparative Relative Magnitude IndexCan be used to compared price action magnitude vs other symbols or indices/market segments.


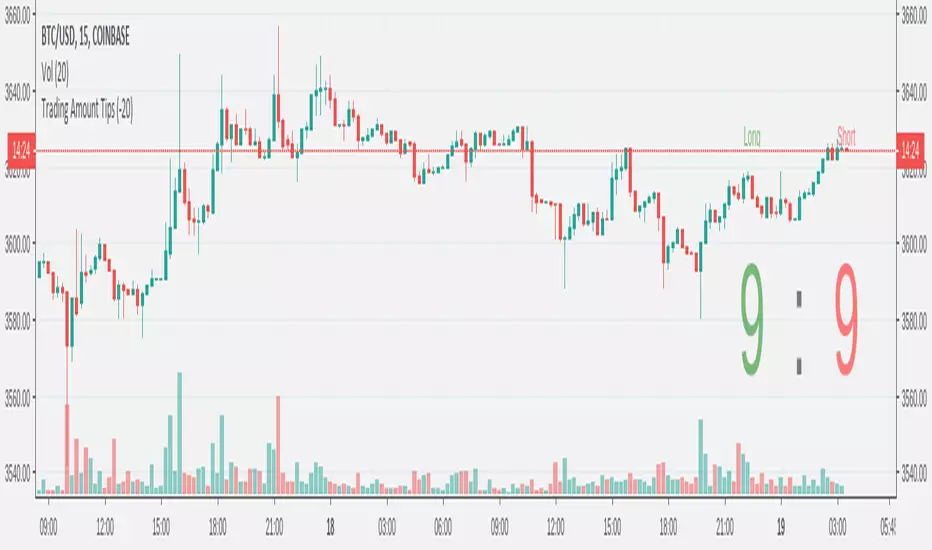
Trading Amount TipsIt is important to manage trading amount according to market status.
This indicator allows users to display trading amount on the screen.
A ratio of 0-9 : 0-9 for long amount vs short amount.
Amount ratio can be set in format setting - style.
Users can move the labels to left or right in format - input - offset.
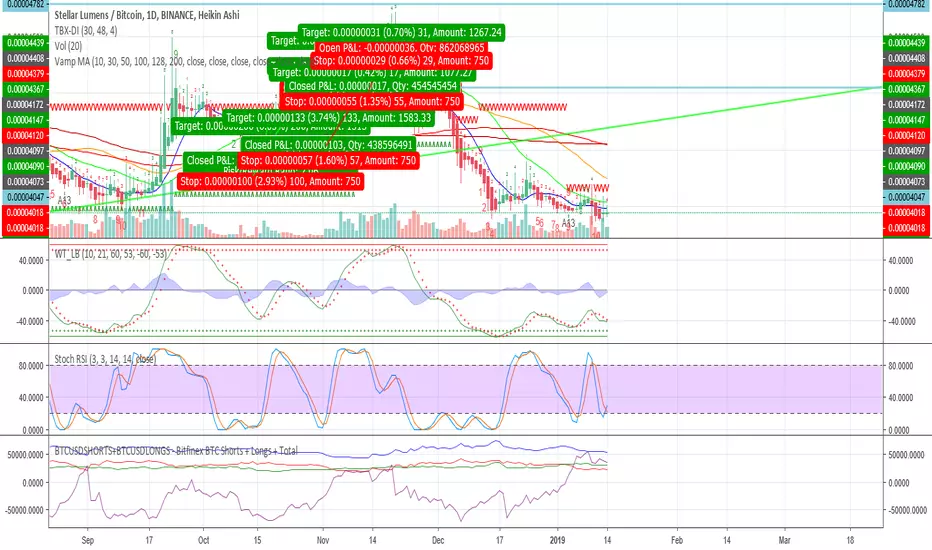
BTCUSDSHORTS+BTCUSDLONGS - Bitfinex BTC Shorts + Longs + TotalLongs, Shorts, Longs + Shorts, Longs VS Shorts

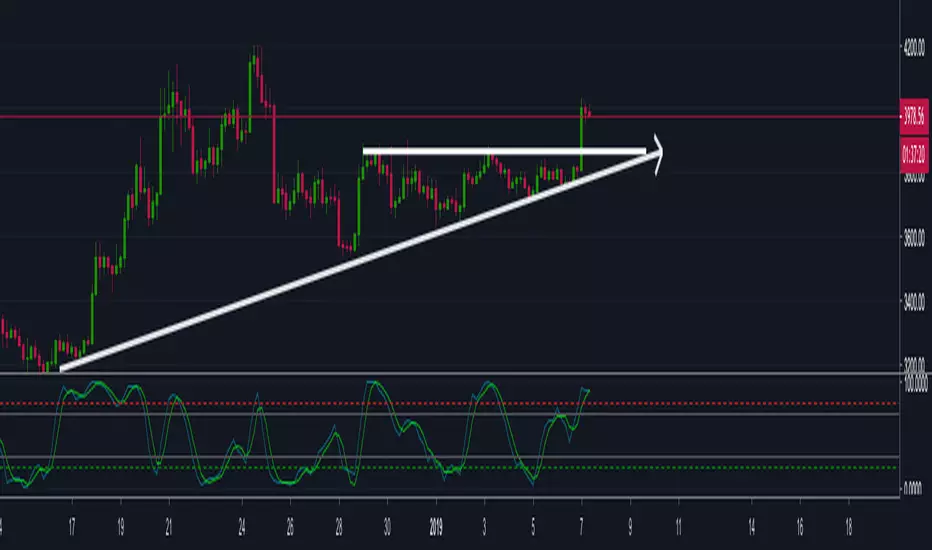
FM RSI Vs StochEasy to use RSI and Stoch
Setting Menu has an option to toggle the RSI and Stoch ON and OFF for your own preference.
Great for reducing clutter when comparing oscillators, while giving the ease of use to just click the toggle option instead of having to find and reset your indicator settings.
Colour schemes adjustable in Settings Menu for personal taste.

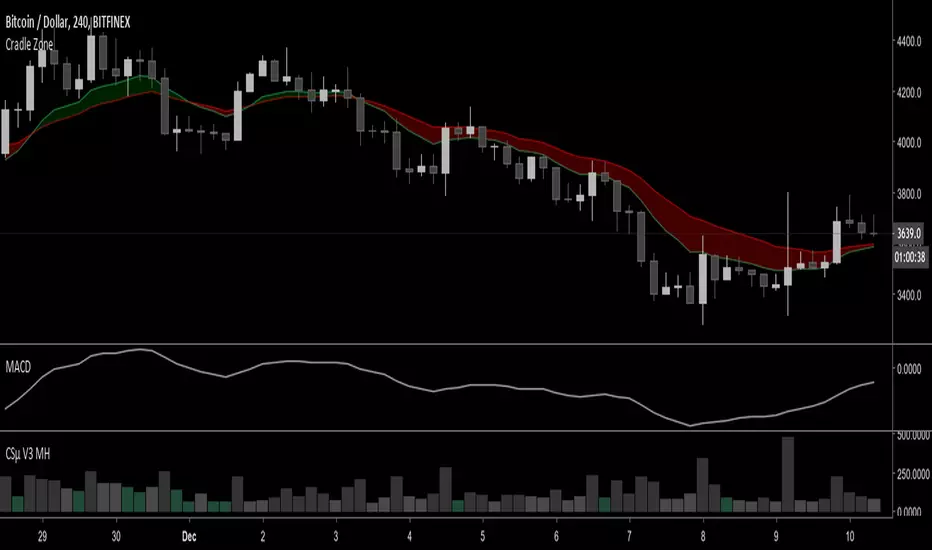
Small candle/Stop Gap indicator MHThis script has a different setting for the stop gap vs the candle size
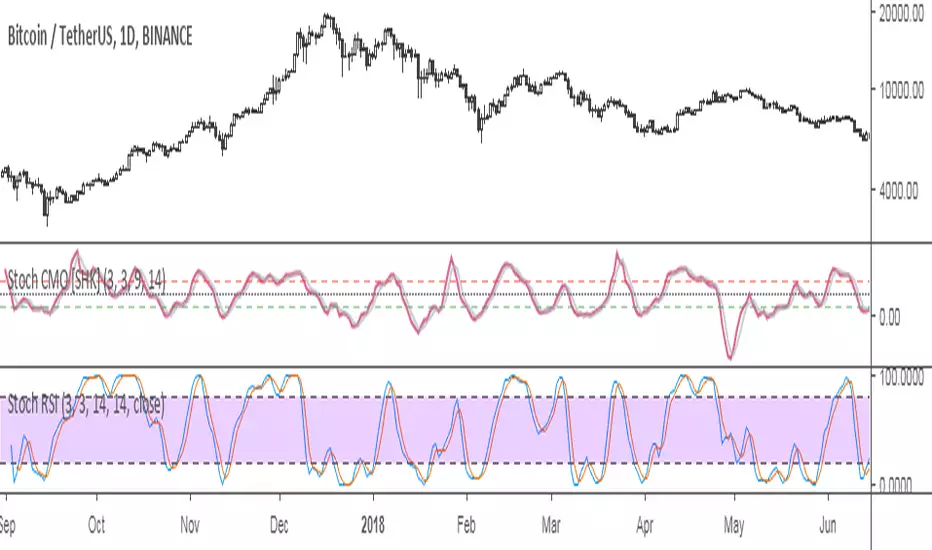
StochCMO - Stochastic CMO [SHK]StochCMO is the combination of Stochastic and CMO (Chande Momentum Oscillator).
The StochCMO is an indicator used in technical analysis that ranges between zero and one and is created by applying the Stochastic Oscillator formula to a set of Chande Momentum Oscillator (CMO) values rather than standard price data. Using CMO values within the Stochastic formula gives traders an idea of whether the current CMO value is overbought or oversold - a measure that becomes specifically useful when the CMO value is confined between its signal levels of 20 and 80.
Usage:
The usage of StochCMO is similar to StochRSI.
StochCMO vs StochRSI:
The difference between these indicators can be realized by comparing CMO & RSI:
CMO is similar to the Relative Strength Index (RSI) except that it measures momentum on both up days and down days. The CMO also does not use internal smoothing and thus does not obscure short-term extremes in momentum. As a result, the CMO often reaches over bought and over sold areas more regularly than momentum indicators, such as the RSI, that have internal smoothing.
Hope it helps you.
Domino EffectThis illustrates the domino effect of crossing emas to establish changes in Trend State.
Each Ma has been colour coded to show when its increasing vs decreasing or stagnate
Watch and count the FAST MA crosses over the slow MA crosses to recognise changes in trend

MCI and VCI - Modified CCI FormulasFor private peeps only
- Takes a modified version of the CCI formula into 2 parts
VCI - Volume Channel Index (Yellow Histogram)
- Measures accurate accumulation and distribution levels and times
MCI - Modified Channel Index
- Measures (when compared to VCI) levels where clearly buys are interested vs not interested.
Example:
If VCI > MCI
- Shows buyer's are more than interested in buying, you've either hit a bottom or heavy resistance
if MCI > VCI
- Show's buyer's aren't interested and will most likely result in a dump/lower price
Great for monitoring accumulation and distribution, these auto buy and sells look for the transition points over 0, works on EVERY commodity/stock/FOREX/Crypto
Results are from trading 1 BTC x25 leveraging. Not all trades will get in if put in at limit, but it does survive with profits after the massive 0.075 fee (results shown are after fees)

[RESEARCH] Custom Median vs Built-in MedianI compared custom median (using the sorting solution by @apozdnyakov) with built-in median (using percentile_nearest_rank function)
If you see the zero line this means the solutions give the same results.
The best results was achieved on the odd lengths.
Conclusions:
1) Do not try to reinvent the wheel.
2) Always check the Pine Script docs to find already implemented solutions.
MY_CME eod OI vs CFTC eow OIDaily e-o-d Open Interest as published by CME.
As CFTC COT Open Interest relates to last Tuesday, here you can have an idea how things evolved day-by-day since then.
As CME total OI is not accessibl as data, here I sum OI of the next 9 outstanding contracts, which gives a fair idea of the trend in OI
