Cash Gaps on a Future/CFD-ChartThe script is based on the great work of @NgUTech which very nicely prints the gaps on any given chart.
The purpose of this script is to show the gaps to futures or cfd of the underlying cash chart, because very often gap closing provides an opportunity to fade the move.
The script works in the way that the user provides the underlying chart symbol and the current spread of the instruments (cash-future/cfd) and it draws boxes where the cash-gaps are.
If you know a way to automatically calculate the spread of the two instruments, please let me know, thanks.
Michael
Cari skrip untuk "纳斯达克指数期货cfd"

Cruce TEMA SMMA con Alarma a 12 Barras LLUCes un cruce de TEMA SMMA, luego del cruce contar 12 barras controladas por otros
Quantum Portfolio vs S&P 500 (Base: May 2, 2021)This script compares the performance of a custom Quantum Portfolio — a weighted basket of quantum computing, semiconductor, and cybersecurity stocks — against the S&P 500 Index, with both series rebased to 100 on May 2 2021.
It provides a clear, normalized view of cumulative returns, allowing you to visualize portfolio outperformance or underperformance relative to the broader market benchmark.

Quantum Portfolio vs NASDAQ (Base: May 2, 2021)This custom Pine Script indicator tracks and compares the cumulative performance of a multi-asset “Quantum Portfolio” against the NASDAQ 100 benchmark, rebased to a common starting point on May 2, 2021.
Both series are normalized to a base value of 100 on that date, allowing direct visual comparison of percentage growth or decline over time.

Renko ATR Trend + SMA Indicator by YCGH Capital🧭 Overview
The Renko ATR Trend + SMA Indicator is a trend-following tool designed for chart trading.
It combines Renko-style price movement logic (based on ATR) with a Simple Moving Average (SMA) filter to identify sustained bullish or bearish phases on any timeframe.
It plots a color-coded trend line directly on the price chart — green for bullish trends, red for bearish — and maintains a single active state (no repeated buy/sell signals) until the opposite condition appears.
⚙️ How It Works
1️⃣ Renko ATR Engine
Instead of using fixed box sizes like classic Renko charts, this indicator builds synthetic Renko movement based on ATR (Average True Range) of a chosen timeframe.
It pulls OHLC data from your selected Renko Source Timeframe (for example, 60-minute candles).
It calculates an ATR brick size — representing the minimum price move needed for a new Renko brick.
When price moves by at least one ATR in the opposite direction, it flips the trend.
This filters out small fluctuations and captures the underlying directional bias.
2️⃣ SMA Filter
A Simple Moving Average (SMA) acts as a trend confirmation filter.
Only when Renko direction aligns with the price relative to the SMA, a trend signal activates.
BUY → Renko uptrend + price above SMA
SELL → Renko downtrend + price below SMA
3️⃣ Stateful Signal Logic
Unlike typical indicators that spam multiple buy/sell shapes:
This version holds one persistent signal (Buy or Sell)
The state continues until an opposite signal is confirmed
No “continuation” arrows — clean and minimal trend visualization
🎨 Visuals
Element Meaning
🟩 Green Renko Line Active Bullish Trend
🟥 Red Renko Line Active Bearish Trend
⚪ Gray Line Neutral / Waiting phase
🟡 Yellow Line SMA (trend filter)
📍 Label (Buy Active / Sell Active) Displays the current market bias
🔧 Inputs
Input Description
Renko Source Timeframe The timeframe from which Renko data is calculated (e.g., 60 = 1h candles).
ATR Period Determines brick size sensitivity (lower = more responsive, higher = smoother).
SMA Length Moving Average length used as a directional filter.
💡 How Traders Use It
Trend Confirmation:
Use green/red Renko line to stay aligned with the dominant market move.
Entry Timing:
Enter trades when a new Renko direction is confirmed along with SMA alignment.
Exit or Reverse:
Exit long when a red line (Sell Active) appears, and vice versa.
Combine with Price Action:
Add support/resistance or volume analysis for confirmation.

FX Realized Volatility *The downward signal for Euqities!?*The Russel 2000 put in a new ath today as capital is moving further out the risk curve. Risk-Assets continue to rally to the upside.
This will last until we see a lasting driver happening on a real time basis that drag pull equties down
When volatility rises, we need to see the DRIVER of the volatility have persistence behind it as opposed to one off shocks.
We are not there yet as volatility in FX and bonds continues to compress since the April lows in equities.
Equities will continue to rally until long end yields blow out or the carry trade unwinds. Long end yields blowing out is not occuring on an imminent basis but the FX side of things could be a significant risk soon.
Its all about: When will that liquidity beginn to create inflation or a problem in the currency
Monitoring the equity vol, Bond vol and FX volatiliy is crucial here
You can watch them via:
VIX,
Move,
+ i build an Trading view modell which conducts the vol of the major FX pairs.
(its 100% free)
If you just want it simple, just look at USD & EUR vol as they are the most trades foreign exchange currencies.
Watching these 2 Risks (Vol & long-end) will put you upfront most people in the market.
Once we see information in the underlying economy shifting i will adjust my views as they relate to every major asset class.
But for now we are likely moving higher in basically every risky asset.
**Feel free to ask me any questions**

XAUUSD 5m — NY Supertrend+RSI Optimizer (1:2 RR) — $240k/orderThis strategy is built for XAUUSD (Gold) on the 5-minute timeframe, focusing exclusively on the New York trading session (08:00–17:00 NY time) — the most volatile and liquid hours of the day.
It combines a Supertrend trend filter with RSI momentum signals to identify high-probability entries, using a 1:2 risk–reward ratio for disciplined trade management.
🧠 Strategy Logic:
Buy Condition: RSI crosses above 55 while Supertrend indicates an uptrend
Sell Condition: RSI crosses below 45 while Supertrend indicates a downtrend
Session Filter: Trades only between 08:00 → 17:00 New York time
Risk/Reward: 1:2 (Take-Profit = 2× Stop-Loss distance from Supertrend line)
Position Size: $240,000 notional per order
Auto-Exit: Closes all trades at NY session end
⚡ Highlights:
Targets NY session volatility
Combines trend + momentum for cleaner entries
Strict 1:2 RR for consistent outcomes
Avoids overnight exposure
⚠️ Disclaimer:
This script is intended for educational and research purposes only.
Past performance is not indicative of future results.
Always forward-test on demo before using live capital.

XAUUSD 5m — CET 13:00→01:00 Supertrend + RSI (1:2 RR) — $240KThis strategy is designed for XAUUSD (Gold) on the 5-minute chart, optimized for trading during the most active hours (13:00–01:00 CET).
It combines a Supertrend direction filter with RSI crossovers for precise entries, and applies a 1:2 risk–reward ratio for consistent risk management.
🧠 Logic Overview:
Buy Signal: RSI crosses above 55 while Supertrend is bullish
Sell Signal: RSI crosses below 45 while Supertrend is bearish
Trading Hours: 13:00 → 01:00 CET (corresponding to 07:00 → 19:00 New York time)
Risk Management: Fixed 1:2 RR (TP = 2× SL distance from Supertrend line)
Session Management: Automatically closes all trades after 01:00 CET
Order Size: $240,000 notional exposure per position
💡 Best used for:
Scalping or intraday trading on XAUUSD during high-volatility hours.
The setup works best when combined with strong price action or volume confirmation.
⚠️ Disclaimer:
This script is for educational and testing purposes only.
Past performance does not guarantee future results.
Always test on demo before using live funds.

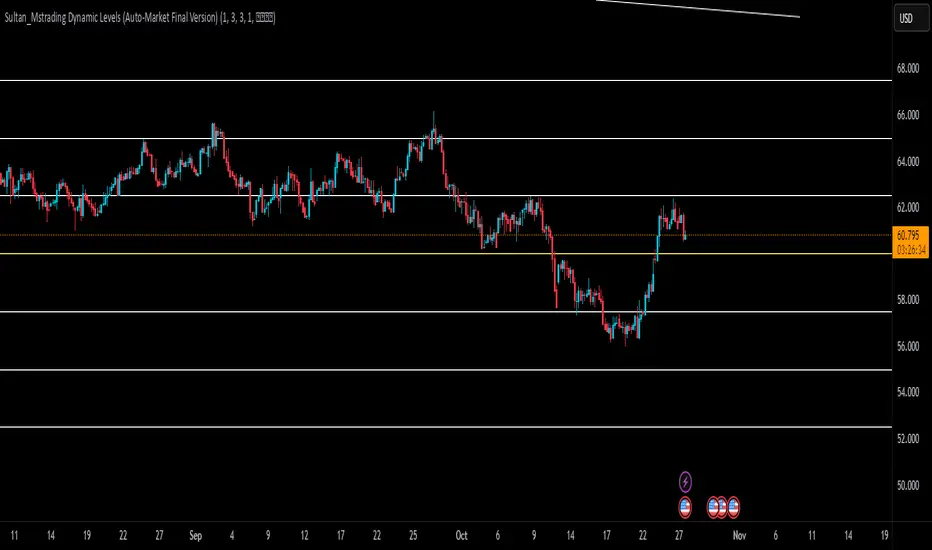
Sultan_Mstrading Dynamic Levels (Auto-Market Final Version)The Sultan_Mstrading Dynamic Levels indicator automatically generates dynamic support and resistance levels based on the market type or trading symbol (such as Gold, Bitcoin, Indices, Oil, or Forex pairs).
It plots multiple levels above and below the current price with adjustable spacing, and automatically highlights the nearest level to the current price for quick visual reference
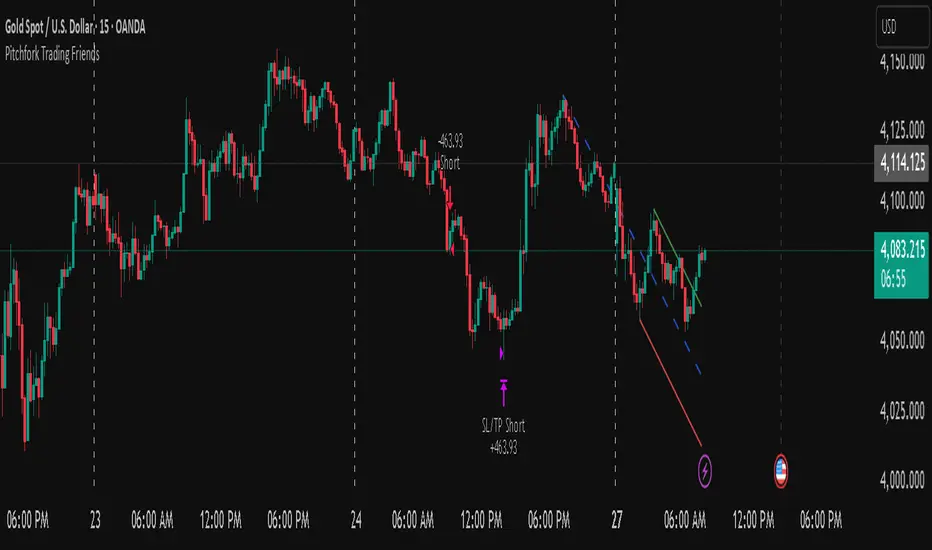
Pitchfork-Trading Friendsuses the pitchfork to give entry and exit zones, and gives a net overall summary for a beginner trader to enter into.
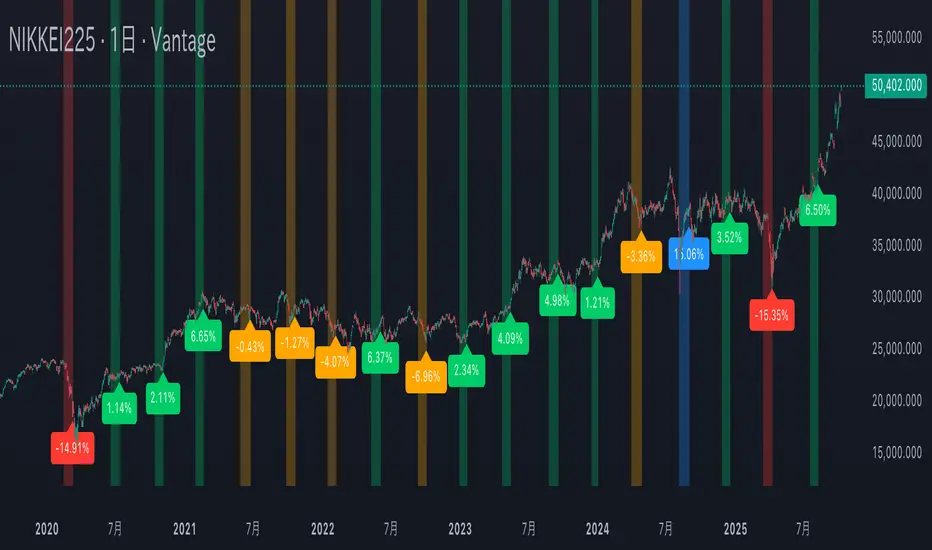
Mercury Retrograde — Daily boxes & bottom % (stable v6)水星逆行のアノマリー検証。対象は日経225の過去5年の値動き。水星逆行開始時の終値と水星逆行終了時の終値を比較。上昇率・下落率に応じて色分け。
Verification of Mercury Retrograde Anomalies. Subject: Nikkei 225 price movements over the past five years. Comparing closing prices at the start and end of Mercury retrograde periods. Color-coded based on percentage increase/decrease.
Liquidity Grab + RSI Divergence═══════════════════════════════════════════════════════════════
LIQUIDITY GRAB + RSI DIVERGENCE INDICATOR
═══════════════════════════════════════════════════════════════
📌 OVERVIEW
This indicator identifies high-probability reversals by combining:
• Liquidity sweeps (stop hunts)
• RSI divergence confirmation
• Filters false breakouts automatically
═══════════════════════════════════════════════════════════════
🟢 BUY SIGNAL (Green Triangle Up)
REQUIRES BOTH CONDITIONS:
1. Liquidity Grab Below Previous Low
• Price breaks BELOW recent low
• Candle CLOSES ABOVE that low
• Traps sellers who shorted the breakdown
2. Bullish RSI Divergence
• Price: Lower Low (LL)
• RSI: Higher Low (HL)
• Shows weakening downward momentum
➜ Result: Potential bullish reversal
═══════════════════════════════════════════════════════════════
🔴 SELL SIGNAL (Red Triangle Down)
REQUIRES BOTH CONDITIONS:
1. Liquidity Grab Above Previous High
• Price breaks ABOVE recent high
• Candle CLOSES BELOW that high
• Traps buyers who bought the breakout
2. Bearish RSI Divergence
• Price: Higher High (HH)
• RSI: Lower High (LH)
• Shows weakening upward momentum
➜ Result: Potential bearish reversal
═══════════════════════════════════════════════════════════════
📊 VISUAL INDICATORS
Main Signals:
🔺 Large Green Triangle = BUY (Liq Grab + Bullish Div)
🔻 Large Red Triangle = SELL (Liq Grab + Bearish Div)
Reference Levels:
━ Red Line = Previous High Level
━ Green Line = Previous Low Level
Additional Markers (Optional):
○ Small Green Circle = Liquidity grab low only
○ Small Red Circle = Liquidity grab high only
✕ Small Blue Cross = Bullish divergence only
✕ Small Orange Cross = Bearish divergence only
═══════════════════════════════════════════════════════════════
⚙️ SETTINGS
1. Lookback Period (Default: 20)
• Range: 5-100
• Sets how far back to identify previous highs/lows
• Higher = fewer but stronger levels
• Lower = more frequent but weaker levels
2. RSI Length (Default: 14)
• Range: 5-50
• Standard RSI calculation period
• 14 is industry standard
3. RSI Divergence Lookback (Default: 5)
• Range: 3-20
• Controls pivot point sensitivity
• Higher = fewer divergence signals
• Lower = more divergence signals
4. Show Labels (Default: ON)
• Toggle BUY/SELL text labels
• Disable for cleaner chart view
═══════════════════════════════════════════════════════════════
💡 HOW TO USE
Step 1: WAIT FOR CONFIRMATION
• Only trade LARGE TRIANGLE signals
• Ignore small circles/crosses alone
Step 2: CHECK TIMEFRAME
• Best on: 15min, 1H, 4H, Daily
• Avoid: 1min, 5min (too noisy)
Step 3: CONFIRM CONTEXT
• Check overall market trend
• Identify key support/resistance
• Look for confluence with price action
Step 4: ENTRY & RISK MANAGEMENT
• Enter on signal candle close or pullback
• Stop loss below/above the liquidity grab wick
• Target: Previous swing high/low or key levels
• Risk/Reward: Minimum 1:2 ratio
Step 5: SET ALERTS
• Create alert for "BUY Signal"
• Create alert for "SELL Signal"
• Never miss opportunities
═══════════════════════════════════════════════════════════════
✅ BEST PRACTICES
DO:
✓ Use on multiple timeframes for confluence
✓ Combine with support/resistance zones
✓ Wait for both conditions (liq grab + divergence)
✓ Practice on demo account first
✓ Use proper position sizing
DON'T:
✗ Trade every small circle/cross
✗ Use on very low timeframes (<15min)
✗ Ignore overall market context
✗ Trade without stop loss
✗ Risk more than 1-2% per trade
═══════════════════════════════════════════════════════════════
⚠️ IMPORTANT NOTES
• This is a CONFIRMATION tool, not a holy grail
• No indicator is 100% accurate
• Combine with your trading strategy
• Backtest on your preferred instruments
• Adjust parameters for your trading style
• Higher timeframes = more reliable signals
• Always use risk management
═══════════════════════════════════════════════════════════════
🔔 ALERTS INCLUDED
Two alert conditions are built-in:
1. "BUY Signal" - Liquidity Grab + Bullish RSI Divergence
2. "SELL Signal" - Liquidity Grab + Bearish RSI Divergence
═══════════════════════════════════════════════════════════════
📈 RECOMMENDED SETTINGS BY TIMEFRAME
5-15 Min Charts:
• Lookback: 10-15
• RSI Length: 14
• RSI Div Lookback: 3-5
1H-4H Charts:
• Lookback: 20-30
• RSI Length: 14
• RSI Div Lookback: 5-7
Daily Charts:
• Lookback: 30-50
• RSI Length: 14
• RSI Div Lookback: 7-10
═══════════════════════════════════════════════════════════════
Good luck and trade safe! 🚀


DAX Zonen Ergänzungen (Pro Signale + EMAs mit Filter RSI MACD)📊 DAX Zones Enhancements (Pro Signals + EMA with RSI & MACD Filter)
Description:
This indicator enhances DAX trading analysis by combining dynamic support/resistance zones with professional-level signal filters. It automatically detects potential buy and sell zones and confirms them using EMA trends, RSI conditions, and MACD momentum.
Key features:
🔹 Visual display of DAX high- and low-price zones
🔹 EMA-based trend confirmation
🔹 RSI and MACD filters to reduce false signals
🔹 Customizable alerts when price interacts with key zones
🔹 Works on multiple timeframes
Ideal for traders who want a clean, rule-based approach to identifying high-probability entries and exits on the DAX index.

GARCH Range PredictorThis was inspired by deltatrendtrading's video on GARCH models to predict daily trading ranges and identify favorable trading conditions. Based on advanced volatility forecasting techniques, it predicts whether a trading day's true range will exceed a threshold, helping traders decide when to trade or skip a session.
Key Features
GARCH(1,1) Volatility Modeling: Uses log-transformed true ranges with exponential moving average centering
Forward-Looking Predictions: Makes predictions at session start before the day unfolds
Dynamic or Static Thresholds: Choose between fixed dollar thresholds or adaptive 20-day averages
Accuracy Tracking: Monitors prediction accuracy with overall and recent (20-day) hit rates
Visual Session Boxes: Colors trading sessions green (trade) or red (skip) based on predictions
Real-Time Statistics: Displays current predictions, thresholds, and performance metrics
How It Works
Data Transformation: Log-transforms daily true ranges and centers them using an EMA
Variance Modeling: Updates GARCH variance using: σ²ₜ = ω + α(residual²) + β(σ²ₜ₋₁)
Prediction Generation: Back-transforms log predictions to dollar values
Signal Generation: Compares predictions to threshold to generate trade/skip signals
Performance Tracking: Validates predictions against actual outcomes
Parameters
GARCH Parameters (ω, α, β): Control volatility persistence and mean reversion
EMA Period: Smoothing period for log range centering
Threshold Settings: Static dollar amount or dynamic multiplier of recent averages
Session Time: Define regular trading hours for analysis
Best Use Cases
Breakout and momentum strategies that perform better on high-range days
Risk management by avoiding low-volatility sessions
Futures day trading (optimized for MNQ/NQ detection)
Any strategy where daily range impacts profitability
Important Notes
Requires 5+ sessions for initialization and warm-up
Accuracy depends heavily on proper parameter tuning for your specific instrument
Default parameters may need adjustment for different markets
Monitor the hit rate to validate effectiveness on your timeframe

Simple VWAP + BandsSimple VWAP + Bands
A clean and customizable VWAP (Volume Weighted Average Price) indicator with standard deviation bands and RTH (Regular Trading Hours) session support.
Features:
- VWAP Line: Volume-weighted average price calculation
- Three Standard Deviation Bands: Configurable bands at 1σ, 2σ, and 3σ levels (above and below VWAP)
- RTH Session Support: Option to calculate VWAP only during regular trading hours
- Customizable Session Times: Configure your own trading session hours and timezone
- Clean Visualization: Line breaks between sessions prevent messy connections across non-trading periods
- Toggle Bands: Show/hide individual standard deviation bands as needed
Use Cases:
- Identify overbought/oversold conditions relative to volume-weighted price
- Track price deviation from VWAP during trading sessions
- Support and resistance levels based on standard deviations
- Mean reversion trading strategies

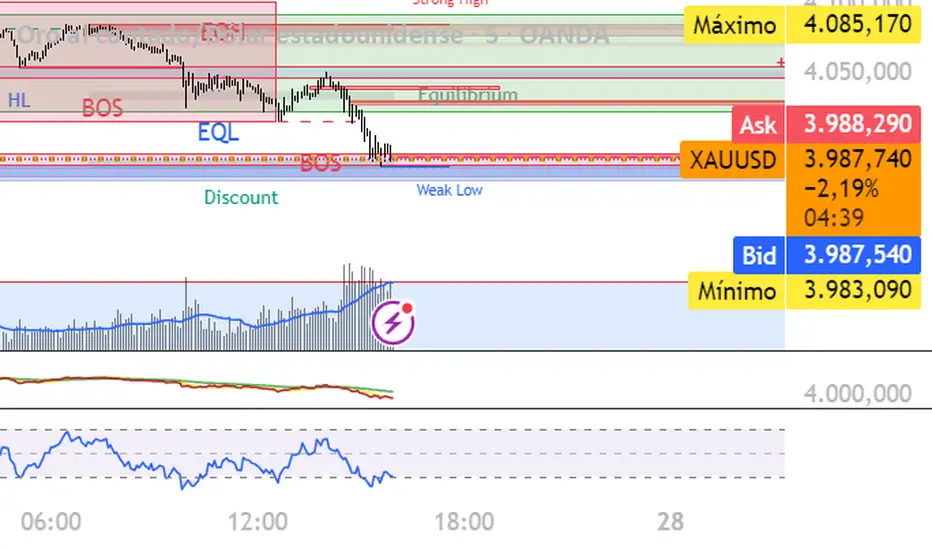
SMC by ASHY-JAYASHY-JAY "Smart Money" refers to funds under the control of institutional investors, central banks, funds, market makers, and other financial entities. Ordinary people recognize investments made by those who have a deep understanding of market performance and possess information typically inaccessible to regular investors as "Smart Money".
Consequently, when market movements often diverge from expectations, traders identify the footprints of smart money. For example, when a classic pattern forms in the market, traders take short positions. However, the market might move upward instead. They attribute this contradiction to smart money and seek to capitalize on such inconsistencies in their trades.
The "Smart Money Concept" (SMC) is one of the primary styles of technical analysis that falls under the subset of "Price Action". Price action encompasses various subcategories, with one of the most significant being "Supply and Demand", in which SMC is categorized.
The SMC method aims to identify trading opportunities by emphasizing the impact of large traders (Smart Money) on the market, offering specific patterns, techniques, and trading strategies.
🟣Key Terms of Smart Money Concept (SMC)
• Market Structure (Trend)
• Change of Character (ChoCh)
• Break of Structure (BoS)
• Order Blocks (Supply and Demand)
• Imbalance (IMB)
• Inefficiency (IFC)
• Fair Value Gap (FVG)
• Liquidity
• Premium and Discount

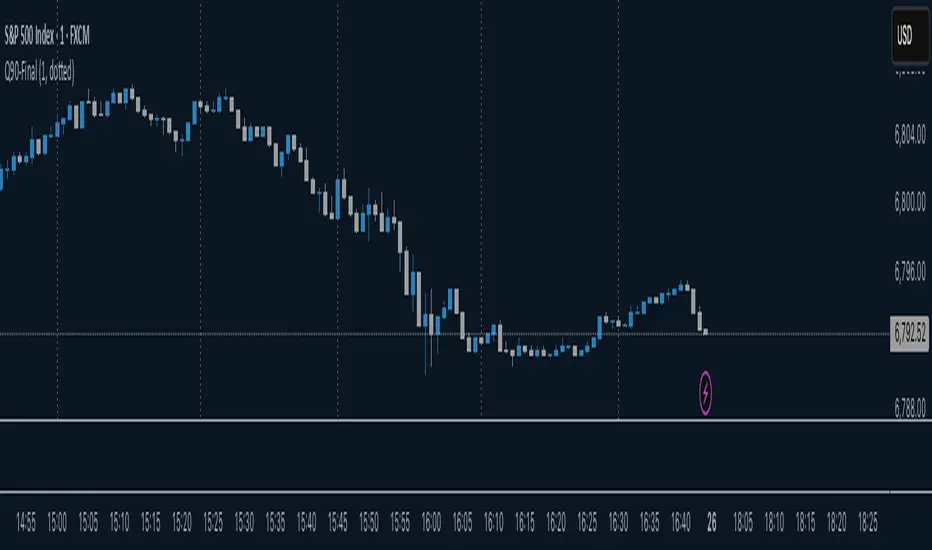
Micro cycle0-Minute Quarter Cycle Indicator (Q90-Final)
This indicator plots vertical lines marking the four quarters (Q1,Q2,Q3,Q4) of a continuous 90-minute cycle.
It is designed for traders who utilize time-based cycles for market analysis and entry/exit timing.
So you can easy identify the cycles off the micro cycles Q1,Q2,Q3 and Q4
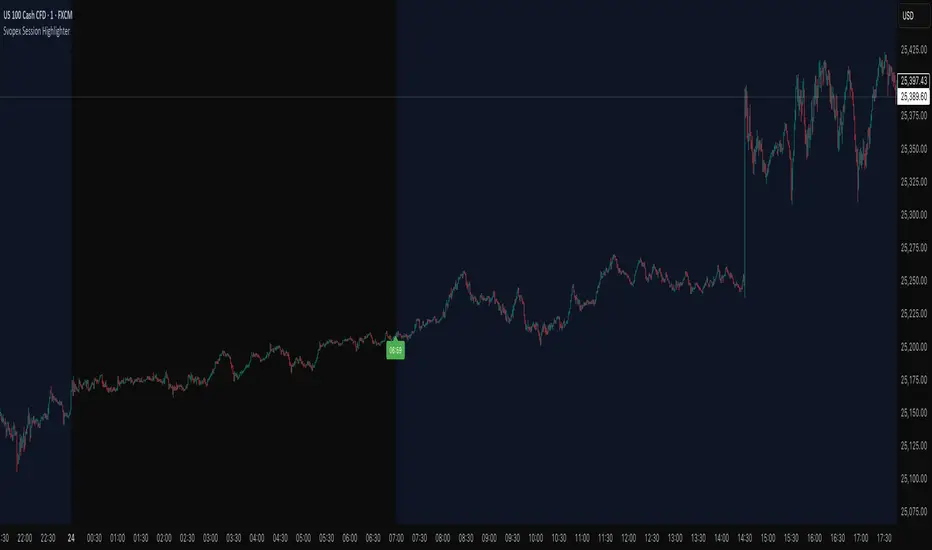
Svopex Session Highlighter# Session Highlighter
## Description
**Session Highlighter** is a powerful Pine Script indicator designed to visually identify and mark specific trading hours on your chart. This tool helps traders focus on their preferred trading sessions by highlighting the background during active hours and marking the session start with customizable visual markers.
## Key Features
- **📊 Session Background Highlighting**: Automatically shades the chart background during your defined trading hours (default: 7:00 - 23:00)
- **🎯 Smart Session Start Marker**: Places a marker on the last candle before session start, intelligently adapting to your timeframe:
- 1 Hour chart: Marker at 6:00
- 15 Minute chart: Marker at 6:45
- 5 Minute chart: Marker at 6:55
- 1 Minute chart: Marker at 6:59
- **🌍 Timezone Support**: Choose from multiple timezones (Europe/Prague, Europe/London, America/New_York, UTC)
- **🎨 5 Marker Styles**: Customize your session start indicator:
- Triangle
- Circle
- Diamond
- Label with time text
- Vertical line
- **⚙️ Fully Customizable**: Adjust start/end hours, timezone, and marker style through simple settings
## Settings
- **Start Hour**: Set your session start time (0-23)
- **End Hour**: Set your session end time (0-23)
- **Timezone**: Select your trading timezone
- **Marker Style**: Choose your preferred visual marker
## Use Cases
- Identify London/New York trading sessions
- Mark Asian session hours
- Highlight your personal trading windows
- Avoid trading during off-hours
- Perfect for day traders and scalpers
## Installation
1. Copy the Pine Script code
2. Open TradingView Pine Editor
3. Paste the code and click "Add to Chart"
4. Configure settings to match your trading schedule
TrendFlowTrendFlow is a visual trend analysis tool that helps identify changes in market direction and momentum.
It uses three exponential moving averages (EMA 21, EMA 50, and EMA 200) to define short-, medium-, and long-term trend structure.
A dynamic color fill highlights the relationship between the 21 and 50 EMAs:
When EMA 21 is above EMA 50, a green fill indicates upward momentum.
When EMA 21 is below EMA 50, a red fill shows downward momentum.
The EMA 200 line adapts its color based on its position relative to the shorter EMAs:
Red when above both EMAs (strong upward structure)
Green when below both EMAs (strong downward structure)
Gray when between them (neutral or consolidation phase)
This setup provides a clear visual framework for observing trend flow and directional bias over multiple timeframes.
Developed by The Volume Hub Fintech and Strategy Development

Buyside & Sellside Liquidity The Buyside & Sellside Liquidity Indicator is an advanced Smart Money Concepts (SMC) tool that automatically detects and visualizes liquidity zones and liquidity voids (imbalances) directly on the chart.
🟢 Function and meaning:
1. Buyside Liquidity (green):
Highlights price zones above current price where short traders’ stop-loss orders are likely resting.
When price sweeps these areas, it often indicates a liquidity grab or stop hunt.
👉 These zones are labeled with 💵💰 emojis for a clear visual cue where smart money collects liquidity.
2. Sellside Liquidity (red):
Highlights zones below the current price where long traders’ stop-losses are likely placed.
Once breached, these often signal a potential reversal upward.
👉 The 💵💰🪙 emojis make these liquidity targets visually intuitive on the chart.
3. Liquidity Voids (bright areas):
Indicate inefficient price areas, where the market moved too quickly without filling orders.
These zones are often revisited later as the market seeks balance (fair value).
👉 Shown as light shaded boxes with 💰 emojis to emphasize imbalance regions.
💡 Usage:
• Helps spot smart money manipulation and stop hunts.
• Marks potential reversal or breakout zones.
• Great for traders applying SMC, ICT, or Fair Value Gap strategies.
✨ Highlight:
Dollar and money bag emojis (💵💰🪙💸) are integrated directly into chart labels to create a clear and visually engaging representation of liquidity areas.


NOVA Breakout Signals v2.2 (TF M30)A clean, rules-based breakout signal tool for 30-minute charts.
It detects Dow swing breakouts and filters them with RSI, MACD and Volume so you only see the higher-quality entries. The script does not place trades and does not calculate SL/TP – it only prints clear LONG/SHORT labels at the entry price.
⸻
How it works
1. Timeframe enforcement – Signals are generated only on M30. On other timeframes the script shows a notice and stays silent.
2. Breakout engine (Dow swings) – The last confirmed swing high/low (pivots) is tracked.
• Breakout Up: bar closes above the last swing high by a small buffer.
• Breakout Down: bar closes below the last swing low by a small buffer.
3. Quality filters (all must be true):
• RSI (default length 30):
• Long: RSI > threshold and rising.
• Short: RSI < threshold and falling.
• MACD (12/26/9):
• Long: histogram > 0 and line > signal.
• Short: histogram < 0 and line < signal.
• Volume: current volume > SMA(volume, 20) × multiplier.
4. Debounce / anti-spam
• Cooldown of 4 hours (8 M30 bars) after any signal.
• Minimum price distance from the previous signal to avoid clustered labels.
Signals appear once the bar closes (barstate.isconfirmed). No swing lines are drawn to keep the chart clean; only entry labels are shown.
⸻
Inputs (key)
• RSI length & thresholds for Long/Short confirmation.
• MACD uses 12/26/9 (fixed).
• Volume multiplier (relative to SMA 20).
• Breakout buffer %, Cooldown hours, Min distance %.
• Show labels (on/off).
⸻
Usage tips
• Start with gold/major FX/indices on M30; use “Once per bar close” if you attach alerts.
• Increase the breakout buffer and volume multiplier in choppy markets.
• Tighten RSI thresholds (e.g., 55/45) if you want fewer but stronger signals.
⸻
Notes & limitations
• Pivots confirm after a few bars by definition; signals themselves are printed only on confirmed bar close and do not repaint once shown.
• This is a signal indicator, not investment advice. Always manage risk.
