Breakout FinderHelo All,
I got many requests for a Breakout script and here it's. This script searches the breakouts/breakdowns and draw square if there is one.
The options:
"Period" is used to find Pivot Points
"Max Breakout Length" is the maximum length to search breakouts
"Threshold Rate %" is channel width of the breakout area. calculated using highest/lowest of last 300 bars.
"Minimum Number of Tests" is the minimum number of tests that the Price tried to break the S/R level
and some options for coloring and linestyle
Lets see some examples:
in this example "Minimum Number of Tests" is 2 so the Price must have tested to break resistance area 2 times and then it breaks it as seen in the screenshot:
in following example Threshold rate is %10, so the channel width is very big:
as you can see in followinf screenshot you can choose different colors and line styles:
Alerts added ;)
Enjoy!
Cari skrip untuk "沪深300指数成分股的最新估值排名如何?"

Pinescript - Common Label & Line Array Functions Library by RRBPinescript - Common Label & Line Array Functions Library by RagingRocketBull 2021
Version 1.0
This script provides a library of common array functions for arrays of label and line objects with live testing of all functions.
Using this library you can easily create, update, delete, join label/line object arrays, and get/set properties of individual label/line object array items.
You can find the full list of supported label/line array functions below.
There are several libraries:
- Common String Functions Library
- Standard Array Functions Library
- Common Fixed Type Array Functions Library
- Common Label & Line Array Functions Library
- Common Variable Type Array Functions Library
Features:
- 30 array functions in categories create/update/delete/join/get/set with support for both label/line objects (45+ including all implementations)
- Create, Update label/line object arrays from list/array params
- GET/SET properties of individual label/line array items by index
- Join label/line objects/arrays into a single string for output
- Supports User Input of x,y coords of 5 different types: abs/rel/rel%/inc/inc% list/array, auto transforms x,y input into list/array based on type, base and xloc, translates rel into abs bar indexes
- Supports User Input of lists with shortened names of string properties, auto expands all standard string properties to their full names for use in functions
- Live Output for all/selected functions based on User Input. Test any function for possible errors you may encounter before using in script.
- Output filters: hide all excluded and show only allowed functions using a list of function names
- Output Panel customization options: set custom style, color, text size, and line spacing
Usage:
- select create function - create label/line arrays from lists or arrays (optional). Doesn't affect the update functions. The only change in output should be function name regardless of the selected implementation.
- specify num_objects for both label/line arrays (default is 7)
- specify common anchor point settings x,y base/type for both label/line arrays and GET/SET items in Common Settings
- fill lists with items to use as inputs for create label/line array functions in Create Label/Line Arrays section
- specify label/line array item index and properties to SET in corresponding sections
- select label/line SET function to see the changes applied live
Code Structure:
- translate x,y depending on x,y type, base and xloc as specified in UI (required for all functions)
- expand all shortened standard property names to full names (required for create/update* from arrays and set* functions, not needed for create/update* from lists) to prevent errors in label.new and line.new
- create param arrays from string lists (required for create/update* from arrays and set* functions, not needed for create/update* from lists)
- create label/line array from string lists (property names are auto expanded) or param arrays (requires already expanded properties)
- update entire label/line array or
- get/set label/line array item properties by index
Transforming/Expanding Input values:
- for this script to work on any chart regardless of price/scale, all x*,y* are specified as % increase relative to x0,y0 base levels by default, but user can enter abs x,price values specific for that chart if necessary.
- all lists can be empty, contain 1 or several items, have the same/different lengths. Array Length = min(min(len(list*)), mum_objects) is used to create label/line objects. Missing list items are replaced with default property values.
- when a list contains only 1 item it is duplicated (label name/tooltip is also auto incremented) to match the calculated Array Length
- since this script processes user input, all x,y values must be translated to abs bar indexes before passing them to functions. Your script may provide all data internally and doesn't require this step.
- at first int x, float y arrays are created from user string lists, transformed as described below and returned as x,y arrays.
- translated x,y arrays can then be passed to create from arrays function or can be converted back to x,y string lists for the create from lists function if necessary.
- all translation logic is separated from create/update/set functions for the following reasons:
- to avoid redundant code/dependency on ext functions/reduce local scopes and to be able to translate everything only once in one place - should be faster
- to simplify internal logic of all functions
- because your script may provide all data internally without user input and won't need the translation step
- there are 5 types available for both x,y: abs, rel, rel%, inc, inc%. In addition to that, x can be: bar index or time, y is always price.
- abs - absolute bar index/time from start bar0 (x) or price (y) from 0, is >= 0
- rel - relative bar index/time from cur bar n (x) or price from y0 base level, is >= 0
- rel% - relative % increase of bar index/time (x) or price (y) from corresponding base level (x0 or y0), can be <=> 0
- inc - relative increment (step) for each new level of bar index/time (x) or price (y) from corresponding base level (x0 or y0), can be <=> 0
- inc% - relative % increment (% step) for each new level of bar index/time (x) or price (y) from corresponding base level (x0 or y0), can be <=> 0
- x base level >= 0
- y base level can be 0 (empty) or open, close, high, low of cur bar
- single item x1_list = "50" translates into:
- for x type abs: "50, 50, 50 ..." num_objects times regardless of xloc => x = 50
- for x type rel: "50, 50, 50 ... " num_objects times => x = x_base + 50
- for x type rel%: "50%, 50%, 50% ... " num_objects times => x_base * (1 + 0.5)
- for x type inc: "0, 50, 100 ... " num_objects times => x_base + 50 * i
- for x type inc%: "0%, 50%, 100% ... " num_objects times => x_base * (1 + 0.5 * i)
- when xloc = xloc.bar_index each rel*/inc* value in the above list is then subtracted from n: n - x to convert rel to abs bar index, values of abs type are not affected
- x1_list = "0, 50, 100, ..." of type rel is the same as "50" of type inc
- x1_list = "50, 50, 50, ..." of type abs/rel/rel% produces a sequence of the same values and can be shortened to just "50"
- single item y1_list = "2" translates into (ragardless of yloc):
- for y type abs: "2, 2, 2 ..." num_objects times => y = 2
- for y type rel: "2, 2, 2 ... " num_objects times => y = y_base + 2
- for y type rel%: "2%, 2%, 2% ... " num_objects times => y = y_base * (1 + 0.02)
- for y type inc: "0, 2, 4 ... " num_objects times => y = y_base + 2 * i
- for y type inc%: "0%, 2%, 4% ... " num_objects times => y = y_base * (1 + 0.02 * i)
- when yloc != yloc.price all calculated values above are simply ignored
- y1_list = "0, 2, 4" of type rel% is the same as "2" with type inc%
- y1_list = "2, 2, 2" of type abs/rel/rel% produces a sequence of the same values and can be shortened to just "2"
- you can enter shortened property names in lists. To lookup supported shortened names use corresponding dropdowns in Set Label/Line Array Item Properties sections
- all shortened standard property names must be expanded to full names (required for create/update* from arrays and set* functions, not needed for create/update* from lists) to prevent errors in label.new and line.new
- examples of shortened property names that can be used in lists: bar_index, large, solid, label_right, white, left, left, price
- expanded to their corresponding full names: xloc.bar_index, size.large, line.style_solid, label.style_label_right, color.white, text.align_left, extend.left, yloc.price
- all expanding logic is separated from create/update* from arrays and set* functions for the same reasons as above, and because param arrays already have different types, implying the use of final values.
- all expanding logic is included in the create/update* from lists functions because it seemed more natural to process string lists from user input directly inside the function, since they are already strings.
Creating Label/Line Objects:
- use study max_lines_count and max_labels_count params to increase the max number of label/line objects to 500 (+3) if necessary. Default number of label/line objects is 50 (+3)
- all functions use standard param sequence from methods in reference, except style always comes before colors.
- standard label/line.get* functions only return a few properties, you can't read style, color, width etc.
- label.new(na, na, "") will still create a label with x = n-301, y = NaN, text = "" because max default scope for a var is 300 bars back.
- there are 2 types of color na, label color requires color(na) instead of color_na to prevent error. text_color and line_color can be color_na
- for line to be visible both x1, x2 ends must be visible on screen, also when y1 == y2 => abs(x1 - x2) >= 2 bars => line is visible
- xloc.bar_index line uses abs x1, x2 indexes and can only be within 0 and n ends, where n <= 5000 bars (free accounts) or 10000 bars (paid accounts) limit, can't be plotted into the future
- xloc.bar_time line uses abs x1, x2 times, can't go past bar0 time but can continue past cur bar time into the future, doesn't have a length limit in bars.
- xloc.bar_time line with length = exact number of bars can be plotted only within bar0 and cur bar, can't be plotted into the future reliably because of future gaps due to sessions on some charts
- xloc.bar_index line can't be created on bar 0 with fixed length value because there's only 1 bar of horiz length
- it can be created on cur bar using fixed length x < n <= 5000 or
- created on bar0 using na and then assigned final x* values on cur bar using set_x*
- created on bar0 using n - fixed_length x and then updated on cur bar using set_x*, where n <= 5000
- default orientation of lines (for style_arrow* and extend) is from left to right (from bar 50 to bar 0), it reverses when x1 and x2 are swapped
- price is a function, not a line object property
Variable Type Arrays:
- you can't create an if/function that returns var type value/array - compiler uses strict types and doesn't allow that
- however you can assign array of any type to another array of any type creating an arr pointer of invalid type that must be reassigned to a matching array type before used in any expression to prevent error
- create_any_array2 uses this loophole to return an int_arr pointer of a var type array
- this works for all array types defined with/without var keyword and doesn't work for string arrays defined with var keyword for some reason
- you can't do this with var type vars, only var type arrays because arrays are pointers passed by reference, while vars are actual values passed by value.
- you can only pass a var type value/array param to a function if all functions inside support every type - otherwise error
- alternatively values of every type must be passed simultaneously and processed separately by corresponding if branches/functions supporting these particular types returning a common single type result
- get_var_types solves this problem by generating a list of dummy values of every possible type including the source type, tricking the compiler into allowing a single valid branch to execute without error, while ignoring all dummy results
Notes:
- uses Pinescript v3 Compatibility Framework
- uses Common String Functions Library, Common Fixed Type Array Functions Library, Common Variable Type Array Functions Library
- has to be a separate script to reduce the number of local scopes/compiled file size, can't be merged with another library.
- lets you live test all label/line array functions for errors. If you see an error - change params in UI
- if you see "Loop too long" error - hide/unhide or reattach the script
- if you see "Chart references too many candles" error - change x type or value between abs/rel*. This can happen on charts with 5000+ bars when a rel bar index x is passed to label.new or line.new instead of abs bar index n - x
- create/update_label/line_array* use string lists, while create/update_label/line_array_from_arrays* use array params to create label/line arrays. "from_lists" is dropped to shorten the names of the most commonly used functions.
- create_label/line_array2,4 are preferable, 5,6 are listed for pure demonstration purposes only - don't use them, they don't improve anything but dramatically increase local scopes/compiled file size
- for this reason you would mainly be using create/update_label/line_array2,4 for list params or create/update_label/line_array_from_arrays2 for array params
- all update functions are executed after each create as proof of work and can be disabled. Only create functions are required. Use update functions when necessary - when list/array params are changed by your script.
- both lists and array item properties use the same x,y_type, x,y_base from common settings
- doesn't use pagination, a single str contains all output
- why is this so complicated? What are all these functions for?
- this script merges standard label/line object methods with standard array functions to create a powerful set of label/line object array functions to simplify manipulation of these arrays.
- this library also extends the functionality of Common Variable Type Array Functions Library providing support for label/line types in var type array functions (any_to_str6, join_any_array5)
- creating arrays from either lists or arrays adds a level of flexibility that comes with complexity. It's very likely that in your script you'd have to deal with both string lists as input, and arrays internally, once everything is converted.
- processing user input, allowing customization and targeting for any chart adds a whole new layer of complexity, all inputs must be translated and expanded before used in functions.
- different function implementations can increase/reduce local scopes and compiled file size. Select a version that best suits your needs. Creating complex scripts often requires rewriting your code multiple times to fit the limits, every line matters.
P.S. Don't rely too much on labels, for too often they are fables.
List of functions*:
* - functions from other libraries are not listed
1. Join Functions
Labels
- join_label_object(label_, d1, d2)
- join_label_array(arr, d1, d2)
- join_label_array2(arr, d1, d2, d3)
Lines
- join_line_object(line_, d1, d2)
- join_line_array(arr, d1, d2)
- join_line_array2(arr, d1, d2, d3)
Any Type
- any_to_str6(arr, index, type)
- join_any_array4(arr, d1, d2, type)
- join_any_array5(arr, d, type)
2. GET/SET Functions
Labels
- label_array_get_text(arr, index)
- label_array_get_xy(arr, index)
- label_array_get_fields(arr, index)
- label_array_set_text(arr, index, str)
- label_array_set_xy(arr, index, x, y)
- label_array_set_fields(arr, index, x, y, str)
- label_array_set_all_fields(arr, index, x, y, str, xloc, yloc, label_style, label_color, text_color, text_size, text_align, tooltip)
- label_array_set_all_fields2(arr, index, x, y, str, xloc, yloc, label_style, label_color, text_color, text_size, text_align, tooltip)
Lines
- line_array_get_price(arr, index, bar)
- line_array_get_xy(arr, index)
- line_array_get_fields(arr, index)
- line_array_set_text(arr, index, width)
- line_array_set_xy(arr, index, x1, y1, x2, y2)
- line_array_set_fields(arr, index, x1, y1, x2, y2, width)
- line_array_set_all_fields(arr, index, x1, y1, x2, y2, xloc, extend, line_style, line_color, width)
- line_array_set_all_fields2(arr, index, x1, y1, x2, y2, xloc, extend, line_style, line_color, width)
3. Create/Update/Delete Functions
Labels
- delete_label_array(label_arr)
- create_label_array(list1, list2, list3, list4, list5, d)
- create_label_array2(x_list, y_list, str_list, xloc_list, yloc_list, style_list, color1_list, color2_list, size_list, align_list, tooltip_list, d)
- create_label_array3(x_list, y_list, str_list, xloc_list, yloc_list, style_list, color1_list, color2_list, size_list, align_list, tooltip_list, d)
- create_label_array4(x_list, y_list, str_list, xloc_list, yloc_list, style_list, color1_list, color2_list, size_list, align_list, tooltip_list, d)
- create_label_array5(x_list, y_list, str_list, xloc_list, yloc_list, style_list, color1_list, color2_list, size_list, align_list, tooltip_list, d)
- create_label_array6(x_list, y_list, str_list, xloc_list, yloc_list, style_list, color1_list, color2_list, size_list, align_list, tooltip_list, d)
- update_label_array2(label_arr, x_list, y_list, str_list, xloc_list, yloc_list, style_list, color1_list, color2_list, size_list, align_list, tooltip_list, d)
- update_label_array4(label_arr, x_list, y_list, str_list, xloc_list, yloc_list, style_list, color1_list, color2_list, size_list, align_list, tooltip_list, d)
- create_label_array_from_arrays2(x_arr, y_arr, str_arr, xloc_arr, yloc_arr, style_arr, color1_arr, color2_arr, size_arr, align_arr, tooltip_arr, d)
- create_label_array_from_arrays4(x_arr, y_arr, str_arr, xloc_arr, yloc_arr, style_arr, color1_arr, color2_arr, size_arr, align_arr, tooltip_arr, d)
- update_label_array_from_arrays2(label_arr, x_arr, y_arr, str_arr, xloc_arr, yloc_arr, style_arr, color1_arr, color2_arr, size_arr, align_arr, tooltip_arr, d)
Lines
- delete_line_array(line_arr)
- create_line_array(list1, list2, list3, list4, list5, list6, d)
- create_line_array2(x1_list, y1_list, x2_list, y2_list, xloc_list, extend_list, style_list, color_list, width_list, d)
- create_line_array3(x1_list, y1_list, x2_list, y2_list, xloc_list, extend_list, style_list, color_list, width_list, d)
- create_line_array4(x1_list, y1_list, x2_list, y2_list, xloc_list, extend_list, style_list, color_list, width_list, d)
- create_line_array5(x1_list, y1_list, x2_list, y2_list, xloc_list, extend_list, style_list, color_list, width_list, d)
- create_line_array6(x1_list, y1_list, x2_list, y2_list, xloc_list, extend_list, style_list, color_list, width_list, d)
- update_line_array2(line_arr, x1_list, y1_list, x2_list, y2_list, xloc_list, extend_list, style_list, color_list, width_list, d)
- update_line_array4(line_arr, x1_list, y1_list, x2_list, y2_list, xloc_list, extend_list, style_list, color_list, width_list, d)
- create_line_array_from_arrays2(x1_arr, y1_arr, x2_arr, y2_arr, xloc_arr, extend_arr, style_arr, color_arr, width_arr, d)
- update_line_array_from_arrays2(line_arr, x1_arr, y1_arr, x2_arr, y2_arr, xloc_arr, extend_arr, style_arr, color_arr, width_arr, d)

Support Resistance ChannelsHello All,
For Long time I was planning to make Support/Resistance Channels script, finally I had time and here it is.
How this script works?
- it finds and keeps Pivot Points
- when it found a new Pivot Point it clears older S/R channels then;
- for each pivot point it searches all pivot points in its own channel with dynamic width
- while creating the S/R channel it calculates its strength
- then sorts all S/R channels by strength
- it shows the strongest S/R channels, before doing this it checks old location in the list and adjust them for better visibility
- if any S/R channel was broken on last move then it gives alert and put shape below/above the candle
- The colors of the S/R channels are adjusted automatically
You can set/change following settings:
- Pivot Period
- Source : High/Low or Close/Open can be used
- Maximum Channel Width %: this is the maximum channel width rate, this is calculated using Highest/Lowest levels in last 300 bars
- Number of S/R to show : this is the number of Strongest S/R to show
- Loopback Period: While calculating S/R levels it checks Pivot Points in LoopBack Period
- Show S/R on last # Bars: To see S/R levels only on last N bars
- Start Date: the script starts calculating Pivot Point from this date, the reason I put this option is for visuality. Explained below
- You can set colors/transparency
- and You can enable/disable shapes for broken S/R levels
Examples:
You can change colors as you wish:
here " Show S/R on last # Bars " set 100:
Sometimes visuality may corrupt because of old S/R levels, to solve it you need to set "Start Date" in the options to start the script in visual part (last 292 bars)
here in first screenshot it doesn't look good (shrink), then on second screenshot I set the "Start Date" it looks better, if you change time frame don't forget to set it again :)
Enjoy!

EMA RainbowBased on Ripsters EMA clouds, this :
adds an 6 section EMA rainbow to act as DYNAMIC support and resistance levels, that you never have to set manually
splits the 5-12 cloud into 2 parts, as opposed to using a 8-9 centerline. More visually pleasing and intuitive to use
When 300 cloud and 25 cloud are both bullish or bearish - look to take positions in that direction
Use 5 cloud to find pullbacks for entry points
When cloud is moving away (diverging) from other clouds - momentum is increasing
When cloud is increasing in diameter (expanding) - momentum is increasing
When cloud is moving towards other clouds (converging) - momentum is increasing
When cloud is decreasing in diameter (contracting) - momentum is increasing

Gann RetracementThe indicator is based on W. D. Gann's method of retracement studies. Gann looked at stock retracement action in terms of Halves (1/2), Thirds (1/3, 2/3), Fifths (1/5, 2/5, 3/5, and 4/5) and more importantly the Eighths (1/8, 2/8, 3/8, 4/8, 5/8, 6/8, and 7/8). Needless to say, {2, 3, 5, 8} are the only Fibonacci numbers between 1 to 10. These ratios can easily be visualized in the form of division of a Circle as follows :
Divide the circle in 12 equal parts of 30 degree each to produce the Thirds :
30 x 4 = 120 is 1/3 of 360
30 x 8 = 240 is 2/3 of 360
The 30 degree retracement captures fundamental geometric shapes like a regular Triangle (120-240-360), a Square (90-180-270-360), and a regular Hexagon (60-120-180-240-300-360) inscribed inside of the circle.
Now, divide the circle in 10 equal parts of 36 degree each to produce the Fifths :
36 x 2 = 72 is 1/5 of 360
36 x 4 = 144 is 2/5 of 360
36 x 6 = 216 is 3/5 of 360
36 x 8 = 288 is 4/5 of 360
where, (72-144-216-288-360) is a regular Pentagon.
Finally, divide the circle in 8 equal parts of 45 degree each to produce the Eighths :
45 x 1 = 45 is 1/8 of 360
45 x 2 = 90 is 2/8 of 360
45 x 3 = 135 is 3/8 of 360
45 x 4 = 180 is 4/8 of 360
45 x 5 = 225 is 5/8 of 360
45 x 6 = 270 is 6/8 of 360
45 x 7 = 315 is 7/8 of 360
where, (45-90-135-180-225-270-315-360) is a regular Octagon.
How to Use this indicator ?
The indicator generates Gann retracement levels between any two significant price points, such as a high and a low.
Input :
Swing High (significant high price point, such as a top)
Swing Low (significant low price point, such as a bottom)
Degree (degree of retracement)
Output :
Gann retracement levels (color coded as follows) :
Swing High and Swing Low (BLUE)
50% retracement (ORANGE)
Retracements between Swing Low and 50% level (RED)
Retracements between 50% level and Swing High (LIME)

GBTC holdings USD market valueThis script estimates GBTC bitcoins per share, rather than hardcoding as in other scripts. Its result is an estimate of GBTC holdings USD market value.
Per share bitcoin estimates are adjusted by 2.0% / 365 per day from 2019 year end holdings. Calendar year 2019 ending bitcoins and shares were 261,192 bitcoins and 269,445,300 shares. From the 2019 Form 10-K: 'The Trust’s only ordinary recurring expense is the Sponsor’s Fee. The Sponsor’s Fee accrues daily in U.S. dollars at an annual rate of 2.0% of the Bitcoin Holdings.. The Sponsor’s Fee is payable in Bitcoins to the Sponsor monthly in arrears.'
No attempt is made to account for leap years.
Per share bitcoin estimate is converted to USD market value by multiplying by the simple average BTCUSD price at Coinbase and Bitstamp. Grayscale uses the TradeBlock XBX index, a volume weighted average of Coinbase Pro, Kraken, LMAX Digital and Bitstamp prices.
Spot checks vs archive.org captures of daily bitcoins per share and the chart on Grayscale's site:
The estimate for market close January 22 2021 is 0.00094899 bitcoins per share, the published datum on Grayscale's web site was 0.00094898. The estimate matches at 20:30 rather than at 16:00.
The estimate for December 31 2018 is 0.000988965 vs a published 0.00098895.
The estimate for December 29 2017 market value is $14.58 vs $14.65.
The estimate for December 30 2016 market value is $0.99 vs $0.98.
The estimate for January 4 2016 market value is $0.46 vs $0.45.
No estimates before 2016.
The default style is to draw a blue line with two thirds transparency outside market hours and for first/last minutes of trading, switching to daily or greater periodicity hides this.
No warranty is expressed or implied , I am not a lawyer, etc etc etc.
This is not investing advice . Always do your own due diligence .

Indices Sector SigmaSpikes█ OVERVIEW
“The benchmark Dow Jones Industrial Average is off nearly 300 points as of midday today...”
“So what? Is that a lot or a little? Should we care?”
-Adam H Grimes-
This screener aims to provide Bird-Eye view across sector indices, to find which sector is having significant or 'out-of-norm' move in either direction.
The significance of the move is measured based on Sigma Spikes, a method proposed by Adam H. Grimes, where Standard Deviation of returns used as a baseline.
*You can google his blog or read his book, got some gold in there, especially on how he use indicators for trading
█ Understanding Sigma Spikes
As described by Grimes, moves in markets are only meaningful when we consider what “normal” is for that market.
Without that baseline, the daily change number, and even the percent change on the day doesn’t really mean much.
To overcome that problem, Sigma Spikes, as a measure of volatility, attempt to put todays change in price (aka return) in context of the standard deviation of 20 days daily's return.
Refer chart below:
1. The blue bars refer to each days return
2. The orange line is 1 time standard deviation of past 20days daily's return (today not included)
3. The red line is 2 time standard deviation of past 20days daily's return (today not included)
Using the ratio of today's return over the Std Deviation, determining your threshold (1,2,3,etc) will be the key that tells if today's move is significant or not.
*Threshold referring to times standard deviation, and different market may require different threshold.
*20 Days period are based on the Lookback Period, adjustable from user input window.
█ Features
- Scan up to 13 symbols at a time (Bursa (MYX) indices are defaulted, but you may change to any symbols/index from the user input setting)
█ Limitation
- Due to multiple use of security() function required to call other symbols, expect the screener to be slow at certain times
- Custom Timeframe currently accept only Daily and Weekly. I'll try to include lower timeframe in the next update
█ Disclaimer
Past performance is not an indicator of future results.
My opinions and research are my own and do not constitute financial advice in any way whatsoever.
Nothing published by me constitutes an investment recommendation, nor should any data or Content published by me be relied upon for any investment/trading activities.
I strongly recommends that you perform your own independent research and/or speak with a qualified investment professional before making any financial decisions.
Any ideas to further improve this indicator are welcome :)

gold price levels denominated in usd/gramsPlots the gold price (USD) for the quantities (grams) identified as support or resistance in the indicator settings. Default values are:
75 gold grams
300 gold grams
500 gold grams
1000 gold grams
5000 gold grams
More context: The purchasing power of Bitcoin

InariN CloudSInariN CloudS (INCS) is my custom model of InariN.
I usually use INCS in 300 ticks (other software) and 5 minutes charts for day trading.
Please read script "InariN simple" for basic usage.
I share background and fundamental ideas of day trading and INCS here.
I start with the practical conclusion and then explain INCS.
Maybe you'll notice that most indicators are unnecessary at the end of this text.
Anyway I compile fundamental ideas that I wanted to know as a beginner.
(I'll update to finish this text, please wait for some time.)
///Premise of trading///
Market's purpose...facilitating trading
Trader's purpose...making money
Market is stronger than trader and trader need adjust to market.
However trader have controllable side.
Market's control...Trend, Volatility
Trader's control...Money management, Making Risk:Reward, Choosing and exercising trading strategy
///Simple rule (Conclusion)///
I made simple rule "Just Do It Now" to check essential ideas on every trade.
Traders can use thousands of indicators but only use three choices "Buy, Sell and No trade".
If you have bad result, you had better suspect not your indicators but your three choices at first.
(This is one of the best advice I have ever heard by N jijii.)

Twin Range Filter Algo@Colinmck used two different ranges to generate signals. Read his release notes to find out what the original script does.
I added one condition which seems to increase performance on 15m BTCUSD as well as 1h BTCUSD and that is ATR with 32 periods being smaller than ATR with 64 periods. I used my script Volatility Optimiser to discover this tendency.
Both buying and selling conditions are same as in @Colinmck's script plus one condition of my own. You can disable my condition.
Target and stop-loss are manually set values in ticks.
Time stop-loss is manually set value in a number of candles. After this number of candles, a position always exits (or should 😇). You can disable it by inserting a very long period. I do not recommend it, because a value of indicator should not be measured in luck and if market starts moving in the direction after 40 periods, the predictive capability of an indicator is questionable.
I used 300/150/17 for 15m BTCUSD chart and 900/30/17 for 1h BTCUSD. I didn't try to optimize any other parameters for these periods.
Since this script relies mostly on volatility for its prediction, I wouldn't recommend using it on its own. Individual approach to the market is recommended. Also, it didn't work on EURUSD when using the same default values and different order management (tp, sl, time sl), so it is probably not as versatile.
Let me know what do you think of this strategy. If you have some ideas about how to make it more reliable, share it in the comments, I might put it to the test. Good luck 🍀

[RS]The Breakout IndicatorSignals when there is a breakout from the trading range(donchian channel up to 300 bars back).

Support Resistance - DynamicThis is Dynamic Support / Resistance script.
How it Works?
It finds Pivot Points and creates channels for each Pivot Point. Channel size is calculated by (Highest - Lowest) * %Channel_size in Loopback Period. After creating channels it calculates that how many Pivot Points in the channels. more Pivot Points in channel means stronger Support/Resistance. in the option menu there is S/R Strength, this is the minimum number of Pivot Points that each channel must contain to be S/R. calculation starts from last pivot point and go back for "loopback period" which is 300 by default. so last Pivot Points have more priority. Finally after calculating Support/Resistance it draws lines.
Number of Support/Resistance line is Dynamic and up to 20 lines, that means number of lines changes dynamically. you can see how the script puts Suppport/Resistance lines dynamically by "Replay" button. (if I have time I will try to put a video)
Currently the scripts checks up to 40 pivot points in loopback period. it shows up to 20 S/Rs only for visible area in the chart.
There is option to Show S/R lines as Solid, Dotted or Dashed.
Enjoy!

Price Streak Is Another Way to Spot TrendsPrice is never wrong, but sometimes reading it can be tricky.
Movements in the broader market or a sector can distract from a symbol that's been steadily trending in one direction or another. Sometimes the beginning of a move can also be so subtle that it flies under most people's radar.
Price Streak can help overcome these limitations by tracking consecutive up/down periods. It plots an easy-to-read color-coded histogram.
Because it simply counts the candles in a trend, Price Streak can give a clearer picture than magnitude-biased indicators like relative strength or MACD.
Applying Price Streak to the daily chart of Bitcoin Dominance , we find something very interesting right now: the longest drop since March 2017.
That moment in history, almost three years ago, marked the beginning of the last Altcoin bull market. Ethereum , for example, went from roughly $60 to over $1,300 in the following nine months.
While past performance isn't a guarantee of future results, this illustrates how sustained price moves can reveal changes in character.
Based on Price Streak's current reading, it may support the idea of another Altcoin cycle beginning now.

haddocks EMA Script5 exponential moving averages (EMA) in one indicator
EMA 21 black
EMA 55 blue
EMA 99 green
EMA 200 purple
EMA 300 red
EMA's are a powerfull tool to detect trends on all timeframes.
You can copy this script and modify it, if you want to use a differen selection of EMA's or colours.


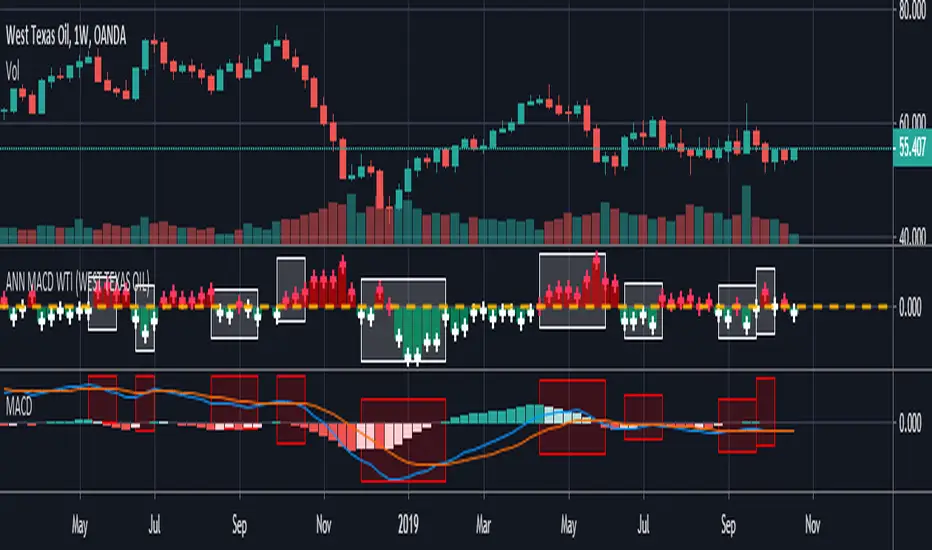
ANN MACD WTI (West Texas Intermediate) This script created by training WTI 4 hour data , 7 indicators and 12 Guppy Exponential Moving Averages.
Details :
Learning cycles: 1
AutoSave cycles: 100
Training error: 0.007593 ( Smaller than average target ! )
Input columns: 19
Output columns: 1
Excluded columns: 0
Training example rows: 300
Validating example rows: 0
Querying example rows: 0
Excluded example rows: 0
Duplicated example rows: 0
Input nodes connected: 19
Hidden layer 1 nodes: 2
Hidden layer 2 nodes: 6
Hidden layer 3 nodes: 0
Output nodes: 1
Learning rate: 0.7000
Momentum: 0.8000
Target error: 0.0100
Special thanks to wroclai for his great effort.
Deep learning series will continue. But I need to rest my eyes a little :)
Stay tuned ! Regards.
ANN MACD BRENT CRUDE OIL (UKOIL) This script trained with Brent Crude Oil data including 7 basic indicators and 12 Guppy Exponential Moving Averages .
Details :
Learning cycles: 1
Training error: 0.006591 ( Smaller than 0.01 ! )
AutoSave cycles: 100
Input columns: 19
Output columns: 1
Excluded columns: 0
Training example rows: 300
Validating example rows: 0
Querying example rows: 0
Excluded example rows: 0
Duplicated example rows: 0
Input nodes connected: 19
Hidden layer 1 nodes: 2
Hidden layer 2 nodes: 6
Hidden layer 3 nodes: 0
Output nodes: 1
Learning rate: 0.7000
Momentum: 0.8000
Target error: 0.0100
Note : Alerts added .
Special thanks to wroclai for his great effort.
Deep learning series will continue , stay tuned ! Regards.

ANN MACD GOLD (XAUUSD)This script aims to establish artificial neural networks with gold data.(4H)
Details :
Learning cycles: 329818
Training error: 0.012767 ( Slightly above average but negligible.)
Input columns: 19
Output columns: 1
Excluded columns: 0
Training example rows: 300
Validating example rows: 0
Querying example rows: 0
Excluded example rows: 0
Duplicated example rows: 0
Input nodes connected: 19
Hidden layer 1 nodes: 5
Hidden layer 2 nodes: 1
Hidden layer 3 nodes: 0
Output nodes: 1
Learning rate: 0.7000
Momentum: 0.8000
Target error: 0.0100
NOTE : Alarms added.
And special thanks to dear wroclai for his great effort.
Deep learning series will continue . Stay tuned! Regards.

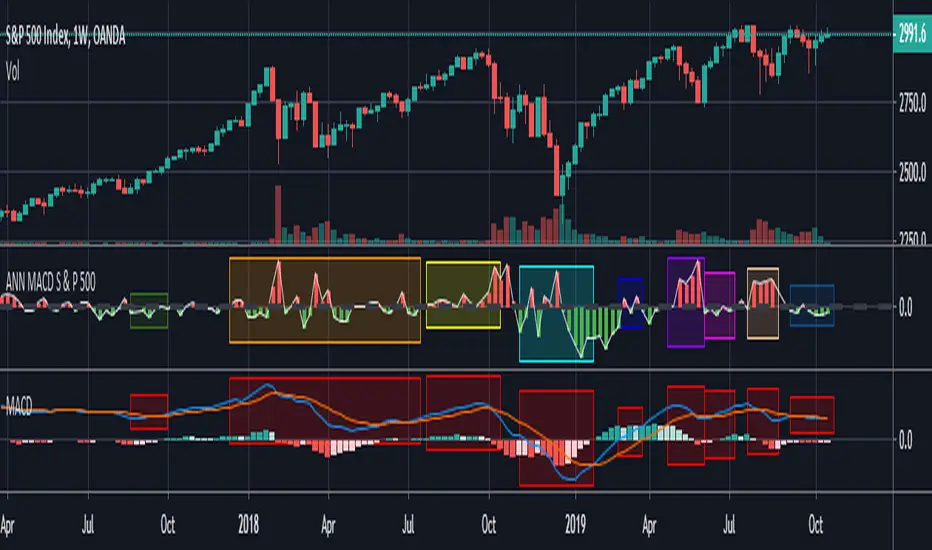
ANN MACD S&P 500 This script is formed by training the S & P 500 Index with various indicators. Details :
Learning cycles: 78089
AutoSave cycles: 100
Training error: 0.011650 (Far less than the target, but acceptable.)
Input columns: 19
Output columns: 1
Excluded columns: 0
Training example rows: 300
Validating example rows: 0
Querying example rows: 0
Excluded example rows: 0
Duplicated example rows: 0
Input nodes connected: 19
Hidden layer 1 nodes: 2
Hidden layer 2 nodes: 1
Hidden layer 3 nodes: 0
Output nodes: 1
Learning rate: 0.7000
Momentum: 0.8000
Target error: 0.0100
Note : Thanks for dear wroclai for his great effort .
Deep learning series will continue . Stay tuned! Regards.
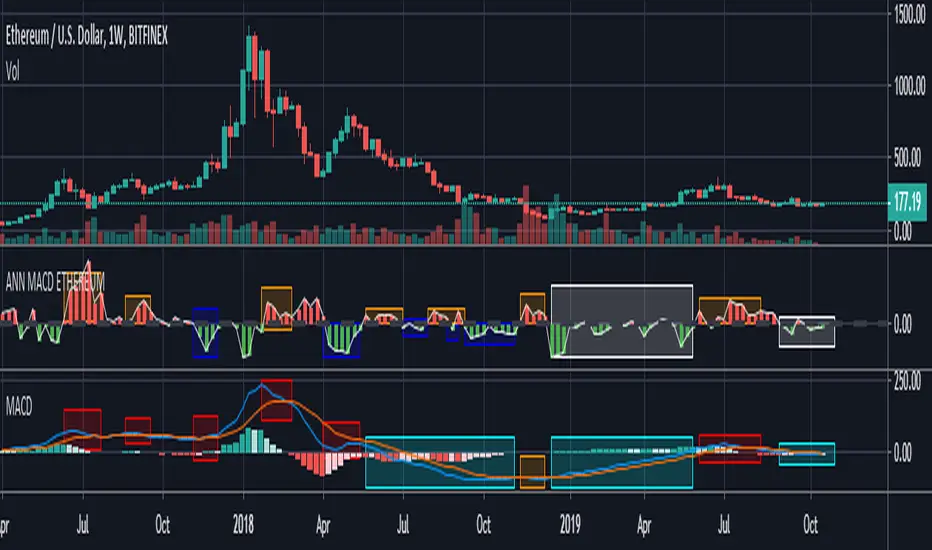
ANN MACD ETHEREUM
This script is trained with Ethereum (Timeframe : 4 hours ).
Details :
Input columns: 19
Output columns: 1
Excluded columns: 0
Training example rows: 300
Validating example rows: 0
Querying example rows: 0
Excluded example rows: 0
Duplicated example rows: 0
Input nodes connected: 19
Hidden layer 1 nodes: 8
Hidden layer 2 nodes: 1
Hidden layer 3 nodes: 0
Output nodes: 1
Learning rate: 0.7000
Momentum: 0.8000
Training error: 0.009378 ( That's a very good error coefficient. )
Many thanks to wroclai for help.
Deep learning series will continue!
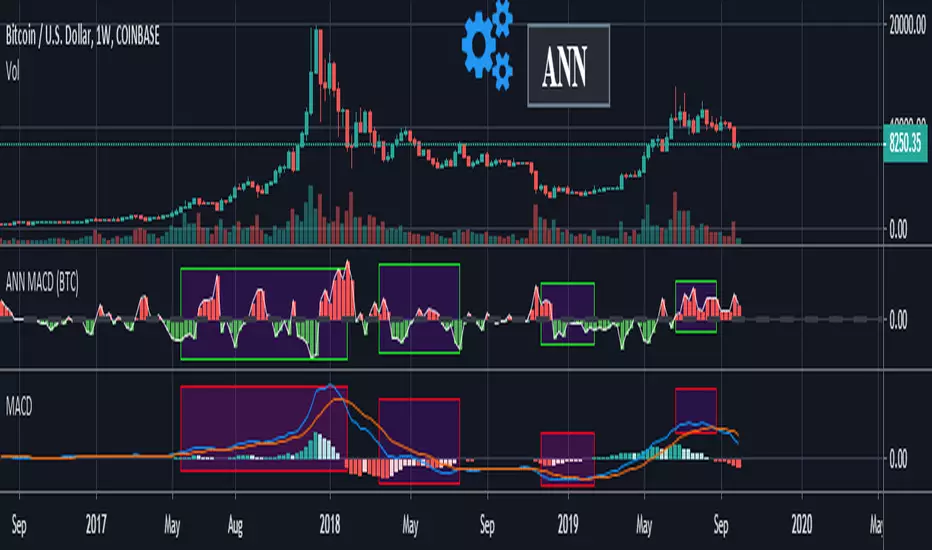
ANN MACD (BTC)
Logic is correct.
But I prefer to say experimental because the sample set is narrow. (300 columns)
Let's start:
6 inputs : Volume Change , Bollinger Low Band chg. , Bollinger Mid Band chg., Bollinger Up Band chg. , RSI change , MACD histogram change.
1 output : Future bar change (Historical)
Training timeframe : 15 mins (Analysis TF > 4 hours (My opinion))
Learning cycles : 337
Training error: 0.009999
Input columns: 6
Output columns: 1
Excluded columns: 0
Grid
Training example rows: 301
Validating example rows: 0
Querying example rows: 0
Excluded example rows: 0
Duplicated example rows: 0
Network
Input nodes connected: 6
Hidden layer 1 nodes: 8
Hidden layer 2 nodes: 0
Hidden layer 3 nodes: 0
Output nodes: 1
Learning rate : 0.6 Momentum : 0.8
More info :
EDIT : This code is open source under the MIT License. If you have any improvements or corrections to suggest, please send me a pull request via the github repository github.com