Entry Fragger - Strategy
For basic instructions please visit my other script "Entry Fragger".
The Signal Logic is explained there.
v1.4:
- Added advanced backtesting with fully customizable entries.
- Fully automated Buy Signals (profitable).
- Adjustable timeframes for signal logic. (requested)
Every setting affects the accuracy and profitability greatly now, based on settings applied.
The strategy performs best on high timeframes with larger capital and no leverage.
Useless for Forex, but absolutely smashes stocks and crypto on mid to high timeframes.
Please read through my other scripts description.
Set values as preferred and try your assets.
It does NOT work on low timeframes and forex!
Hint: BTC 4H, Custom Timeframe 1h, Moon Mode and Show Sell Signals enabled, R2R: 2.
Cari skrip untuk "volume"

Wunder False Breakout1. The basic concept for this strategy is to use false breakout logic based on price levels.
2. We will enter a trade when the price exhibits a false breakout, where it initially breaks a level but then reverses direction.
3. The main concept of this strategy is to capitalize on false breakouts of price levels. The strategy involves building levels based on the highs and lows over a certain period. When these price levels appear to break out but then reverse, we use these false breakouts as entry points. You can adjust the period to find setups that suit your trading pair and timeframe.
4. A function for calculating risk on the portfolio (your deposit) has been added to the Wunder False Breakout. When this option is enabled, you get a calculation of the entry amount in dollars relative to your Stop Loss. In the settings, you can select the risk percentage on your portfolio. The loss will be calculated from the amount that will be displayed on the chart.
5. For example, if your deposit is $1000 and you set the risk to 1%, with a Stop Loss of 5%, the entry volume will be $200. The loss at SL will be $10. 10$, which is your 1% risk or 1% of the deposit.
Important! The risk per trade must be less than the Stop Loss value. If the risk is greater than SL, then you should use leverage.
The amount of funds entering the trade is calculated in dollars. This option was created if you want to send the dollar amount from Tradingview to the exchange. However, putting your volume in dollars you get the incorrect net profit and drawdown indication in the backtest results, as TradingView calculates the backtest volume in contracts.
To display the correct net profit and drawdown values in Tradingview Backtest results, use the ”Volume in contract” option.

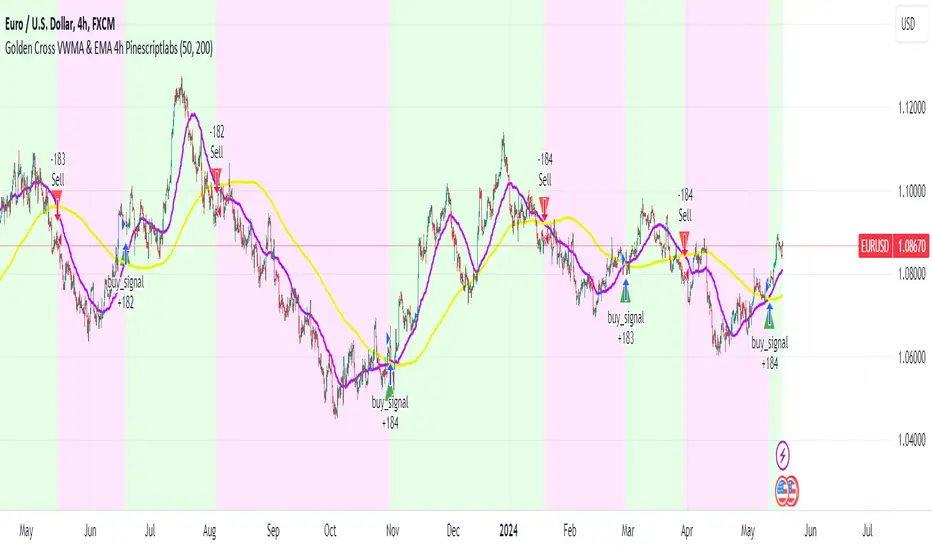
Golden Cross VWMA & EMA 4h PinescriptlabsThis strategy combines the 50-period Volume-Weighted Moving Average (VWMA) on the current timeframe with a 200-period Simple Moving Average (SMA) on the 4-hour timeframe. This combination of indicators with different characteristics and time horizons aims to identify strong and sustained trends across multiple timeframes.
The VWMA is a variant of the moving average that assigns greater weight to periods of higher volatility, helping to avoid misleading signals. On the other hand, the 4-hour SMA is used as an additional trend filter in a shorter-term horizon. By combining these two indicators, the strategy can leverage the strength of the VWMA to capture the main trend, but only when confirmed by the SMA in the lower timeframe.
Buy signals are generated when the VWMA crosses above the 4-hour SMA, indicating a potential bullish trend aligned in both timeframes. Sell signals occur on a bearish cross, suggesting a possible reversal of the main trend.
The default parameters are a 50-period VWMA and a 200-period 4-hour SMA. It is recommended to adjust these lengths according to the traded instrument and the desired timeframe. It is also crucial to use stop losses and profit targets to properly manage risk.
By combining indicators of different types and timeframes, this strategy aims to provide a more comprehensive view of trend strength.
Español:
Esta estrategia combina la Volume-Weighted Moving Average (VWMA) de 50 períodos en el timeframe actual con una Simple Moving Average (SMA) de 200 períodos en el timeframe de 4 horas. Esta combinación de indicadores de distinta naturaleza y horizontes temporales busca identificar tendencias fuertes y sostenidas en múltiples timeframes.
La VWMA es una variante de la media móvil que asigna mayor ponderación a los períodos de mayor volatilidad, lo que ayuda a evitar señales engañosas. Por otro lado, la SMA de 4 horas se utiliza como un filtro adicional de tendencia en un horizonte de corto plazo. Al combinar estos dos indicadores, la estrategia puede aprovechar la fortaleza de la VWMA para capturar la tendencia principal, pero sólo cuando es confirmada por la SMA en el timeframe menor.
Las señales de compra se generan cuando la VWMA cruza al alza la SMA de 4 horas, indicando una potencial tendencia alcista alineada en ambos horizontes temporales. Las señales de venta ocurren en el cruce bajista, sugiriendo una posible reversión de la tendencia principal.
Los parámetros predeterminados son: VWMA de 50 períodos y SMA de 4 horas de 200 períodos. Se recomienda ajustar estas longitudes según el instrumento operado y el horizonte temporal deseado. También es crucial utilizar stops y objetivos de ganancias para controlar adecuadamente el riesgo.
Al combinar indicadores de diferentes tipos y timeframes, esta estrategia busca brindar una visión más completa de la fuerza de la tendencia.
Channels With NVI Strategy [TradeDots]The "Channels With NVI Strategy" is a trading strategy that identifies oversold market instances during a bullish trading market. Specifically, the strategy integrates two principal indicators to deliver profitable opportunities, anticipating potential uptrends.
2 MAIN COMPONENTS
1. Channel Indicators: This strategy gives users the flexibility to choose between Bollinger Band Channels or Keltner Channels. This selection can be made straight from the settings, allowing the traders to adjust the tool according to their preferences and strategies.
2. Negative Volume Indicator (NVI): An indicator that calculates today's price rate of change, but only when today's trading volume is less than the previous day's. This functionality enables users to detect potential shifts in the trading volume with time and price.
ENTRY CONDITION
First, the assets price must drop below the lower band of the channel indicator.
Second, NVI must ascend above the exponential moving average line, signifying a possible flood of 'smart money' (large institutional investors or savvy traders), indicating an imminent price rally.
EXIT CONDITION
Exit conditions can be customized based on individual trading styles and risk tolerance levels. Traders can define their ideal take profit or stop loss percentages.
Moreover, the strategy also employs an NVI-based exit policy. Specifically, if the NVI dips under the exponential moving average – suggestive of a fading trading momentum, the strategy grants an exit call.
RISK DISCLAIMER
Trading entails substantial risk, and most day traders incur losses. All content, tools, scripts, articles, and education provided by TradeDots serve purely informational and educational purposes. Past performances are not definitive predictors of future results.

Wunder OI breakout1. The basic concept for this strategy is to breakout open interest levels.
2. Open interest indicates the total number of active positions in the market a sharp increase in which we will use to enter a trade.
3. The main concept of this strategy is to break open interest levels.The strategy is based on building levels based on the highs and lows over a certain period. The breakdown of the set levels is used for entry. You can change the period as well as the percentage of change in open interest to find setups based on your pair and timeframe.
4. A function for calculating risk on the portfolio (your deposit) has been added to the Wunder OI breakout. When this option is enabled, you get a calculation of the entry amount in dollars relative to your Stop Loss. In the settings, you can select the risk percentage on your portfolio. The loss will be calculated from the amount that will be displayed on the chart.
5. For example, if your deposit is $1000 and you set the risk to 1%, with a Stop Loss of 5%, the entry volume will be $200. The loss at SL will be $10. 10$, which is your 1% risk or 1% of the deposit.
Important! The risk per trade must be less than the Stop Loss value. If the risk is greater than SL, then you should use leverage.
The amount of funds entering the trade is calculated in dollars. This option was created if you want to send the dollar amount from Tradingview to the exchange. However, putting your volume in dollars you get the incorrect net profit and drawdown indication in the backtest results, as TradingView calculates the backtest volume in contracts.
To display the correct net profit and drawdown values in Tradingview Backtest results, use the ”Volume in contract” option.

NASDAQ 100 Peak Hours StrategyNASDAQ 100 Peak Hours Trading Strategy
Description
Our NASDAQ 100 Peak Hours Trading Strategy leverages a carefully designed algorithm to trade within specific hours of high market activity, particularly focusing on the first two hours of the trading session from 09:30 AM to 11:30 AM GMT-5. This period is identified for its increased volatility and liquidity, offering numerous trading opportunities.
The strategy incorporates a blend of technical indicators to identify entry and exit points for both long and short positions. These indicators include:
Exponential Moving Averages (EMAs) : A short-term 9-period EMA and a longer-term 21-period EMA to determine the market trend and momentum.
Relative Strength Index (RSI) : A 14-period RSI to gauge the market's momentum.
Average True Range (ATR) : A 14-period ATR to assess market volatility and to set dynamic stop losses and trailing stops.
Volume Weighted Average Price (VWAP) : To identify the market's average price weighted by volume, serving as a benchmark for the trading day.
Our strategy uniquely applies a volatility filter using the ATR, ensuring trades are only executed in conditions that favor our setup. Additionally, we consider the direction of the EMAs to confirm the market's trend before entering trades.
Originality and Usefulness
This strategy stands out by combining these indicators within the NASDAQ 100's peak hours, exploiting the specific market conditions that prevail during these times. The inclusion of a volatility filter and dynamic stop-loss mechanisms based on the ATR provides a robust method for managing risk.
By focusing on the early trading hours, the strategy aims to capture the initial market movements driven by overnight news and the opening rush, often characterized by higher volatility. This approach is particularly useful for traders looking to maximize gains from short-term fluctuations while limiting exposure to longer-term market uncertainty.
Strategy Results
To ensure the strategy's effectiveness and reliability, it has undergone rigorous backtesting over a significant dataset to produce a sample size of more than 100 trades. This testing phase helps in identifying the strategy's potential in various market conditions, its consistency, and its risk-to-reward ratio.
Our backtesting adheres to realistic trading conditions, accounting for slippage and commission to reflect actual trading scenarios accurately. The strategy is designed with a conservative approach to risk management, advising not to risk more than 5-10% of equity on a single trade. The default settings in the script align with these principles, ensuring that users can replicate our tested conditions.
Using the Strategy
The strategy is designed for simplicity and ease of use:
Trade Hours : Focuses on 09:30 AM to 11:30 AM GMT-5, during the NASDAQ 100's peak activity hours.
Entry Conditions : Trades are initiated based on the alignment of EMAs, RSI, VWAP, and the ATR's volatility filter within the designated time frame.
Exit Conditions : Includes dynamic trailing stops based on ATR, a predefined time exit strategy, and a trend reversal exit condition for risk management.
This script is a powerful tool for traders looking to leverage the NASDAQ 100's peak hours, providing a structured approach to navigating the early market hours with a robust set of criteria for making informed trading decisions.

BabyShark VWAP Strategy What the code does:
This Pine Script implements a trading strategy based on two indicators: Volume Weighted Average Price (VWAP) and On Balance Volume (OBV) Relative Strength Index (RSI). The strategy aims to identify potential buy and sell signals based on deviations from VWAP and OBV RSI crossing certain threshold levels.
How it does it:
**VWAP Calculation**: The script calculates the VWAP using either standard deviation or average deviation over a specified length. It then plots the VWAP and its upper and lower deviation bands.
**OBV RSI Calculation**: It computes the OBV and then calculates the RSI using the cumulative changes in OBV. The RSI is plotted and compared against predefined levels.
**Table Visibility and Occurrence Counting**: It allows the user to display a table showing the number of occurrences where the price is above Upper Dev 2, below Lower Dev 2, crosses above a higher RSI level, or crosses below a lower RSI level.
**Entries**: Long and short entry conditions are defined based on the position of the price relative to the VWAP deviation bands and the color of the OBV RSI. Entries are made when specific conditions are met, and there hasn't been a recent entry.
**Exit Conditions**: The script includes stop-loss and take-profit mechanisms. It exits positions based on price crossing the VWAP or a certain percentage, and it prevents further trading after a certain number of consecutive losses.
What traders can use it for:
**Trend Identification**: Traders can use the VWAP and its deviation bands to identify potential trend reversals or continuations.
**Volume Confirmation**: The inclusion of OBV RSI provides confirmation of price movements based on volume changes.
**Entry and Exit Signals**: The script generates buy and sell signals based on the specified conditions, allowing traders to enter and exit positions with defined stop-loss and take-profit levels.
**Statistical Analysis**: The visibility of occurrence counts in the table allows traders to perform statistical analysis on the frequency of price movements relative to the VWAP and OBV RSI levels.

Octopus Nest Strategy Hello Fellas,
Hereby, I come up with a popular strategy from YouTube called Octopus Nest Strategy. It is a no repaint, lower timeframe scalping strategy utilizing PSAR, EMA and TTM Squeeze.
The strategy considers these market factors:
PSAR -> Trend
EMA -> Trend
TTM Squeeze -> Momentum and Volatility by incorporating Bollinger Bands and Keltner Channels
Note: As you can see there is a potential improvement by incorporating volume.
What's Different Compared To The Original Strategy?
I added an option which allows users to use the Adaptive PSAR of @loxx, which will hopefully improve results sometimes.
Signals
Enter Long -> source above EMA 100, source crosses above PSAR and TTM Squeeze crosses above 0
Enter Short -> source below EMA 100, source crosses below PSAR and TTM Squeeze crosses below 0
Exit Long and Exit Short are triggered from the risk management. Thus, it will just exit on SL or TP.
Risk Management
"High Low Stop Loss" and "Automatic High Low Take Profit" are used here.
High Low Stop Loss: Utilizes the last high for short and the last low for long to calculate the stop loss level. The last high or low gets multiplied by the user-defined multiplicator and if no recent high or low was found it uses the backup multiplier.
Automatic High Low Take Profit: Utilizes the current stop loss level of "High Low Stop Loss" and gets calculated by the user-defined risk ratio.
Now, follows the bunch of knowledge for the more inexperienced readers.
PSAR: Parabolic Stop And Reverse; Developed by J. Welles Wilders and a classic trend reversal indicator.
The indicator works most effectively in trending markets where large price moves allow traders to capture significant gains. When a security’s price is range-bound, the indicator will constantly be reversing, resulting in multiple low-profit or losing trades.
TTM Squeeze: TTM Squeeze is a volatility and momentum indicator introduced by John Carter of Trade the Markets (now Simpler Trading), which capitalizes on the tendency for price to break out strongly after consolidating in a tight trading range.
The volatility component of the TTM Squeeze indicator measures price compression using Bollinger Bands and Keltner Channels. If the Bollinger Bands are completely enclosed within the Keltner Channels, that indicates a period of very low volatility. This state is known as the squeeze. When the Bollinger Bands expand and move back outside of the Keltner Channel, the squeeze is said to have “fired”: volatility increases and prices are likely to break out of that tight trading range in one direction or the other. The on/off state of the squeeze is shown with small dots on the zero line of the indicator: red dots indicate the squeeze is on, and green dots indicate the squeeze is off.
EMA: Exponential Moving Average; Like a simple moving average, but with exponential weighting of the input data.
Don't forget to check out the settings and keep it up.
Best regards,
simwai
---
Credits to:
@loxx
@Bjorgum
@Greeny

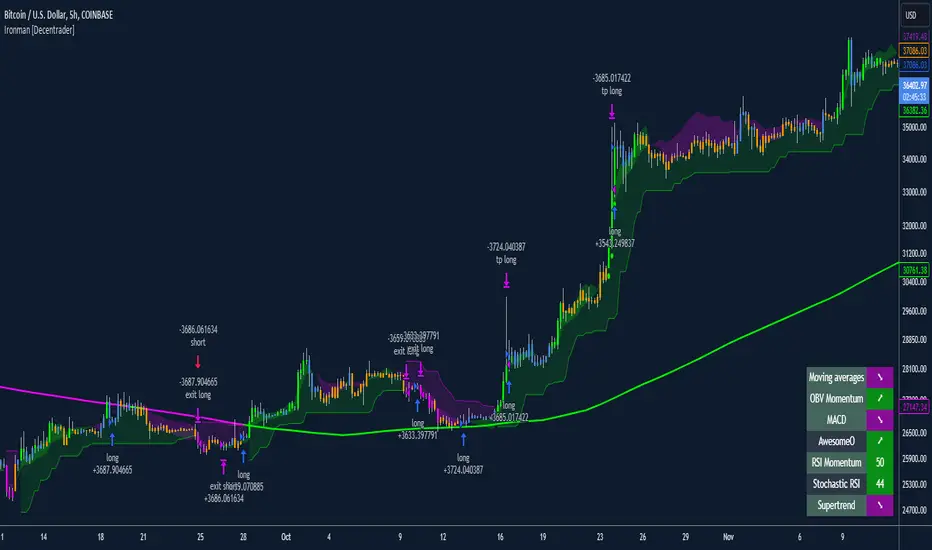
Ironman [Decentrader]Ironman
What is it? how it does it? And how to use it:
i) Ironman is a multifaceted strategy builder, which uses coloured candles which represent certain customisable inputs being in confluence with one another and the set scenario.
ii) There are 7 customised technical indicators which can be input as a basis for the analytical review.
iii) Determine a primary indicator which dictates a bullish or bearish trend (and colour) and then optionally add up to 6 other indicators to be required to be in confluence which adds another colour to be represented.
An example might be two moving averages crossing as the main trend determination. The primary determinant is dictated as the trend being “bullish or bearish” and the added confluence adds an additional layer being “very bullish or very bearish”
iv) Users select which conditions they wish to enter and exit trades on using the Bullish / Very Bullish and Bearish / Very Bearish settings. This can be combined with other timeframes.
v) The selected inputs for each indicator will show in a table contained in the bottom right-hand corner. Active indicators within the system will be highlighted.
vi) Ironman is built to include various take profit and stop loss options such as trailing stops, and fixed percentage targets which can be included in the strategy. Different timeframes can be used to determine the stop if users wish to do so.
vii) Users can require that there is also confluence with a differing time period or choose long and short-only options which can be dictated independently or based upon filtering criteria using moving averages.
viii) Using the strategy settings, users are also able to choose backtesting periods.
ix) Position label settings allow users to show various backtesting options such as profit by position, total backtesting results and results for the active position.
x) Ironman enables users to automate trading easily using the input boxes under Alert messages which also allows connection to a third party which can conduct execution. Always make sure to thoroughly test the strategy if it is being automated.
xi) To get the best out of Ironman, build up a strategy for the timeframe and asset you are looking at and back-test outcomes as variables are layered in. Ensure to backtest over a suitable length of time.
xii) When optimising input variables, it can sometimes visually assist in having the underlying inputs on the screen via the standard indicators.
xiii) There are many boxes of information in the input variables, which explain how to use each part. Users can also add features such as a marker showing on the chart where all indicators are bullish/bearish, or where RSI is overbought / over sold.
xiv) Users can further customise the style of the tool under the style tab in the indicator settings.
Indian NIFTY Correlation Daytrade/Swing StrategyINTRODUCTION :
This is a daytrading/swing strategy designed mainly for indian market where internally has been adapted to NIFTY market and as well using for internal calculations the values of the candles from NIFTY asset.
With it we search to use with the most correlated asset from the indian market.
For this example I choosed BANKNIFTY
STRATEGY:
The strategy initially uses as candle values the data from the NIFTY asset.
With them I am dividing the work into two calculation parts such as :
-For first part logic, I am doing calculations regarding the volatility of NIFTY, where I initially take into consideration INDIAVIX to have an idea of the expected implied volatility of NIFTY asset and then I compare it with different tools such as ATR, BB and Percentile location of the volatility.
Based on all these factors I take into account the location of the volatility which is atm and if there is a possibility of a strong movement(trend) or sidemarket situation.
-Once I am done with the values of the volatility, the next process in the script logic is to start looking into the trend.
For it I am using different tools such as volume checker, support and resistence key points, pivot points, price actions patterns and different moving averages.
-Risk management part : once we are done with calculation for the entry, the next part is to have an idea where to exit. In this case I am making use of a dynamic risk management which is compressed from multiple ideas such as : we can exit if there were a big gap on the next day in our initial direction, we can also exit based of an internal daily ATR calculation value(we use initially 15min timeframe chart) and lastly if we are around some key points like support/resistence or other different chart patterns like double top, double bot and so on.
CASE EXAMPLE:
As I said before we are initially using for calculation the NIFTY chart with 15min timeframe. With it we can apply to any indian etf,stocks,future. All the assets are going to have the same time of entry and the same time of exit(we get this from NIFTY) and we plot it on the chart we are using, so its key point to look for assets which have a min 75-80% correlation with NIFTY. For this example I used BANKNIFTY chart.
So a type of entry would be this way
Lets assume NIFTY50 is on 19.000 level
INDIAVIX level is currently at 11 which can be translated : 11 / sqrt(250)
So 11 means that on a yearly base we expect the asset to move 11% upwards or downwards
and in a year we have aprox 250 days. So we divide the 11 by sqrt of 250 to get an idea of a daily expected move from the implied volatility of india VIX
11/15.87 = +-0.69%
So INDIAVIX tells us that the values for today nifty is 19000+0,69% and 19000-0.69%
After that I am looking into the daily ATR, and I see that the expected is around 0.8% and is ascending over the last 2 weeks.
Lastly I am looking at the percentile which is currently the volatility on both ATR and INDIAVIX, and I get a value of 90th percentile.
With this my biased is that we are going to expect a short trend, but i cant confirm on the volatility alone so next step is start looking into technical analysis.
I look at volume and is increasing, I look at different price actions paterns and pivots and I see a lower low and a lower high (a descending pattern).
I also see the price is below the key MA like SMA50/100/200, VWAP and so on.
With all of this I get more confirmation that the asset is in a short trend.
Internally once a certain specific % of confirmation from all the logics is achieved, it will trigger a long/short entry, so in this case lets assume we have 80% of our indicators pointing to the short, is going to enter a short.
Now for a long scenario the scene would be , indiavix is around 9,5, ATR is descending. We are around 40th percentile of the volatility.
Our asset is above multiple moving averages, vwap , etc
We have an increasing volume towards bullish side.
And so on( overall 75% of our indicators are pointing towards the long side)
Now for the exit, since we are dealing with a daytrade/swing mentality, short on average we keep the trade open for a less period of time than long ( 19 bars of 15min candles, compared to 57 bars of 15min for long) , so most of the times for short we are going to exit next day and if the trend is still in our favour we re enter the trade.
For long we can stay much more time, sometimes even weeks and we exit mainly when the % of confirmation of indicators point out a reversal/short confirmation fo a big pice action pattern.
STRATEGY RESULTS
For strategy analysis I have used BANKNIFTY NSE with deep history to get access to data from 2011 until present( giving more than 2500 trades) .
For inputs I am using 0.02% comission total ( the comission applied from ZERODHA indian exchange is close to 0.0175% total) so I used it a bit higher in order to take into account some slippages.
For capital THE REASON I USED 100% of the capital allocation is to make a proper comparison with the buy an hold from the same period
Lets assume we had an account of 1M ruppes initially in 2011, we start using 100% of it and then the new values automatically compounded with the new profits and losses so directly compare with 1M of rupees in shares on BANKNIFTY ETFs bought in 2011(buy n hold) until present day.
STRATEGY ACCESS
Strategy is free to be tested for everyone, just let me know in private that you wish to get access to it.

Heikin Ashi Smoothed Buy Sell with Filters Backtest What is the Heikin Ashi Smoothed Buy Sell with Filters Backtest ?
It is the backtesting version of the Heikin Ashi Smoothed Buy Sell with Filters indicator.
This Pine Script code defines a complex indicator used to determine buy-sell signals on financial charts. The indicator operates based on the smoothed version of Heikin Ashi and is fortified with various filters.
1. Parameters and Settings:
At the start of the code, there are a series of input parameters for the user to customize the indicator. These parameters include:
Trend Filter: Checks whether it is above or below the long-term moving average.
Momentum Filter: Uses the RSI (Relative Strength Index) indicator to check if the market is overbought or oversold.
Volatility Filter: Evaluates the market's volatility level using the ATR (Average True Range) indicator.
Volume Filters: Uses various volume-related parameters to measure the strength of the trade signal.
Trade Settings: Specifies percentage values for target and stop-loss levels to be used in trading.
Moving Average Settings: Allows you to select which moving average to use and its duration.
2. Heikin Ashi Smoothed Calculations:
Heikin Ashi is a charting method used to more clearly represent price movements. The smoothed Heikin Ashi ensures smoother price movements.
3. Moving Average Calculations:
The indicator contains a function to calculate different types of moving averages. These moving averages are used to determine the market trend.
4. Filters:
This indicator includes a series of filters to enhance the quality of the signal. Filters help reduce false signals and produce more robust trading signals.
5. Buy-Sell Signals:
All these filters and calculations are brought together to determine potential buy and sell signals. Signals are triggered when all the specified conditions are met.
6. Chart Visualizations:
This indicator uses various plotting functions to visualize signals and trend information on the chart. This allows the user to easily see signals and the trend on the chart.
7. Trade Settings:
When buy and sell signals are triggered, this section checks if it has reached the specified targets and stop-loss levels.
8. Alerts:
This indicator also sends alerts to the user when specific conditions are met. This ensures that the user doesn't miss potential trading opportunities.
In conclusion, this Pine Script indicator produces buy-sell signals by analyzing market movements and applying various filters. Based on the smoothed version of Heikin Ashi, this indicator is useful for trend followers and is fortified with various filters, thus enhancing the quality of trading signals.
Heikin Ashi Smoothed Buy Sell with Filters Backtest Nedir?
Heikin Ashi Smoothed Buy Sell with Filters indikatörünün backtest yapan versiyonudur
Bu Pine Script kodu, finansal grafiklerde al-sat sinyallerini belirlemek için kullanılan karmaşık bir göstergeyi tanımlar. Gösterge, Heikin Ashi'nin yumuşatılmış sürümünü temel alarak çalışır ve çeşitli filtrelerle güçlendirilmiştir.
1. Parametreler ve Ayarlar:
Kodun başlangıcında, kullanıcının göstergeyi kişiselleştirmesi için bir dizi giriş parametresi bulunmaktadır. Bu parametreler şunları içerir:
Trend Filtresi: Uzun vadeli hareketli ortalamanın üstünde veya altında olup olmadığını kontrol eder.
Momentum Filtresi: RSI (Göreceli Güç Endeksi) göstergesini kullanarak piyasanın aşırı alım veya aşırı satım durumunu kontrol eder.
Oynaklık Filtresi: ATR (Ortalama Gerçek Aralık) göstergesi ile piyasanın oynaklık seviyesini değerlendirir.
Hacim Filtreleri: Ticaret sinyalinin gücünü ölçmek için hacimle ilgili çeşitli parametreleri kullanır.
Ticaret Ayarları: Ticarette kullanılacak hedef ve stop-loss seviyeleri için yüzdelik değerleri belirtir.
Hareketli Ortalama Ayarları: Hangi hareketli ortalamayı kullanacağınızı ve bu ortalamanın süresini seçmenizi sağlar.
2. Heikin Ashi Yumuşatılmış Hesaplamaları:
Heikin Ashi, fiyat hareketlerini daha net bir şekilde göstermek için kullanılan bir grafikleme yöntemidir. Yumuşatılmış Heikin Ashi, fiyat hareketlerinin daha pürüzsüz olmasını sağlar.
3. Hareketli Ortalama Hesaplamaları:
Gösterge, farklı türde hareketli ortalamaları hesaplamak için bir fonksiyon içerir. Bu hareketli ortalamalar, piyasa trendini belirlemek için kullanılır.
4. Filtreler:
Bu gösterge, sinyal kalitesini artırmak için bir dizi filtre içerir. Filtreler, yanlış sinyalleri azaltmaya yardımcı olur ve daha sağlam ticaret sinyalleri üretir.
5. Al-Sat Sinyalleri:
Tüm bu filtreler ve hesaplamalar, potansiyel al ve sat sinyallerini belirlemek için bir araya getirilir. Sinyaller, belirlenen koşulların tümü karşılandığında tetiklenir.
6. Grafik Görselleştirmeleri:
Bu gösterge, sinyalleri ve trend bilgisini grafik üzerinde görselleştirmek için çeşitli çizim fonksiyonları kullanır. Bu, kullanıcının grafik üzerinde kolayca sinyalleri ve trendi görmesini sağlar.
7. Ticaret Ayarları:
Alış ve satış sinyalleri tetiklendiğinde, bu bölüm belirlenen hedeflere ve stop-loss seviyelerine ulaşıp ulaşmadığını kontrol eder.
8. Uyarılar:
Bu gösterge ayrıca, belirli koşullar karşılandığında kullanıcıya uyarı gönderir. Bu, kullanıcının potansiyel ticaret fırsatlarını kaçırmamasını sağlar.
Sonuç olarak, bu Pine Script göstergesi, piyasa hareketlerini analiz ederek ve çeşitli filtreleri uygulayarak al-sat sinyalleri üretir. Heikin Ashi'nin yumuşatılmış sürümüne dayanan bu gösterge, trend takipçileri için kullanışlıdır ve çeşitli filtrelerle güçlendirilmiştir, böylece ticaret sinyallerinin kalitesi artar.

RSI Box Strategy (pseudo- Grid Bot)This is a strategy intended primarily for algorithmic traders. It's a pseudo-grid bot that uses a dynamic, volume-weighted grid that only updates when the RSI meets certain conditions. It's also a breakout strategy, whereas normal grid bots are not (typical grid bots sell when a higher grid is reached, whereas this strategy sells when a lower grid is breached under specific conditions). This strategy also sells 100% of pyramiding orders on close.
In a nutshell, the strategy updates its grid to the volume-weighted highest/lowest values of your given source ("src" in the settings) each time that there is a RSI crossunder/crossover. From this range it produces an evenly-spaced grid of five lines, and uses the current source to determine which grid line is closest to the source. Then, if the source crosses over the line directly above the current line, it enters a buy order. If the source crosses under the line directly below the current line, it enters a sell order.
You can configure shorts, source, RSI length, and overbought/oversold levels in the settings.
For the strategy results below: fees are at 0.1% per trade, with order size 1% of equity and a max pyramiding value of 33. For a greater R/R profile, you can increase the order size, which will increase drawdown but potentially yield better results.

[Round Numbers] Signal Clean Up Analysis with Backtest (TSO)Round Numbers NEW GEN indicator!
===========================================================================
===========================================================================
This is a full-cycle trading system indicator - it will show and alert each step of the trade from open to close. The algorithm here uses Round Numbers for generating signals, TP (Take Profit) and SL (Stop Loss) levels. Round numbers play big role in trading and can easily become strong support and resistance levels where price can bounce and go the opposite way or go through with a very nice run afterwards.
In addition there is a chained (NOTE: You can select several or ALL of the features, this is not limited to either one) signal cleanup and analysis approach with scheduling and alerting capabilities. Works with most popular timeframes: 1M, 3M, 5M, 15M, 30M, 1H, 4H, D.
NOTE: Every action of the trade is calculated on a confirmed closed candle bar state (barstate.isconfirmed), so the indicator will never repaint!
NOTE: At position open - there will be calculated Take-Profit and Stop-Loss targets, however each target is considered hit, when candle bar closes breaking that target, so Take-Profit and Stop-Loss when hit will slightly differ then what you see at trade/position open.
===========================================================================
===========================================================================
Round Numbers up|down unit setting and overall explanation
---------------------------------------------------------------------------
Round Number up|down unit: is the distance between round numbers on the chart. Since these round number levels are also used by the algorithm to open/close trades, it is important to set this setting to a logical number, which will correspond to an average price movement of the instrument.
Here are some examples for a few popular instruments on what will the default 1 round number unit correspond to and what would be suggested:
BTCUSD > $1 (this won't work for Bitcoin, try at least $100 - 100units)
SPY: > $1 (one of the best settings for SPY or QQQ, 50cents shows good results as well - 0.5units)
FOREX (all major pairs): > 10PIPs (that may be a bit small, unless scalping, try 50PIPs - 5units)
===========================================================================
===========================================================================
Explanation of all the Features | Strategy Configuration Guide | Indicator Settings | Signal Cleanup Analysis
---------------------------------------------------------------------------
>>> Customizable Backtesting for a specific date range, results via TradingView strategy, which includes “Deep Backtesting” for largest amounts of data on trading results.
>>> Trading Schedule with customizable trading daily time range, automatic closing/alert trades before Power Hour or right before market closes or leave it open until next day.
>>> 3 Trading Systems.
>>> Static/Dynamic/Trailing Take-Profit and Stop-Loss setups (HIGHLIGHT: Stop-Loss will be moved to Entry after TP1 is taken or a smart trailing Stop-Loss can be used with Stop-Loss dynamically following the trade to minimize risk).
>>> Single or Multiple profit targets (up to 5).
>>> Take-Profit customizable offset feature (set your Take-Profit targets slightly before everyone is expecting it!).
>>> Candle bar signal analysis (matching candle color, skip opposite structured and/or doji candle uncertain signals).
>>> Additional analysis of VWAP/EMA/ATR/EWO (Elliot Wave Oscillator)/Divergence MACD+RSI/Volume signal confirmation (clean up your chart with indicator showing only the best potential signals!).
>>> Advanced Alerts setup, which can be potentially setup with a trading bot over TradingView Webhook (NOTE: This will require advanced programming knowledge).
===========================================================================
Labels, plots, colors explanations:
---------------------------------------------------------------------------
>>>>> LONG open: green "house" looking arrow below candle bar.
>>>>> SHORT open: red "house" looking arrow above candle bar.
>>>>> LONG/SHORT take-profit target: green/red circles (multi-profit > TP2/3/4/5 smaller circles).
>>>>> LONG/SHORT stop-loss target: green/red + crosses.
>>>>> LONG/SHORT take-profit hits: green/red diamonds.
>>>>> LONG/SHORT stop-loss hits: green/red X-crosses.
>>>>> LONG/SHORT EOD (End of Day | Intraday style) close (profitable trade): green/red squares.
>>>>> LONG/SHORT EOD (End of Day | Intraday style) close (loss trade): green/red PLUS(+)-crosses.
===========================================================================
Date Range and Trading Schedule Settings
---------------------------------------------------------------------------
>>>>> Date Range: Select your start and/or end dates (uncheck “End” for indicator to show results up to the very moment and to use for LIVE trading) for backtesting results, if not using backtesting – uncheck “Start”/“End” to turn it off.
>>>>> Use TradingView “Strategy Tester” to see backtesting results
NOTE: If Strategy Tester does not show any results with Date Ranged fully unchecked, there may be an issue where a script opens a trade, but there is not enough TradingView power to set the Take-Profit and Stop-Loss and somehow an open trade gets stuck and never closes, so there are “no trades present”. In such case you will need to manually check “Start”/“End” dates or use “Depp Backtesting” feature!
>>>>> Trading Schedule: This is where you can setup Intraday Session or any custom session schedule you wish. Turn it ON. Select trading hours. Select EOD (End of Day) setting (NOTE: If it will be OFF, the indicator will assume you are holding your position open until next day!). Please note the EOD trade closure times with the 2 different Intraday close settings when turned on:
At Market Close:
1/3/5min > will close at 15:55pm ET
15min > will close at 15:45pm ET
30min > will close at 15:30pm ET
45min > will close at 15:45pm ET
60min > will close at 15:00pm ET
Before Power Hour:
1/3/5min > will close at 15:00pm ET
15min > will close at 15:00pm ET
30min > will close at 15:00pm ET
45min > will close at 15:00pm ET
60min > will close at 15:00pm ET
>>> Trading Systems: 1) "Open Until Closed by TP or SL": the signal will only open a trade if no trades are currently open/trunning, a trade can only be closed by Take Profit, Stop Loss or End of Day close (if turned on) | 2) "Open Until Closed by TP or SL + OCA": Same as 1), but if there is an opposite signal to the trade which is currently open > it will immediately be closed with new trade open or End of Day close (if turned on) | 3) "OCA (no TP or SL)": There are is Take Profit or Stop Loss, only an opposite signal will close current trade and open an opposite one or End of Day close (if turned on).
>>> Turn On/Off: Current Position SL + Opposite Position Open Signal on the same closing candle bar (If current trade hits Stop-Loss and at that same closing candle bar there is a signal for an opposite direction trade > indicator will close current position as Stop-Loss and immediately open an opposite position). NOTE: With this option turned on, there will be more trades, but not necessarily better results, since after Stop-Loss is hit, it may make sense to wait a little before opening an opposite trade, even if it matches the condition at the same time when Stop-Loss is hit, but sometimes it shows great results, so this setting/feature is included. NOTE: This setting only will work/make sense with TP and SL style/behavior both be set to "Fully Closed Candle"!
>>> Turn On/Off: Turn On/Off: Current Position REGULAR SL | Only the SL + Opposite Position Open will trigger if turned on, IF NOT - THERE WILL BE NO STOP-LOSS AT ALL!!! NOTE: It is very dangerous to trade without Stop-Loss!
>>>>> Signal Candle Bar consuming Take-Profits - position/trade signal candle bar is big enough to "consume"/close ahead the first TP setting > the signal can either be skipped, or all Take-Profit areas pushed ahead using smart formula)
>>>>> MULTIPROFIT | TP (Take-Profit) System: 1) Static – Once the trade is open, all Take-Profit target(s) are immediately calculated and set for the trade > once the target(s) is hit > trade will be partially closed (if candle bar closes beyond several Take-Profit targets > trade will be reduced accordingly to the amount of how many Take-Profit targets were hit) ||| 2) Dynamic – Once the trade is open, only the 1st Take-Profit target is calculated, once the 1st Take-Profit is hit > next Take-Profit distance is calculated based on the distance from trade Entry to where 1st Take-Profit was taken, once 2nd Take-Profit is taken > 3rd Take-Profit is calculated per same logic, these are good for price momentum as with price speeding up – profits increase as well!
>>>>> MULTIPROFIT: SL (stop loss) System | Static: SL is set at position open and remains such; Dynamic: Once ANY TP is taken > SL will be moved to Entry; Trailing: SL will be moved along the position (smart trailing stop-loss), at TP1 taken > SL moves to Entry, at TP2 taken > SL moves to TP1, at TP3 taken > SL moves to TP2 and so on.
>>>>> # of TPs (number of take profit targets): Just like it is named, this is where you select the number of Take-Profit targets for your trading system (NOTE: If "OCA (no TP or SL)" Trading System is selected, this setting won’t do anything, since there are no TP or SLs for that system).
>>>>> TP(s) offset: This is a special feature for all Take-Profit targets, where you can turn on a customizable offset, so that if the price is almost hitting the Take-Profit target, but never actually touches it > you will capture it. This is good to use with HHLL (Highest High Lowest Low), which is pretty much a Support/Resistance as often the price will nearly touch these strong areas and turn around…
===========================================================================
Dynamic/Static/Trailing Take-Profit and Stop-Loss visual examples:
---------------------------------------------------------------------------
1) Fully Static Take-Profit and Stop-Loss
This one is a fully static setup for both Take-Profit and Stop-Loss, you can also observe how trade is closed right before the Power Hour (trade can be closed right before Power Hour or right before Market Closes or left overnight as desired).
2) Static/Dynamic, Static Take-Profit and Dynamic Stop-Loss
You can see a static Take-Profit set at position open, while Stop-Loss moves to Entry once TP1 target is taken.
3) Static/Trailing, Static Take-Profit and Trailing Stop-Loss
In here with each Take-Profit taken, Stop-Loss moves along the trade to previous Take-Profit level, you can notice how stop-loss literally follows the trade and reduces the potential loss.
4) Dynamic/Trailing, Dynamic Take-Profit and Trailing Stop-Loss
See how Take-Profit distances increase with price momentum. Just like in previous example - Trailing Stop-Loss is following the trade and reducing the riks.
===========================================================================
Signal Analysis and Cleanup Settings
---------------------------------------------------------------------------
>>>>> Candle Analysis | Candle Color signal confirmation: If closed candle bar color does not match the signal direction > no trade will be open.
>>>>> Candle Analysis | Skip opposite candle signals: If closed candle bar color will match the signal direction, but candle structure will be opposite (for example: bearish green hammer, long high stick on top of a small green square) > no trade will be open.
>>>>> Candle Analysis | Skip doji candle signals: If closed candle bar will be the uncertain doji > no trade will be open.
>>>>> Divergence/Oscillator Analysis | EWO (Elliot Wave Oscillator) signal confirmation: LONG will only be open if at signal, EWO is green or will be at bullish slope (you can select which setting you desire), SHORT if EWO is red or will be at bearish slope.
>>>>> Divergence/Oscillator Analysis | VWAP signal confirmation: LONG will only be open if at signal, the price will be above VWAP, SHORT if below.
>>>>> Divergence/Oscillator Analysis | Moving Average signal confirmation: LONG will only be open if at signal, the price will be above selected Moving Average, SHORT if below.
>>>>> Divergence/Oscillator Analysis | ATR signal confirmation: LONG will only be open if at signal, the price will be above ATR, SHORT if below.
>>>>> Divergence/Oscillator Analysis | RSI + MACD signal confirmation: LONG will only be open if at signal, RSI + MACD will be bullish, SHORT if RSI + MACD will be bearish.
>>>>> Volume signal confirmation: LONG/SHORT will only be opened with strong Volume matching the signal direction, by default, strong Volume percentage is set to 150% and weak to 50%, but you can change it as you desire.
===========================================================================
||||||||||||||||||||||||||||||||||| *** ||||||||||||||||||||||||||||||||||| *** |||||||||||||||||||||||||||||||||||
||||||||||||||||||||||||||||||||||| *** ||||||||||||||||||||||||||||||||||| *** |||||||||||||||||||||||||||||||||||
TP System - VERY IMPORTANT INFO!
-------------------------------------------------------------------------------------------------------------------
"TP PERCENTAGE" - amount by which current trade/position needs to be reduced/partially closed/sold.
-------------------------------------------------------------------------------------------------------------------
TP System: Dynamic
"TP PERCENTAGE" - will always be the same amount (trade/position size divided by the # of take-profit(TP) targets) and percentage to be closed will always be of the ORIGINAL trade/position.
-------------------------------------------------------------------------------------------------------------------
TP System: Static
"TP PERCENTAGE" - will always be the same amount IF take-profit(TP) targets are hit 1-by-1 (TP1 > TP2 > TP3 > TP4 > TP5), otherwise it will vary and unless it is a 1st take-profit(TP1), the REMAINING trade/position size will always be smaller than original and therefore the percentage to be closed will always be of the REMAINING trade/position and NOT the original one!
-------------------------------------------------------------------------------------------------------------------
"TP PERCENTAGE" CheatSheet (these are the only percentages you may see)
-----------------------------------------------------------------------
TP PERCENTAGE---Close/Sell Amount-------------Example (trade size: 50 stocks)
20%-------------trade size * 0.2--------------50 * 0.2 = 10 stocks
25%-------------trade size * 0.25-------------50 * 0.25 = 12.5(~13) stocks
34%-------------trade size * 0.34-------------50 * 0.34 = 17 stocks
40%-------------trade size * 0.4--------------50 * 0.4 = 20 stocks
50%-------------trade size * 0.5--------------50 * 0.5 = 25 stocks
60%-------------trade size * 0.6--------------50 * 0.6 = 30 stocks
66%-------------trade size * 0.66-------------50 * 0.66 = 33 stocks
75%-------------trade size * 0.75-------------50 * 0.75 = 37.5(~38) stocks
80%-------------trade size * 0.8--------------50 * 0.8 = 40 stocks
100%------------trade size--------------------50 = 50 stocks
-----------------------------------------------------------------------
If for any reason a portion of the current/remaining trade closed at such occurrence was slightly wrong, it is not an issue. Such occurrences are rare and with slight difference in partial TP closed is not significant to overall performance of our algorithms.
||||||||||||||||||||||||||||||||||| *** ||||||||||||||||||||||||||||||||||| *** |||||||||||||||||||||||||||||||||||
||||||||||||||||||||||||||||||||||| *** ||||||||||||||||||||||||||||||||||| *** |||||||||||||||||||||||||||||||||||
Alert Settings (you don’t have to touch this section unless you will be using TradingView alerts through a Webhook to use with trading bot)
---------------------------------------------------------------------------
Here is how a LONG OPEN alert looks like.
NOTE: Each label , , etc. is customizable, you can change the text of it within indicator Input settings.
ALERT >>>>>>>>>>>>>>>>>>>>>>>>>>>>>>>>>>>>>>>>>>>>>>>
COIN: BTCUSD
TIMEFRAME: 15M
LONG: OPEN
ENTRY: 20000
TP1: 20500
TP2: 21000
TP3: 21500
TP4: 22500
TP5: 23500
SL: 19000
Leverage: 0
---------------------------------------------------------------------------
Here is how a TP1 alert will look with 5 TPs breakdown of the trade.
NOTE1: Next to TP1 taken it will show at which price it was triggered.
NOTE2: Next to "TP Percentage" it shows how much of the CURRENT/ACTIVE/REMAINING trade needs to be closed.
NOTE2: If TP2/3/4/5 comes before TP1 - the alert will tell you exactly how many percent of the trade needs to be closed!
ALERT >>>>>>>>>>>>>>>>>>>>>>>>>>>>>>>>>>>>>>>>>>>>>>>
COIN: BTCUSD
TIMEFRAME: 15M
LONG: TP1
TP1: 20500
TP Percentage: 20%
---------------------------------------------------------------------------
Here is how an alert will look for LONG - STOP-LOSS.
ALERT >>>>>>>>>>>>>>>>>>>>>>>>>>>>>>>>>>>>>>>>>>>>>>>
COIN: BTCUSD
TIMEFRAME: 15M
ENTRY: 20000
LONG: SL
SL: 19000
---------------------------------------------------------------------------
Here is how an alert will look for LONG - EOD (End of Day) In Profit close.
ALERT >>>>>>>>>>>>>>>>>>>>>>>>>>>>>>>>>>>>>>>>>>>>>>>
COIN: BTCUSD
TIMEFRAME: 15M
LONG: EOD-Close (profit)
ENTRY: 20000
EOD-Close: 21900
===========================================================================
Adding Alerts in TradngView
---------------------------------------------------------------------------
-Add indicator to chart and make sure the correct strategy is configured (check Backtesting results)
-Right-click anywhere on the TradingView chart
-Click on Add alert
-Condition: Select this indicator by it’s name
-Immediately below, change it to "alert() function calls only", as other wise there will be 2 alerts for every alert!
-Expiration: Open-ended (that may require higher tier TradingView account, otherwise the alert will need to be occasionally re-triggered)
-Alert name: Whatever you desire
-Hit “Create”
-Note: If you change ANY Settings within the indicator – you must DELETE the current alert and create a new one per steps above, otherwise it will continue triggering alerts per old Settings!
===========================================================================
If you have any questions or issues with the indicator, please message me directly via TradingView.
---------------------------------------------------------------------------
Good Luck! (NOTE: Trading is very risky, past performance is not necessarily indicative of future results, so please trade responsibly!)
---------------------------------------------------------------------------
NOTE: There seems to be a strange glitch when strategy is running live, it will show "double-take" take-profits labels on the chart. This is not affecting the script logic and backtesting results, if you simply change the timeframe real quick to something else then back - it will no longer show the duplicate orders... this must be some sort of a glitch as every alert was thoroughly tested to make sure everything is working!

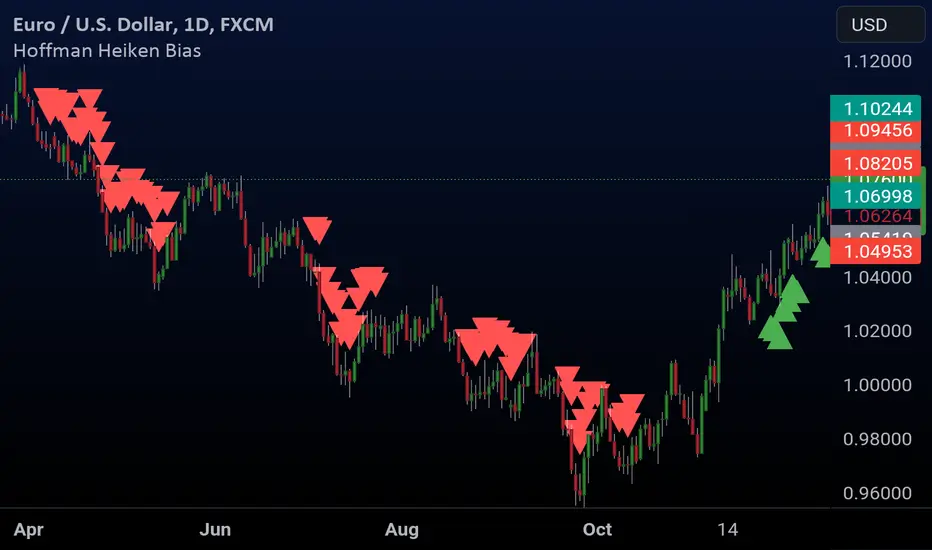
Hoffman Heiken BiasThis indicator uses a couple of different things including the Hoffman moving averages applied with heiken ashi bar data and some volatility to help determine when the bias of the market has shifted for the timeframe you are looking at.
SOFEX High-End Indicators + BacktestingBINANCE:BTCUSDT.P BINANCE:ETHUSDT.P
Introducing the first publicly available suite of indicators for Bitcoin and Ethereum by Sofex - the High-End Indicators & Backtesting System.
🔬 Trading Philosophy
The High-End Indicators & Backtesting system offers both trend-following and mean-reversal algorithms to provide traders with a deep insight into the highly volatile cryptocurrency markets, known for their market noise and vulnerability to manipulation.
With these factors in mind, our indicators are designed to sidestep most potentially false signals. This is facilitated further by the "middle-ground" time frame (1 Hour) we use. Our focus is on the two largest cryptocurrencies: Bitcoin and Ethereum , which provide high liquidity, necessary for reliable trading.
Therefore, we recommend using our suite on these markets.
The backtesting version of the Sofex High-End Indicators includes mainly trend-following indicators. This is because our trading vision is that volatility in cryptocurrency markets is a tool that should be used carefully, and many times avoided. Furthermore, mean-reversal trading can lead to short-term profits, but we have found it less than ideal for long-term trading.
The script does not aim to make a lot of trades, or to always remain in a position and switch from long to short. Many times there is no direction and the market is in "random walk mode", and chasing trades is futile.
Based on our experience, it is preferable if traders remain neutral the majority of the time and only enter trades that can be exited in the foreseeable future. Trading just for the sake of it ultimately leads to loss in the long-run.
Expectations of performance should be realistic.
We also focus on a balanced take-profit to stop-loss ratio. In the default set-up of the script, that is a 2% : 2% (1:1) ratio. A relatively low stop loss and take profit build onto our idea that positions should be exited promptly. There are many options to edit these values, including enabling trailing take profit and stop loss. Traders can also completely turn off TP and SL levels, and rely on opposing signals to exit and enter new trades.
Extreme scenarios can happen on the cryptocurrency markets, and disabling stop-loss levels completely is not recommended. The position size should be monitored since all of it is at risk with no stop-loss.
We take pride in presenting this comprehensive suite of trading indicators, designed for both manual and automated use. Although automated use leads to increased efficiency, traders are free to incorporate any of our indicators into their own manual trading strategy.
⚙️ Indicators
By default, all indicators are enabled for both Long and Short trades.
Extreme Trend Breakouts
The Extreme Trend Breakouts indicator seeks to follow breakouts of support and resistance levels, while also accounting for the unfortunate fact that false signals can be generated on these levels. The indicator combines trend-breakout strategies with various other volatility and direction measurements. It works best in the beginning of trends.
Underpinning this indicator are renowned Perry Kaufman's Adaptive Moving Averages (PKAMA) alongside our proprietary adaptive moving averages. These dynamic indicators adjust their parameters based on recent price movements, attempting to catch trends while maintaining consistent performance in the long run.
In addition, our modification of the TTM Squeeze indicator further enhances the Extreme Trend Breakouts indicator, making it more responsive, especially during the initial stages of trends and filtering of "flat" markets.
High-Volatility Trend Follower
The High-Volatility Trend Follower indicator is based around the logic of evading market conditions where volatility is low (choppy markets) and aggressively following confirmed trends. The indicator works best during strong trends, however, it has the downside of entering trades at trend tops or bottoms.
This indicator also leverages our proprietary adaptive moving averages to identify and follow high-volatility trends effectively. Furthermore, it uses the Average Directional Index, Aroon Oscillator, ATR and a modified version of VWAP, to categorize trends into weak or strong ones. The VWAP indicator is used to identify the monetary (volume) inflow into a given trend, further helping to avoid short-term manipulations.
Low-Volatility Reversal
The Low-Volatility Reversal aims at plugging the holes that trend-following indicators ignore. It specifically looks for choppy markets. Using proven concepts such as Relative Strength Index and volume measurements, among others, this indicator finds local tops and bottoms with good accuracy. It works best in choppy markets with low to medium volatility. It has a downside that all reversals have, losing trades at the end of choppy markets and in the beginning of big trends.
This indicator, like the others, employs PKAMA in conjunction with our proprietary adaptive moving averages, and an Average PSAR indicator to seek out "sideways" markets. Furthermore, Bollinger Bands with an adaptive basis line is used, with the idea of trading against the short-term trends by looking at big deviations in price movement. The above mentioned indicators attempt to catch local tops and bottoms in markets.
Adaptive Trend Convergence
The Adaptive Trend Convergence aims at following trends while avoiding entering positions at local bottoms and tops. It does so by comparing a number of adaptive moving averages and looking for convergence among them. Adaptive filtering techniques for avoiding choppy markets are also used.
This indicator utilizes our proprietary adaptive moving averages, and an Average Price Range indicator to identify trend convergence and divergence effectively, preventing false signals during volatile market phases. It also makes use of Bollinger Bands with an adaptive moving average basis line and price-action adjusted deviation. Contrasting to the Low-Volatility Reversal condition described above, the Bollinger Bands used here attempt to follow breakouts outside of the lower and upper bands.
Double-Filtered Channel Breakouts
The Double-Filtered Channel Breakouts indicator is made out of adaptive channel-identifying indicators. The indicator then follows trends that significantly diverge from the established channels. This aims at following extreme trends, where rapid, continuous movements in either direction occur. This indicator works best in very strong trends and follows them relentlessly. However, these strong trends can end in strong reversals, and the indicator can be stopped out on the last trade.
Our Double-Filtered Channel Breakouts indicator is built on a foundation of adaptive channel indicators. We've harnessed the power of Keltner Channels and Bollinger Band Channels, with a similar approach used in the Adaptive Trend Convergence indicator. The basis and upper/lower bands of the channels do not rely on fixed deviation parameters, rather on adaptive ones, based on price action and volatility. This combination seeks to identify and follows extreme trends.
Direction Tracker
The Direction Tracker indicator is made out of a central slower, adaptive moving average that clearly recognizes global, long-term trends. Combined with direction and range indicators, among others, this indicator excels at finding the long-term trend and ignoring temporary pullbacks in the opposite direction. It works best at the beginning and middle of long and strong trends. It can fail at the end of trends and on very strong historical resistance lines (where sharp reversals are common).
Our Direction Tracker indicator integrates an adaptive SuperTrend indicator into its core, alongside our proprietary adaptive moving averages, to accurately identify and track long-term trends while mitigating temporary pullbacks. Furthermore, it uses Average True Range, ADX and other volatility indicators to attempt to catch unusual moves on the market early-on.
📟 Parameters Menu
To offer traders flexibility, our system comes with a comprehensive parameter menu:
Preset Selection : Choose between Bitcoin or Ethereum presets to tailor the indicators to your preferred cryptocurrency market.
Global Signal Direction: Set the global signal direction as Long, Short, or Both, depending on your trading strategy.
Global Sensitivity Parameter : Adjust the system's sensitivity to adapt to different trend-following conditions, particularly beneficial during higher-strength trends.
Source of Signals : Toggle individual indicators on or off according to your preference. By default, all indicators are enabled. Customize the indicators to trade Long, Short, or Both, aligning them with your desired market exposure.
Confirmation of Signals : Set the minimum number of confirmed signals on the same bar, ensuring signals are generated only when specific confirmation criteria are met. The default value is one, and it can be adjusted for both Long and Short signals.
Exit of Signals : You have options regarding Take-Profit (TP) and Stop-Loss (SL) levels. Enable TP/SL levels to exit trades at predetermined levels, or disable them to rely on direction changes for exits. Be aware that removing stop losses can introduce additional risk, and position sizing should be carefully monitored.
By enabling Trailing TP/SL, the system switches to a trailing approach, allowing you to:
- Place an initial customizable SL.
- Specify a level (%) for the Trailing SL to become active.
- When the activation level is reached, the system moves the trailing stop by a given Offset (%).
Additionally, you can enable exit at break-even, where the system places an exit order when the trail activation level is reached, accounting for fees and slippage.
Alert Messages : Define the fields for alert messages based on specific conditions. You can set up alerts to receive email, SMS, and in-app notifications. If you use webhooks for alerts, exercise caution, as these alerts can potentially execute trades without human supervision.
Backtesting : Default backtesting parameters are set to provide realistic backtesting performance:
- 0.04% Commission per trade (for both entries and exits)
- 3 ticks Slippage (highly dependent on exchange)
- Initial capital of $1000
- Order size of $1000
While the order size is equal to the initial capital, the script employs a 2% stop-loss order to limit losses and attempts to prevent risky trades from creating big losses. The order size is a set dollar value, so that the backtesting performance is linear, instead of using % of capital which may result in unrealistic backtesting performance.
Risk Disclaimer
Please be aware that backtesting results, while valuable for statistical overview, do not guarantee future performance in any way. Cryptocurrency markets are inherently volatile and risky. Always trade responsibly and do not risk more than you can afford to lose.

[Camarilla Pivots] Signal Clean Up Analysis with Backtest (TSO)Camarilla Pivots NEW GEN Indicator!
This is a full-cycle trading system indicator, which uses Camarilla Pivots for generating signals using a custom developed algorithm, TP (Take Profit) and SL (Stop Loss) levels. There are 3 SOURCES for signals (each can be used separately or in combination or all 3 can be used at the same time, each signal SOURCE is using Camarilla Pivots levels to open optimal trade direction) with chained (NOTE: There are many potential profitable setups available, by combining clean up features availabe in the indicator settings!) signal cleanup and analysis approach with scheduling and alerting capabilities. Works best with shorter timeframes: 1M, 5M, 15M, 1H.
NOTE: Every calculation is done on a confirmed closed candle bar state, so the indicator will never repaint!
NOTE: At position open - there will be calculated Take-Profit and Stop-Loss targets, however each target is considered hit, when candle bar closes breaking that target, so Take-Profit and Stop-Loss when hit will slightly differ then what you see at position open!
===========================================================================
Explanation of all the Features | Configuration Guide | Indicator Settings | Signal Cleanup Analysis
---------------------------------------------------------------------------
>>> Customizable Backtesting for a specific date range, results via TradingView strategy, which includes “Deep Backtesting” for largest amounts of data on trading results.
>>> Trading Schedule with customizable trading daily time range, automatic closing/alert trades before Power Hour or right before market closes or leave it open until next day.
>>> 3 Trading Systems.
>>> Multiple Signal SOURCEs for opening trades, either SOURCE can be used or both at the same time!
>>> Static/Dynamic Stop-Loss setups (HIGHLIGHT: Stop-Loss will be moved to Entry after TP1 is taken, which minimizes risk).
>>> Single or Multiple profit targets (up to 5).
>>> Take-Profit customizable offset feature (set your Take-Profit targets slightly before everyone is expecting it!).
>>> Candle bar signal analysis (matching candle color, skip opposite structured and/or doji candle uncertain signals).
>>> Additional analysis of VWAP/EMA/ATR/EWO (Elliot Wave Oscillator)/Divergence MACD+RSI/Volume signal confirmation (clean up your chart with indicator showing only the best potential signals!).
>>> Advanced Alerts setup, which can be potentially setup with a trading bot over TradingView Webhook (NOTE: This will require advanced programming knowledge).
===========================================================================
Labels, plots, colors explanations:
---------------------------------------------------------------------------
>>>>> LONG open: green "house" looking arrow below candle bar.
>>>>> SHORT open: red "house" looking arrow above candle bar.
>>>>> LONG/SHORT take-profit target: green/red circles (multi-profit > TP2/3/4/5 smaller circles).
>>>>> LONG/SHORT stop-loss target: green/red + crosses.
>>>>> LONG/SHORT take-profit hits: green/red diamonds.
>>>>> LONG/SHORT stop-loss hits: green/red X-crosses.
>>>>> LONG/SHORT EOD (End of Day | Intraday style) close (profitable trade): green/red squares.
>>>>> LONG/SHORT EOD (End of Day | Intraday style) close (loss trade): green/red PLUS(+)-crosses.
===========================================================================
Date Range and Trading Schedule Settings
---------------------------------------------------------------------------
>>>>> Date Range: Select your start and/or end dates (uncheck “End” for indicator to show results up to the very moment and to use for LIVE trading) for backtesting results, if not using backtesting – uncheck “Start”/“End” to turn it off.
>>>>> Use TradingView “Strategy Tester” to see backtesting results
NOTE: If Strategy Tester does not show any results with Date Ranged fully unchecked, there may be an issue where a script opens a trade, but there is not enough TradingView power to set the Take-Profit and Stop-Loss and somehow an open trade gets stuck and never closes, so there are “no trades present”. In such case you will need to manually check “Start”/“End” dates or use “Depp Backtesting” feature!
>>>>> Trading Schedule: This is where you can setup Intraday Session or any custom session schedule you wish. Turn it ON. Select trading hours. Select EOD (End of Day) setting (NOTE: If it will be OFF, the indicator will assume you are holding your position open until next day!). Please note the EOD trade closure times with the 2 different Intraday close settings when turned on:
At Market Close:
1/3/5min > will close at 15:55pm ET
15min > will close at 15:45pm ET
30min > will close at 15:30pm ET
45min > will close at 15:45pm ET
60min > will close at 15:00pm ET
Before Power Hour:
1/3/5min > will close at 15:00pm ET
15min > will close at 15:00pm ET
30min > will close at 15:00pm ET
45min > will close at 15:00pm ET
60min > will close at 15:00pm ET
>>> Trading Systems: 1) "Open Until Closed by TP or SL": the signal will only open a trade if no trades are currently open/trunning, a trade can only be closed by Take Profit, Stop Loss or End of Day close (if turned on) | 2) "Open Until Closed by TP or SL + OCA": Same as 1), but if there is an opposite signal to the trade which is currently open > it will immediately be closed with new trade open or End of Day close (if turned on) | 3) "OCA (no TP or SL)": There are is Take Profit or Stop Loss, only an opposite signal will close current trade and open an opposite one or End of Day close (if turned on).
>>> Position Open sources:
>>>>> Position Open - SOURCE1 | LONG: S3, SL: S4, TP1: R3, TP2: R4, TP3: R5, TP4/5: Smart Formula | SHORT: R3, SL: R4, TP1: S3, TP2: S4, TP3: S5, TP4/5: Smart Formula
>>>>> Position Open - SOURCE2 | LONG: R4, SL: R3, TP1: R5, TP2/3/4/5: Smart Formula | SHORT: S4, SL: S3, TP1: S5, TP2/3/4/5: Smart Formula
>>>>> Position Open - SOURCE3 | LONG: R5, SL: R4, TP1/2/3/4/5: Smart Formula | SHORT: S5, SL: S4, TP1/2/3/4/5: Smart Formula
>>> Turn On/Off: Current Position SL + Opposite Position Open Signal on the same closing candle bar (If current trade hits Stop-Loss and at that same closing candle bar there is a signal for an opposite direction trade > indicator will close current position as Stop-Loss and immediately open an opposite position). NOTE: With this option turned on, there will be more trades, but not necessarily better results, since after Stop-Loss is hit, it may make sense to wait a little before opening an opposite trade, even if it matches the condition at the same time when Stop-Loss is hit, but sometimes it shows great results, so this setting/feature is included.
>>> Turn On/Off: Turn On/Off: Current Position REGULAR SL | Only the SL + Opposite Position Open will trigger if turned on, IF NOT - THERE WILL BE NO STOP-LOSS AT ALL!!! NOTE: It is very dangerous to trade without Stop-Loss!
>>>>> Signal Candle Bar consuming Take-Profits - position/trade signal candle bar is big enought to "consume"/close ahead the first TP setting > the signal can either be skipped, or all Take-Profit areas pushed ahead using smart formula)
>>>>> MULTIPROFIT | TP (Take-Profit) System: Once the trade is open, all Take-Profit target(s) are immediately calculated and set for the trade > once the target(s) is hit > trade will be partially closed (if candle bar closes beyond several Take-Profit targets > trade will be reduced accordingly to the amount of how many Take-Profit targets were hit)
>>>>> MULTIPROFIT | SL (Stop-Loss) System: 1) Static – Once the trade is open, Stop-Loss is calculated and set for the remaining of the trade ||| 2) Dynamic – At trade open, Stop-Loss is calculated and set the same way, however once 1st Take-Profit is taken > Stop-Loss is moved to Entry, reducing the risk.
>>>>> # of TPs (number of take profit targets): Just like it is named, this is where you select the number of Take-Profit targets for your trading system (NOTE: If "OCA (no TP or SL)" Trading System is selected, this setting won’t do anything, since there are no TP or SLs for that system).
>>>>> TP(s) offset: This is a special feature for all Take-Profit targets, where you can turn on a customizable offset, so that if the price is almost hitting the Take-Profit target, but never actually touches it > you will capture it. This is good to use with HHLL (Highest High Lowest Low), which is pretty much a Support/Resistance as often the price will nearly touch these strong areas and turn around…
===========================================================================
Signal Analysis and Cleanup Settings
---------------------------------------------------------------------------
>>>>> Candle Analysis | Candle Color signal confirmation: If closed candle bar color does not match the signal direction > no trade will be open.
>>>>> Candle Analysis | Skip opposite candle signals: If closed candle bar color will match the signal direction, but candle structure will be opposite (for example: bearish green hammer, long high stick on top of a small green square) > no trade will be open.
>>>>> Candle Analysis | Skip doji candle signals: If closed candle bar will be the uncertain doji > no trade will be open.
>>>>> Divergence/Oscillator Analysis | EWO (Elliot Wave Oscillator) signal confirmation: LONG will only be open if at signal, EWO is green or will be at bullish slope (you can select which setting you desire), SHORT if EWO is red or will be at bearish slope.
>>>>> Divergence/Oscillator Analysis | VWAP signal confirmation: LONG will only be open if at signal, the price will be above VWAP, SHORT if below.
>>>>> Divergence/Oscillator Analysis | Moving Average signal confirmation: LONG will only be open if at signal, the price will be above selected Moving Average, SHORT if below.
>>>>> Divergence/Oscillator Analysis | ATR signal confirmation: LONG will only be open if at signal, the price will be above ATR, SHORT if below.
>>>>> Divergence/Oscillator Analysis | RSI + MACD signal confirmation: LONG will only be open if at signal, RSI + MACD will be bullish, SHORT if RSI + MACD will be bearish.
>>>>> Volume signal confirmation: LONG/SHORT will only be opened with strong Volume matching the signal direction, by default, strong Volume percentage is set to 150% and weak to 50%, but you can change it as you desire.
===========================================================================
||||||||||||||||||||||||||||||||||| *** ||||||||||||||||||||||||||||||||||| *** |||||||||||||||||||||||||||||||||||
||||||||||||||||||||||||||||||||||| *** ||||||||||||||||||||||||||||||||||| *** |||||||||||||||||||||||||||||||||||
TP System - VERY IMPORTANT INFO!
-------------------------------------------------------------------------------------------------------------------
"TP PERCENTAGE" - amount by which current trade/position needs to be reduced/partially closed/sold.
-------------------------------------------------------------------------------------------------------------------
TP System: Dynamic
"TP PERCENTAGE" - will always be the same amount (trade/position size divided by the # of take-profit(TP) targets) and percentage to be closed will always be of the ORIGINAL trade/position.
-------------------------------------------------------------------------------------------------------------------
TP System: Static
"TP PERCENTAGE" - will always be the same amount IF take-profit(TP) targets are hit 1-by-1 (TP1 > TP2 > TP3 > TP4 > TP5), otherwise it will vary and unless it is a 1st take-profit(TP1), the REMAINING trade/position size will always be smaller than original and therefore the percentage to be closed will always be of the REMAINING trade/position and NOT the original one!
-------------------------------------------------------------------------------------------------------------------
"TP PERCENTAGE" CheatSheet (these are the only percentages you may see)
-----------------------------------------------------------------------
TP PERCENTAGE---Close/Sell Amount-------------Example (trade size: 50 stocks)
20%-------------trade size * 0.2--------------50 * 0.2 = 10 stocks
25%-------------trade size * 0.25-------------50 * 0.25 = 12.5(~13) stocks
34%-------------trade size * 0.34-------------50 * 0.34 = 17 stocks
40%-------------trade size * 0.4--------------50 * 0.4 = 20 stocks
50%-------------trade size * 0.5--------------50 * 0.5 = 25 stocks
60%-------------trade size * 0.6--------------50 * 0.6 = 30 stocks
66%-------------trade size * 0.66-------------50 * 0.66 = 33 stocks
75%-------------trade size * 0.75-------------50 * 0.75 = 37.5(~38) stocks
80%-------------trade size * 0.8--------------50 * 0.8 = 40 stocks
100%------------trade size--------------------50 = 50 stocks
-----------------------------------------------------------------------
If for any reason a portion of the current/remaining trade closed at such occurrence was slightly wrong, it is not an issue. Such occurrences are rare and with slight difference in partial TP closed is not significant to overall performance of our algorithms.
||||||||||||||||||||||||||||||||||| *** ||||||||||||||||||||||||||||||||||| *** |||||||||||||||||||||||||||||||||||
||||||||||||||||||||||||||||||||||| *** ||||||||||||||||||||||||||||||||||| *** |||||||||||||||||||||||||||||||||||
Alert Settings (you don’t have to touch this section unless you will be using TradingView alerts through a Webhook to use with trading bot)
---------------------------------------------------------------------------
Here is how a LONG OPEN alert looks like.
NOTE: Each label , , etc. is customizable, you can change the text of it within indicator Input settings.
ALERT >>>>>>>>>>>>>>>>>>>>>>>>>>>>>>>>>>>>>>>>>>>>>>>
COIN: BTCUSD
TIMEFRAME: 15M
LONG: OPEN
ENTRY: 20000
TP1: 20500
TP2: 21000
TP3: 21500
TP4: 22500
TP5: 23500
SL: 19000
Leverage: 0
---------------------------------------------------------------------------
Here is how a TP1 alert will look with 5 TPs breakdown of the trade.
NOTE1: Next to TP1 taken it will show at which price it was triggered.
NOTE2: Next to "TP Percentage" it shows how much of the CURRENT/ACTIVE/REMAINING trade needs to be closed.
NOTE2: If TP2/3/4/5 comes before TP1 - the alert will tell you exactly how many percent of the trade needs to be closed!
ALERT >>>>>>>>>>>>>>>>>>>>>>>>>>>>>>>>>>>>>>>>>>>>>>>
COIN: BTCUSD
TIMEFRAME: 15M
LONG: TP1
TP1: 20500
TP Percentage: 20%
---------------------------------------------------------------------------
Here is how an alert will look for LONG - STOP-LOSS.
ALERT >>>>>>>>>>>>>>>>>>>>>>>>>>>>>>>>>>>>>>>>>>>>>>>
COIN: BTCUSD
TIMEFRAME: 15M
ENTRY: 20000
LONG: SL
SL: 19000
---------------------------------------------------------------------------
Here is how an alert will look for LONG - EOD (End of Day) In Profit close.
ALERT >>>>>>>>>>>>>>>>>>>>>>>>>>>>>>>>>>>>>>>>>>>>>>>
COIN: BTCUSD
TIMEFRAME: 15M
LONG: EOD-Close (profit)
ENTRY: 20000
EOD-Close: 21900
===========================================================================
Adding Alerts in TradngView
---------------------------------------------------------------------------
-Add indicator to chart and make sure it is configured (check back-testing results)
-Right-click anywhere on the TradingView chart
-Click on Add alert
-Condition: Select this indicator by it’s name
-Alert name: Whatever you want
-Hit “Create”
-Note: If you change ANY Settings within the indicator – you must DELETE the current alert and create a new one per steps above, otherwise it will continue triggering alerts per old Settings!
===========================================================================
If you have any questions or issues with the indicator, please message me directly via TradingView.
---------------------------------------------------------------------------
Good Luck! (NOTE: Trading is very risky, past performance is not necessarily indicative of future results, so please trade responsibly!)
---------------------------------------------------------------------------
NOTE: There seems to be a strange glitch when strategy is running live, it will show "double-take" take-profits labels on the chart. This is not affecting the script logic and backtesting results, if you will remove/re-add the script afterwards, it will no longer show the duplicate orders... this must be some sort of a glitch as every alert was thoroughly tested to make sure everything is working!

TRAX Detrended Price StrategyIn this script, the "TRAX" (TRIX) indicator is calculated using the Volume Weighted Moving Average (VWMA) instead of Exponential Moving Average (EMA) like the standard TRIX. The Detrended Price is used to identify short term cycles with a rate of change verses the rate of change from a triple smoothed TRAX VWMA . The strategy is intended for counter-trend trading, meaning it tries to capture potential reversals.
1. Indicators Used:
TRAX is calculated using the Volume Weighted Moving Average (VWMA) of the logarithm of the closing price.
DPO (Detrended Price Oscillator) is calculated by taking the closing price and subtracting a simple moving average (SMA) of the closing price shifted back.
2. Crossover Conditions:
Longs occur when DPO crosses above the TRAX, with the TRAX trending below 0, and the stock is trading above an adjustable simple moving average. Shorts occur due to the inverse conditions.
3. Visualization:
This script plots the SMA and the TRAX-DPO Combined Oscillator.
It highlights the periods of zero-line crossover using a green background for potential long positions and a red background for potential short positions. However, it will trigger verified entries/exits in accordance with the SMA.
In conclusion, this fun prototype underwent a unique alteration using the Volume Weighted Moving Average and focuses on capturing shorter counter-trend cycles. You have the freedom to fine-tune the strategy by adjusting parameters and incorporating other analysis methods that resonate with your trading style and risk tolerance.
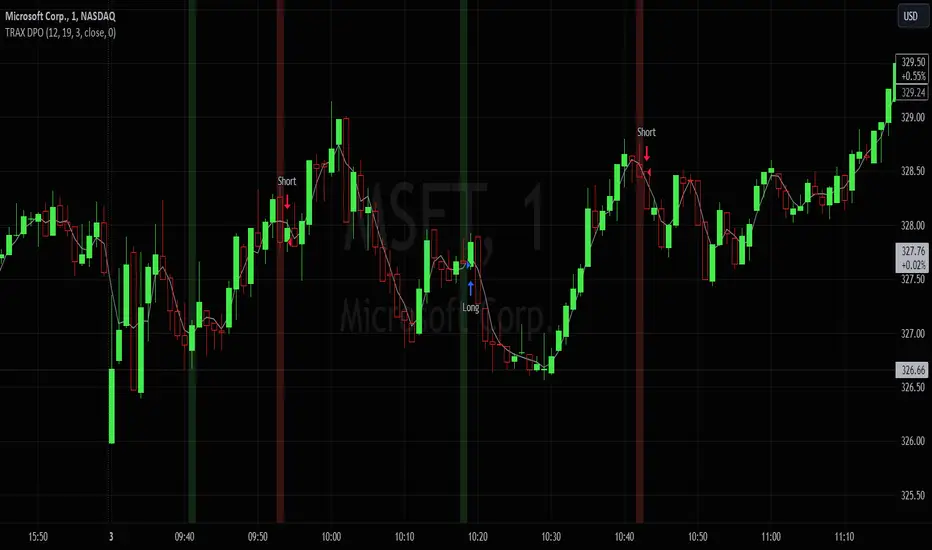
Premium VWAP Trendfollow Strategy [wbburgin]This is a strongly-revised version of my VWAP Trendfollow Strategy, which follows a substantial reworking to address various structural inefficiencies with the script, such as the narrowing of the standard deviation band upon anchor reset. I will continue updating the original script with planned adjustments, this is a different proof-of-concept that builds off of the original script thesis with a different calculation method and execution.
This strategy is not built for any specific asset or timeframe, and has been backtested on crypto and equities from 1 min-1 day. The previous experimental strategy was heavily-correlated with the actual movement of the asset, which added unpalatable risk to the strategy and increased drawdown. This revised form has a more stable backtesting curve, but I want to heavily emphasize that I cannot guarantee that the strategy will be profitable for your circumstances. Backtesting only goes so far and every exchange has a different fee schedule, which can substantially eat into your profits. At the bottom I will explain the parameters behind the strategy results.
**********
The VWAP Trendfollow Strategy begins with a simple premise: to enter long when the price breaks above the upper standard deviation of a VWAP, and to close the position when the price breaks below the lower standard deviation of the VWAP. This is more effective than initiating the same strategy for a VWMA because the VWAP resets its anchor depending on your chosen anchor period, and the act of resetting its anchor also resets its standard deviation value. As a consequence, in sustained uptrends, the standard deviation is pulled upward to meet the price when the anchor resets, instead of requiring the price to fall all the way back down, as in the lower standard deviation band of the VWMA. This essentially acts as the VWAP itself raising the stop loss at each anchor period, which works well for the overall trend-following strategy.
However, this narrowing can still have consequences for a simple breakout strategy; as the price gradually oscillates towards above or below its standard deviation band, it may cross over the other and produce false signals. This oscillation is worrisome especially when fees are taken into account.
Thus, the premium VWAP Trendfollow strategy has a variable width which detects abnormal narrowing of the band, and adjusts it until it is reasonable to close the variability period. Additionally, a filter is added to the open/close signals to soften the frequency of signals without impacting performance significantly.
This script contains an ATR stop loss and an ATR take profit (which is also a difference between it and the original experimental script), with customizable inputs. The strategy results shown below are with initial capital of $1000, qty entry of 10%, and commissions of 0.06%. It works best on 24/7 instruments, like crypto, but I have found it also works with FAANG stocks or other high volatility / high volume assets. The issue with stocks, however, is that the price can jump/plummet because of abnormal events after-hours, which the strategy cannot pick up on until pre-trading begins the next morning. For that reason I suggest it be used on crypto and, because of its low % profitable (but high average winning trade in relation to its average losing trade), be used on an exchange that has minimal fees or volume-based discounts. In the unfortunate case that you cannot find a minimal fee or volume-discounted fee exchange (such as fellow Americans following the liquidity-retreat on Binance.US), I encourage you to test out the higher anchor periods for the higher timeframes, which will reduce the number of trades and increase the average % per trade.
Additionally, this is a long-term strategy used best for accumulation. It is currently long-only; that may change based off of user input.
**********
Disclaimer
Copyright by wbburgin.
The information contained in my Scripts/Indicators/Algorithms does not constitute financial advice or a solicitation to buy or sell any securities of any type. I will not accept liability for any loss or damage, including without limitation any loss of profit, which may arise directly or indirectly from the use of or reliance on such information.
All investments involve risk, and the past performance of a security, industry, sector, market, financial product, trading strategy, backtest, or individual's trading does not guarantee future results or returns. Investors are fully responsible for any investment decisions they make. Such decisions should be based solely on an evaluation of their financial circumstances, investment objectives, risk tolerance, and liquidity needs.

9:22 5 MIN 15 MIN BANKNIFTY9:22 5 MIN 15 MIN BANKNIFTY Strategy with Additional Filters
The 9:22 5 MIN 15 MIN BANKNIFTY Strategy with Additional Filters is a trend-following strategy designed for trading the BANKNIFTY instrument on a 5-minute chart. It aims to capture potential price movements by generating buy and sell signals based on moving average crossovers, breakout confirmations, and additional filters.
Key Features:
Fast MA Length: 9
Slow MA Length: 22
ATR Length: 14
ATR Filter: 0.5
Trailing Stop Percentage: 1.5%
Pullback Threshold: 0.5
Minimum Candle Body Percentage: 0.5
Use Breakout Confirmation: Enabled
Additional Filters:
Volume Threshold: Set a minimum volume requirement for trades.
Trend Filter: Optionally enable a trend filter based on a higher timeframe moving average.
Momentum Filter: Optionally enable a momentum filter using the RSI indicator.
Support/Resistance Filter: Optionally enable a filter based on predefined support and resistance levels.
Buy and Sell Signals:
Buy Signal: A buy signal is generated when the fast moving average crosses above the slow moving average, with additional confirmation from breakout and volume criteria, along with optional trend, momentum, and support/resistance filters.
Sell Signal: A sell signal is generated when the fast moving average crosses below the slow moving average, with similar confirmation and filtering criteria as the buy signal.
Exit Strategy:
The strategy employs a trailing stop-loss mechanism based on a percentage of the average entry price. The stop-loss is dynamically adjusted to protect profits while allowing for potential upside.
Please note that this strategy should be thoroughly backtested and evaluated in different market conditions before applying it to live trading. It is also recommended to adjust the parameters and filters according to individual preferences and risk tolerance.
Feel free to customise and adapt the description as needed to suit your preferences and the specific details of your strategy.
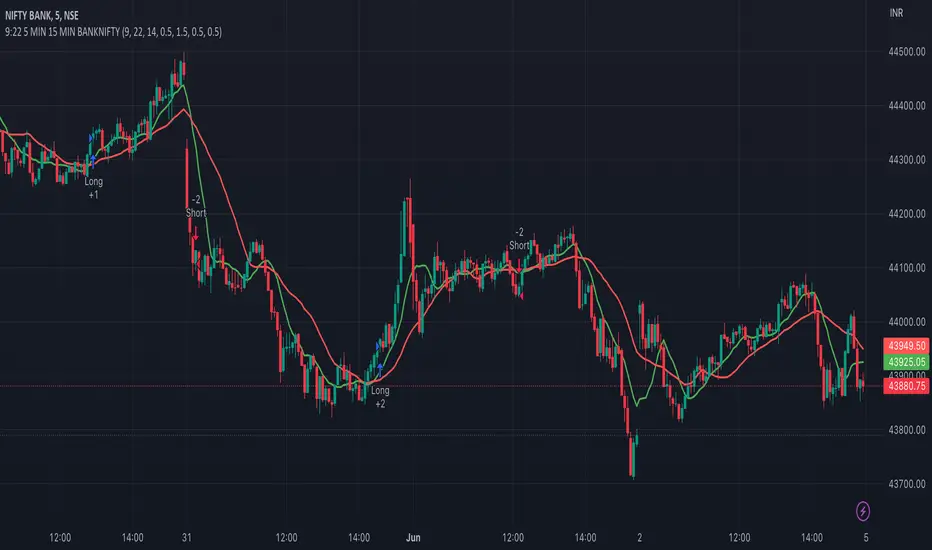
Cyatophilum SmartStrategy MakerThis indicator allows you to use any other indicator from the TradingView library and create complex entry and exit conditions with ease thanks to several external inputs. Add risk management to your strategy and backtest it before creating alerts!
Key Features:
1 — Entry Conditions: Traders can define their entry conditions using up to three sources. They can choose from several options such as "Cross," "Crossover," "Crossunder," "Above," "Below," or "Equal" for comparing the selected sources.
2 — Entry Gates: Users can set logical gates (e.g., "AND," "OR," "XOR," "NAND," "XNOR") to combine multiple entry conditions.
3 — Exit Conditions: Similar to entry conditions, traders can define exit conditions based on two sources and select from various comparison options.
4 — Stop Loss: The indicator allows users to enable or disable a stop-loss feature. The stop-loss value is calculated based on a percentage of the base order price.
5 — Take Profit: Traders can set multiple take-profit levels by specifying the number of take profits, a base percentage, and a step value. Take profits can be defined as a percentage from the total volume or the base order.
6 — Safety Orders (DCA): The indicator supports the use of safety orders (Dollar Cost Averaging) to help manage risks. Users can set the number of safety orders, price deviation, step scale, and volume scale.
7 — Backtest Settings: Traders can define the start and end periods for backtesting their strategy. This feature allows them to analyze the performance of their strategy within specific timeframes.
8 — Alerts: The indicator provides the option to create alerts for entry, exit, stop loss, take profit, and safety orders. Users can customize the alert messages using placeholders for dynamic values like price, symbol, and order size.

Wunder Breakout botWunder Breakout bot
1. Wunder Breakout bot is based on the breakout of the trend line. Breakout is a technical trading strategy that is used to determine the moment of a trend line breakout on the price chart. It is based on the assumption that when price crosses a trend line, it signals a change in trend direction and the possible start of a new price movement.
2. The entry points for the trendline breakout strategy are based on the principle of breaking through a set trendline. This means that we look for the moment when the price of the asset crosses the trend line that we have established in order to enter a sell or buy position.
3. We use fixed take-profit and stop-loss, but you can use other risk management systems, based on the suggested settings.
4. Wunder Breakout bot script has added a function to calculate the risk per portfolio (your deposit). When this option is enabled, you get the calculation of the entry amount in dollars relative to your Stop Loss. You can chooseselect the percentage of risk per your portfolio in the settings. the percentage of risk per your portfolio in the settings. The loss will be calculated from the amount that will be displayed on the chart.
For example, if your deposit is $1000 and you set your risk at 1%, with a Stop Loss of 5%, your entry volume would be $200. The SL loss would be $10. $10 is your 1% risk or 1% of your deposit.
*Important! ** The risk per trade must be less than the Stop Loss value. If the risk is more than SL, you should use leverage.
The amount of funds included in the deal is calculated in dollars. This option was created if you want to send a dollar amount from Tradingview to the exchange. However, by specifying the volume in dollars, you will get the net profit and drawdown displayed incorrectly in the backtest results because TradingView calculates the backtest volume in contracts.
To display the correct net profit and drawdown values in Tradingview backtest results, use the "Volume in Contracts" option.

Stochastic RSI Strategy (with SMA and VWAP Filters)The strategy is designed to trade on the Stochastic RSI indicator crossover signals.
Below are all of the trading conditions:
-When the Stochastic RSI crosses above 30, a long position is entered.
-When the Stochastic RSI crosses below 70, a short position is entered.
-The strategy also includes two additional conditions for entry:
-Long entries must have a positive spread value between the 9 period simple moving average and the 21 period simple moving average.
-Short entries must have a negative spread value between the 9 period simple moving average and the 21 period simple moving average.
-Long entries must also be below the volume-weighted average price.
-Short entries must also be above the volume-weighted average price.
-The strategy includes stop loss and take profit orders for risk management:
-A stop loss of 20 ticks is placed for both long and short trades.
-A take profit of 25 ticks is placed for both long and short trades.

DLX-NationThis Strategy is based on 8 EMAs and the RSI ( 14 Length )
Its algorism check for the trend of the market using crossover EMAs, then it waits for a 38% - 50% pullback. During this Pullback it checks the behaviour of the EMAs by making sure consolidation is coming to and end by checking if the red EMA cuts through certain candle bodies. Then it detects a takeover in the market, meaning during a pullback ( in case of a buy ) it calculates the selling volume and waits to confirm that buyers retake over the Market by calculating the candle sizes making sure the current candle is bigger than the previous candle using the 3rd EMA (if 50 EMA is below market price) then finally It checks if there is enough buying Strength ( in case of a buy ) or enough selling strength ( in case of a sell) by checking the RSI level over a certain period of time. When all these confirmations are done, it then analyses previous supports and resistence, and only sends a signal if there is not resistance for a buy and no support for a sell.
Its best for a strong bullish or bearish 1min, 5mins and 15mins market, thats why it only available on US30 and NAS100 for now. Its best when all the EMAs are spreading out or in other words the distance between the EMAs are increasing.
In case of a consolidation, you will see all EMAs moving together and in this case you shouldnt take any signal called. Following EMAs should guide you identifying a consilidation
50 EMA = Aqua
90 EMA = Green
150 EMA = Purple
200 EMA = Gray
400 EMA = Orange
800 EMA = Blue
Note: If you see all these EMA coming closer to each other, it indicates a long going consolidation and during these moments you shouldnt execute any signal. These is the reason why we decided to plot them on the Chart. We understand trading with a clean Chart is important, moreover using certain tools to be more profitable is essential. In case the 50 EMA ( Aqua ) Crosses over or below the 150 EMA ( Green ) and 200 EMA (Gray), this will indicate end of the consolidation and the signals will have more liquidity and movement.
Lastly when a signal is being called make sure the last candle is clearly bigger than the previous candles, this indicates that the buyer ( in case of a buy candle ) are clearly taking over the market or the sellers ( in case of a sell candle ) are clearly taking over the market giving you more volume and liquidity.
To optain the max Profit:
After adding the Strategy / Indicator on your Chart go to Settings -> Properties and set the Pyramiding to 30. These implies that we can have 30 consecutive buy signals in a row or sell signals in a row. We recommend an initail Balance of 2000$, but mininum 1000% and a lotsize of 10cent per pip (0.1). Strickly follow the Take Profit (100pips) and StopLoss (500pips) level that will be provided in this case also risk only 1% of your account per trade and maximun 5% per running trades.
Keep in mind, the smaller the TImeframe the more trades you will recieve and the stronger the momentum the more profitable the trade will be.
