TTP VIX SpyTTP VIX Spy is an indicator that uses data from TVC:VIX to better time entries in the market.
The assumption used is that when the VIX is coming down from the top of its range then the risk on assets can move to the upside and when the VIX is is pushing higher there's a high likelihood or risk on assets going down.
This indicator observes the momentum of VIX using MACD. It offers two different signals both for longs and shorts: signal 1 and 2.
Signal 1 is activate when the begging of a new trend for the VIX is confirmed.
Signal 2 is activated when the VIX pulls back from an extreme value.
You can configure the parameters of the internal super trend and the look back for the slope applied to price and RSIs.
The indicator offers the following filter parameters:
- Price RSI slope: it filters signals that have RSI slope pointing in the opposite direction of the signal.
- Counter trend: it filters signals that are not counter trending super trend.
- Wide BBW: it filters signals that happen when there hasn't been high price volatility
- Price slope: it filters signals when the price is not pointing in the direction of the signal (buy: up, sell: down)
- VIX RSI filter: it filters VIX RSI values overextended. MACD can be in the right range, but sometimes RSI contradicts it. By default is OFF since it can cause false negatives.
- Working days only: it filters signals that occur in the weekend.
The colours below the price action show how the VIX momentum is changing. Transitions from red into pink and then green show how the fear is fading which tends to lead to lead to bullish moves, and the opposite when the transitions are from green to red.
Performance and initial thoughts.
I have tried VIX Spy on both BINANCE:BTCUSDT.P and BINANCE:ETHUSDT.P and it seems to offer a decent win ratio. As you can see I had to add many filter to remove bad entries and left toggles available to decide which ones you want to use.
I tried the signal in the 4H, 1H and 15min with mixed results. I tend to incline for the results in the 1H.
VIX signal offers a backtestable stream and alerts both for signals 1 and 2.
Cari skrip untuk "vix"

Williams VIX For Bottoms [DCD]Williams VIX Original - Authentic Volatility Fear Gauge
What This Indicator Does
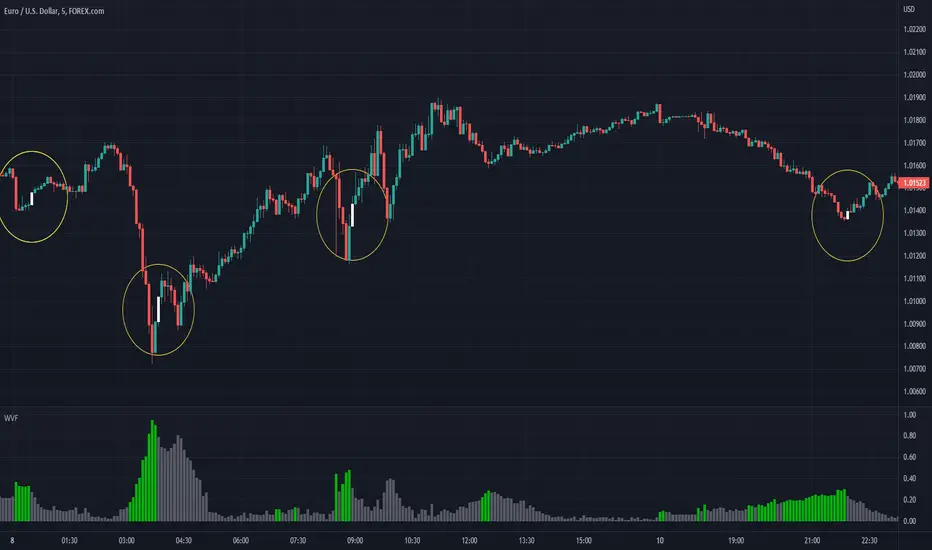
The Williams VIX Fix measures market fear by calculating how far current lows deviate from recent highs, identifying potential market bottoms during high volatility periods. This implementation provides Larry Williams' original formula in its purest form.
How It Works
Core Formula:
VIX Fix = ((Highest High over 22 periods - Current Low) / Highest High over 22 periods) × 100
The calculation process:
Measures Relative Distance: Compares current low to highest high over lookback period
Converts to Percentage: Normalizes values for cross-market comparison
Applies Statistical Analysis: Uses Bollinger Bands (2 std dev) around VIX Fix values
Filters with Percentiles: 85th percentile threshold removes noise
Signal Generation
Green Flash Signals trigger when either condition is met:
VIX Fix exceeds upper Bollinger Band (2 standard deviations above 20-period MA)
VIX Fix exceeds Range High (85th percentile of recent values)
This dual-condition approach reduces false signals while capturing genuine volatility spikes.
What Makes This Original
Pure Formula Implementation: Uses Williams' exact original calculation without modifications
Dual Confirmation System: Combines Bollinger Bands with percentile analysis
Professional Visualization: Histogram display, background highlighting, and live value table
Comprehensive Alerts: Signal start/end notifications plus Green Flash alerts
How to Use
Primary Purpose: Spot high-probability reversal zones during market fear climaxes
Signal Interpretation:
Green triangle + background highlight = High volatility reversal zone
Higher VIX Fix values = Stronger fear/better reversal potential
Use with price action confirmation for best results
Optimal Settings:
Timeframes: 4H, Daily, Weekly
Markets: All (stocks, crypto, forex, commodities)
Combine with support levels and candlestick patterns
Key Parameters:
VIX Fix Length (22): Lookback period for highest high
Std Dev Multiplier (2.0): Bollinger Band sensitivity
Percentile High (0.85): Only top 15% of readings trigger signals
The VIX Fix excels at identifying market fear climaxes that coincide with significant price bottoms, making it valuable for swing traders seeking high-probability entries during market stress.

S&P500 VIX Volatility Warning IndicatorToday I am sharing with the community a volatility indicator that can help you or your algorithms avoid black swan events. Variance is most commonly used in statistics to derive standard deviation (with its square root). It does have another practical application, and that is to identify outliers in a sample of data. Variance in statistics is defined as the squared difference between a value and its mean. Calculating that squared difference means that the farther away the value is from the mean, the more the variance will grow (exponentially). This exponential difference makes outliers in the variance data more apparent.
Why does this matter?
There are assets or indices that exist in the stock market that might make us adjust our trading strategy if they are behaving in an unusual way. In some instances, we can use variance to identify that behavior and inform our strategy.
Is that really possible?
Let’s look at the relationship between VIX and the S&P500 as an example. If you trade an S&P500 index with a mean reversion strategy or algorithm, you know that they typically do best in times of volatility. These strategies essentially attempt to “call bottom” on a pullback. Their downside is that sometimes a pullback turns into a regime change, or a black swan event. The other downside is that there is no logical tight stop that actually increases their performance, so when they lose they tend to lose big.
So that begs the question, how might one quantitatively identify if this dip could turn into a regime change or black swan event?
The CBOE Volatility Index (VIX) uses options data to identify, on a large scale, what investors overall expect the market to do in the near future. The Volatility Index spikes in times of uncertainty and when investors expect the market to go down. However, during a black swan event, the VIX spikes a lot harder. We can use variance here to identify if a spike in the VIX exceeds our threshold for a normal market pullback, and potentially avoid entering trades for a period of time (I.e. maybe we don’t buy that dip).
Does this actually work?
In backtesting, this cut the drawdown of my index reversion strategies in half. It also cuts out some good trades (because high investor fear isn’t always indicative of a regime change or black swan event). But, I’ll happily lose out on some good trades in exchange for half the drawdown. Lets look at some examples of periods of time that trades could have been avoided using this strategy/indicator:
Example 1 – With the Volatility Warning Indicator, the mean reversion strategy could have avoided repeatedly buying this pullback that led to SPXL losing over 75% of its value:
Example 2 - June 2018 to June 2019 - With the Volatility Warning Indicator, the drawdown during this period reduces from 22% to 11%, and the overall returns increase from -8% to +3%
How do you use this indicator?
This indicator determines the variance of the VIX against a long term mean. If the variance of the VIX spikes over an input threshold, the indicator goes up. The indicator will remain up for a defined period of bars/time after the variance returns below the threshold. I have included default values I’ve found to be significant for a short-term mean-reversion strategy, but your inputs might depend on your risk tolerance and strategy time-horizon. The default values are for 1hr VIX data. It will pull in variance data for the VIX regardless of which chart the indicator is applied to.
Disclaimer : Open-source scripts I publish in the community are largely meant to spark ideas or be used as building blocks for part of a more robust trade management strategy. If you would like to implement a version of any script, I would recommend making significant additions/modifications to the strategy & risk management functions. If you don’t know how to program in Pine, then hire a Pine-coder. We can help!

Jesus Vix Spike ComboThis script will:
Show you vix spikes with your 4 different settings.
Draw a white line at the start of each vix.
Draw a dotted green line for 3 spikes in 6 minutes.
Draw a dotted pink line for 3 spikes in 16 minutes.
Draw a green line extending right if it takes out a past low in the last 200 bars plus a spike.
It will also:
Place a white dot on the 5th candle if the price rises past the vix starting point,
a white omega sign on the 6th candle if price rises past the vix starting point,
and a large white dot on the 7th candle past the vix starting point if the price is higher.
It will also:
Show higher time frame EMAs and other emas.
Has some alerts added also.
I have only been using this on the 1 minute chart with $OANDA:SPX500USD.
Ill write about the strategy I use for this soon. But basically you wait for a drop and for some prominent lows to be taken out, then a vix, then your white dot, omega then the large white dot to enter, expect a 100% expansion from the vix low. More aggressive entry's would be the first white dot or 3 green candles in a row. Backtest to see.
Thanks for checking it out. Let me know if it can be better.
The original script is from Xxattaxx and Christ Moody I believe, thank you for sharing all your hard work.

MTF Williams Vix Market Bottoms [CryptoSea]MTF Williams Vix Fix Indicator is a dynamic tool tailored for traders looking to capture market extremes with high precision. This multi-timeframe indicator leverages the concept of the Williams Vix Fix to spot potential reversals before they occur.
Key Features
Multi-Timeframe Analysis: Provides simultaneous visibility across multiple timeframes, enabling traders to assess market conditions comprehensively from a single chart.
Advanced Volatility Detection: Utilizes a modified Vix Fix formula to highlight extreme price deviations, which often precede significant market reversals.
Customizable Settings: Offers extensive input options to tweak the lookback periods, percentile thresholds, and visibility settings, aligning with various trading strategies.
Visual Band Indicators: Features upper bands and range highs that signal potential overbought and oversold conditions, enhancing trading decision-making.
Below, you can see how the indicator performs across different timeframes, providing valuable insights into market behavior.
How it Works
Vix Fix Calculation: Determines the worst-case 'panic' sell-offs in price as a percentage of the high, capturing the emotional extremes of the market.
Statistical Bands: Employs Bollinger bands over the Vix Fix values to define normal and extreme volatility conditions.
Color-Coded Indicators: Uses color differentiation to instantly highlight when readings surpass critical upper band or range high thresholds, signaling key trading opportunities.
For instance, in the analysis provided below, notice how the indicator flags significant market moves, allowing traders to anticipate potential entry or exit points.
Application
Risk Management: Aids in identifying extreme market conditions where prices may revert, helping in effective position sizing and risk management.
Strategic Planning: Enhances strategic trading plans by identifying not only when but also where market extremes may occur, considering multiple timeframes.
Customization: Adapts seamlessly to different market environments with adjustable settings for volatility thresholds and visual display preferences.
The MTF Williams Vix Fix Indicator by is an essential tool for traders aiming to leverage market volatility for optimal entry and exit, ensuring they are well-equipped to handle market extremes with confidence.

HLC True Strength Indicator (with Vix)HLC True Strength Indicator Volume Weighted with Vix Line by SpreadEagle71
This indicator is a True Strength Indicator with Close, High and Low used together, along with the TSI of the Vix.
The white line is the close. The red line is the lows and the blue is the highs. These are also volume-weighted.
How to Interpret:
1. zero line crosses. If SPY/SPX500 crosses the zero line, then its bullish. If the purple Vix line crosses up, watch out because this is bearish.
2. white/blue/red lines cross purple (Vix). If they cross upwards, this is bullish. If downward, this is bearish. Basically, SPX, ES1!, SPY or even DIA can be used. The security and the Vix should travel in opposite directions and cross the zero-line at the same time. But this is not always the case.
3. Black area infills. These are used between the close and the highs (blue) and the lows(red). Close should not be between these in order to have momentum.
4. Close (white line) leads. Close is the last price so it tends to show where the others (highs and lows) are going. If the close is sagging below a high where the blue lines are on top, this could mean that there is a reversal coming. Same holds true for a white line above a "valley" formed by the blue and red lines; it could mean a reversal to the upside soon.
5. The Black Infill areas as a squeeze or contraction/expansion area. The thinner the black infill areas, the more of a momentum "squeeze" could be present. Wide black infill areas mean increased volatility and what may come next is a reversion to the mean for volatility. See TTM Squeeze Indicator or the Squeeze Momentum Indicator (kudos LazyBear).
Lastly, just remember indicators indicate; they are not magic. :)
SpreadEagle71

Inverted Yield Curve with VIX Fear IndexUS 2 year and US 10 year comparison, inverted yield curve with VIX. I use this on a weekly chart with 2 moving averages, the 40 week (ma200 daily) and the 520 week (10 year median).
The bottom histogram is the VIX and the plot is the yield curve. When the VIX is above a certain level (you can set it in settings) and the ýield curve is close to or at inversion the background goes red.
The last seven recessions were preceded by an inverted yield curve. Here I combined the two main fear indexes, the VIX and the run for safe US treasuries (Inverted Yield Curve).
This is preset to the 2 year and 10 year US bond, weekly, and the normal VIX ticker but you can set it to whatever you like.
Published with source code for anyone to modify. Please comment below if you do so! This is the second in a series of indicators I intend to publish as a package of economic recoverty/recession symptom indicators.
Follow me for updates, next one up is commodities with dr Copper and oil!

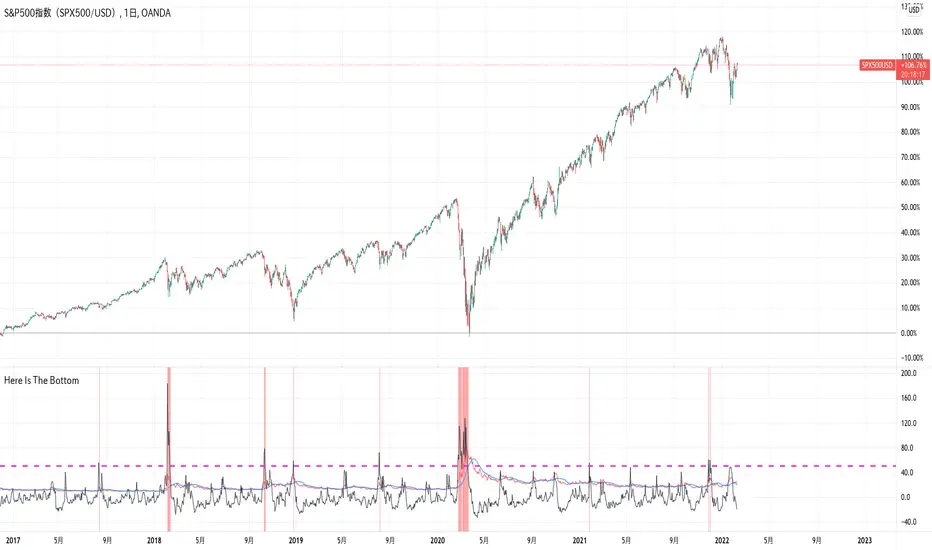
Here Is The Bottom(VIX and Its MA Deviation Rate)I found a very interesting article on Bloomberg with the title “JP Morgan Strategists See Sure Fire Sign It Is Time to Buy Stocks”.
It says when VIX index far exceeds its 1 month MA by 50%, then stock prices rise later except recession period. This buying signals are almost 100% accurate and now is the time to buy stocks as the VIX met the condition on Jan25 this year, the article says.
I can’t post the URL of the article here as it violates TradingView house rules, so if you are interested, you just google it with the title.
Anyway, I have developed this indicator to see what JP Morgan says.
It draws VIX, its MA and its MA deviation rate.
You will see the truth.
Enjoy!
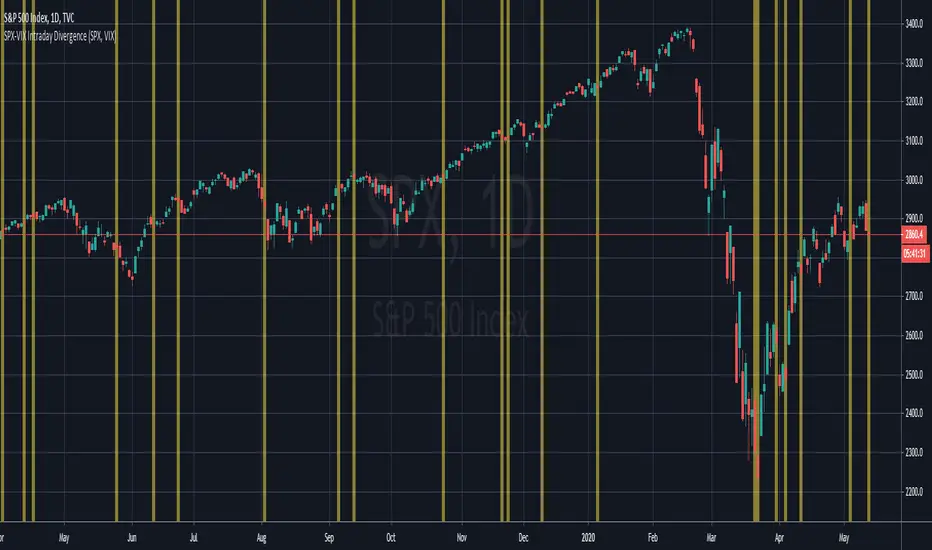
SPX-VIX Intraday DivergenceAs a long-term buyer/short-seller, you will always find different ways to enter the market , moving average crossovers, breakouts , overbought/oversold conditions being some of the classy methods. However, they are decreasingly effective... 😢
Recently I have realized that analysis beyond the technical indicators will bring trading to the next level because I will be able to confirm my trading signals without relying too much on basic price actions and patterns which are easily manipulated by big banks and institutions. 👍
Today I will introduce you to my divergence indicator making use of SPX and VIX. Unlike MacD or RSI divegence , which would involve normative judgement , it will take account of the unusual move by SPX alongwith the VIX , to the exploit chances that options market, where most experienced investors participated in has a preceding insight into the equity market about the upcoming moves.
I have divided signals into two groups.
Bullish divergence - SPX Down , VIX also Down 👇
Bearish divergence - SPX Up , VIX also Up 👆
I hope this script will enable us to take advantage of the options market activities , to provide a REAL divergence signal, and be used coupled with our own chart patterns or other price signals, and more importantly to score more and more winning trades!!!
If you want more useful scripts from me, please like and share my posts. And don't forget to follow my account to grab the latest ideas and tools! 😘
SMI-VIX-SPY-NDX-Index
This script offers an SMI index of VIX, SPY, and NDX. Rather than overlaying VIX, NDX and SPY on the same chart.
It's much easier to see the correlation between VIX's price and NDX / SPY price in this manner.
Thanks to Buckkets & William Blau for the TSI smoothing method.

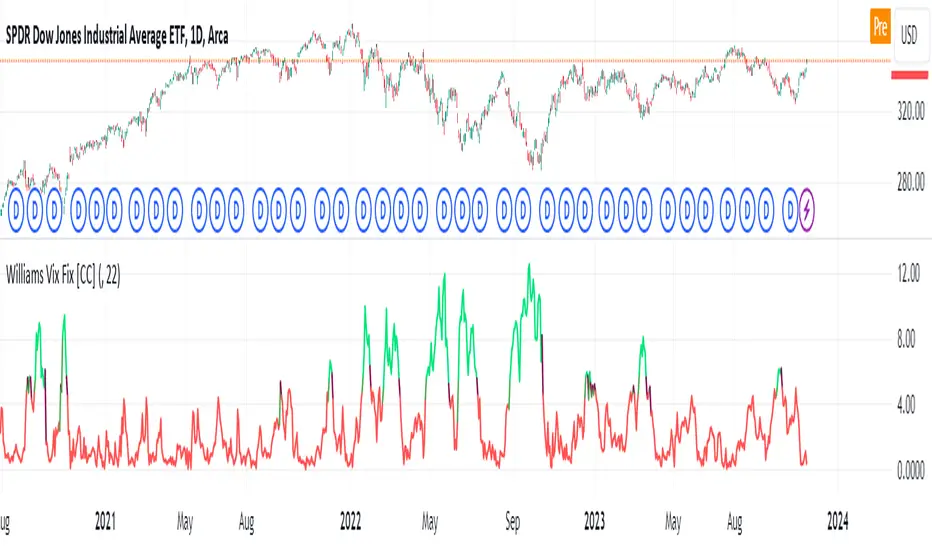
Williams Vix Fix [CC]The Vix Fix indicator was created by Larry Williams and is one of my giant backlog of unpublished scripts which I'm going to start publishing more of. This indicator is a great synthetic version of the classic Volatility Index and can be useful in combination with other indicators to determine when to enter or exit a trade due to the current volatility. The indicator creates this synthetic version of the Volatility Index by a fairly simple formula that subtracts the current low from the highest close over the last 22 days and then divides that result by the same highest close and multiplies by 100 to turn it into a percentage. The 22-day length is used by default since there is a max of 22 trading days in a month but this formula works well for any other timeframe. By itself, this indicator doesn't generate buy or sell signals but generally speaking, you will want to enter or exit a trade when the Vix fix indicator amount spikes and you get an entry or exit signal from another indicator of your choice. Keep in mind that the colors I'm using for this indicator are only a general idea of when volatility is high enough to enter or exit a trade so green colors mean higher volatility and red colors mean low volatility. This is one of the few indicators I have written that don't recommend to buy or sell when the colors change.
This was a custom request from one of my followers so please let me know if you guys have any other script requests you want to see!
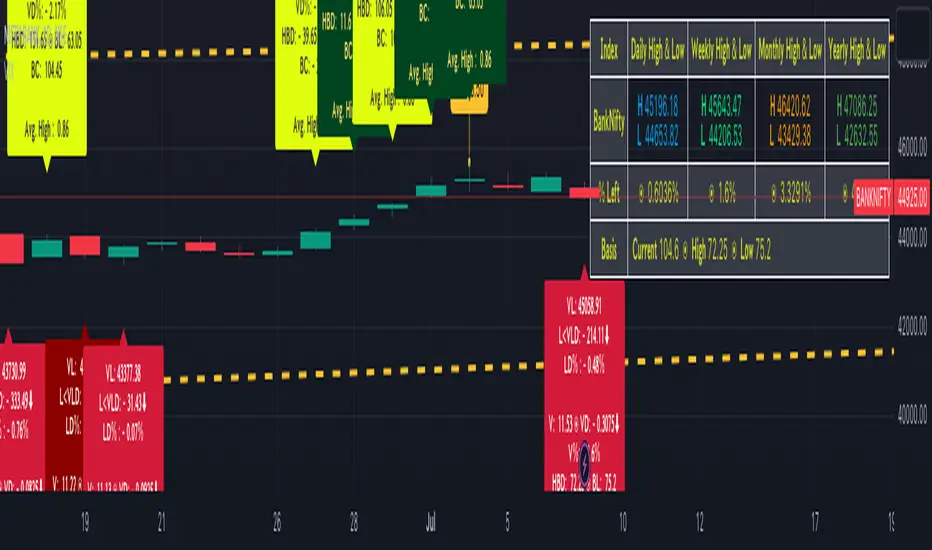
BankNifty targets using VIX Version 2Original Idea Credit: Verified Market Waves
Hi,
After watching different videos online on how to get targets of BankNifty & Nifty decided to write this small script using VIX.
Nothing great but I really like the concept of getting high and low targets for the day or weekly or monthly or yearly.
What does the script do
1. We get closing of India Vix & BankNifty and Nifty
2. We get square root of Daily (365 days) | Weekly (52) | Monthly (12) & Yearly (1)
3. We divide India Vix closing with different square root to get a decimal value.
4. We use the derived value from step 3 which is used as % to calculate high and low values on BankNifty close price.
Small explanation via below screen shot to understand how to use it.
As always it comes with source code so you can modify as per your requirement.
Hope it helps 👍
Williams Vix Fix Bottoms and TopsThis indicator uses the very popular Williams Vix Fix for Bottoms by Chris Moody but not only does it search for bottoms, it can also be switch to work for tops for those who look to short the market. I've also added in a few options like flipping the indicator, color adjustments on the settings page, as well as cut a few of the options I feel did not need to be in which cluttered the screen when the settings were opened. In his later revisions of the Williams Vix Fix, CM took out the functions which draw the high/low ranges as well as the standard deviation which is what this indicator uses to show entry points. I have added options back on to draw these, I think it's useful. To be honest, I have not messed around with the number settings much so I am not sure how adjusting the look back range or going for smaller / bigger percentage changes would change how well the indicator works. It seems to work very well at its default settings.
With the Bollinger Band deviation, you have to remember that it looks back at the set amount of candles (20 by default) and uses those for the standard deviation: 1 dev = 68%, 2 dev = 95%, 3 dev = 99.7%
These percentages mean that at 2 dev, 95% of the last 20 candles will remain within the boundaries of the Bollinger Bands. Three tends to be too high, one is usually too low. Two is pretty good.
The lowest percentile option probably won't change much other than bring up the bottom line which doesn't effect the alerts or signals, just something to observe.
The highest percentile option makes a difference similar to the stand deviation and Bollinger Band. The higher you put it, the less likely it will get triggered but the more reliant it of a signal it should be.
As always, I have left notes throughout the code and I did leave in the code that was original but commented it out as I don't believe it's worth having.
I like to have the high/lows drawn, as well as the standard deviation. Then I find that the filtered entries are most accurate signals to follow. Simple entry is hit or miss, Aggressive entry is always early but sometimes that's not a great thing.
Index Reversal Range with Volatility Index or VIXWhat is the Indicator?
• The indicator is a visualization of maximum price in which the respective index can go up to in comparison with it's Volatility Index or VIX.
Who to use?
• Intraday
• Swing
• Position
• Long term Investors
• Futures
• Options
• Portfolio Managers
• Mutual Fund Managers
• Index Traders
• Volatility based Traders
• Long term Investors and Options Traders gets the maximum benefit
What timeframe to use?
• 1 Year: Position & Investors
• 6 Months: Position & Investors
• 3 Months: Swing & Position
• 1 Month: Swing & Position
• 1 Week: Swing
• 1 Day: Swing
• 1 Hour: Intraday & Swing
What are Upper and Lower lines?
• Upper Line: If the index price reach closer to the Upper line there is a high chance of reversal to Bearish trend.
• Lower Line: If the index price reach closer to the Lower line there is a high chance of reversal to Bullish trend.
• This need to be confirmed with multiple levels like Daily, Weekly, Monthly etc.
How to use?
• If the price reach closer to that level there is a high chance of reversal from the current trend.
• To identify the reversal zone of the index.
• To identify the trend.
• Option Traders can Sell a Call or Put Option from that level.
• Long term Investors, Position or Swing traders can plan for a Long entry.
• Intraday traders can use lower timeframes to do the same.
Indicator Menu
• Input VIX: Identify the VIX Symbol of your Index and type it in the box.
• For example for NIFTY Index chart type INDIAVIX in the box.
• Choose multiple timeframes according to your convenience.
How to turn on indicator Name and Value labels?
• Right side of the screen >
• Right click on the Price scale >
• Labels > Indicators and financial name labels, Indicators and financial value labels
Further Reading:
• Various videos and reading materials are available about this method.

JPMorgan VIX Buy SignalJPMorgan Chase & Co. strategists have identified what they say is a near bulletproof indicator to strengthen their argument that stock markets are poised to rally.
The buy signal is triggered when the Cboe Volatility Index (VIX) rises by more than 50% of its 1-month (30 day) moving average, which it last did on January 25th 2022, according to the strategists led by Mislav Matejka. The indicator has proven 100% accurate outside of recessions over the last three decades.
Instructions:
Symbol - VIX
Timeframe - Daily
Red Triangle - Close / 30 Day SMA >= 1.5

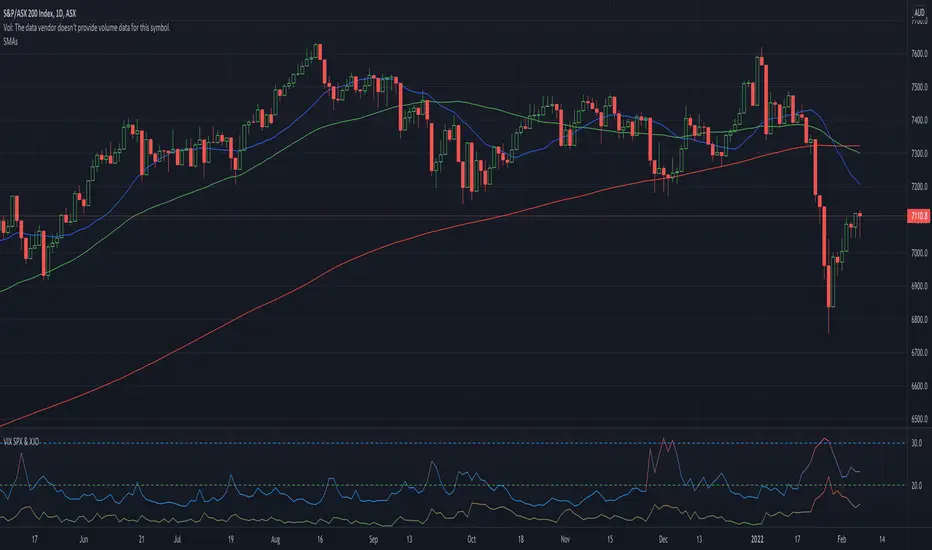
VIX SPX & XJOVix is a volatility indicator that lets traders know when to be cautious.
This indicator shows the volatility for the US market as well as the Australian market on seperate lines.
Blue lines are Vix for SPX (S&P 500)
If blue indicator goes above 30, high volatility is present and caution should be taken.
Green lines are Vix for XJO (ASX 200)
If green indicator goes above 20, high volatility is present and caution should be taken.
NIFTY VIX Bands1) The script takes current INDIA VIX as input Daily time frame for NIFTY
2) Used a Formula VIX Value / Square root of Time Period
3) Change Timeframe input accordingly 1 Year = 1, Monthly = 12, Weekly = 52, Daily = 365
4) based point 2 formula with 1 standard deviation it creates upper & lower range bands
5) This is generally used for option selling by big traders they go and sell above the band strikes
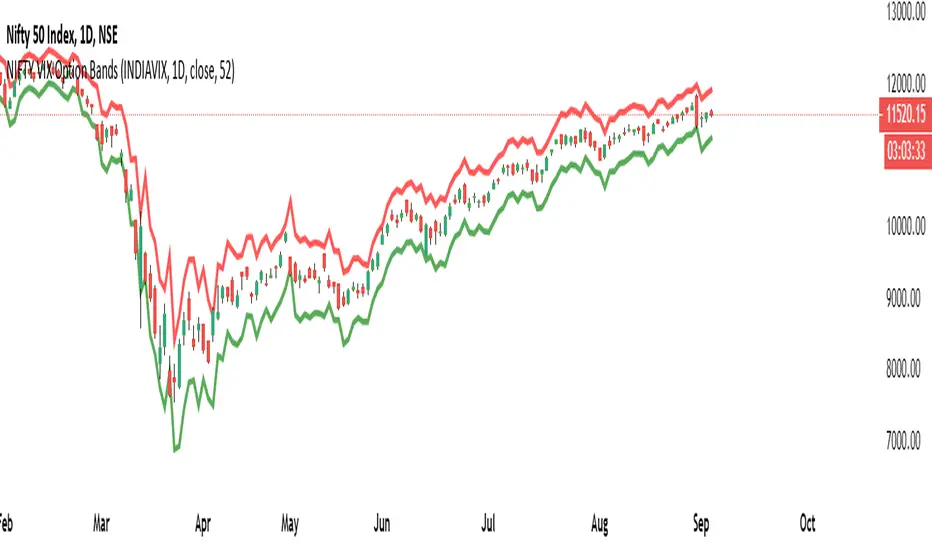
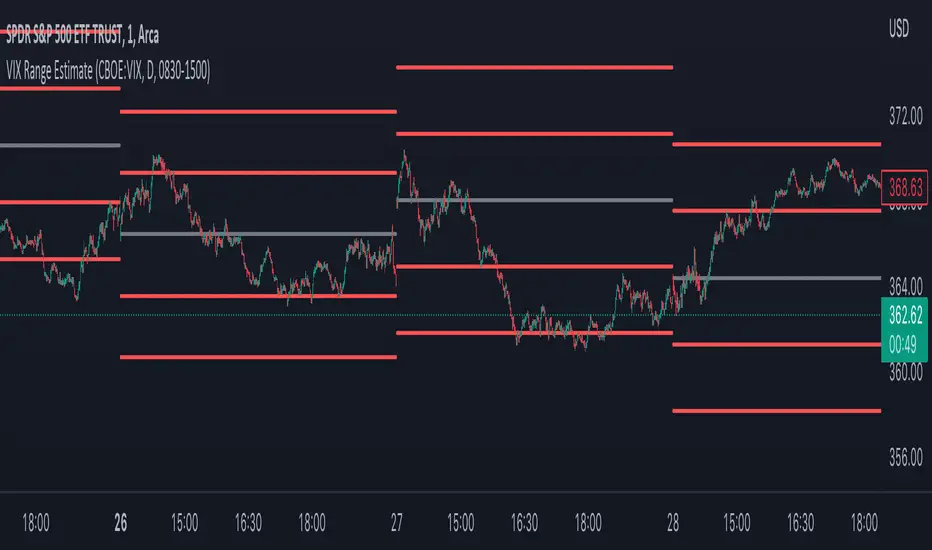
Dealar VIX Implied Range + Retracement LevelsThis Implied range Is derived by the VIX(1 sd annual +/- Implied move.)
This Indicator plots the daily Implied range, A lot of quantitative trading firms/ MM firms hedge their delta & gamma exposure around the Implied range(prop calc). I have added retracement levels as well, so you have more pivot levels.
Enjoy!

VIX Implied rangeVIX Range, the difference between this and VIX range estimate Is that this Is using calendar days(how options are priced) rather than trading days.
Artharjan INDIA VIX v/s Nifty Volatility DashboardHi,
I have created Artharjan INDIA VIX v/s Nifty Volatility Dashboard to forecast the Annual, Quarterly, Monthly, Weekly, Daily and Hourly Volatility of NIFTY Benchmark Index based on current value of INDIA VIX. This will help Index Options Sellers to decide the range of Nifty for the given period based on current level of volatility indicated by INDIA VIX.
Options Sellers may make use of the Min Range and Max Range values for the Strike Price Selection.
Regards
Rahul Desai
@Artharjan

JPM VIX Signal - Non OverlayJPMorgan Chase & Co . strategists have identified what they say is a near bulletproof indicator to strengthen their argument that stock markets are poised to rally.
The buy signal is triggered when the Cboe Volatility Index ( VIX ) rises by more than 50% of its 1-month (30 day) moving average, which it last did on January 25th 2022, according to the strategists led by Mislav Matejka. The indicator has proven 100% accurate outside of recessions over the last three decades.
Instructions:
Symbol - SPY
Timeframe - Daily
Signal - Indicator exceeds horizontal line of 1.5

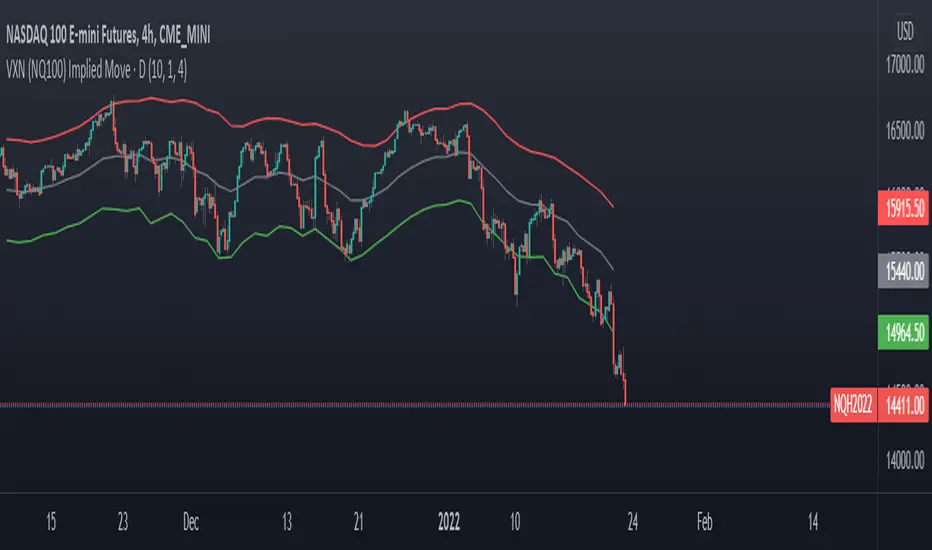
VXN (NQ100 VIX) Implied Move Bands for NQ futures.A spin-off of my similar script for ES futures. This script uses the VXN Index instead of the VIX, which represents the 30-day implied volatility of Nasdaq-100 options and then uses that value to plot bands on the chart, helping traders identify price extremes as identified by the options market. Users can modify the moving average, bands multiplier, and number of lookback days used in the calculation to suit their trading style.
SMART4TRADER - S&P500 Volatility Range SD by VIXAn indicator for determining intraday volatility using the standard deviation calculated from the VIX volatility.
For questions about using this indicator, write a private message @smart4trader
-----------------
Индикатор для определения внутридневной волатильности с применением среднеквадратического отклонения расcчитанного от волатильности VIX.
По вопросам использования данного индикатора пишите личное сообщение @smart4trader
