Open = High or Low?Open = High or Low? (o=horl)
Coefficient e.g.
EURUSD: 0.0001
BTCJPY: 100
USDJPY: 0.01
BTCUSD: 1
Cari skrip untuk "usdjpy"
Line Break StrategyLine Break Strategy
Entry rule:
Long on a bullish line and short on a bearish line.
Backtest:
Profit factors are shown below for three-line break.
Daily time frame, FXCM broker.
EURUSD: 1.267, USDJPY: 1.039, GBPUSD: -0.816, AUDUSD: -0.959
S&P500: -0.783, Nikkei225: 1.099
CrudeOil: 1.03, Gold: 1.196
BTCUSD: -0.883
Reference:
Steve Nison, Beyond Candlesticks - New Japanese Charting Techniques Revealed
Note:
This strategy doesn't work properly on the linebreak chart.
A good example is shown below. The entry prices are not always correct.
If you have signal, but the next candle moves in the opposite direction, the entry price is drawn at the Open of the new candle instead of the Close of the previous candle.
The results of backtest are unreliable due to this reason.

Ralph Indicator - ZaraTrust Smart MoneyThe Ralph Indicator – ZaraTrust Smart Money is a powerful yet simple Smart Money Concepts (SMC) based tool designed for traders who want to trade like institutions. It auto-detects high-probability Buy/Sell zones, Support/Resistance levels, and Demand/Supply areas on the chart — giving you clear, visual, and actionable signals without the clutter.
⸻
🔍 Key Features:
✅ Smart Money Structure
• Uses pivot-based logic to identify potential structure points
• Helps you understand market flow (e.g., BOS, CHoCH simplified logic)
✅ Automatic Support & Resistance
• Plots major levels based on significant highs and lows
• Helps catch key reversal or breakout zones
✅ Demand & Supply Zones
• Visually shows areas where price may react strongly
• Based on smart pivot detection from recent swings
✅ Buy/Sell Trade Signals
• Highlights buy when price breaks resistance (possible bullish shift)
• Highlights sell when price breaks support (possible bearish shift)
✅ Clean & Easy UI
• Toggle features on/off from settings panel
• Labels and shapes are plotted clearly on the chart for instant reading
⸻
🛠️ Recommended Use:
• Use on 15min to 4H timeframe for intraday or swing trading
• Combine with price action (e.g., confirmation candles, liquidity grab)
• Works best when paired with institutional logic (OBs, FVG, liquidity)
⸻
⚠️ Disclaimer:
This indicator is a tool, not a signal service.
It does not guarantee 98% accuracy, but it’s designed to highlight smart money zones and high-probability areas. Always do your own risk management and backtest before using on a live account.

Momentum Candle V3 by Sekolah TradingMomentum Candle v3 by Sekolah Trading
Description:
Momentum Candle v3 is a technical indicator designed to identify market momentum signals based on price movement within a single candle. The indicator measures the size of the candle's body and wick to determine if the market is showing strong bullish or bearish momentum.
Key Features:
Candle Size: Measures price movement within a single candle to assess market momentum.
Short Wick: Focuses on wick length, with short wicks indicating that the closing price is more significant than the opening price.
Bullish/Bearish Momentum: Provides bullish signals when the closing price is higher than the open, and bearish signals when the closing price is lower than the open.
Customizable Minimum Body: Users can adjust the minimum body size for XAUUSD and USDJPY pairs according to their trading preferences.
Timeframe: Works on M5 and M15 timeframes for XAUUSD and USDJPY currency pairs.
How to Use:
Bullish Signal: The indicator signals bullish momentum when the candle body is sufficiently large and the wick is short, with the closing price higher than the open.
Bearish Signal: The indicator signals bearish momentum when the candle body is sufficiently large and the wick is short, with the closing price lower than the open.
Pip Parameters: Adjust the pip values for XAUUSD and USDJPY according to market conditions or your trading preferences.
Note: This indicator is a tool for technical analysis and does not guarantee specific trading results. It is recommended to use it alongside other strategies and analyses for better accuracy.
Realistic Backtest Results:
To ensure transparency and honesty in the backtest, here are some key factors to consider:
Position Size: The backtest uses a realistic position size of about 5-10% of the account equity per trade.
Commission & Slippage: A commission of 0.1% per trade and slippage of 1 pip were used in the backtest simulation to reflect real market conditions.
Number of Trades: The backtest sample includes more than 100 trades for a representative result.
Example of Backtest Results:
Profitability: The backtest results on XAUUSD and USDJPY show consistent performance with this strategy on the M5 and M15 timeframes.
Commission and Slippage: Adjusting for commission and slippage showed better accuracy under more realistic market scenarios.
How to Use the Indicator:
Signals from this indicator can be used to confirm market momentum in trending conditions. However, it is highly recommended to combine this indicator with other technical analysis tools to minimize the risk of false signals.
Important Notes:
Honesty & Transparency: This indicator is designed to provide signals based on technical analysis and does not guarantee specific trading results.
No Over-Claims: The backtest results displayed represent realistic scenarios and are not intended to promise certain profits.
Original Content: The code for this indicator is original and does not violate any copyrights.
Tagging:
Smart Tags: Momentum, Candle, XAUUSD, USDJPY, Bullish, Bearish, M5, M15, Technical Indicator, Market Momentum.

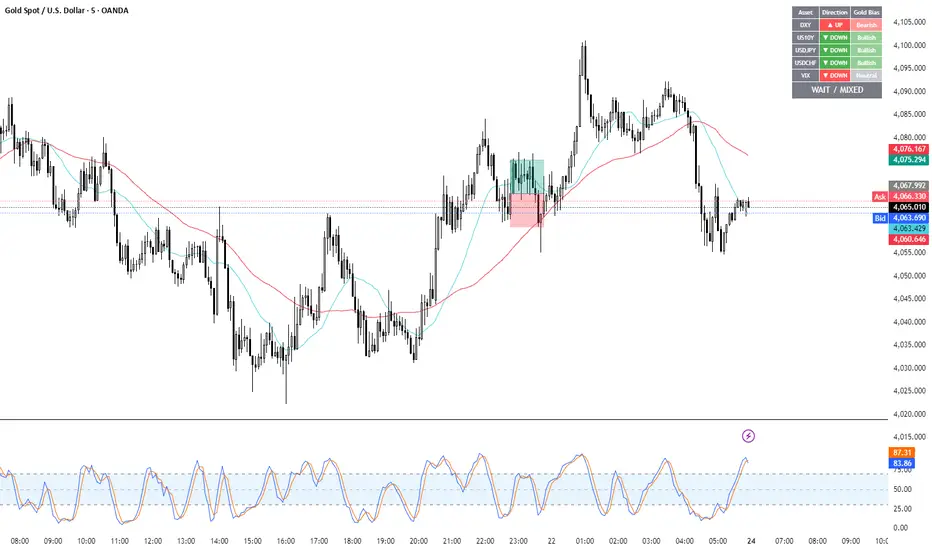
Gold Correlation Dashboard + Alerts [XAUUSD Helper]這是一個專為黃金 (XAUUSD) 交易者設計的 **跨市分析儀表板 (Intermarket Correlation Dashboard)**。
這個指標的核心邏輯基於基本面與資金流向,協助交易者在 10 秒內快速判斷黃金的當前趨勢。它自動監控與黃金高度負相關的資產(美元、美債、日圓),並在圖表上直接顯示多空傾向。
### 📊 監控資產與邏輯
本腳本即時抓取以下關鍵市場數據,並分析其對黃金的影響:
1. **DXY (美元指數)**:黃金最大競爭對手。
- DXY 跌 📉 → 黃金偏多
- DXY 漲 📈 → 黃金偏空
2. **US10Y (10年期美債殖利率)**:黃金的持有成本指標。
- 殖利率跌 📉 → 黃金偏多
- 殖利率漲 📈 → 黃金偏空
3. **USDJPY (美日)** & **USDCHF (美瑞)**:避險資金流向參考。
- 匯率跌 (日圓/瑞郎強) 📉 → 黃金偏多
4. **VIX (恐慌指數)**:市場情緒指標。
- VIX 飆升 📈 → 黃金通常受惠 (避險屬性)
### 🚀 主要功能
1. **即時儀表板**:無需切換視窗,直接在黃金圖表角落查看所有關鍵資產的漲跌狀態。
2. **智能信號總結**:
- 系統會自動計算 **DXY + US10Y + USDJPY** 的綜合方向。
- 當這三大核心指標方向一致時,系統會顯示 **★ STRONG BUY (強力做多)** 或 **★ STRONG SELL (強力做空)**。
- 根據歷史經驗,當這三者同步時,趨勢準確度極高。
3. **警報系統 (Alerts)**:
- 內建警報功能,當出現「強力做多」或「強力做空」信號時,可設定推播通知,不錯過進場機會。
### ⚙️ 如何使用
- 將此指標加載到 XAUUSD (黃金) 的圖表上。
- 建議搭配 H1, H4 或 Daily 時框使用。
- **綠色背景** = 利多黃金 (Bullish)
- **紅色背景** = 利空黃金 (Bearish)
---
*免責聲明:此腳本僅供輔助分析與教育用途,不構成任何投資建議。交易請做好風險控管。*
**Gold (XAUUSD) Intermarket Correlation Dashboard & Alerts**
This indicator is designed for Gold traders who want to combine Technical Analysis with **Fundamental Intermarket Analysis**. It provides a real-time dashboard overlay that monitors key assets highly correlated with XAUUSD.
According to market logic, Gold is heavily influenced by the US Dollar (DXY), US Treasury Yields (US10Y), and global risk sentiment (USDJPY/VIX). This script helps you spot the trend in seconds.
### 📊 Monitored Assets & Logic
The dashboard tracks the real-time direction of the following assets and calculates their impact on Gold:
1. **DXY (US Dollar Index)**: Inverse correlation.
* DXY ↓ = Bullish for Gold
* DXY ↑ = Bearish for Gold
2. **US10Y (US 10-Year Treasury Yield)**: Inverse correlation (Cost of Holding).
* Yields ↓ = Bullish for Gold
* Yields ↑ = Bearish for Gold
3. **USDJPY & USDCHF**: Risk sentiment and currency flow.
* Pair ↓ (Strong JPY/CHF) = Bullish for Gold
4. **VIX (Volatility Index)**: Fear gauge.
* VIX ↑ = Generally Bullish for Gold (Safe Haven demand)
### 🚀 Key Features
**1. Real-Time Dashboard**
View the status of all 5 key assets directly on your XAUUSD chart without switching tabs. The dashboard indicates the "Gold Bias" (Bullish/Bearish) for each asset based on the current timeframe.
**2. Smart Bias Signal ("The 3-Storyline Confirmation")**
The script automatically analyzes the three most critical indicators: **DXY, US10Y, and USDJPY**.
* **★ STRONG BUY ★**: When DXY, US10Y, and USDJPY are **ALL Falling** simultaneously. (High probability setup).
* **★ STRONG SELL ★**: When DXY, US10Y, and USDJPY are **ALL Rising** simultaneously.
**3. Integrated Alerts**
Never miss a setup. You can set alerts to notify you immediately when the "Strong Buy" or "Strong Sell" conditions are met.
### ⚙️ How to Use
1. Add this script to your XAUUSD chart.
2. Works best on H1, H4, or Daily timeframes.
3. Look for the **Summary Row** at the bottom of the dashboard:
* **Green (Strong Buy)**: Look for Long entries.
* **Red (Strong Sell)**: Look for Short entries.
---
*Disclaimer: This script is for educational and informational purposes only. It does not constitute financial advice. Always manage your risk.*
ian_Trado v15 Trend Entry Filter# 📈 ian_Trado v15 Trend Entry Filter (Pine Script v6)
The **ian_Trado v15** is a multi-factor **trend confirmation filter** for NASDAQ (NAS100), Dow Jones (DJ30), Gold (XAU), DAX, and USDJPY.
It combines **EMA structure**, **Donchian channel breakout**, **MACD histogram momentum**, **Volume confirmation**, and a **Range Compression Filter** to avoid entering during choppy or sideways markets.
✅ Designed for **bot deployment** (e.g., grid bots, long/short breakout bots) or **manual trading**.
---
## 🔍 How This Filter Works:
1. **EMA Trend Confirmation**
- Long Trend: EMA(1) > EMA(5) > EMA(60)
- Short Trend: EMA(1) < EMA(5) < EMA(60)
2. **Donchian Channel Width Expansion**
- Only allows trades when the **breakout width** exceeds a minimum threshold.
3. **MACD Histogram Slope Filter (Optional)**
- Confirms momentum building in the direction of the trend.
- Strict Mode: MACD histogram must consistently rise or fall over 3 bars.
4. **Volume Filter (Optional)**
- Ensures volume supports the move (filters out weak conditions).
5. **Range Compression Filter (Optional)**
- Avoids entries during sideways chop.
6. **Cooldown Control**
- Limits overtrading by requiring spacing between entries.
7. **Exit Conditions**
- Gray dot appears when trending conditions are no longer valid.
---
## ⚙️ Settings Explained:
| Setting | Description |
|:--------|:------------|
| **Cooldown Bars** | Minimum bars between consecutive entries |
| **Profit Target (%)** | Visual profit marker for exit tracking |
| **Donchian Channel Length** | Lookback period for detecting breakout width |
| **Minimum Donchian Width** | Threshold to confirm meaningful breakouts |
| **Volume Lookback Period** | Average volume validation window |
| **Box Range (Range Compression)** | Max allowed price range over lookback bars |
| **Range Compression Bars** | Number of bars to check for range compression |
| **Strict MACD Filter** | Use stricter MACD slope checks |
---
## 📊 Recommended Settings by Instrument (1H Chart):
| Asset | Min Donchian Width | Range Compression | Profit Target |
|:------|:-------------------|:------------------|:--------------|
| **NAS100** (Nasdaq) | 300–450 pts | 400 pts / 40 bars | 1.5% |
| **DJ30** (Dow Jones) | 400–600 pts | 500 pts / 40 bars | 1.0–1.5% |
| **XAU/USD** (Gold) | 10–15 pts | 8 pts / 30 bars | 0.8–1.2% |
| **DAX40** (Germany) | 200–300 pts | 250 pts / 40 bars | 1.0% |
| **USD/JPY** (Forex) | 0.5–0.8 pts | 0.4 pts / 40 bars | 0.5–0.8% |
---
## 🔔 Alerts Available:
- Long Entry
- Short Entry
- Exit Zone
> **Note:** Volume filter may be disabled if volume is unreliable (e.g., some forex pairs).
---
## 📅 Version:
- **ian_Trado v15** — April 2025
- Built with **Pine Script v6** for maximum stability
- Clean toggling and plotting logic (no `na` errors)

PRO SMC Full Suite BY Mashrur“PRO SMC Full Suite BY Mashrur”
A Pine Script (v5) indicator for TradingView, focused on Smart Money Concepts (SMC). It overlays on price charts and provides visual tools for identifying key institutional trading behaviors.
🎯 Purpose
This script is designed to help traders analyze and trade using SMC principles by automatically detecting:
Order Blocks (OBs)
Fair Value Gaps (FVGs)
Breaks of Structure (BoS)
Liquidity Sweeps (Buy/Sell Side Liquidity Grabs)
Mitigation Entries
⚙️ Inputs / Settings
Show Fair Value Gaps: Toggle FVGs on/off
Higher Timeframe (HTF): Choose HTF for OB analysis
Use HTF OBs: Switch between current TF OBs and HTF OBs
Show Order Blocks: Toggle OBs on/off
Show OB Mitigation Entries: Toggle mitigation entry signals on/off
🧠 Core Logic Overview
🔹 1. Swing Points Detection
Identifies swing highs/lows using a 3-bar pattern (pivot-based structure).
🔹 2. Break of Structure (BoS)
A bullish BoS happens when price closes above the last swing high.
A bearish BoS occurs when price closes below the last swing low.
🔹 3. Order Block Detection
Upon BoS, the script marks the previous candle as the Order Block.
Uses either:
Current TF OBs (based on price action)
HTF OBs (based on candle body direction)
🔹 4. Mitigation Entry Logic
A mitigation occurs when price returns to the OB and reacts with confirmation:
Bullish: price dips into OB and closes above
Bearish: price wicks into OB and closes below
Plots entry markers for these mitigations.
🔹 5. Liquidity Sweeps
Detects equal highs/lows (liquidity zones)
Marks Buy SL when price dips below an equal low then closes above
Marks Sell SL when price breaks above an equal high then closes below
🔹 6. Fair Value Gaps (FVGs)
FVG Up: Gap between candle 3 and candle 1 (low > high )
FVG Down: Gap between candle 3 and candle 1 (high < low )
Plots highlighted boxes on these gaps
📊 Visual Elements
Boxes: For OB zones and FVGs
Shapes:
Labels: OB Buy/Sell entries
Triangles: Buy SL / Sell SL liquidity sweeps
Lines: Equal Highs and Lows
🔔 Alerts
Built-in alerts to notify when:
OB entries are confirmed
Liquidity sweeps happen
Helps in automation or active monitoring
✅ Ideal For
Traders using SMC, ICT concepts, Wyckoff, or institutional trading models
Anyone wanting to automate detection of structural elements on their chart

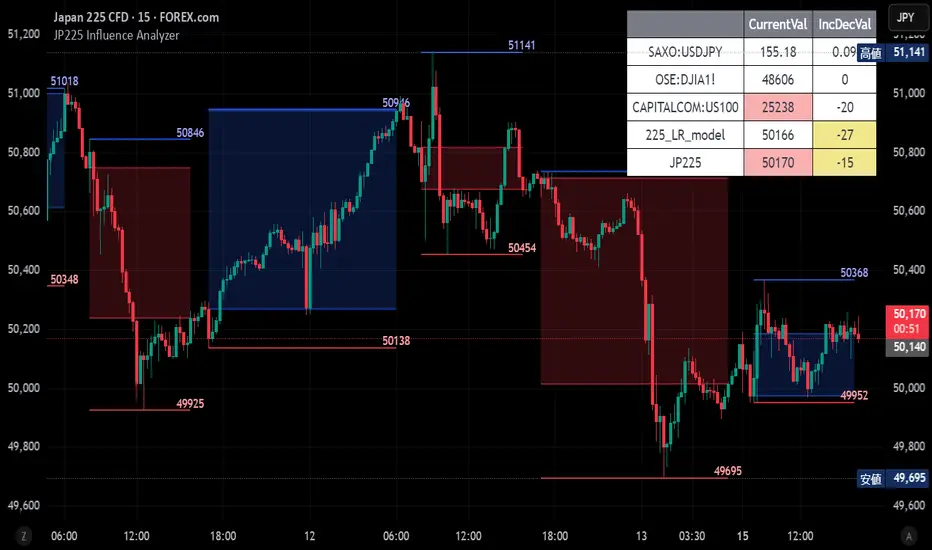
JP225 Influence AnalyzerThis tool provides a way to assess how USDJPY and DJIA influence JP225, using standardization and linear regression for quantitative evaluation. It also detects deviations from the linear model and displays the results in a colored table.
Table Structure
Row 1: Current value of USDJPY and its change from the previous bar
Row 2: Current value of DJIA and its change from the previous bar
Row 3: Theoretical value of Nikkei 225 calculated using the least squares method from USDJPY
and DJIA, and its change from the previous bar
Row 4: Current value of the chart symbol (Nikkei 225) and its change from the previous bar
Background Color Meanings
A. Current Value Column (Column 2)
If USDJPY or DJIA significantly contributes to the change in the theoretical value of Nikkei 225, the cell turns blue (increase) or red (decrease). The threshold is 1.5.
If the current value of Nikkei 225 increases, it turns blue; if it decreases, it turns red.
B. Change Value Column (Column 3)
If there is a discrepancy between the change in the theoretical value and the actual change of Nikkei 225, the cell turns yellow (moderate discrepancy: threshold 20) or red (significant discrepancy: threshold 50).
Judgment Based on Current Value Column (Column 2)
If the color of USDJPY or DJIA matches the color of Nikkei 225, that symbol is the main cause.
If there is no match, the main cause is "other factors."
Judgment Based on Change Column (Column 3)
Yellow: Suggests that other factors may be influencing the price.
Red: Strongly indicates that other factors are the main cause.
Parameter Descriptions Parameter Descriptions
symbol_x: Symbol for USDJPY (default: "SAXO:USDJPY")
symbol_y: Symbol for DJIA (default: "OSE:DJIA1!")
threshold_value1: Threshold for determining the influence of USDJPY and DJIA (blue/red color) (default: 1.5)
threshold_value2: Threshold for detecting specific price movements in Nikkei 225 (yellow color) (default: 20)
threshold_value3: Threshold for detecting significant price movements in Nikkei 225 (red color) (default: 50)
data_count: Number of past data points used for calculations (default: 10)
インジケーターの概要
このインジケーターは、日経225先物やCFDの値動きの主な原因が
以下のどれに起因するのかをリアルタイムで表示します
1. ドル円 (USDJPY)
2. ダウ (DJIA)
3. その他の要因(突発的なニュース、225の節目価格への攻防など)
テーブルの構成
1行目 ドル円の現在値と前足からの増減
2行目 ダウの現在値と前足からの増減
3行目 ドル円とダウから最小二乗法で算出した225の理論値とその増減
4行目 チャート銘柄(225)の現在値と前足からの増減
背景色の意味
1. 現在値列 (2列目):ドル円またはダウが225の理論値増減に大きく寄与した場合、
それぞれ青(増加)または赤(減少)に変化。閾値は1.5
225の現在値が増加すれば青、減少すれば赤。
2. 増減値列 (3列目):225の理論値増減と実際の増減が乖離した場合、
黄(中程度:閾値は20)または赤(大幅:閾値は50)に変化。
現在値列(2列目)での判断:
1. 銘柄(ドル円またはダウ)の色が225の色と一致する場合、その銘柄が主な原因。
2. 一致しない場合、主な原因は「その他」。
増減列(3列目)での判断:
黄色 その他の要因が影響している可能性。
赤色 その他の要因が主な原因と強く示唆。
パラメータの説明
symbol_x ドル円のシンボル(デフォルト: "SAXO:USDJPY")
symbol_y ダウのシンボル(デフォルト: "OSE:DJIA1!")
threshold_value1 ドル円とダウの影響を判定する(青/赤色)閾値(デフォルト: 1.5)
threshold_value2 225固有の値動きを判定する(黄色)閾値(デフォルト: 20)
threshold_value3 225固有の大きな値動きを判定する(赤色)閾値(デフォルト: 50)
data_count 計算に使用する過去データの本数(デフォルト: 10)
Yen Carry Stress Badge Indicator Overview
This dashboard measures stress in the yen‑carry cycle using price‑based signals from FX, volatility, and global equity markets. Each component is scored based on its current condition, and the combined total reflects whether global markets are in a risk‑on expansion, transition phase, or risk‑off contraction.
Dashboard Components & Indication Levels
USDJPY Trend
Bullish (0 stress): USDJPY above 50‑day MA; yen weakening; carry trade stable
Bearish (1 stress): USDJPY below 50‑day MA; yen strengthening; unwind risk rising
JPY Volatility (ATR%)
Low (0 stress): ATR% < 0.8; stable FX environment
Medium (1 stress): ATR% 0.8–1.2; early instability
High (2 stress): ATR% > 1.2; elevated yen‑carry stress
VIX (Equity Volatility)
Low (0 stress): VIX < 18; calm markets
Medium (1 stress): VIX 18–25; rising uncertainty
High (2 stress): VIX > 25; risk‑off conditions
VWO Strength (Emerging Markets)
Strong (0 stress): VWO/VTI above 50‑day MA; EM participating; liquidity healthy
Weak (1 stress): VWO/VTI below 50‑day MA; EM lagging; early stress signal
VEA Strength (Developed Markets)
Strong (0 stress): VEA/VTI above 50‑day MA; broad global participation
Weak (1 stress): VEA/VTI below 50‑day MA; global breadth narrowing
Total Stress Score (0–10)
0–3: Low Stress (Risk‑On Expansion)
4–6: Moderate Stress (Transition Phase)
7–10: High Stress (Risk‑Off Contraction)

Gold Correlation Dashboard (Locked D1)** **
**Gold Intermarket Correlation Dashboard (Locked Timeframe Edition)**
This indicator is a specialized Intermarket Analysis tool designed specifically for XAUUSD (Gold) traders. It monitors 5 key assets that strongly influence Gold's price and provides a real-time bias (Bullish/Bearish) based on their correlation.
**Key Features:**
1. **Locked Timeframe Logic:**
* The dashboard allows you to "Lock" the analysis to a higher timeframe (Default: Daily/D1).
* This means you can trade on lower timeframes (e.g., 5m or 15m) while the dashboard keeps you aligned with the major Daily trend, preventing you from trading against the main flow.
2. **Intermarket Correlations:**
* **DXY (Dollar Index):** Negative Correlation (DXY Down = Gold Bullish).
* **US10Y (Yields):** Negative Correlation (Yields Down = Gold Bullish).
* **USDJPY & USDCHF:** Negative Correlation.
* **VIX:** Positive Correlation (VIX Up = Gold Bullish/Safe Haven).
3. **Smart Scoring System:**
* The script calculates a "Bullish Percentage" (e.g., 80% BUY or 100% BUY) based on how many of these 5 assets align with a Gold Long position.
4. **Strong Alerts:**
* Alerts are triggered only when the three core drivers (DXY, US10Y, USDJPY) align perfectly.
-------------------------------------------------------
** **
**黃金跨市場相關性儀表板 (鎖定週期版)**
這是一個專為黃金 (XAUUSD) 交易者設計的跨市場分析工具。它自動監控 5 個對黃金價格影響最大的資產,並根據相關性提供即時的多空傾向。
**核心功能:**
1. **鎖定時間級別 (Locked Timeframe):**
* 您可以將儀表板的分析數據鎖定在較大級別(預設:D1 日線)。
* 這意味著當您在 5 分鐘或 15 分鐘圖交易時,儀表板依然顯示日線級別的趨勢,幫助您「順大勢、逆小勢」,避免被短線雜訊誤導。
2. **跨市場相關性邏輯:**
* **DXY (美元指數)**:負相關 (美元跌 -> 黃金漲)。
* **US10Y (美債殖利率)**:負相關 (殖利率跌 -> 黃金漲)。
* **USDJPY & USDCHF**:負相關。
* **VIX (恐慌指數)**:正相關 (恐慌升 -> 黃金漲)。
3. **智能評分系統:**
* 系統會計算有多少資產支持黃金上漲,並給出百分比評分 (例如:80% BUY)。
4. **強力警報:**
* 只有當 DXY, US10Y, USDJPY 三大核心指標方向完全一致時,才會觸發強力買入/賣出警報。

Smart MACD Volume Trader# Smart MACD Volume Trader
## Overview
Smart MACD Volume Trader is an enhanced momentum indicator that combines the classic MACD (Moving Average Convergence Divergence) oscillator with an intelligent high-volume filter. This combination significantly reduces false signals by ensuring that trading signals are only generated when price momentum is confirmed by substantial volume activity.
The indicator supports over 24 different instruments including major and exotic forex pairs, precious metals (gold and silver), energy commodities (crude oil, natural gas), and industrial metals (copper). For forex and commodity traders, the indicator automatically maps to CME and COMEX futures contracts to provide accurate institutional-grade volume data.
## Originality and Core Concept
Traditional MACD indicators generate signals based solely on price momentum, which can result in numerous false signals during low-activity periods or ranging markets. This indicator addresses this critical weakness by introducing a volume confirmation layer with automatic institutional volume integration.
**What makes this approach original:**
- Signals are triggered only when MACD crossovers coincide with elevated volume activity
- Implements a lookback mechanism to detect volume spikes within recent bars
- Automatically detects and maps 24+ forex pairs and commodities to their corresponding CME and COMEX futures contracts
- Provides real institutional volume data for forex pairs where spot volume is unreliable
- Combines two independent market dimensions (price momentum and volume) into a single, actionable signal
- Includes intelligent asset detection that works across multiple exchanges and ticker formats
**The underlying principle:** Volume validates price movement. When institutional money enters the market, it creates volume signatures. By requiring high volume confirmation and using actual institutional volume data from futures markets, this indicator filters out weak price movements and focuses on trades backed by genuine market participation. The automatic futures mapping ensures that forex and commodity traders always have access to the most accurate volume data available, without manual configuration.
## How It Works
### MACD Component
The indicator calculates MACD using standard methodology:
1. **Fast EMA (default: 12 periods)** - Tracks short-term price momentum
2. **Slow EMA (default: 26 periods)** - Tracks longer-term price momentum
3. **MACD Line** - Difference between Fast EMA and Slow EMA
4. **Signal Line (default: 9-period SMA)** - Smoothed average of MACD line
**Crossover signals:**
- **Bullish:** MACD line crosses above Signal line (momentum turning positive)
- **Bearish:** MACD line crosses below Signal line (momentum turning negative)
### Volume Filter Component
The volume filter adds an essential confirmation layer:
1. **Volume Moving Average** - Calculates exponential MA of volume (default: 20 periods)
2. **High Volume Threshold** - Multiplies MA by ratio (default: 2.0x or 200%)
3. **Volume Detection** - Identifies bars where current volume exceeds threshold
4. **Lookback Period** - Checks if high volume occurred in recent bars (default: 5 bars)
**Signal logic:**
- Buy/Sell signals only trigger when BOTH conditions are met:
- MACD crossover/crossunder occurs
- High volume detected within lookback period
### Automatic CME Futures Integration
For forex traders, spot FX volume data can be unreliable or non-existent. This indicator solves this problem by automatically detecting forex pairs and mapping them to corresponding CME futures contracts with real institutional volume data.
**Supported Major Forex Pairs (7):**
- EURUSD → CME:6E1! (Euro FX Futures)
- GBPUSD → CME:6B1! (British Pound Futures)
- AUDUSD → CME:6A1! (Australian Dollar Futures)
- USDJPY → CME:6J1! (Japanese Yen Futures)
- USDCAD → CME:6C1! (Canadian Dollar Futures)
- USDCHF → CME:6S1! (Swiss Franc Futures)
- NZDUSD → CME:6N1! (New Zealand Dollar Futures)
**Supported Exotic Forex Pairs (4):**
- USDMXN → CME:6M1! (Mexican Peso Futures)
- USDRUB → CME:6R1! (Russian Ruble Futures)
- USDBRL → CME:6L1! (Brazilian Real Futures)
- USDZAR → CME:6Z1! (South African Rand Futures)
**Supported Cross Pairs (6):**
- EURJPY → CME:6E1! (Uses Euro Futures)
- GBPJPY → CME:6B1! (Uses British Pound Futures)
- EURGBP → CME:6E1! (Uses Euro Futures)
- AUDJPY → CME:6A1! (Uses Australian Dollar Futures)
- EURAUD → CME:6E1! (Uses Euro Futures)
- GBPAUD → CME:6B1! (Uses British Pound Futures)
**Supported Precious Metals (2):**
- Gold (XAUUSD, GOLD) → COMEX:GC1! (Gold Futures)
- Silver (XAGUSD, SILVER) → COMEX:SI1! (Silver Futures)
**Supported Energy Commodities (3):**
- WTI Crude Oil (USOIL, WTIUSD) → NYMEX:CL1! (Crude Oil Futures)
- Brent Oil (UKOIL) → NYMEX:BZ1! (Brent Crude Futures)
- Natural Gas (NATGAS) → NYMEX:NG1! (Natural Gas Futures)
**Supported Industrial Metals (1):**
- Copper (COPPER) → COMEX:HG1! (Copper Futures)
**How the automatic detection works:**
The indicator intelligently identifies the asset type by analyzing:
1. Exchange name (FX, OANDA, TVC, COMEX, NYMEX, etc.)
2. Currency pair pattern (6-letter codes like EURUSD, GBPUSD)
3. Commodity identifiers (XAU for gold, XAG for silver, OIL for crude)
When a supported instrument is detected, the indicator automatically switches to the corresponding futures contract for volume analysis. For stocks, cryptocurrencies, and other assets, the indicator uses the native volume data from the current chart.
**Visual feedback:**
An information table appears in the top-right corner of the MACD pane showing:
- Current chart symbol
- Exchange name
- Currency pair or asset name
- Volume source being used (highlighted in orange for futures, yellow for native volume)
- Current high volume status
This provides complete transparency about which data source the indicator is using for its volume analysis.
## How to Use
### Basic Setup
1. Add the indicator to your chart
2. The indicator displays in a separate pane (MACD) and overlay (signals/volume bars)
3. Default settings work well for most assets, but can be customized
### Signal Interpretation
### Visual Signals
**Visual Signals:**
- **Green "BUY" label** - Bullish MACD crossover confirmed by high volume
- **Red "SELL" label** - Bearish MACD crossunder confirmed by high volume
- **Green/Red candles** - Highlight bars with volume exceeding the threshold
- **Light green/red background** - Emphasizes signal bars on the chart
**Information Table:**
A detailed information table appears in the top-right corner of the MACD pane, providing real-time transparency about the indicator's operation:
- **Chart:** Current symbol being analyzed
- **Exchange:** The exchange or data feed being used
- **Pair:** The currency pair or asset name extracted from the ticker
- **Volume From:** The actual symbol used for volume analysis
- Orange color indicates CME or COMEX futures are being used (automatic institutional volume)
- Yellow color indicates native volume from the chart symbol is being used
- Hover tooltip shows whether automatic futures mapping is active
- **High Volume:** Current status showing YES (green) when volume exceeds threshold, NO (gray) otherwise
This table ensures complete transparency and allows you to verify that the correct volume source is being used for your analysis.
**Volume Analysis:**
- Gray histogram bars = Normal volume
- Red histogram bars = High volume (exceeds threshold)
- Green line = Volume moving average baseline
**MACD Analysis:**
- Blue line = MACD line (momentum indicator)
- Orange line = Signal line (trend confirmation)
- Gray dotted line = Zero line (bullish above, bearish below)
### Parameter Customization
**MACD Parameters:**
- Adjust Fast/Slow EMA lengths for different sensitivities
- Shorter periods = More signals, faster response
- Longer periods = Fewer signals, less noise
**Volume Parameters:**
- **Volume MA Period:** Higher values smooth volume analysis
- **High Volume Ratio:** Lower values (1.5x) = More signals; Higher values (3.0x) = Fewer, stronger signals
- **Volume Lookback Bars:** Controls how recent the volume spike must be
**Direction Filters:**
- **Only Buy Signals:** Enables long-only strategy mode
- **Only Sell Signals:** Enables short-only strategy mode
### Alert Configuration
The indicator includes three alert types:
1. **Buy Signal Alert** - Triggers when bullish signal appears
2. **Sell Signal Alert** - Triggers when bearish signal appears
3. **High Volume Alert** - Triggers when volume exceeds threshold
To set up alerts:
1. Click the indicator name → "Add alert on Smart MACD Volume Trader"
2. Select desired alert condition
3. Configure notification method (popup, email, webhook, etc.)
## Trading Strategy Guidelines
### Best Practices
**Recommended markets:**
- Liquid stocks (large-cap, high daily volume)
- Major forex pairs (EURUSD, GBPUSD, USDJPY, AUDUSD, USDCAD, USDCHF, NZDUSD)
- Exotic forex pairs (USDMXN, USDRUB, USDBRL, USDZAR)
- Cross pairs (EURJPY, GBPJPY, EURGBP, AUDJPY, EURAUD, GBPAUD)
- Precious metals (Gold, Silver with automatic COMEX futures mapping)
- Energy commodities (Crude Oil, Natural Gas with automatic NYMEX futures mapping)
- Industrial metals (Copper with automatic COMEX futures mapping)
- Major cryptocurrency pairs
- Index futures and ETFs
**Timeframe recommendations:**
- **Day trading:** 5-minute to 15-minute charts
- **Swing trading:** 1-hour to 4-hour charts
- **Position trading:** Daily charts
**Risk management:**
- Use signals as entry confirmation, not standalone strategy
- Combine with support/resistance levels
- Consider overall market trend direction
- Always use stop-loss orders
### Strategy Examples
**Trend Following Strategy:**
1. Identify overall trend using higher timeframe (e.g., daily chart)
2. Trade only in trend direction
3. Use "Only Buy" filter in uptrends, "Only Sell" in downtrends
4. Enter on signal, exit on opposite signal or at resistance/support
**Volume Breakout Strategy:**
1. Wait for consolidation period (low volume, tight MACD range)
2. Enter when signal appears with high volume (confirms breakout)
3. Target previous swing highs/lows
4. Stop loss below/above recent consolidation
**Forex Scalping Strategy (with automatic CME futures):**
1. The indicator automatically detects forex pairs and uses CME futures volume
2. Trade during active sessions only (use session filter)
3. Focus on quick profits (10-20 pips)
4. Exit at opposite signal or profit target
**Commodities Trading Strategy (Gold, Silver, Oil):**
1. The indicator automatically maps to COMEX and NYMEX futures contracts
2. Trade during high-liquidity sessions (overlap of major markets)
3. Use the high volume confirmation to identify institutional entry points
4. Combine with key support and resistance levels for entries
5. Monitor the information table to confirm futures volume is being used (orange color)
6. Exit on opposite MACD signal or at predefined profit targets
## Why This Combination Works
### The Volume Advantage
Studies consistently show that price movements accompanied by high volume are more likely to continue, while low-volume movements often reverse. This indicator leverages this principle by requiring volume confirmation.
**Key benefits:**
1. **Reduced False Signals:** Eliminates MACD whipsaws during low-volume consolidation
2. **Confirmation Bias:** Two independent indicators (price momentum + volume) agreeing
3. **Institutional Alignment:** High volume often indicates institutional participation
4. **Trend Validation:** Volume confirms that price momentum has "conviction"
### Statistical Edge
By combining two uncorrelated signals (MACD crossovers and volume spikes), the indicator creates a higher-probability setup than either signal alone. The lookback mechanism ensures signals aren't missed if volume spike slightly precedes the MACD cross.
## Supported Exchanges and Automatic Detection
The indicator includes intelligent asset detection that works across multiple exchanges and ticker formats:
**Forex Exchanges (Automatic CME Mapping):**
- FX (TradingView forex feed)
- OANDA
- FXCM
- SAXO
- FOREXCOM
- PEPPERSTONE
- EASYMARKETS
- FX_IDC
**Commodity Exchanges (Automatic COMEX/NYMEX Mapping):**
- TVC (TradingView commodity feed)
- COMEX (directly)
- NYMEX (directly)
- ICEUS
**Other Asset Classes (Native Volume):**
- Stock exchanges (NASDAQ, NYSE, AMEX, etc.)
- Cryptocurrency exchanges (BINANCE, COINBASE, KRAKEN, etc.)
- Index providers (SP, DJ, etc.)
The detection algorithm analyzes three factors:
1. Exchange prefix in the ticker symbol
2. Pattern matching for currency pairs (6-letter codes)
3. Commodity identifiers in the symbol name
This ensures accurate automatic detection regardless of which data feed or exchange you use for charting. The information table in the top-right corner always displays which volume source is being used, providing complete transparency.
## Technical Details
**Calculations:**
- MACD Fast MA: EMA(close, fastLength)
- MACD Slow MA: EMA(close, slowLength)
- MACD Line: Fast MA - Slow MA
- Signal Line: SMA(MACD Line, signalLength)
- Volume MA: Exponential MA of volume
- High Volume: Current volume >= Volume MA × Ratio
**Signal logic:**
```
Buy Signal = (MACD crosses above Signal) AND (High volume in last N bars)
Sell Signal = (MACD crosses below Signal) AND (High volume in last N bars)
```
## Parameters Reference
| Parameter | Default | Description |
|-----------|---------|-------------|
| Volume Symbol | Blank | Manual override for volume source (leave blank for automatic detection) |
| Use CME Futures | False | Legacy option (automatic detection is now built-in) |
| Alert Session | 1530-2200 | Active session time range for alerts |
| Timezone | UTC+1 | Timezone for alert sessions |
| Volume MA Period | 20 | Number of periods for volume moving average |
| High Volume Ratio | 2.0 | Volume threshold multiplier (2.0 = 200% of average) |
| Volume Lookback | 5 | Number of bars to check for high volume confirmation |
| MACD Fast Length | 12 | Fast EMA period for MACD calculation |
| MACD Slow Length | 26 | Slow EMA period for MACD calculation |
| MACD Signal Length | 9 | Signal line SMA period |
| Only Buy | False | Filter to show only bullish signals |
| Only Sell | False | Filter to show only bearish signals |
| Show Signals | True | Display buy and sell labels on chart |
## Optimization Tips
**For volatile markets (crypto, small caps):**
- Increase High Volume Ratio to 2.5-3.0
- Reduce Volume Lookback to 3-4 bars
- Consider faster MACD settings (8, 17, 9)
**For stable markets (large-cap stocks, bonds):**
- Decrease High Volume Ratio to 1.5-1.8
- Increase Volume MA Period to 30-50
- Use standard MACD settings
**For forex (with automatic CME futures):**
- The indicator automatically uses CME futures when forex pairs are detected
- Set appropriate trading session based on your timezone
- Use Volume Lookback of 5-7 bars
- Consider session-based alerts only
- Monitor the information table to verify correct futures mapping
**For commodities (Gold, Silver, Oil, Copper):**
- The indicator automatically maps to COMEX and NYMEX futures
- Increase High Volume Ratio to 2.0-2.5 for metals
- Use slightly higher Volume MA Period (25-30) for smoother analysis
- Trade during active market hours for best volume data
- The information table will show the futures contract being used (orange highlight)
## Limitations and Considerations
**What this indicator does NOT do:**
- Does not predict future price direction
- Does not guarantee profitable trades
- Does not replace proper risk management
- Does not work well in extremely low-volume conditions
**Market conditions to avoid:**
- Pre-market and after-hours sessions (low volume)
- Major news events (volatile, unpredictable volume)
- Holidays and low-liquidity periods
- Extremely low float stocks
## Conclusion
Smart MACD Volume Trader represents a significant evolution of the traditional MACD indicator by combining volume confirmation with automatic institutional volume integration. This dual-confirmation approach significantly improves signal quality by filtering out low-conviction price movements and ensuring traders work with accurate volume data.
The indicator's automatic detection and mapping system supports over 24 instruments across forex, commodities, and metals markets. By intelligently switching to CME and COMEX futures contracts when appropriate, the indicator provides forex and commodity traders with the same quality of volume data that stock traders naturally have access to.
This indicator is particularly valuable for traders who want to:
- Align their entries with institutional money flow
- Avoid getting trapped in false breakouts
- Trade forex pairs with reliable volume data
- Access accurate volume information for gold, silver, and energy commodities
- Combine momentum and volume analysis in a single, streamlined tool
Whether you are day trading stocks, swing trading forex pairs, or positioning in commodities markets, this indicator provides a robust framework for identifying high-probability momentum trades backed by genuine institutional participation. The automatic futures mapping works seamlessly across all supported instruments, requiring no manual configuration or expertise in futures markets.
---
## Support and Updates
This indicator is actively maintained and updated based on user feedback and market conditions. For questions about implementation or custom modifications, please use the comments section below.
**Disclaimer:** This indicator is for educational and informational purposes only. Past performance does not guarantee future results. Always conduct your own analysis and risk management before trading.

Japan Yen Carry Trade to Risk Ratio Sharpe Ratio By UncleBFMStep-by-Step Calculation in the ScriptFetch Rates:Pulls rates dynamically using request.security() from user-specified symbols (e.g., TVC:JP10Y for yen, TVC:US10Y for target). If unavailable (NA), uses fallback inputs (e.g., 0.25% for yen, 4.50% for target).
Converts rates to decimals: (target_rate - yen_rate) / 100.
Calculate Carry:Carry = (Target Rate - Yen Rate) / 100
Example: If US 10Y yield is 4.50% and Japan 10Y is 0.25%, carry = (4.50 - 0.25) / 100 = 0.0425 (4.25% annual yield).
Calculate Daily Log Returns:Log Returns = ln(Close / Close ), where Close is the current price of the pair (e.g., USDJPY) and Close is the previous day's price.
This measures daily percentage changes in a way suitable for volatility calculations.
Calculate Annualized Volatility:Volatility = Standard Deviation of Log Returns over a lookback period (default 63 days, ~3 months) × √252.
Example: If the standard deviation of USDJPY log returns is 0.005 (0.5% daily), annualized volatility = 0.005 × √252 ≈ 0.0794 (7.94%).
Compute the Ratio:Ratio = Carry / Volatility
Example: Using above, 0.0425 / 0.0794 ≈ 0.535.
If volatility is zero, the ratio is set to NA to avoid division errors.
Plot:Plots the ratio as a line, with optional thresholds (e.g., 0.2 for "high attractiveness") to guide interpretation.
NotesDynamic Rates: Using bond yields (e.g., TVC:JP10Y) or policy rates (e.g., ECONOMICS:JPINTR) makes the indicator responsive to historical and current rate changes, unlike static inputs.
Context: BIS reports use similar ratios to assess carry trade viability. For USDJPY in 2025, with Fed rates around 4.5% and BoJ at 0.25–0.5%, the carry is positive but sensitive to volatility spikes (e.g., during 2024 unwind events).
Usage: Apply to a yen pair chart (e.g., USDJPY, AUDJPY). Adjust symbols for the target currency (e.g., TVC:AU10Y for AUD). The ratio helps compare carry trade profitability across pairs or over time.

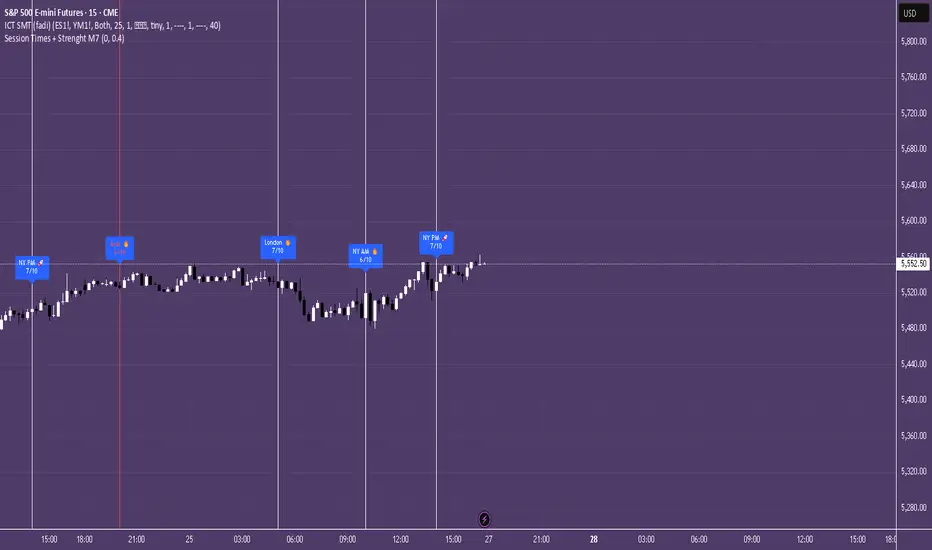
Session Times + Strenght M7This Script Aims to Define Session Times, and Rank those. It can help to adjust your Strategy to Higher Volatility, if you choose to use the Session Volatility and Strenght Index from 1-10. Your timezone on Trading View should be NY. You can customize the Following in Settings: Weight of Volatility & Narrative Regarding the ranking + Transparency of the Lines. SP:SPX FX:EURUSD OANDA:EURUSD CAPITALCOM:USDJPY AMEX:SPY NASDAQ:QQQ TVC:DXY CAPITALCOM:USDJPY CME_MINI:NQ1! OANDA:XAUUSD FX:GBPUSD
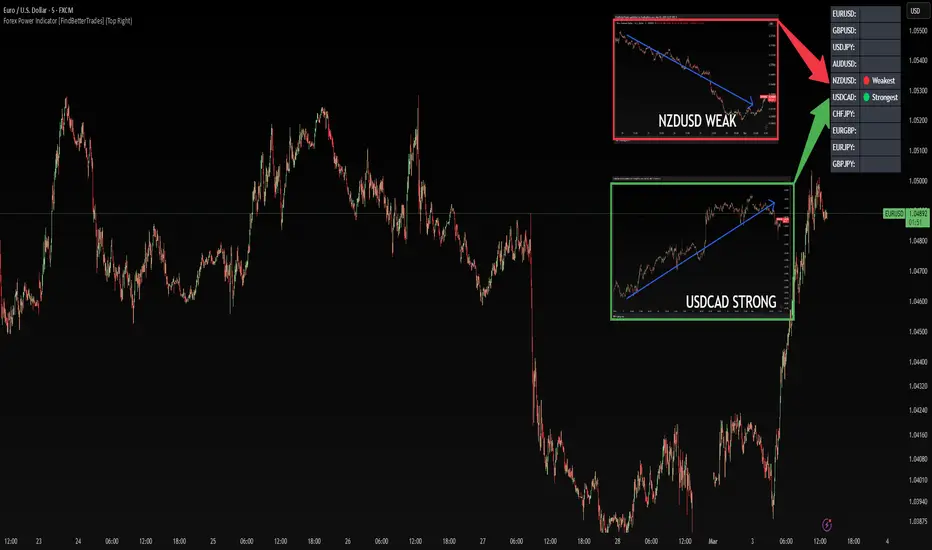
Forex Power Indicator [FindBetterTrades]The Forex Power Indicator is designed to help traders quickly assess the relative strength and weakness of key forex pairs over a set period.
This tool calculates the percentage change in price over the last 5 days and highlights the strongest and weakest performing pairs in a simple table format.
Features:
Scans 10 major forex pairs (EURUSD, GBPUSD, USDJPY, AUDUSD, NZDUSD, USDCAD, CHFJPY, EURGBP, EURJPY, GBPJPY).
Calculates the percentage change over the last 5 days.
Identifies and labels the strongest and weakest pair based on performance.
Displays results in a customizable table, allowing traders to quickly interpret market trends.
How to Use:
The strongest pair (🟢) indicates the currency with the highest performance in the selected period.
The weakest pair (🔴) shows the currency that has lost the most value.
Alerts feature:
Once you add the script to your chart, go to "Create Alert"
Under "Condition", select "Forex Power Indicator ".
The system will use the messages set in the alert() function.
When triggered, the alert will display the message like:
"New strongest currency pair: USDJPY"
"New weakest currency pair: AUDUSD"
Use this information to spot momentum opportunities, potential reversals, or trend continuations in forex trading.
This indicator is for informational purposes only and should be used alongside other technical analysis tools to support trading decisions.
Blockchain Fundamentals: Liquidity & BTC YoYLiquidity & BTC YoY Indicator
Overview:
This indicator calculates the Year-over-Year (YoY) percentage change for two critical metrics: a custom Liquidity Index and Bitcoin's price. The Liquidity Index is derived from a blend of economic and forex data representing the M2 money supply, while the BTC price is obtained from a reliable market source. A dedicated limit(length) function is implemented to handle limited historical data, ensuring that the YoY calculations are available immediately—even when the chart's history is short.
Features Breakdown:
1. Limited Historical Data Workaround
- Functionality: limit(length) The function dynamically adjusts the lookback period when there isn’t enough historical data. This prevents delays in displaying YoY metrics at the beginning of the chart.
2. Liquidity Calculation
- Data Sources: Combines multiple data streams:
USM2, ECONOMICS:CNM2, USDCNY, ECONOMICS:JPM2, USDJPY, ECONOMICS:EUM2, USDEUR
- Formula:
Liquidity Index = USM2 + (CNM2 / USDCNY) + (JPM2 / USDJPY) + (EUM2 / USDEUR)
[b3. Bitcoin Price Calculation
- Data Source: Retrieves Bitcoin's price from BITSTAMP:BTCUSD on the user-selected timeframe for its historical length.
4. Year-over-Year (YoY) Percent Change Calculation
- Methodology:
- The indicator uses a custom function, to autodetect the proper number of bars, based on the selected timeframe.
- It then compares the current value to that from one year ago for both the Liquidity Index and BTC price, calculating the YoY percentage change.
5. Visual Presentation
- Plotting:
- The YoY percentage changes for Liquidity (plotted in blue) and BTC price (plotted in orange) are clearly displayed.
- A horizontal zero line is added for visual alignment, making it easier to compare the two copies of the metric. You add one copy and only display the BTC YoY. Then you add another copy and only display the M2 YoY.
-The zero lines are then used to align the scripts to each other by interposing them. You scale each chart the way you like, then move each copy individually to align both zero lines on top of each other.
This indicator is ideal for analysts and investors looking to monitor macroeconomic liquidity trends alongside Bitcoin's performance, providing immediate insights.

Lot Size Calculator - Acero FXENGLISH DESCRIPTION:
Easy get your lot size (by Acero FX)
---------------------------
We use this transaction sizes:
Forex = 1
XAUUSD = 0.001
US100, US30 or other index = 10
---------------------------
Automatic Information for calculations:
Currency used: USD
Instrument: Detected Automatically
---------------------------
Manual Inputs:
Choose your Balance amount in "Tamaño de Cuenta"
Choose your Risk Type in "Tipo de Riesgo" between Percentage or Amount
Choose your method to calculate your Lot Size in "Calcular Usando..." between Pips or Entry and SL price
---------------------------
Table Shows:
Title: Lot Size Calc 5.0 - Acero FX
Instrument: .................
Lot Size: ..............
Entry Price: .............
Stop Loss Price: .............
Pips: ...............
Risk ($): ...............
Risk (%): ............
Transaction Size: ..............
---------------------------
Important Disclaimers:
-Minor pairs may have some differences between other calculators.
-JPY pairs use USDJPY open price of the day
DESCRIPCIÓN EN ESPAÑOL
Calcula fácilmente tu lote (Diseñado por Acero FX)
---------------------
Usamos estos tamaños de transacción:
Forex = 1
XAUUSD = 0,001
US100, US30 u otros índices = 10
---------------------
Información automática para cálculos:
Moneda utilizada: USD
Instrumento: Detectado automáticamente
---------------------
Entradas manuales:
Elige el monto de tu Saldo en "Tamaño de Cuenta"
Elige el Tipo de Riesgo en "Tipo de Riesgo" entre Porcentaje o Monto
Elige el método para calcular el tamaño de stu lote en "Calcular Usando..." entre Pips o Entrada y precio SL
---------------------
La tabla muestra:
Título: Calc. Tamaño de Lote 5.0 - Acero FX
Instrumento: .................
Lotaje: ..............
Entrada: .............
Stop Loss: .............
Pips: .................
Riesgo ($): .................
Riesgo (%): ............
Tamaño del contrato (tamaño de la transacción): .................
---------------------
Descargos de responsabilidad importantes:
-Los pares menores pueden tener algunas diferencias entre otras calculadoras.
-Los pares JPY utilizan el precio de apertura del día USDJPY

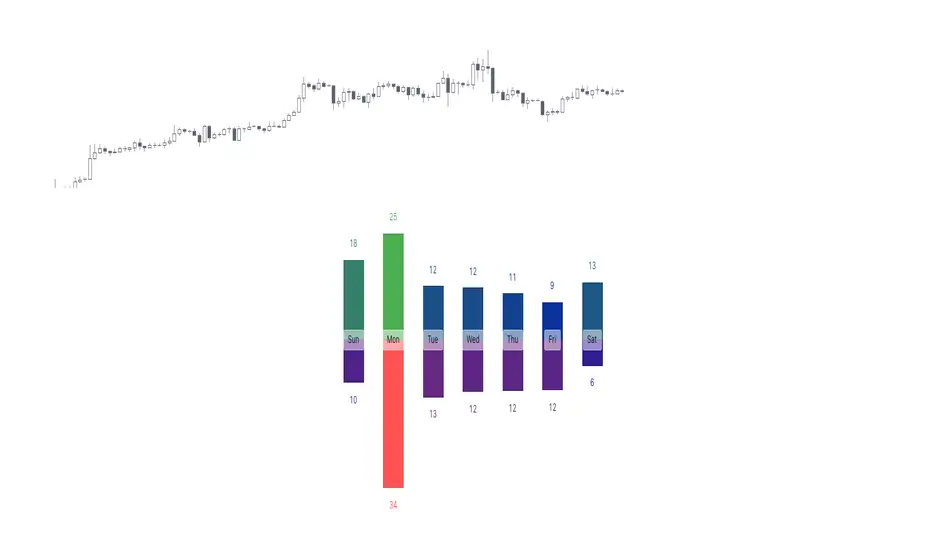
Tops & Bottoms - Day of Week Report█ OVERVIEW
The indicator tracks when the weekly tops and bottoms occur and reports the statistics by the days of the week.
█ CONCEPTS
Not all the days of the week are equal, and the market dynamic can follow through or shift over the trading week. Tops and bottoms are vital when entering a trade, as they will decide if you are catching the train or being straight offside. They are equally crucial when exiting a position, as they will determine if you are closing at the optimal price or seeing your unrealized profits vanish.
This indicator is before all for educational purposes. It aims to make the knowledge available to all traders, facilitate understanding of the various markets, and ultimately get to know your trading pairs by heart (and saving a lot of your time backtesting!).
USDJPY tops and bottoms percentages on any given week.
USDJPY tops and bottoms percentages on up weeks versus down weeks.
█ FEATURES
Custom interval
By default, the indicator uses the weekly interval defined by the symbol (e.g., Monday to Sunday). This option allows you to specify your custom interval.
Weekly interval type filter
Analyze the weekly interval on any weeks, up weeks, or down weeks.
Configurable time range filter
Select the period to report from.
█ NOTES
Trading session
The indicator analyzes the days of the week from the daily chart. The daily trading sessions are defined by the symbol (e.g., 17:00 - 17:00 on EURUSD).
Extended/electronic trading session
The indicator can include the extended hours when activated on the chart, using the 24-hour or 1440-minute timeframe.
█ HOW TO USE
Plot the indicator and navigate on the 1-day or 24-hour timeframe.
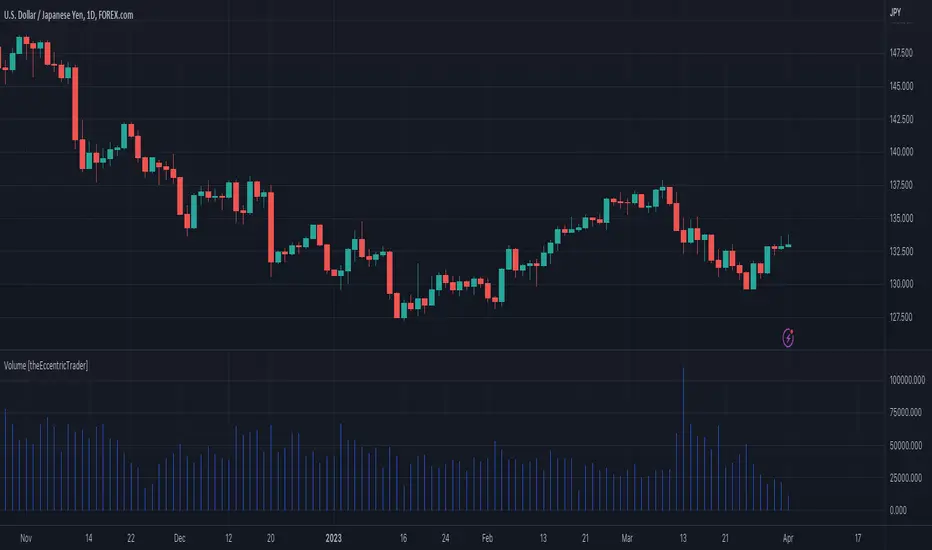
Volume [theEccentricTrader]OVERVIEW
This indicator simply bridges the gap between symbols from brokers that provide volume data and symbols from brokers that do not provide volume data. Users can select any symbol that provides volume data from the settings menu and the volume data will be displayed in histogram form on their current chart. The default volume symbol is CURRENCYCOM:US500.
CONCEPTS
Volume
Volume refers to the total number of shares or contracts that are traded during a given period of time. It is a measure of the amount of activity in the market and can be used to gauge the strength or weakness of a particular trend.
Volume is typically displayed as a histogram on trading charts, with each bar representing the total volume for a particular time period. High volume bars indicate a lot of trading activity, while low volume bars indicate relatively little trading activity.
Traders use volume in a number of ways. For example, they may use it to confirm a trend. If a stock is trending up and the volume is also increasing, this can be seen as a sign that the trend is strong and likely to continue. Conversely, if a stock is trending down and the volume is also increasing, this can be seen as a sign that the trend is weak and may be coming to an end. Volume can similarly be used to identify potential reversals. If a stock is trending up but the volume starts to decrease, this could indicate that the trend is losing momentum and that a reversal may be imminent.
FEATURES
Inputs
• Volume Symbol
Style
Users can change plot color and style from the default Style menu if so required.
NOTES
For 24-hour markets and forex volume I use the broker currency.com. As can be seen in the example above, I am using CURRENCYCOM:USDJPY to pull volume to a FOREXCOM:USDJPY chart, which otherwise would not show volume data as forex.com do not provide it.
Swing Counter [theEccentricTrader]█ OVERVIEW
This indicator counts the number of confirmed swing high and swing low scenarios on any given candlestick chart and displays the statistics in a table, which can be repositioned and resized at the user's discretion.
█ CONCEPTS
Green and Red Candles
• A green candle is one that closes with a high price equal to or above the price it opened.
• A red candle is one that closes with a low price that is lower than the price it opened.
Swing Highs and Swing Lows
• A swing high is a green candle or series of consecutive green candles followed by a single red candle to complete the swing and form the peak.
• A swing low is a red candle or series of consecutive red candles followed by a single green candle to complete the swing and form the trough.
Peak and Trough Prices (Basic)
• The peak price of a complete swing high is the high price of either the red candle that completes the swing high or the high price of the preceding green candle, depending on which is higher.
• The trough price of a complete swing low is the low price of either the green candle that completes the swing low or the low price of the preceding red candle, depending on which is lower.
Peak and Trough Prices (Advanced)
• The advanced peak price of a complete swing high is the high price of either the red candle that completes the swing high or the high price of the highest preceding green candle high price, depending on which is higher.
• The advanced trough price of a complete swing low is the low price of either the green candle that completes the swing low or the low price of the lowest preceding red candle low price, depending on which is lower.
Green and Red Peaks and Troughs
• A green peak is one that derives its price from the green candle/s that constitute the swing high.
• A red peak is one that derives its price from the red candle that completes the swing high.
• A green trough is one that derives its price from the green candle that completes the swing low.
• A red trough is one that derives its price from the red candle/s that constitute the swing low.
Historic Peaks and Troughs
The current, or most recent, peak and trough occurrences are referred to as occurrence zero. Previous peak and trough occurrences are referred to as historic and ordered numerically from right to left, with the most recent historic peak and trough occurrences being occurrence one.
Upper Trends
• A return line uptrend is formed when the current peak price is higher than the preceding peak price.
• A downtrend is formed when the current peak price is lower than the preceding peak price.
• A double-top is formed when the current peak price is equal to the preceding peak price.
Lower Trends
• An uptrend is formed when the current trough price is higher than the preceding trough price.
• A return line downtrend is formed when the current trough price is lower than the preceding trough price.
• A double-bottom is formed when the current trough price is equal to the preceding trough price.
█ FEATURES
Inputs
• Start Date
• End Date
• Position
• Text Size
• Show Sample Period
• Show Plots
• Show Lines
Table
The table is colour coded, consists of three columns and nine rows. Blue cells denote neutral scenarios, green cells denote return line uptrend and uptrend scenarios, and red cells denote downtrend and return line downtrend scenarios.
The swing scenarios are listed in the first column with their corresponding total counts to the right, in the second column. The last row in column one, row nine, displays the sample period which can be adjusted or hidden via indicator settings.
Rows three and four in the third column of the table display the total higher peaks and higher troughs as percentages of total peaks and troughs, respectively. Rows five and six in the third column display the total lower peaks and lower troughs as percentages of total peaks and troughs, respectively. And rows seven and eight display the total double-top peaks and double-bottom troughs as percentages of total peaks and troughs, respectively.
Plots
I have added plots as a visual aid to the swing scenarios listed in the table. Green up-arrows with ‘HP’ denote higher peaks, while green up-arrows with ‘HT’ denote higher troughs. Red down-arrows with ‘LP’ denote higher peaks, while red down-arrows with ‘LT’ denote lower troughs. Similarly, blue diamonds with ‘DT’ denote double-top peaks and blue diamonds with ‘DB’ denote double-bottom troughs. These plots can be hidden via indicator settings.
Lines
I have also added green and red trendlines as a further visual aid to the swing scenarios listed in the table. Green lines denote return line uptrends (higher peaks) and uptrends (higher troughs), while red lines denote downtrends (lower peaks) and return line downtrends (lower troughs). These lines can be hidden via indicator settings.
█ HOW TO USE
This indicator is intended for research purposes and strategy development. I hope it will be useful in helping to gain a better understanding of the underlying dynamics at play on any given market and timeframe. It can, for example, give you an idea of any inherent biases such as a greater proportion of higher peaks to lower peaks. Or a greater proportion of higher troughs to lower troughs. Such information can be very useful when conducting top down analysis across multiple timeframes, or considering entry and exit methods.
What I find most fascinating about this logic, is that the number of swing highs and swing lows will always find equilibrium on each new complete wave cycle. If for example the chart begins with a swing high and ends with a swing low there will be an equal number of swing highs to swing lows. If the chart starts with a swing high and ends with a swing high there will be a difference of one between the two total values until another swing low is formed to complete the wave cycle sequence that began at start of the chart. Almost as if it was a fundamental truth of price action, although quite common sensical in many respects. As they say, what goes up must come down.
The objective logic for swing highs and swing lows I hope will form somewhat of a foundational building block for traders, researchers and developers alike. Not only does it facilitate the objective study of swing highs and swing lows it also facilitates that of ranges, trends, double trends, multi-part trends and patterns. The logic can also be used for objective anchor points. Concepts I will introduce and develop further in future publications.
█ LIMITATIONS
Some higher timeframe candles on tickers with larger lookbacks such as the DXY , do not actually contain all the open, high, low and close (OHLC) data at the beginning of the chart. Instead, they use the close price for open, high and low prices. So, while we can determine whether the close price is higher or lower than the preceding close price, there is no way of knowing what actually happened intra-bar for these candles. And by default candles that close at the same price as the open price, will be counted as green. You can avoid this problem by utilising the sample period filter.
The green and red candle calculations are based solely on differences between open and close prices, as such I have made no attempt to account for green candles that gap lower and close below the close price of the preceding candle, or red candles that gap higher and close above the close price of the preceding candle. I can only recommend using 24-hour markets, if and where possible, as there are far fewer gaps and, generally, more data to work with. Alternatively, you can replace the scenarios with your own logic to account for the gap anomalies, if you are feeling up to the challenge.
The sample size will be limited to your Trading View subscription plan. Premium users get 20,000 candles worth of data, pro+ and pro users get 10,000, and basic users get 5,000. If upgrading is currently not an option, you can always keep a rolling tally of the statistics in an excel spreadsheet or something of the like.
█ NOTES
I feel it important to address the mention of advanced peak and trough price logic. While I have introduced the concept, I have not included the logic in my script for a number of reasons. The most pertinent of which being the amount of extra work I would have to do to include it in a public release versus the actual difference it would make to the statistics. Based on my experience, there are actually only a small number of cases where the advanced peak and trough prices are different from the basic peak and trough prices. And with adequate multi-timeframe analysis any high or low prices that are not captured using basic peak and trough price logic on any given time frame, will no doubt be captured on a higher timeframe. See the example below on the 1H FOREXCOM:USDJPY chart (Figure 1), where the basic peak price logic denoted by the indicator plot does not capture what would be the advanced peak price, but on the 2H FOREXCOM:USDJPY chart (Figure 2), the basic peak logic does capture the advanced peak price from the 1H timeframe.
Figure 1.
Figure 2.
█ RAMBLINGS
“Never was there an age that placed economic interests higher than does our own. Never was the need of a scientific foundation for economic affairs felt more generally or more acutely. And never was the ability of practical men to utilize the achievements of science, in all fields of human activity, greater than in our day. If practical men, therefore, rely wholly on their own experience, and disregard our science in its present state of development, it cannot be due to a lack of serious interest or ability on their part. Nor can their disregard be the result of a haughty rejection of the deeper insight a true science would give into the circumstances and relationships determining the outcome of their activity. The cause of such remarkable indifference must not be sought elsewhere than in the present state of our science itself, in the sterility of all past endeavours to find its empirical foundations.” (Menger, 1871, p.45).
█ BIBLIOGRAPHY
Menger, C. (1871) Principles of Economics. Reprint, Auburn, Alabama: Ludwig Von Mises Institute: 2007.

Munich's Momentum Wave V2MUNICH'S MOMENTUM WAVE VERSION 2 IS LIVE!!!
There are a few big things to note with this one.
I decided to upload this as an entirely new script due to the number of changes differing from the first version, but as the last one, this will still work on ANY TIMEFRAME, ANY ASSET CLASS, ANY PRICE! .
This momentum wave indicator now will give you data for when trend could turn, and two momentum indicators to help you decide when to take an entry.
First off,
*I have added an alma ma (alma) that will track momentum alongside price action and further lead the indicator consisting of the Munich waves.
* The background feature will track the price using a method derived from the Bollinger bands, after calculations, it will color the background based on the average of the momentum's ema's, the alma ma, and also the alma in comparison to the alma's value pre offset ( the offset is 3, following the basis).
*There are now 5 basis values given from the increase in ema samples.
If anyone has any questions feel free to pm me or comment below. Thank you guys for the support! :)
INDEX:BTCUSD TVC:NDQ AMEX:SPY BITSTAMP:ETHUSD BINANCE:BTCUSDT FX:USDJPY NASDAQ:AAPL

Currency Strength Meter [HeWhoMustNotBeNamed]⬜ Note: This is not the strength of currency pairs. But, in this script we are trying to derive strength of individual currencies by matching against single base currency.
⬜ Process
This is based on similar concept as that of Magic Numbers for stocks. Idea is simple.
▶ Calculate strength of each currency against USD. Derive the strength for both price movement and volume movement.
▶ Similarly calculate momentum of price and volume change.
▶ If USD is base currency, inverse momentum and strength index for the given symbol.
▶ Once these calculations are done, rank each currencies based on individual score on given things.
▶ Add up all the ranks to derive combined rank
▶ sort the currencies in the ascending order of overall rank.
⬜ USAGE
▶ Identify a base currency. In our case, we have used USD as base currency as it is easy to get pairs of all currencies with USD.
▶ Identify most used combos for all other currencies which are paired with USD. Fx pair can either have USD as base currency or quote currency. It is desirable to use the pair which is most traded. For example, USDJPY is more traded pair than JPYUSD - hence it is advisable to use USDJPY instead of JPYUSD. Similarly AUDUSD is more traded than USDAUD - hence choosing AUDUSD for the purpose of this exercise is better approach. Notice that USDJPY has USD as base currency whereas AUDUSD has USD as quote currency. These calculations are handled internally to derive the right outcome irrespective of position of USD in the pair.
▶ Identify the forex broker which has all the selected forex tickers. All comparison is done against a single broker. Hence, choosing broker which does not wide range of forex pairs will show NAN for many rows.
▶ Once we set these, we get tabular output containing strength and oscillator based trend indexes for both price and volume indicator. Currencies are ordered in descending order of strength. Hence, top of the list can be considered as currency having highest strength and bottom of the table can be considered as currency having lowest strength. Please note that the calculation is valid only for selected timeframe and users can set other parameters such as moving average type, oscillator type, length etc which can alter the outcome.
▶ Use multiple timeframes to find out stronger and weaker currencies. Use directional indicators to understand where they are heading. Combine all these info to come up with currency pair you would like to trade :)
⬜ Settings
▶ Main settings and Currencies
Base Currency : This is set to USD by default as rest of the tickers used are paired with USD. Whatever the base currency is selected, rest of the tickers should follow the same combination.
Timeframe : Timeframe for which rankings need to be calculated.
Currencies : These should be the currency pair which involve base currency defined in the setting on either side.
▶ Display
Table : Allows users to set table location and size of the table. By default this is set to middle center and default size is normal. If user want to use multiple timeframes side by side, they can do so by changing these display settings.
Stat Type : To show either comparative ranking or actual indicator values

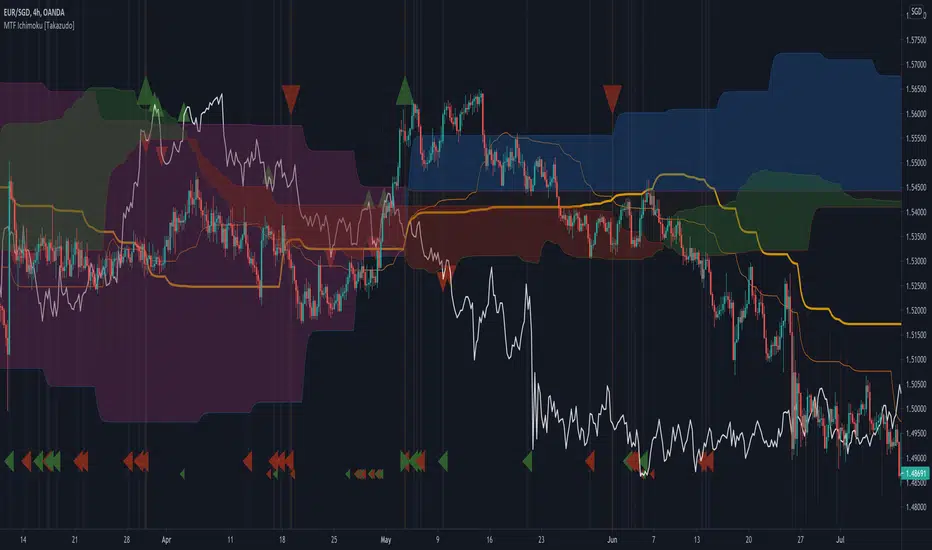
MTF Ichimoku [Takazudo]- A multi time frame Ichimoku with messy hint highlights.
- Most of MTF Ichimoku scripts doesn't handle Chikou-span's place correctly. This script does.
- This script was made to refer the 1day timeframe Ichimoku in lower timeframes.
- I use 1day timeframe mainly. But my entry is always in 4h or 1h timeframe.
OANDA:USDJPY
ANN MACD : 25 IN 1 SCRIPTIn this script, I tried to fit deep learning series to 1 command system up to the maximum point.
After selecting the ticker, select the instrument from the menu and the system will automatically turn on the appropriate ann system.
Listed instruments with alternative tickers and error rates:
WTI : West Texas Intermediate (WTICOUSD , USOIL , CL1! ) Average error : 0.007593
BRENT : Brent Crude Oil (BCOUSD , UKOIL , BB1! ) Average error : 0.006591
GOLD : XAUUSD , GOLD , GC1! Average error : 0.012767
SP500 : S&P 500 Index (SPX500USD , SP1!) Average error : 0.011650
EURUSD : Eurodollar (EURUSD , 6E1! , FCEU1!) Average error : 0.005500
ETHUSD : Ethereum (ETHUSD , ETHUSDT ) Average error : 0.009378
BTCUSD : Bitcoin (BTCUSD , BTCUSDT , XBTUSD , BTC1!) Average error : 0.01050
GBPUSD : British Pound (GBPUSD,6B1! , GBP1!) Average error : 0.009999
USDJPY : US Dollar / Japanese Yen (USDJPY , FCUY1!) Average error : 0.009198
USDCHF : US Dollar / Swiss Franc (USDCHF , FCUF1! ) Average error : 0.009999
USDCAD : Us Dollar / Canadian Dollar (USDCAD) Average error : 0.012162
SOYBNUSD : Soybean (SOYBNUSD , ZS1!) Average error : 0.010000
CORNUSD : Corn (ZC1! ) Average error : 0.007574
NATGASUSD : Natural Gas (NATGASUSD , NG1!) Average error : 0.010000
SUGARUSD : Sugar (SUGARUSD , SB1! ) Average error : 0.011081
WHEATUSD : Wheat (WHEATUSD , ZW1!) Average error : 0.009980
XPTUSD : Platinum (XPTUSD , PL1! ) Average error : 0.009964
XU030 : Borsa Istanbul 30 Futures ( XU030 , XU030D1! ) Average error : 0.010727
VIX : S & P 500 Volatility Index (VX1! , VIX ) Average error : 0.009999
YM : E - Mini Dow Futures (YM1! ) Average error : 0.010819
ES : S&P 500 E-Mini Futures (ES1! ) Average error : 0.010709
GAZP : Gazprom Futures (GAZP , GZ1! ) Average error : 0.008442
SSE : Shangai Stock Exchange Composite (Index ) ( 000001 ) Average error : 0.011287
XRPUSD : Ripple (XRPUSD , XRPUSDT ) Average error : 0.009803
Note 1 : Australian Dollar (AUDUSD , AUD1! , FCAU1! ) : Instrument has been removed because it has an average error rate of over 0.13.
The average error rate is 0.1850.
I didn't delete it from the menu just because there was so much request,
You can use.
Note 2 : Friends have too many requests, it took me a week in total and 1 other script that I'll share in 2 days.
Reaching these error rates is a very difficult task, and when I keep at a low learning rate, they are trained for a very long time.
If I don't see the error rate at an average low, I increase the layers and go back into a longer process.
It takes me 45 minutes per instrument to command artificial neural networks, so I'll release one more open source, and then we'll be laying 70-80 percent of the world trade volume with artificial neural networks.
Note 3 :
I would like to thank wroclai for helping me with this script.
This script is subject to MIT License on behalf of both of us.
You can review my original idea scripts from my Github page.
You can use it free but if you are going to modify it, just quote this script .
I hope it will help everyone, after 1-2 days I will share another ann script that I think is of the same importance as this, stay tuned.
Regards , Noldo .
