R:R Trading System FrameworkFirst off, huge thanks to @fikira! He was able to adapt what I built to work much more efficiently, allowing for more strategies to be used simultaneously. Simply put, I could not have gotten to this point without you. Thanks for what you do for the TV community. Second, I am fairly new to pinescript writing, so I welcome criticism, thoughtful input and improvement suggestions. I would love to grow this concept into something even better, if possible. So please let me know if you have any ideas for improvement. However I do juggle a lot of different things outside of TV, so implementations may be delayed.
I have decided, at this time, not to add alerts. First, because I feel most people looking to adapt this framework can add their own pretty easily. Also, given how customized the framework is currently, while also attempting to account for all the possible ways in which people may want alerts to function after they customize it, it seems best to leave them out as it doesn't exactly fit the idea of a framework.
For best viewing, I recommend hovering over the script's name > ... > Visual order > Bring to front. Also I found hollow candles with mono-toned colors (like pictured) are more visually appealing for me personally. I HIGHLY RECOMMEND USING WITH BAR REPLAY TO BETTER UNDERSTAND THE FRAMEWORK'S FUNCTIONALITY.
▶️ WHAT THIS FRAMEWORK IS
- A huge collection of concepts and capabilities for those trying to better understand, learn, or teach pinescript.
- A system designed to showcase Risk:Reward concepts more holistically by providing all of the most popular components of retail trading to include backtesting, trade visual plotting, position tracking, market condition shifts, and useful info while positioned to help highlight changes in your risk:reward based decision-making processes.
- A system that can showcase individual strategies regardless of trade direction, allowing you to develop hedging strategies without having multiple indicators that do not correlate with each other.
- Designed around the idea that you trade less numbers of assets but manage your positions and risk based on multiple concurrently running strategies to manage your risk exposure and reward potential.
- An attempt to combine all the things you need to execute with an active trading management style.
- A framework that uses backtested results (in this case the number of averaged bars it takes to hit key levels) in real-time to inform your risk:reward decision-making while in-trade (in this case in your Trade Tracking Table using dynamic color to show how you might be early, on-time, or late compared to the average amount of backtested time it normally takes to hit that specific key level).
▶️ WHAT THIS FRAMEWORK IS NOT
- A complete trading product. DO NOT USE as-is. It is a FRAMEWORK for you to generate ideas of your own and fairly easily implement your own triggering conditions in the appropriate sections of the script.
▶️ USE CASES
- If you decide you like the Stop, Target, Trailing Stop, and Risk:Reward components as-is, then just understanding how to plug in your Entry and Bullish / Bearish conditions (Triangles) and adjust the input texts to match your custom naming will be all you need to make it your own!
- If you want to adapt certain components, then this system gives you a great starting point to adapt your different concepts and ideas from.
▶️ SYSTEM COMPONENTS
- Each of the system's components are described via tooltips both in the input menu and in the tables' cells.
- Each label on the chart displays the corresponding price at those triggered conditions on hover with tooltips.
- The Trailing Stop only becomes active once it is above the Entry Price for that trade, and brightens to show it is active. The STOP line (right of price) moves once it takes over for the Entry Stop representing the level of the Trailing Stop at that time for that trade.
- The Lines / Labels to the right of price will brighten once price is above for Longs or below for Shorts. The Trade Tracking Table cells will add ☑️ once price is above for Longs or below for Shorts.
- The brighter boxes on the chart show the trades that occurred based on your criteria and are color coded for all components of each trade type to ensure your references are consistent. (Defaults are TV built-in strategies)
- The lighter boxes on the chart show the highest and lowest price levels reached during those trades, to highlight areas where improvements can be made or additional considerations can be accounted for by either adjusting Entry triggers or Bullish / Bearish triggers.
- Default Green and Red Triangles (Bullish / Bearish) default to having the same triggering condition as the Entry it corresponds to. This is to highlight either a pyramiding concept, early exit, or you can change to account for other things occurring during your trades which could help you with Stop and Target management/considerations.
TradingView and many of its community members have done a lot for me, so this is my attempt to give back.
Cari skrip untuk "trigger"

Using `varip` variables [PineCoders]█ OVERVIEW
The new varip keyword in Pine can be used to declare variables that escape the rollback process, which is explained in the Pine User Manual's page on the execution model . This publication explains how Pine coders can use variables declared with varip to implement logic that was impossible to code in Pine before, such as timing events during the realtime bar, or keeping track of sequences of events that occur during successive realtime updates. We present code that allows you to calculate for how much time a given condition is true during a realtime bar, and show how this can be used to generate alerts.
█ WARNINGS
1. varip is an advanced feature which should only be used by coders already familiar with Pine's execution model and bar states .
2. Because varip only affects the behavior of your code in the realtime bar, it follows that backtest results on strategies built using logic based on varip will be meaningless,
as varip behavior cannot be simulated on historical bars. This also entails that plots on historical bars will not be able to reproduce the script's behavior in realtime.
3. Authors publishing scripts that behave differently in realtime and on historical bars should imperatively explain this to traders.
█ CONCEPTS
Escaping the rollback process
Whereas scripts only execute once at the close of historical bars, when a script is running in realtime, it executes every time the chart's feed detects a price or volume update. At every realtime update, Pine's runtime normally resets the values of a script's variables to their last committed value, i.e., the value they held when the previous bar closed. This is generally handy, as each realtime script execution starts from a known state, which simplifies script logic.
Sometimes, however, script logic requires code to be able to save states between different executions in the realtime bar. Declaring variables with varip now makes that possible. The "ip" in varip stands for "intrabar persist".
Let's look at the following code, which does not use varip :
//@version=4
study("")
int updateNo = na
if barstate.isnew
updateNo := 1
else
updateNo := updateNo + 1
plot(updateNo, style = plot.style_circles)
On historical bars, barstate.isnew is always true, so the plot shows a value of "1". On realtime bars, barstate.isnew is only true when the script first executes on the bar's opening. The plot will then briefly display "1" until subsequent executions occur. On the next executions during the realtime bar, the second branch of the if statement is executed because barstate.isnew is no longer true. Since `updateNo` is initialized to `na` at each execution, the `updateNo + 1` expression yields `na`, so nothing is plotted on further realtime executions of the script.
If we now use varip to declare the `updateNo` variable, the script behaves very differently:
//@version=4
study("")
varip int updateNo = na
if barstate.isnew
updateNo := 1
else
updateNo := updateNo + 1
plot(updateNo, style = plot.style_circles)
The difference now is that `updateNo` tracks the number of realtime updates that occur on each realtime bar. This can happen because the varip declaration allows the value of `updateNo` to be preserved between realtime updates; it is no longer rolled back at each realtime execution of the script. The test on barstate.isnew allows us to reset the update count when a new realtime bar comes in.
█ OUR SCRIPT
Let's move on to our script. It has three parts:
— Part 1 demonstrates how to generate alerts on timed conditions.
— Part 2 calculates the average of realtime update prices using a varip array.
— Part 3 presents a function to calculate the up/down/neutral volume by looking at price and volume variations between realtime bar updates.
Something we could not do in Pine before varip was to time the duration for which a condition is continuously true in the realtime bar. This was not possible because we could not save the beginning time of the first occurrence of the true condition.
One use case for this is a strategy where the system modeler wants to exit before the end of the realtime bar, but only if the exit condition occurs for a specific amount of time. One can thus design a strategy running on a 1H timeframe but able to exit if the exit condition persists for 15 minutes, for example. REMINDER: Using such logic in strategies will make backtesting their complete logic impossible, and backtest results useless, as historical behavior will not match the strategy's behavior in realtime, just as using `calc_on_every_tick = true` will do. Using `calc_on_every_tick = true` is necessary, by the way, when using varip in a strategy, as you want the strategy to run like a study in realtime, i.e., executing on each price or volume update.
Our script presents an `f_secondsSince(_cond, _resetCond)` function to calculate the time for which a condition is continuously true during, or even across multiple realtime bars. It only works in realtime. The abundant comments in the script hopefully provide enough information to understand the details of what it's doing. If you have questions, feel free to ask in the Comments section.
Features
The script's inputs allow you to:
• Specify the number of seconds the tested conditions must last before an alert is triggered (the default is 20 seconds).
• Determine if you want the duration to reset on new realtime bars.
• Require the direction of alerts (up or down) to alternate, which minimizes the number of alerts the script generates.
The inputs showcase the new `tooltip` parameter, which allows additional information to be displayed for each input by hovering over the "i" icon next to it.
The script only displays useful information on realtime bars. This information includes:
• The MA against which the current price is compared to determine the bull or bear conditions.
• A dash which prints on the chart when the bull or bear condition is true.
• An up or down triangle that prints when an alert is generated. The triangle will only appear on the update where the alert is triggered,
and unless that happens to be on the last execution of the realtime bar, it will not persist on the chart.
• The log of all triggered alerts to the right of the realtime bar.
• A gray square on top of the elapsed realtime bars where one or more alerts were generated. The square's tooltip displays the alert log for that bar.
• A yellow dot corresponding to the average price of all realtime bar updates, which is calculated using a varip array in "Part 2" of the script.
• Various key values in the Data Window for each parts of the script.
Note that the directional volume information calculated in Part 3 of the script is not plotted on the chart—only in the Data Window.
Using the script
You can try running the script on an open market with a 30sec timeframe. Because the default settings reset the duration on new realtime bars and require a 20 second delay, a reasonable amount of alerts will trigger.
Creating an alert on the script
You can create a script alert on the script. Keep in mind that when you create an alert from this script, the duration calculated by the instance of the script running the alert will not necessarily match that of the instance running on your chart, as both started their calculations at different times. Note that we use alert.freq_all in our alert() calls, so that alerts will trigger on all instances where the associated condition is met. If your alert is being paused because it reaches the maximum of 15 triggers in 3 minutes, you can configure the script's inputs so that up/down alerts must alternate. Also keep in mind that alerts run a distinct instance of your script on different servers, so discrepancies between the behavior of scripts running on charts and alerts can occur, especially if they trigger very often.
Challenges
Events detected in realtime using variables declared with varip can be transient and not leave visible traces at the close of the realtime bar, as is the case with our script, which can trigger multiple alerts during the same realtime bar, when the script's inputs allow for this. In such cases, elapsed realtime bars will be of no use in detecting past realtime bar events unless dedicated code is used to save traces of events, as we do with our alert log in this script, which we display as a tooltip on elapsed realtime bars.
█ NOTES
Realtime updates
We have no control over when realtime updates occur. A realtime bar can open, and then no realtime updates can occur until the open of the next realtime bar. The time between updates can vary considerably.
Past values
There is no mechanism to refer to past values of a varip variable across realtime executions in the same bar. Using the history-referencing operator will, as usual, return the variable's committed value on previous bars. If you want to preserve past values of a varip variable, they must be saved in other variables or in an array .
Resetting variables
Because varip variables not only preserve their values across realtime updates, but also across bars, you will typically need to plan conditions that will at some point reset their values to a known state. Testing on barstate.isnew , as we do, is a good way to achieve that.
Repainting
The fact that a script uses varip does not make it necessarily repainting. A script could conceivably use varip to calculate values saved when the realtime bar closes, and then use confirmed values of those calculations from the previous bar to trigger alerts or display plots, avoiding repaint.
timenow resolution
Although the variable is expressed in milliseconds it has an actual resolution of seconds, so it only increments in multiples of 1000 milliseconds.
Warn script users
When using varip to implement logic that cannot be replicated on historical bars, it's really important to explain this to traders in published script descriptions, even if you publish open-source. Remember that most TradingViewers do not know Pine.
New Pine features used in this script
This script uses three new Pine features:
• varip
• The `tooltip` parameter in input() .
• The new += assignment operator. See these also: -= , *= , /= and %= .
Example scripts
These are other scripts by PineCoders that use varip :
• Tick Delta Volume , by RicadoSantos .
• Tick Chart and Volume Info from Lower Time Frames by LonesomeTheBlue .
Thanks
Thanks to the PineCoders who helped improve this publication—especially to bmistiaen .
Look first. Then leap.

Relative Volume at Time█ OVERVIEW
This indicator calculates relative volume, which is the ratio of present volume over an average of past volume.
It offers two calculation modes, both using a time reference as an anchor.
█ CONCEPTS
Calculation modes
The simplest way to calculate relative volume is by using the ratio of a bar's volume over a simple moving average of the last n volume values.
This indicator uses one of two, more subtle ways to calculate both values of the relative volume ratio: current volume:past volume .
The two calculations modes are:
1 — Cumulate from Beginning of TF to Current Bar where:
current volume = the cumulative volume since the beginning of the timeframe unit, and
past volume = the mean of volume during that same relative period of time in the past n timeframe units.
2 — Point-to-Point Bars at Same Offset from Beginning of TF where:
current volume = the volume on a single chart bar, and
past volume = the mean of volume values from that same relative bar in time from the past n timeframe units.
Timeframe units
Timeframe units can be defined in three different ways:
1 — Using Auto-steps, where the timeframe unit automatically adjusts to the timeframe used on the chart:
— A 1 min timeframe unit will be used on 1sec charts,
— 1H will be used for charts at 1min and less,
— 1D will be used for other intraday chart timeframes,
— 1W will be used for 1D charts,
— 1M will be used for charts at less than 1M,
— 1Y will be used for charts at greater or equal than 1M.
2 — As a fixed timeframe that you define.
3 — By time of day (for intraday chart timeframes only), which you also define. If you use non-intraday chart timeframes in this mode, the indicator will switch to Auto-steps.
Relative Relativity
A relative volume value of 1.0 indicates that current volume is equal to the mean of past volume , but how can we determine what constitutes a high relative volume value?
The traditional way is to settle for an arbitrary threshold, with 2.0 often used to indicate that relative volume is worthy of attention.
We wanted to provide traders with a contextual method of calculating threshold values, so in addition to the conventional fixed threshold value,
this indicator includes two methods of calculating a threshold channel on past relative volume values:
1 — Using the standard deviation of relative volume over a fixed lookback.
2 — Using the highs/lows of relative volume over a variable lookback.
Channels calculated on relative volume provide meta-relativity, if you will, as they are relative values of relative volume.
█ FEATURES
Controls in the "Display" section of inputs determine what is visible in the indicator's pane. The next "Settings" section is where you configure the parameters used in the calculations. The "Column Coloring Conditions" section controls the color of the columns, which you will see in three of the five display modes available. Whether columns are plotted or not, the coloring conditions also determine when markers appear, if you have chosen to show the markers in the "Display" section. The presence of markers is what triggers the alerts configured on this indicator. Finally, the "Colors" section of inputs allows you to control the color of the indicator's visual components.
Display
Five display modes are available:
• Current Volume Columns : shows columns of current volume , with past volume displayed as an outlined column.
• Relative Volume Columns : shows relative volume as a column.
• Relative Volume Columns With Average : shows relative volume as a column, with the average of relative volume.
• Directional Relative Volume Average : shows a line calculated using the average of +/- values of relative volume.
The positive value of relative volume is used on up bars; its negative value on down bars.
• Relative Volume Average : shows the average of relative volume.
A Hull moving average is used to calculate the average used in the three last display modes.
You can also control the display of:
• The value or relative volume, when in the first three display modes. Only the last 500 values will be shown.
• Timeframe transitions, shown in the background.
• A reminder of the active timeframe unit, which appears to the right of the indicator's last bar.
• The threshold used, which can be a fixed value or a channel, as determined in the next "Settings" section of inputs.
• Up/Down markers, which appear on transitions of the color of the volume columns (determined by coloring conditions), which in turn control when alerts are triggered.
• Conditions of high volatility.
Settings
Use this section of inputs to change:
• Calculation mode : this is where you select one of this indicator's two calculation modes for current volume and past volume , as explained in the "Concepts" section.
• Past Volume Lookback in TF units : the quantity of timeframe units used in the calculation of past volume .
• Define Timeframes Units Using : the mode used to determine what one timeframe unit is. Note that when using a fixed timeframe, it must be higher than the chart's timeframe.
Also, note that time of day timeframe units only work on intraday chart timeframes.
• Threshold Mode : Five different modes can be selected:
— Fixed Value : You can define the value using the "Fixed Threshold" field below. The default value is 2.0.
— Standard Deviation Channel From Fixed Lookback : This is a channel calculated using the simple moving average of relative volume
(so not the Hull moving average used elsewhere in the indicator), plus/minus the standard deviation multiplied by a user-defined factor.
The lookback used is the value of the "Channel Lookback" field. Its default is 100.
— High/Low Channel From Beginning of TF : in this mode, the High/Low values reset at the beginning of each timeframe unit.
— High/Low Channel From Beginning of Past Volume Lookback : in this mode, the High/Low values start from the farthest point back where we are calculating past volume ,
which is determined by the combination of timeframe units and the "Past Volume Lookback in TF units" value.
— High/Low Channel From Fixed Lookback : In this mode the lookback is fixed. You can define the value using the "Channel Lookback" field. The default value is 100.
• Period of RelVol Moving Average : the period of the Hull moving average used in the "Directional Relative Volume Average" and the "Relative Volume Average".
• High Volatility is defined using fast and slow ATR periods, so this represents the volatility of price.
Volatility is considered to be high when the fast ATR value is greater than its slow value. Volatility can be used as a filter in the column coloring conditions.
Column Coloring Conditions
• Eight different conditions can be turned on or off to determine the color of the volume columns. All "ON" conditions must be met to determine a high/low state of relative volume,
or, in the case of directional relative volume, a bull/bear state.
• A volatility state can also be used to filter the conditions.
• When the coloring conditions and the filter do not allow for a high/low state to be determined, the neutral color is used.
• Transitions of the color of the volume columns determined by coloring conditions are used to plot the up/down markers, which in turn control when alerts are triggered.
Colors
• You can define your own colors for all of the oscillator's plots.
• The default colors will perform well on light or dark chart backgrounds.
Alerts
• An alert can be defined for the script. The alert will trigger whenever an up/down marker appears in the indicator's display.
The particular combination of coloring conditions and the display settings for up/down markers when you create the alert will determine which conditions trigger the alert.
After alerts are created, subsequent changes to the conditions controlling the display of markers will not affect existing alerts.
• By configuring the script's inputs in different ways before you create your alerts, you can create multiple, functionally distinct alerts from this script.
When creating multiple alerts, it is useful to include in the alert's message a reminder of the particular conditions you used for each alert.
• As is usually the case, alerts triggering "Once Per Bar Close" will prevent repainting.
Error messages
Error messages will appear at the end of the chart upon the following conditions:
• When the combination of the timeframe units used and the "Past Volume Lookback in TF units" value create a lookback that is greater than 5000 bars.
The lookback will then be recalculated to a value such that a runtime error does not occur.
• If the chart's timeframe is higher than the timeframe units. This error cannot occur when using Auto-steps to calculate timeframe units.
• If relative volume cannot be calculated, for example, when no volume data is available for the chart's symbol.
• When the threshold of relative volume is configured to be visible but the indicator's scale does not allow it to be visible (in "Current Volume Columns" display mode).
█ NOTES
For traders
The chart shown here uses the following display modes: "Current Volume Columns", "Relative Volume Columns With Average", "Directional Relative Volume Average" and "Relative Volume Average". The last one also shows the threshold channel in standard deviation mode, and the TF Unit reminder to the right, in red.
Volume, like price, is a value with a market-dependent scale. The only valid reference for volume being its past values, any improvement in the way past volume is calculated thus represents a potential opportunity to traders. Relative volume calculated as it is here can help traders extract useful information from markets in many circumstances, markets with cyclical volume such as Forex being one, obvious case. The relative nature of the values calculated by this indicator also make it a natural fit for cross-market and cross-sector analysis, or to identify behavioral changes in the different futures contracts of the same market. Relative volume can also be put to more exotic uses, such as in evaluating changes in the popularity of exchanges.
Relative volume alone has no directional bias. While higher relative volume values always indicate higher trading activity, that activity does not necessarily translate into significant price movement. In a tightly fought battle between buyers and sellers, you could theoretically have very large volume for many bars, with no change whatsoever in bid/ask prices. This of course, is unlikely to happen in reality, and so traders are justified in considering high relative volume values as indicating periods where more attention is required, because imbalances in the strength of buying/selling power during high-volume trading periods can amplify price variations, providing traders with the generally useful gift of volatility.
Be sure to give the "Directional Relative Volume Average" a try. Contrary to the always-positive ratio widely used in this indicator, the "Directional Relative Volume Average" produces a value able to determine a bullish/bearish bias for relative volume.
Note that realtime bars must be complete for the relative volume value to be confirmed. Values calculated on historical or elapsed realtime bars will not recalculate unless historical volume data changes.
Finally, as with all indicators using volume information, keep in mind that some exchanges/brokers supply different feeds for intraday and daily data, and the volume data on both feeds can sometimes vary quite a bit.
For coders
Our script was written using the PineCoders Coding Conventions for Pine .
The description was formatted using the techniques explained in the How We Write and Format Script Descriptions PineCoders publication.
Bits and pieces of code were lifted from the MTF Selection Framework and the MTF Oscillator Framework , also by PineCoders.
█ THANKS
Thanks to dgtrd for suggesting to add the channel using standard deviation.
Thanks to adolgov for helpful suggestions on calculations and visuals.
Look first. Then leap.

Uptrick: Acceleration ShiftsIntroduction
Uptrick: Acceleration Shifts is designed to measure and visualize price momentum shifts by focusing on acceleration —the rate of change in velocity over time. It uses various moving average techniques as a trend filter, providing traders with a clearer perspective on market direction and potential trade entries or exits.
Purpose
The main goal of this indicator is to spot strong momentum changes (accelerations) and confirm them with a chosen trend filter. It attempts to distinguish genuine market moves from noise, helping traders make more informed decisions. The script can also trigger multiple entries (smart pyramiding) within the same trend, if desired.
Overview
By measuring how quickly price velocity changes (acceleration) and comparing it against a smoothed average of itself, this script generates buy or sell signals once the acceleration surpasses a given threshold. A trend filter is added for further validation. Users can choose from multiple smoothing methods and color schemes, and they can optionally enable a small table that displays real-time acceleration values.
Originality and Uniqueness
This script offers an acceleration-based approach, backed by several different moving average choices. The blend of acceleration thresholds, a trend filter, and an optional extra-entry (pyramiding) feature provides a flexible toolkit for various trading styles. The inclusion of multiple color themes and a slope-based coloring of the trend line adds clarity and user customization.
Inputs & Features
1. Acceleration Length (length)
This input determines the number of bars used when calculating velocity. Specifically, the script computes velocity by taking the difference in closing prices over length bars, and then calculates acceleration based on how that velocity changes over an additional length. The default is 14.
2. Trend Filter Length (smoothing)
This sets the lookback period for the chosen trend filter method. The default of 50 results in a moderately smooth trend line. A higher smoothing value will create a slower-moving trend filter.
3. Acceleration Threshold (threshold)
This multiplier determines when acceleration is considered strong enough to trigger a main buy or sell signal. A default value of 2.5 means the current acceleration must exceed 2.5 times the average acceleration before signaling.
4. Smart Pyramiding Strength (pyramidingThreshold)
This lower threshold is used for additional (pyramiding) entries once the main trend has already been identified. For instance, if set to 0.5, the script looks for acceleration crossing ±0.5 times its average acceleration to add extra positions.
5. Max Pyramiding Entries (maxPyramidingEntries)
This sets a limit on how many extra positions can be opened (beyond the first main signal) in a single directional trend. The default of 3 ensures traders do not become overexposed.
6. Show Acceleration Table (showTable)
When enabled, a small table displaying the current acceleration and its average is added to the top-right corner of the chart. This table helps monitor real-time momentum changes.
7. Smart Pyramiding (enablePyramiding)
This toggle decides whether additional entries (buy or sell) will be generated once a main signal is active. If enabled, these extra signals act as filtered entries, only firing when acceleration re-crosses a smaller threshold (pyramidingThreshold). These signals have a '+' next to their signal on the label.
8. Select Color Scheme (selectedColorScheme)
Allows choosing between various pre-coded color themes, such as Default, Emerald, Sapphire, Golden Blaze, Mystic, Monochrome, Pastel, Vibrant, Earth, or Neon. Each theme applies a distinct pair of colors for bullish and bearish conditions.
9. Trend Filter (TrendFilter)
Lets the user pick one of several moving average approaches to determine the prevailing trend. The options include:
Short Term (TEMA)
EWMA
Medium Term (HMA)
Classic (SMA)
Quick Reaction (DEMA)
Each method behaves differently, balancing reactivity and smoothness.
10. Slope Lookback (slopeOffset)
Used to measure the slope of the trend filter over a set number of bars (default is 10). This slope then influences the coloring of the trend filter line, indicating bullish or bearish tilt.
Note: The script refers to this as the "Massive Slope Index," but it effectively serves as a Trend Slope Calculation, measuring how the chosen trend filter changes over a specified period.
11. Alerts for Buy/Sell and Pyramiding Signals
The script includes built-in alert conditions that can be enabled or configured. These alerts trigger whenever the script detects a main Buy or Sell signal, as well as extra (pyramiding) signals if Smart Pyramiding is active. This feature allows traders to receive immediate notifications or automate a trading response.
Calculation Methodology
1. Velocity and Acceleration
Velocity is derived by subtracting the closing price from its value length bars ago. Acceleration is the difference in velocity over an additional length period. This highlights how quickly momentum is shifting.
2. Average Acceleration
The script smooths raw acceleration with a simple moving average (SMA) using the smoothing input. Comparing current acceleration against this average provides a threshold-based signal mechanism.
3. Trend Filter
Users can pick one of five moving average types to form a trend baseline. These range from quick-reacting methods (DEMA, TEMA) to smoother options (SMA, HMA, EWMA). The script checks whether the price is above or below this filter to confirm trend direction.
4. Buy/Sell Logic
A buy occurs when acceleration surpasses avgAcceleration * threshold and price closes above the trend filter. A sell occurs under the opposite conditions. An additional overbought/oversold check (based on a longer SMA) refines these signals further.
When price is considered oversold (i.e., close is below a longer-term SMA), a bullish acceleration signal has a higher likelihood of success because it indicates that the market is attempting to reverse from a lower price region. Conversely, when price is considered overbought (close is above this longer-term SMA), a bearish acceleration signal is more likely to be valid. This helps reduce false signals by waiting until the market is extended enough that a reversal or continuation has a stronger chance of following through.
5. Smart Pyramiding
Once a main buy or sell signal is triggered, additional (filtered) entries can be taken if acceleration crosses a smaller multiplier (pyramidingThreshold). This helps traders scale into strong moves. The script enforces a cap (maxPyramidingEntries) to limit risk.
6. Visual Elements
Candles can be recolored based on the active signal. Labels appear on the chart whenever a main or pyramiding entry signal is triggered. An optional table can show real-time acceleration values.
Color Schemes
The script includes a variety of predefined color themes. For bullish conditions, it might use turquoise or green, and for bearish conditions, magenta or red—depending on which color scheme the user selects. Each scheme aims to provide clear visual differentiation between bullish and bearish market states.
Why Each Indicator Was Part of This Component
Acceleration is employed to detect swift changes in momentum, capturing shifts that may not yet appear in more traditional measures. To further adapt to different trading styles and market conditions, several moving average methods are incorporated:
• TEMA (Triple Exponential Moving Average) is chosen for its ability to reduce lag more effectively than a standard EMA while still reacting swiftly to price changes. Its construction layers exponential smoothing in a way that can highlight sudden momentum shifts without sacrificing too much smoothness.
• DEMA (Double Exponential Moving Average) provides a faster response than a single EMA by using two layers of exponential smoothing. It is slightly less smoothed than TEMA but can alert traders to momentum changes earlier, though with a higher risk of noise in choppier markets.
• HMA (Hull Moving Average) is known for its balance of smoothness and reduced lag. Its weighted calculations help track trend direction clearly, making it useful for traders who want a smoother line that still reacts fairly quickly.
• SMA (Simple Moving Average) is the classic baseline for smoothing price data. It offers a clear, stable perspective on long-term trends, though it reacts more slowly than other methods. Its simplicity can be beneficial in lower-volatility or more stable market environments.
• EWMA (Exponentially Weighted Moving Average) provides a middle ground by emphasizing recent price data while still retaining some degree of smoothing. It typically responds faster than an SMA but is less aggressive than DEMA or TEMA.
Alongside these moving average techniques, the script employs a slope calculation (referred to as the “Massive Slope Index”) to visually indicate whether the chosen filter is sloping upward or downward. This adds an extra layer of clarity to directional analysis. The indicator also uses overbought/oversold checks, based on a longer-term SMA, to help filter out signals in overstretched markets—reducing the likelihood of false entries in conditions where the price is already extensively extended.
Additional Features
Alerts can be set up for both main signals and additional pyramiding signals, which is helpful for automated or semi-automated trading. The optional acceleration table offers quick reference values, making momentum monitoring more intuitive. Including explicit alert conditions for Buy/Sell and Pyramiding ensures traders can respond promptly to market movements or integrate these triggers into automated strategies.
Summary
This script serves as a comprehensive momentum-based trading framework, leveraging acceleration metrics and multiple moving average filters to identify potential shifts in market direction. By combining overbought/oversold checks with threshold-based triggers, it aims to reduce the noise that commonly plagues purely reactive indicators. The flexibility of Smart Pyramiding, customizable color schemes, and built-in alerts allows users to tailor their experience and respond swiftly to valid signals, potentially enhancing trading decisions across various market conditions.
Disclaimer
All trading involves significant risk, and users should apply their own judgment, risk management, and broader analysis before making investment decisions.

Wickless Heikin Ashi B/S [CHE]Wickless Heikin Ashi B/S \
Purpose.
Wickless Heikin Ashi B/S \ is built to surface only the cleanest momentum turns: it prints a Buy (B) when a bullish Heikin-Ashi candle forms with virtually no lower wick, and a Sell (S) when a bearish Heikin-Ashi candle forms with no upper wick. Optional Lock mode turns these into one-shot signals that hold the regime (bull or bear) until the opposite side appears. The tool can also project dashed horizontal lines from each signal’s price level to help you manage entries, stops, and partial take-profits visually.
How it works.
The indicator computes standard Heikin-Ashi values from your chart’s OHLC. A bar qualifies as bullish if its HA close is at or above its HA open; bearish if below. Then the wick on the relevant side is compared to the bar’s HA range. If that wick is smaller than your selected percentage threshold (plus a tiny tick epsilon to avoid rounding noise), the raw condition is considered “wickless.” Only one side can fire; on the rare occasion both raw conditions would overlap, the bar is ignored to prevent false dual triggers. When Lock is enabled, the first valid signal sets the active regime (background shaded light green for bull, light red for bear) and suppresses further same-side triggers until the opposite side appears, which helps reduce overtrading in chop.
Why wickless?
A missing wick on the “wrong” side of a Heikin-Ashi candle is a strong hint of persistent directional pressure. In practice, this filters out hesitation bars and many mid-bar flips. Traders who prefer entering only when momentum is decisive will find wickless bars useful for timing entries within an established bias.
Visuals you get.
When a valid buy appears, a small triangle “B” is plotted below the bar and a green dashed line can extend to the right from the signal’s HA open price. For sells, a triangle “S” above the bar and a red dashed line do the same. These lines act like immediate, price-anchored references for stop placement and profit scaling; you can shift the anchor left by a chosen number of bars if you prefer the line to start a little earlier for visual alignment.
How to trade it
Establish context first.
Pick a timeframe that matches your style: intraday index or crypto traders often use 5–60 minutes; swing traders might prefer 2–4 hours or daily. The tool is agnostic, but the cleanest results occur when the market is already trending or attempting a fresh breakout.
Entry.
When a B prints, the simplest rule is to enter long at or just after bar close. A conservative variation is to require price to take out the high of the signal bar in the next bar(s). For S, invert the logic: enter short on or after close, or only if price breaks the signal bar’s low.
Stop-loss.
Place the stop beyond the opposite extreme of the signal HA bar (for B: under the HA low; for S: above the HA high). If you prefer a static reference, use the dashed line level (signal HA open) or an ATR buffer (e.g., 1.0–1.5× ATR(14)). The goal is to give the trade enough room that normal noise does not immediately knock you out, while staying small enough to keep the risk contained.
Take-profit and management.
Two pragmatic approaches work well:
R-multiple scaling. Define your initial risk (distance from entry to stop). Scale out at 1R, 2R, and let a runner go toward 3R+ if structure holds.
Trailing logic. Trail behind a short moving average (e.g., EMA 20) or progressive swing points. Many traders also exit on the opposite signal when Lock flips, especially on faster timeframes.
Position sizing.
Keep risk per trade modest and consistent (e.g., 0.25–1% of account). The indicator improves timing; it does not replace risk control.
Settings guidance
Max lower wick for Bull (%) / Max upper wick for Bear (%).
These control how strict “wickless” must be. Tighter values (0.3–1.0%) yield fewer but cleaner signals and are great for strong trends or low-noise instruments. Looser values (1.5–3.0%) catch more setups in volatile markets but admit more noise. If you notice too many borderline bars triggering during high-volatility sessions, increase these thresholds slightly.
Lock (one-shot until opposite).
Keep Lock ON when you want one decisive signal per leg, reducing noise and signal clusters. Turn it OFF only if your plan intentionally scales into trends with multiple entries.
Extended lines & anchor offset.
Leave lines ON to maintain a visual memory of the last trigger levels. These often behave like near-term support/resistance. The offset simply lets you start that line one or more bars earlier if you prefer the look; it does not change the math.
Colors.
Use distinct bull/bear line colors you can read easily on your theme. The default lime/red scheme is chosen for clarity.
Practical examples
Momentum continuation (long).
Price is above your baseline (e.g., EMA 200). A B prints with a tight lower wick filter. Enter on close; stop under the signal HA low. Price pushes up in the next bars; you scale at 1R, trail the rest with EMA 20, and finally exit when a distant S appears or your trail is hit.
Breakout confirmation (short).
Following a range, price breaks down and prints an S with no upper wick. Enter short as the bar closes or on a subsequent break of the signal bar’s low. If the next bar immediately rejects and prints a bullish HA bar, your stop above the signal HA high limits damage. Otherwise, ride the move, harvesting partials as the red dashed line remains unviolated.
Alerts and automation
Set alerts to “Once Per Bar Close” for stability.
Bull ONE-SHOT fires when a valid buy prints (and Lock allows it).
Bear ONE-SHOT fires for sells analogously.
With Lock enabled, you avoid multiple pings in the same direction during a single leg—useful for webhooks or mobile notifications.
Reliability and limitations
The script calculates from completed bars and does not use higher-timeframe look-ahead or repainting tricks. Heikin-Ashi smoothing can lag turns slightly, which is expected and part of the design. In narrow ranges or whipsaw conditions, signals naturally thin out; if you must trade ranges, either tighten the wick filters and keep Lock ON, or add a trend/volatility filter (e.g., trade B only above EMA 200; S only below). Remember: this is an indicator, not a strategy. If you want exact statistics, port the triggers into a strategy and backtest with your chosen entry, stop, and exit rules.
Final notes
Wickless Heikin Ashi B/S \ is a precision timing tool: it waits for decisive, wickless HA bars, provides optional regime locking to reduce noise, and leaves clear price anchors on your chart for disciplined management. Use it with a simple framework—trend bias, fixed risk, and a straightforward exit plan—and it will keep your execution consistent without cluttering the screen or your decision-making.
Disclaimer: This indicator is for educational use and trade assistance only. It is not financial advice. You alone are responsible for your risk and results.
Enhance your trading precision and confidence with Wickless Heikin Ashi B/S ! 🚀
Happy trading
Chervolino

MACD_TRIGGER_CROSS_TRIANGLEMACD Triangle Trigger Indicator by thebearfib
Overview
The MACD Cross Triangle Indicator is a powerful tool for traders who rely on the MACD's signal line crossovers to make informed trading decisions. This indicator enhances the traditional MACD by allowing users to customize triggers for bullish and bearish signals and by displaying these signals directly on the chart with visually distinctive labels.
Features
Customizable Color Scheme: Choose distinct colors for bullish and bearish signals to fit your chart's theme or your personal preference.
Flexible Trigger Conditions: Select from a variety of trigger conditions based on MACD and signal line behaviors over a specified number of bars back.
Visual Signal Indicators: Bullish and bearish signals are marked with upward and downward triangles, making it easy to spot potential entry or exit points.
Detailed Trigger Descriptions: A comprehensive table lists all available triggers and their descriptions, aiding in selection and understanding of each trigger's mechanism.
Configuration Options
Bullish and Bearish Colors: Customize the color of the labels for bullish (upward) and bearish (downward) signals.
Trend Lookback Period: Choose how far back (in bars) the indicator should look to determine the trend, affecting the calculation of certain triggers.
Trigger Selection for Bullish and Bearish Signals: Pick specific triggers for both bullish and bearish conditions from a list of 10 different criteria, ranging from MACD crossovers to historical comparisons of MACD, signal line, and histogram values.
Label Size and Font Settings: Adjust the size of the signal labels on the chart and the font size of the trigger descriptions table to ensure readability and fit with your chart layout.
Trigger Descriptions Table Position and Color: Customize the position and color of the trigger descriptions table to match your chart's aesthetic and layout preferences.
Trigger Mechanisms
Trigger 1 to 10: Each trigger corresponds to a specific condition involving the MACD line, signal line, and histogram. These include crossovers, directional changes compared to previous bars, and comparisons of current values to historical values.
Usage
1. Select Trigger Conditions: Choose the desired triggers for bullish and bearish signals based on your trading strategy.
2. Customize Visuals: Set your preferred colors for the bullish and bearish labels, adjust label and font sizes, and configure the trigger descriptions table.
3. Analyze Signals: Watch for the upward (bullish) and downward (bearish) triangles to identify potential trading opportunities based on MACD crossover signals.
Conclusion
The MACD Cross Triangle Indicator offers a customizable and visually intuitive way to leverage MACD crossover signals for trading. With its flexible settings and clear signal indicators, traders can tailor the indicator to fit their strategy and improve their decision-making process on TradingView.
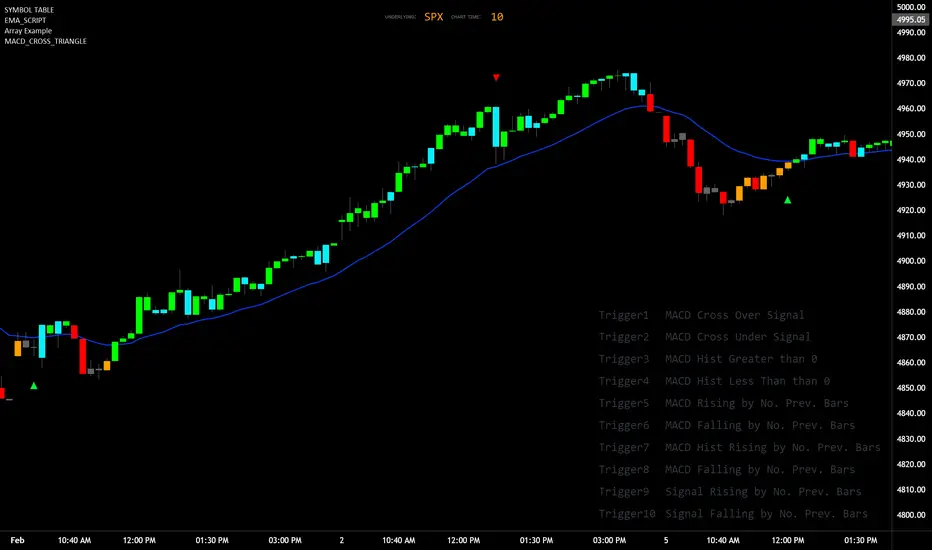
Image Plotter [theUltimator5]Image Plotter is a visual alerting tool that drops fun, high-contrast ASCII (braille) art (e.g., Rocket, Cat “hang in there”, Babe Ruth, etc.) directly on your price chart when a technical trigger fires. It’s designed for quick, glanceable callouts without cluttering your chart with lines or sub-indicators.
If there are any specific images you would like to be able to add to your plot, please comment with the image you want to see and if it is reasonable, I will add it.
How it works
On each bar close, the script evaluates your selected Trigger Source. When the condition is true, it places a label that contains the selected ASCII art at a configurable offset above or below the candle.
You can choose to only keep the most recent art on the chart, or accumulate every trigger as a historical breadcrumb trail.
Positioning uses either the bar’s high (for above-candle placements) or low (for below-candle placements), then applies your vertical % offset and horizontal bar shift.
Inputs & Controls
Trigger Source
Select which condition will fire the ASCII placement:
RSI Oversold / Overbought — Triggers on cross through the threshold (under/over).
MACD Bullish Cross / Bearish Cross — MACD line crossing the Signal line.
BB Lower Touch / BB Upper Touch — Price crossing below the lower band / above the upper band.
Stochastic Oversold / Overbought — %K crossing through your thresholds.
Volume Spike — Current volume > (Volume MA × Spike Multiplier).
Price Cross MA — Close crossing above the chosen moving average (bullish only).
Custom Condition — Optional user condition (see “Custom Condition” below).
Plot Mode
Latest Only — The indicator deletes the previous label and keeps only the newest trigger on chart.
Every Trigger — Leaves all triggered labels on the chart (historical markers).
Note: TradingView caps the number of labels per script; this indicator sets max_labels_count=500. Heavy triggering can still hit limits.
Practical usage tips
Choose “Latest Only” for cleanliness if your trigger is frequent. Use “Every Trigger” when you want a visual audit trail.
Tune vertical offset by symbol — low-priced tickers may need a smaller %; volatile names may need more spacing.
Quick start
Add the indicator to any chart (any timeframe).
Pick a Trigger Source (e.g., RSI Oversold) and set thresholds/lengths.
Choose ASCII Image, Position Above/Below, Offsets, and Plot Mode.
(Optional) Enable Custom Condition and select your Custom Plot Source.
Create an Alert on “ASCII Trigger Alert” using Once Per Bar Close.
Have a variant you’d like (e.g., bearish MA cross, multi-alert pack by trigger, or time-window filters)? Tell me what workflow you want and I’ll tailor the script/description to match.

Uptrick: Z-Score FlowOverview
Uptrick: Z-Score Flow is a technical indicator that integrates trend-sensitive momentum analysi s with mean-reversion logic derived from Z-Score calculations. Its primary objective is to identify market conditions where price has either stretched too far from its mean (overbought or oversold) or sits at a statistically “normal” range, and then cross-reference this observation with trend direction and RSI-based momentum signals. The result is a more contextual approach to trade entry and exit, emphasizing precision, clarity, and adaptability across varying market regimes.
Introduction
Financial instruments frequently transition between trending modes, where price extends strongly in one direction, and ranging modes, where price oscillates around a central value. A simple statistical measure like Z-Score can highlight price extremes by comparing the current price against its historical mean and standard deviation. However, such extremes alone can be misleading if the broader market structure is trending forcefully. Uptrick: Z-Score Flow aims to solve this gap by combining Z-Score with an exponential moving average (EMA) trend filter and a smoothed RSI momentum check, thus filtering out signals that contradict the prevailing market environment.
Purpose
The purpose of this script is to help traders pinpoint both mean-reversion opportunities and trend-based pullbacks in a way that is statistically grounded yet still mindful of overarching price action. By pairing Z-Score thresholds with supportive conditions, the script reduces the likelihood of acting on random price spikes or dips and instead focuses on movements that are significant within both historical and current contextual frameworks.
Originality and Uniquness
Layered Signal Verification: Signals require the fulfillment of multiple layers (Z-Score extreme, EMA trend bias, and RSI momentum posture) rather than merely breaching a statistical threshold.
RSI Zone Lockout: Once RSI enters an overbought/oversold zone and triggers a signal, the script locks out subsequent signals until RSI recovers above or below those zones, limiting back-to-back triggers.
Controlled Cooldown: A dedicated cooldown mechanic ensures that the script waits a specified number of bars before issuing a new signal in the opposite direction.
Gradient-Based Visualization: Distinct gradient fills between price and the Z-Mean line enhance readability, showing at a glance whether price is trading above or below its statistical average.
Comprehensive Metrics Panel: An optional on-chart table summarizes the Z-Score’s key metrics, streamlining the process of verifying current statistical extremes, mean levels, and momentum directions.
Why these indicators were merged
Z-Score measurements excel at identifying when price deviates from its mean, but they do not intrinsically reveal whether the market’s trajectory supports a reversion or if price might continue along its trend. The EMA, commonly used for spotting trend directions, offers valuable insight into whether price is predominantly ascending or descending. However, relying solely on a trend filter overlooks the intensity of price moves. RSI then adds a dedicated measure of momentum, helping confirm if the market’s energy aligns with a potential reversal (for example, price is statistically low but RSI suggests looming upward momentum). By uniting these three lenses—Z-Score for statistical context, EMA for trend direction, and RSI for momentum force—the script offers a more comprehensive and adaptable system, aiming to avoid false positives caused by focusing on just one aspect of price behavior.
Calculations
The core calculation begins with a simple moving average (SMA) of price over zLen bars, referred to as the basis. Next, the script computes the standard deviation of price over the same window. Dividing the difference between the current price and the basis by this standard deviation produces the Z-Score, indicating how many standard deviations the price is from its mean. A positive Z-Score reveals price is above its average; a negative reading indicates the opposite.
To detect overall market direction, the script calculates an exponential moving average (emaTrend) over emaTrendLen bars. If price is above this EMA, the script deems the market bullish; if below, it’s considered bearish. For momentum confirmation, the script computes a standard RSI over rsiLen bars, then applies a smoothing EMA over rsiEmaLen bars. This smoothed RSI (rsiEma) is monitored for both its absolute level (oversold or overbought) and its slope (the difference between the current and previous value). Finally, slopeIndex determines how many bars back the script compares the basis to check whether the Z-Mean line is generally rising, falling, or flat, which then informs the coloring scheme on the chart.
Calculations and Rational
Simple Moving Average for Baseline: An SMA is used for the core mean because it places equal weight on each bar in the lookback period. This helps maintain a straightforward interpretation of overbought or oversold conditions in the context of a uniform historical average.
Standard Deviation for Volatility: Standard deviation measures the variability of the data around the mean. By dividing price’s difference from the mean by this value, the Z-Score can highlight whether price is unusually stretched given typical volatility.
Exponential Moving Average for Trend: Unlike an SMA, an EMA places more emphasis on recent data, reacting quicker to new price developments. This quicker response helps the script promptly identify trend shifts, which can be crucial for filtering out signals that go against a strong directional move.
RSI for Momentum Confirmation: RSI is an oscillator that gauges price movement strength by comparing average gains to average losses over a set period. By further smoothing this RSI with another EMA, short-lived oscillations become less influential, making signals more robust.
SlopeIndex for Slope-Based Coloring: To clarify whether the market’s central tendency is rising or falling, the script compares the basis now to its level slopeIndex bars ago. A higher current reading indicates an upward slope; a lower reading, a downward slope; and similar readings, a flat slope. This is visually represented on the chart, providing an immediate sense of the directionality.
Inputs
zLen (Z-Score Period)
Specifies how many bars to include for computing the SMA and standard deviation that form the basis of the Z-Score calculation. Larger values produce smoother but slower signals; smaller values catch quick changes but may generate noise.
emaTrendLen (EMA Trend Filter)
Sets the length of the EMA used to detect the market’s primary direction. This is pivotal for distinguishing whether signals should be considered (price aligning with an uptrend or downtrend) or filtered out.
rsiLen (RSI Length)
Defines the window for the initial RSI calculation. This RSI, when combined with the subsequent smoothing EMA, forms the foundation for momentum-based signal confirmations.
rsiEmaLen (EMA of RSI Period)
Applies an exponential moving average over the RSI readings for additional smoothing. This step helps mitigate rapid RSI fluctuations that might otherwise produce whipsaw signals.
zBuyLevel (Z-Score Buy Threshold)
Determines how negative the Z-Score must be for the script to consider a potential oversold signal. If the Z-Score dives below this threshold (and other criteria are met), a buy signal is generated.
zSellLevel (Z-Score Sell Threshold)
Determines how positive the Z-Score must be for a potential overbought signal. If the Z-Score surpasses this threshold (and other checks are satisfied), a sell signal is generated.
cooldownBars (Cooldown (Bars))
Enforces a bar-based delay between opposite signals. Once a buy signal has fired, the script must wait the specified number of bars before registering a new sell signal, and vice versa.
slopeIndex (Slope Sensitivity (Bars))
Specifies how many bars back the script compares the current basis for slope coloration. A bigger slopeIndex highlights larger directional trends, while a smaller number emphasizes shorter-term shifts.
showMeanLine (Show Z-Score Mean Line)
Enables or disables the plotting of the Z-Mean and its slope-based coloring. Traders who prefer minimal chart clutter may turn this off while still retaining signals.
Features
Statistical Core (Z-Score Detection):
This feature computes the Z-Score by taking the difference between the current price and the basis (SMA) and dividing by the standard deviation. In effect, it translates price fluctuations into a standardized measure that reveals how significant a move is relative to the typical variation seen over the lookback. When the Z-Score crosses predefined thresholds (zBuyLevel for oversold and zSellLevel for overbought), it signals that price could be at an extreme.
How It Works: On each bar, the script updates the SMA and standard deviation. The Z-Score is then refreshed accordingly. Traders can interpret particularly large negative or positive Z-Score values as scenarios where price is abnormally low or high.
EMA Trend Filter:
An EMA over emaTrendLen bars is used to classify the market as bullish if the price is above it and bearish if the price is below it. This classification is applied to the Z-Score signals, accepting them only when they align with the broader price direction.
How It Works: If the script detects a Z-Score below zBuyLevel, it further checks if price is actually in a downtrend (below EMA) before issuing a buy signal. This might seem counterintuitive, but a “downtrend” environment plus an oversold reading often signals a potential bounce or a mean-reversion play. Conversely, for sell signals, the script checks if the market is in an uptrend first. If it is, an overbought reading aligns with potential profit-taking.
RSI Momentum Confirmation with Oversold/Overbought Lockout:
RSI is calculated over rsiLen, then smoothed by an EMA over rsiEmaLen. If this smoothed RSI dips below a certain threshold (for example, 30) and then begins to slope upward, the indicator treats it as a potential sign of recovering momentum. Similarly, if RSI climbs above a certain threshold (for instance, 70) and starts to slope downward, that suggests dwindling momentum. Additionally, once RSI is in these zones, the indicator locks out repetitive signals until RSI fully exits and re-enters those extreme territories.
How It Works: Each bar, the script measures whether RSI has dropped below the oversold threshold (like 30) and has a positive slope. If it does, the buy side is considered “unlocked.” For sell signals, RSI must exceed an overbought threshold (70) and slope downward. The combination of threshold and slope helps confirm that a reversal is genuinely in progress instead of issuing signals while momentum remains weak or stuck in extremes.
Cooldown Mechanism:
The script features a custom bar-based cooldown that prevents issuing new signals in the opposite direction immediately after one is triggered. This helps avoid whipsaw situations where the market quickly flips from oversold to overbought or vice versa.
How It Works: When a buy signal fires, the indicator notes the bar index. If the Z-Score and RSI conditions later suggest a sell, the script compares the current bar index to the last buy signal’s bar index. If the difference is within cooldownBars, the signal is disallowed. This ensures a predefined “quiet period” before switching signals.
Slope-Based Coloring (Z-Mean Line and Shadow):
The script compares the current basis value to its value slopeIndex bars ago. A higher reading now indicates a generally upward slope, while a lower reading indicates a downward slope. The script then shades the Z-Mean line in a corresponding bullish or bearish color, or remains neutral if little change is detected.
How It Works: This slope calculation is refreshingly straightforward: basis – basis . If the result is positive, the line is colored bullish; if negative, it is colored bearish; if approximately zero, it remains neutral. This provides a quick visual cue of the medium-term directional bias.
Gradient Overlays:
With gradient fills, the script highlights where price stands in relation to the Z-Mean. When price is above the basis, a purple-shaded region is painted, visually indicating a “bearish zone” for potential overbought conditions. When price is below, a teal-like overlay is used, suggesting a “bullish zone” for potential oversold conditions.
How It Works: Each bar, the script checks if price is above or below the basis. It then applies a fill between close and basis, using distinct colors to show whether the market is trading above or below its mean. This creates an immediate sense of how extended the market might be.
Buy and Sell Labels (with Alerts):
When a legitimate buy or sell condition passes every check (Z-Score threshold, EMA trend alignment, RSI gating, and cooldown clearance), the script plots a corresponding label directly on the chart. It also fires an alert (if alerts are set up), making it convenient for traders who want timely notifications.
How It Works: If rawBuy or rawSell conditions are met (refined by RSI, EMA trend, and cooldown constraints), the script calls the respective plot function to paint an arrow label on the chart. Alerts are triggered simultaneously, carrying easily recognizable messages.
Metrics Table:
The optional on-chart table (activated by showMetrics) presents real-time Z-Score data, including the current Z-Score, its rolling mean, the maximum and minimum Z-Score values observed over the last zLen bars, a percentile position, and a short-term directional note (rising, falling, or flat).
Current – The present Z-Score reading
Mean – Average Z-Score over the zLen period
Min/Max – Lowest and highest Z-Score values within zLen
Position – Where the current Z-Score sits between the min and max (as a percentile)
Trend – Whether the Z-Score is increasing, decreasing, or flat
Conclusion
Uptrick: Z-Score Flow offers a versatile solution for traders who need a statistically informed perspective on price extremes combined with practical checks for overall trend and momentum. By leveraging a well-defined combination of Z-Score, EMA trend classification, RSI-based momentum gating, slope-based visualization, and a cooldown mechanic, the script reduces the occurrence of false or premature signals. Its gradient fills and optional metrics table contribute further clarity, ensuring that users can quickly assess market posture and make more confident trading decisions in real time.
Disclaimer
This script is intended solely for informational and educational purposes. Trading in any financial market comes with substantial risk, and there is no guarantee of success or the avoidance of loss. Historical performance does not ensure future results. Always conduct thorough research and consider professional guidance prior to making any investment or trading decisions.

Alert Sender Library [TradingFinder]Library "AlertSenderLibrary_TradingFinder"
🔵 Introduction
The "Alert Sender Library" is a management and production program for "Alert Messages" that enables the creation of unique messages for any type of signal generated by indicators or strategies.
These messages include the direction of the signal, symbol, time frame, the date and time the condition was triggered, prices related to the signal, and a personal message from you. To make better and more optimal use of this "library", you should carefully study " Key Features" and "How to Use".
🔵 Key Features
Automatic Detection of Appropriate Type :
Using two parameters, "AlertType" and "DetectionType", which you must enter at the beginning into the "AlertSender" function, the type of the alert message is determined.
For example, if you select one of the "DetectionType"s such as "Order Block Signal", "Signal", and "Setup", your alert type will be chosen based on "Long" and "Short". Whether it's "Long" or "Short" depends on the "AlertType" you have set to either "Bullish" or "Bearish".
Automatic Symbol Detection :
Whenever you add an alert for a specific symbol, if you want the name of that symbol to be in your message text, you must manually write the name of the symbol in your message. One of the capabilities of the "Alert Sender" is the automatic detection of the symbol and adding it to the message text.
Automatic Time Frame Detection :
When adding your alert, the "Alert Sender" detects the time frame of the symbol you intend to add the alert for and adds it to the text. This feature is very practical and can prevent traders from making mistakes.
For example, a trader might add alerts for a specific symbol using a specific indicator in different time frames, taking the main signal in the 1-hour time frame and only a confirmation signal in the 15-minute time frame. This feature helps to identify in which time frame the signal is set.
Detection of Date and Time When the Signal is Triggered :
You can have the date and time at the moment the message is sent. This feature has various uses. For example, if you use the Webhook URL feature to send messages to a Telegram channel, there might be issues with alert delivery on your server, causing delays, and you might receive the message when it has lost its validity.
With this feature, you can match the sending time of the message from TradingView with the receipt time in your messenger and detect if there is a delay in message delivery.
Important :
You can also set the Time Zone you wish to receive the date and time based on.
Display of "Key Prices" :
Key prices can vary based on the type of signals. For example, when the "DetectionType" is in "Order Block Signal" mode, the key prices are the "Distal" and "Proximal" prices. Or if the "DetectionType" is in "Setup" mode, the key prices are "Entry", "Stop Loss", and "Take Profit".
Receipt of Personal "Messages" :
You can enter your personal message using "input.string" or "input.text_area" in addition to the messages that are automatically created.
Beautiful and Functional Display of Messages :
The titles of messages sent by "AlertSender" are displayed using related emojis to prevent mistakes due to visual errors, enhancing beauty.
🔵 How to Use
🟣 Familiarity with Function and Parameters
AlertSender(Condition, Alert, AlertName, AlertType, DetectionType, SetupData, Frequency, UTC, MoreInfo, Message, o, h, l, c, Entry, TP, SL, Distal, Proximal)
Parameters:
- Condition (bool)
- Alert (string)
- AlertName (string)
- AlertType (string)
- DetectionType (string)
- SetupData (string)
- Frequency (string)
- UTC (string)
- MoreInfo (string)
- Message (string)
- o (float)
- h (float)
- l (float)
- c (float)
- Entry (float)
- TP (float)
- SL (float)
- Distal (float)
- Proximal (float)
To add "Alert Sender Library", you must first add the following code to your script.
import TFlab/AlertSenderLibrary_TradingFinder/1
🟣 Parameters
"Condition" : This parameter is a Boolean. You need to set it based on the condition that, when met (or fired), you want to receive an alert. The output should be either "true" or "false".
"Alert" : This parameter accepts one of two inputs, "On" or "Off". If set to "On", the alarm is active; if "Off", the alarm is deactivated. This input is useful when you have numerous alerts in an indicator or strategy and need to activate only a few of them. "Alert" is a string parameter.
Alert = input.string('On', 'Alert', , 'If you turn on the Alert, you can receive alerts and notifications after setting the "Alert".', group = 'Alert')
"AlertName" : This is a string parameter where you can enter the name you choose for your alert.
AlertName = input.string('Order Blocks Finder ', 'Alert Name', group = 'Alert')
"AlertType" : The inputs for this parameter are "Bullish" or "Bearish". If the condition selected in the "Condition" parameter is of a bullish bias, you should set this parameter to "Bullish", and if the condition is of a bearish bias, it should be set to "Bearish". "AlertType" is a string parameter.
"DetectionType" : This parameter's predefined inputs include "Order Block Signal", "Signal", "Setup", and "Analysis". You may provide other inputs, but some functionalities, like "Key Price", might be lost. "DetectionType" is a string parameter.
"SetupData" :
If "DetectionType" is set to "Setup", you must specify "SetupData" as either "Basic" or "Full". In "Basic" mode, only the "Entry" price needs to be defined in the function, and "TP" (Take Profit) and "SL" (Stop Loss) can be any number or NA. In "Full" mode, you need to define "Entry", "SL", and "TP". "Setup" is a string parameter.
"Frequency" : This string parameter defines the announcement frequency. Choices include: "All" (activates the alert every time the function is called), "Once Per Bar" (activates the alert only on the first call within the bar), and "Once Per Bar Close" (the alert is activated only by a call at the last script execution of the real-time bar upon closing). The default setting is "Once per Bar".
Frequency = input.string('Once Per Bar', 'Message Frequency', , 'The triggering frequency. Possible values are: All (all function calls trigger the alert), Once Per Bar (the first function call during the bar triggers the alert), Per Bar Close (the function call triggers the alert only when it occurs during the last script iteration of the real-time bar, when it closes). The default is alert.freq_once_per_bar.', group = 'Alert')
"UTC" : With this parameter, you can set the Time Zone for the date and time of the alert's dispatch. "UTC" is a string parameter and can be set as "UTC-4", "UTC+1", "UTC+9", or any other Time Zone.
UTC = input.string('UTC', 'Show Alert time by Time Zone', group = 'Alert')
"MoreInfo" : This parameter can take one of two inputs, "On" or "Off", which are strings. Additional information, including "Time" and "Key Price", is included. If set to "On", this information is received; if "Off", it is not displayed in the sent message.
MoreInfo = input.string('On', 'Display More Info', , group = 'Alert')
"Message" : This parameter captures the user's personal message through an input and displays it at the end of the sent message. It is a string input.
MessageBull = input.text_area('Long Position', 'Long Signal Message', group = 'Alert') MessageBear = input.text_area('Short Position', 'Short Signal Message', group = 'Alert')
"o" (Open Price): A floating-point number representing the opening price of the candle. This input is necessary when the "DetectionType" is set to "Signal". Otherwise, it can be any number or "na".
"h" (High Price): A float variable for the highest price of the candle. Required when "DetectionType" is "Signal"; in other cases, any number or "na" is acceptable.
"l" (Low Price): A float representing the lowest price of the candle. This field must be filled if "DetectionType" is "Signal". If not, it can be any number or "na".
"c" (Close Price): A floating-point variable indicating the closing price of the candle. Needed for "Signal" type detections; otherwise, it can take any value or "na".
"Entry" : A float variable indicating the entry price into a trading setup. This is relevant when "DetectionType" is in "Setup" mode. In other scenarios, it can be any number or "na". It denotes the price at which the trade setup is entered.
"TP" (Take Profit): A float that is necessary when "DetectionType" is "Setup" and "SetupData" is "Full". Otherwise, it can be any number or "na". It signifies the price target for taking profits in a trading setup.
"SL" (Stop Loss): A float required when "DetectionType" is "Setup" and "SetupData" is "Full". It can be any number or "na" in other cases. This value represents the price at which a stop loss is set to limit losses.
"Distal" : A float important for "Order Block Signal" detection. It can be any number or "na" if not in use. This variable indicates the price reaching the distal line of an order block.
"Proximal" : A float needed for "Order Block Signal" detection mode. It can take any value or "na" otherwise. It marks the price reaching the proximal line of an order block.

Tape [LucF]█ OVERVIEW
This script prints an ersatz of a trading console's "tape" section to the right of your chart. It displays the time, price and volume of each update of the chart's feed. It also calculates volume delta for the bar. As it calculates from realtime information, it will not display information on historical bars.
█ FEATURES
Calculations
Each new line in the tape displays the last price/volume update from the TradingView feed that's building your chart. These updates do not necessarily correspond to ticks from the originating broker/exchange's matching engine. Multiple broker/exchange ticks are often aggregated in one chart update.
The script first determines if price has moved up or down since the last update. The polarity of the price change, in turn, determines the polarity of the volume for that specific update. If price does not move between consecutive updates, then the last known polarity is used. Using this method, we can calculate a running volume delta accumulation for the bar, which becomes the bar's final volume delta value when the bar closes (you can inspect values of elapsed realtime bars in the Data Window or the indicator's values). Note that these values will all reset if the script re-executes because of a change in inputs or a chart refresh.
While this method of calculating volume delta is not perfect, it is currently the most precise way of calculating volume delta available on TradingView at the moment. Calculating more precise results would require scripts to have access to bid/ask levels from any chart timeframe. Charts at seconds timeframes do use exchange/broker ticks when the feeds you are using allow for it, and this indicator will run on them, but tick data is not yet available from higher timeframes, for now. Also note that the method used in this script is far superior to the intrabar inspection technique used on historical bars in my other "Delta Volume" indicators. This is because volume delta here is calculated from many more realtime updates than the available intrabars in history.
Inputs
You can use the script's inputs to configure:
• The number of lines displayed in the tape.
• If new lines appear at the top or bottom.
• If you want to hide lines with low volume.
• The precision of volume values.
• The size of the text and the colors used to highlight either the tape's text or background.
• The position where you want the tape on your chart.
• Conditions triggering three different markers.
Display
Deltas are shown at the bottom of the tape. They are reset on each bar. Time delta displays the time elapsed since the beginning of the bar, on intraday timeframes only. Contrary to the price change display by TradingView at the top left of charts, which is calculated from the close of the previous bar, the price delta in the tape is calculated from the bar's open, because that's the information used in the calculation of volume delta. The time will become orange when volume delta's polarity diverges from that of the bar. The volume delta value represents the current, cumulative value for the bar. Its color reflects its polarity.
When new realtime bars appear on the chart, a ↻ symbol will appear before the volume value in tape lines.
Markers
There are three types of markers you can choose to display:
• Marker 1 on volume bumps. A bump is defined as two consecutive and increasing/decreasing plus/minus delta volume values,
when no divergence between the polarity of delta volume and the bar occurs on the second bar.
• Marker 2 on volume delta for the bar exceeding a limit of your choice when there is no divergence between the polarity of delta volume and the bar. These trigger at the bar's close.
• Marker 3 on tape lines with volume exceeding a threshold. These trigger in realtime. Be sure to set a threshold high enough so that it doesn't generate too many alerts.
These markers will only display briefly under the bar, but another marker appears next to the relevant line in the tape.
The marker conditions are used to trigger alerts configured on the script. Alert messages will mention the marker(s) that triggered the specific alert event, along with the relevant volume value that triggered the marker. If more than one marker triggers a single alert, they will overprint under the bar, which can make it difficult to distinguish them.
For more detailed on-chart analysis of realtime volume delta, see my Delta Volume Realtime Action .
█ NOTES FOR CODERS
This script showcases two new Pine features:
• Tables, which allow Pine programmers to display tabular information in fixed locations of the chart. The tape uses this feature.
See the Pine User Manual's page on Tables for more information.
• varip -type variables which we can use to save values between realtime updates.
See the " Using `varip` variables " publication by PineCoders for more information.

The Strat Lite [rdjxyz]◆ OVERVIEW
The Strat Lite is a stripped down version of the Strat Assistant indicator by rickyzcarroll—focusing on visual simplicity and script performance. If you're new to The Strat, you may prefer the Strat Assistant as a learning aid.
◇ FEATURES REMOVED FROM THE ORIGINAL SCRIPT
Candle Numbering & Up/Down Arrows
Previous Week High & Low Lines
Previous Day High & Low Lines
Action Wick Percentage
Actionable Signals Plot
Strat Combo Plots
Extensive Alerts
◇ FEATURES KEPT FROM THE ORIGINAL SCRIPT
Full Timeframe Continuity
Candle Coloring
◇ FEATURES ADDED TO THE ORIGINAL SCRIPT
Failed 2 Down Classification
Failed 2 Up Classification
◆ DETAILS
The Strat is a trading methodology developed by Rob Smith that offers an objective approach to trading by focusing on the 3 universal scenarios regarding candle behavior:
SCENARIO ONE
The 1 Bar - Inside Bar: A candle that doesn't take out the highs or the lows of the previous candle; aka consolidation.
These are shown as gray candles by default.
SCENARIO TWO
The 2 Bar - Directional Bar: A candle that takes out one side of the previous candle; aka trending (or at least attempting to trend).
SCENARIO THREE
The 3 Bar - Outside Bar: A candle that takes out both sides of the previous candle; aka broadening formation.
In addition to Rob's 3 universal scenarios, this indicator identifies two variations of 2 bars:
Failed 2 up: A candle that takes out the high of the previous candle but closes bearish.
Failed 2 down: A candle that takes out the low of the previous candle but closes bullish.
◆ SETTINGS
◇ INPUTS
FTC (FULL TIMEFRAME CONTINUITY)
Show/hide FTC plots
Offset FTC plots from current bar
◇ STYLE
STRAT COLORS
Color 0 (Failed 2 Up) - Default is fuchsia
Color 1 (Failed 2 Down) - Default is teal
Color 2 (Inside 1) - Default is gray
Color 3 (Outside 3) - Default is dark purple
Color 4 (2 up) - Default is aqua
Color 5 (2 down) - Default is white
◆ USAGE
It's recommended to use The Strat Lite with a top down analysis so you can find lower timeframe positions with higher timeframe context.
◇ TOP DOWN ANALYSIS
MONTHLY LEVELS
Starting on a monthly chart, the previous month's high and low are manually plotted.
WEEKLY LEVELS
Dropping down to a weekly chart, the previous week's high and low are manually plotted.
DAILY LEVELS
Dropping down to a daily chart, the previous day's high and low are manually plotted.
12H LEVELS
Dropping down to a 12h chart, the previous 12h's high and low are manually plotted.
ANALYSIS
The monthly low was broken, creating a lower low (aka a broadening formation), signalling potential exhaustion risk, which can be a catalyst for reversals. The daily candle that tested the monthly low closed as a Failed 2 Down—potentially an early sign of a reversal. With these 2 confluences, it's reasonable to expect the next daily candle to be a 2 Up. Now it's time to look for a lower timeframe entry.
◇ LOWER TIMEFRAME POSITION
HOURLY PRICE ACTION
Dropping down to an hourly chart, we're anticipating a 2 Up on the daily timeframe, so we're looking for a bullish pattern to enter a position long. I personally like the 6:00 AM UTC-5 hourly candle, as it's the midpoint of the day (for futures).
In this specific example, we see the opening gap was filled and there's a potential 2-1-2 bullish reversal set up.
At this point, price can either do one of 5 things:
Form another 1 (inside) candle
Form a 2 up (directional) candle
Form a 2 down (directional) candle
Form a 2 up, fail, and potentially flip to form a bearish 3 (outside) candle
Form a 2 down, fail, and potentially flip to form a bullish 3 (outside) candle
Knowing the finite potential outcomes helps us set up our positions, manage them accordingly, and flip bias if needed.
POSITION SETUP
Here we can set up a position long AND short. To go long, we set a buy stop at the 1h high and stop loss just below the 50% level of the inside candle; to go short, we set a sell stop at 1h low and stop loss just above the 50% level of the inside candle.
If the short gets triggered first, we can wait for price to move in our favor before cancelling the buy order. If the short becomes a failed 2 down, potentially reversing to become a bullish 3, we can either wait for the stop loss to trigger and for the long position to trigger OR we can move the buy stop to our short stop loss and move the long stop loss to the low of the 1h candle.
POSITION REFINEMENT
For an even tighter risk-to-reward, we can drop to a lower timeframe and look for setups that would be an early trigger of the 1h entry. Just know, the lower you go the more noise there is—increasing risk of getting stopped out before the 1h trigger.
Above are 30m refined entries.
In this example, the long buy stop was triggered. It closed bullish, so the sell stop order can be cancelled.
◇ TARGETS & POSITION MANAGEMENT
TARGETS
These depend on whether you intend to scalp, day trade, or swing trade, but targets are typically the highs of previous candles (when bullish) and lows of previous candles (when bearish). It's advised to be cautious of swing pivots as there's a risk of exhaustion and reversal at these levels.
In this example, the nearest target was the previous 12h high and the next target was the previous day high; if you're a swing trader, you could target previous week's high and previous month's high.
POSITION MANAGEMENT
This largely depends on your risk tolerance, but it's common to either:
Move stop loss slightly into profit
Trail stop loss behind higher highs (bullish) or lower lows (bearish)
Scale out of positions at potential pivot points, leaving a runner
Scale into positions on pullbacks on the way to target
◆ WRAP UP
As demonstrated, The Strat Lite offers a stripped down version of the Strat Assistant—making it visually simple for more experienced Strat traders. By following a top-down approach with The Strat methodology, you can find high probability setups and manage risk with relative ease.
◆ DISCLAIMER
This indicator is a tool for visual analysis and is intended to assist traders who follow The Strat methodology. As with any trading methodology, there's no guarantee of profits; trading involves a high degree of risk and you could lose all of your invested capital. The example shown is of past performance and is not indicative of future results and does not constitute and should not be construed as investment advice. All trading decisions and investments made by you are at your own discretion and risk. Under no circumstances shall the author be liable for any direct, indirect, or incidental damages. You should only risk capital you can afford to lose.

Ayman Entry Signal – Ultimate PRO (Scalping Gold Settings)1. Overview
This indicator is a professional gold scalping tool built for TradingView using Pine Script v6.
It combines multiple price action and technical filters to generate high-probability Buy/Sell signals with built-in trade management features (TP1, TP2, SL, Break Even, Partial Close, Stats tracking).
It is optimized for XAUUSD but can be applied to other assets with proper setting adjustments.
2. Key Features
Multi-Condition Trade Signals – EMA trend, Break of Structure, Order Blocks, FVG, Liquidity Sweeps, Pin Bars, Higher Timeframe confirmation, Trend Cloud, SMA Cross, and ADX.
Full Trade Management – Auto-calculates lot size, SL, TP1, TP2, Break Even, Partial Close.
Dynamic Chart Drawing – Entry lines, SL/TP lines, trade boxes, and real-time PnL.
Statistics Panel – Tracks wins, losses, breakeven trades, and total PnL over selected dates.
Customizable Filters – All filters can be turned ON/OFF to match your strategy.
3. Main Inputs & Settings
Account Settings
Capital ($) – Total trading capital.
Risk Percentage (%) – Risk per trade.
TP to SL Ratio – Risk-to-reward ratio.
Value Per Point ($) – Value per pip/point for lot size calculation.
SL Buffer – Extra points added to SL to avoid stop hunts.
Take Profit Settings
TP1 % of Full Target – Fraction of TP1 compared to TP2.
Move SL to Entry after TP1? – Activates Break Even after TP1.
Break Even Buffer – Extra points when moving SL to BE.
Take Partial Close at TP1 – Option to close half at TP1.
Signal Filters
ATR Period – For SL/TP calculation buffer.
EMA Trend – Uses EMA 9/21 crossover for trend.
Break of Structure (BoS) – Requires structure break confirmation.
Order Block (OB) – Validates trades within OB zones.
Fair Value Gap (FVG) – Confirms trades inside FVGs.
Liquidity Sweep – Checks if liquidity zones are swept.
Pin Bar Confirmation – Uses candlestick patterns for extra confirmation.
Pin Bar Body Ratio – Controls strictness of Pin Bar filter.
Higher Timeframe Filters (HTF)
HTF EMA Confirmation – Confirms lower timeframe trades with higher timeframe trend.
HTF BoS – Confirms with higher timeframe structure break.
HTF Timeframe – Selects higher timeframe.
Advanced Filters
SuperTrend Filter – Confirms trades based on SuperTrend.
ADX Filter – Filters out low volatility periods.
SMA Cross Filter – Uses SMA 8/9 cross as filter.
Trend Cloud Filter – Uses EMA 50/200 as a cloud trend filter.
4. How It Works
Buy Signal Conditions
EMA 9 > EMA 21 (trend bullish)
Optional filters (BoS, OB, FVG, Liquidity Sweep, Pin Bar, HTF confirmations, ADX, SMA Cross, Trend Cloud) must pass if enabled.
When all active filters pass → Buy signal triggers.
Sell Signal Conditions
EMA 9 < EMA 21 (trend bearish)
Same filtering process but for bearish conditions.
When all active filters pass → Sell signal triggers.
5. Trade Execution & Management
When a signal triggers:
Lot size is auto-calculated based on risk % and SL distance.
SL is placed beyond recent swing high/low + ATR buffer.
TP1 and TP2 are calculated from the SL using the reward-to-risk ratio.
Break Even: If enabled, SL moves to entry price after TP1 is hit.
Partial Close: If enabled, half of the position closes at TP1.
Trade Exit: Full exit at TP2, SL hit, or partial close at TP1.
6. Chart Display
Entry Line – Shows entry price.
SL Line – Red dashed line at stop loss level.
TP1 Line – Lime dashed line for TP1.
TP2 Line – Green dashed line for TP2.
PnL Labels – Displays real-time profit/loss in $.
Trade Box – Visual area showing trade range.
Pin Bar Shapes – Optional, marks Pin Bars.
7. Statistics Panel
Stats Header – Shows “Stats”.
Total Trades
Wins
Losses
Breakeven Trades
Total PnL
Can be reset or filtered by date.
8. How to Use
Load the Indicator in TradingView.
Select Gold (XAUUSD) on your preferred scalping timeframe (1m, 5m, 15m).
Adjust settings:
Use default gold scalping settings for quick start.
Enable/disable filters according to your style.
Wait for a Buy/Sell alert.
Confirm visually that all desired conditions align.
Place trade with calculated lot size, SL, and TP levels shown on chart.
Let trade run – the indicator manages Break Even & Partial Close if enabled.
9. Recommended Timeframes
Scalping: 1m, 5m, 15m
Day Trading: 15m, 30m, 1H
Swing: 4H, Daily (adjust settings accordingly)

Stop Cascade Detector Stop Cascade Detector (DAFE)
Unlock the Hidden Triggers of Market Momentum!
The Stop Cascade Detector (Bull & Bear, Info Bubble) is a next-generation tool designed for traders who want to see what the crowd can’t: the precise moments when clusters of stop orders are being triggered, unleashing explosive moves in either direction. The reason for this is traders taking there position too early. We on the other hand will take our positions once the less informed traders have been liquidated.
What Makes This Indicator Unique?
Not Just Another Volatility Tool:
This script doesn’t just measure volatility or volume. It detects the chain reactions that occur when price and volume spikes combine to trigger stop-loss clusters—events that often precede the most powerful surges and reversals in any market.
Directional Intelligence:
Unlike generic “spike” detectors, this tool distinguishes between bullish stop cascades (green, above the bar) and bearish stop cascades (red, below the bar), giving you instant clarity on which side of the market is being liquidated.
Visual Precision:
Each event is marked with a color-coded info bubble and a triangle, clearly separated from the price bars for maximum readability. No more guessing where the action is—see it, trade it, and stay ahead.
Universal Application:
Works on any asset, any timeframe, and in any market—futures, stocks, crypto, forex. If there are stops, this indicator will find the cascade.
What makes it work?
Momentum + Volume Spike:
The detector identifies bars where both price momentum and volume are simultaneously extreme (using Z-scores). This combination is a classic signature of stop runs and forced liquidations.
Bull & Bear Detection:
Bull Stop Cascade : Price plunges downward with a volume spike—likely longs getting stopped out.
Bear Stop Cascade: Price surges upward with a volume spike—likely shorts getting stopped out.
Info Bubbles:
Each event is labeled with the exact Z-scores for momentum and volume, so you can gauge the intensity of the cascade at a glance.
What will it do for you?
Front-Run the Crowd:
Most traders react after the move. This tool helps you spot the cause of the move—giving you a tactical edge to fade exhaustion, ride momentum, or avoid getting trapped.
Perfect for Scalpers, Day Traders, and Swing Traders:
Whether you’re looking for high-probability reversals or want to ride the wave, knowing when stops are being triggered is a game-changer.
No More Blind Spots:
Stop cascades are the hidden fuel behind many of the market’s biggest moves. Now you can see them in real time.
How to Use
Red Bubble Above Bar: Bear stop cascade detected—watch for possible trend acceleration or reversal.
Green Bubble Below Bar: Bull stop cascade detected—watch for possible trend acceleration or reversal.
Combine with Your Strategy : Use as a confirmation tool, a reversal signal, or a filter for high-volatility environments. Level up your trading. See the market’s hidden triggers.
Stop Cascade Detector: Because the real edge is knowing what sets the market on fire.
For educational purposes only. Not financial advice. Always use proper risk management.
Use with discipline. Trade your edge.
— Dskyz, for DAFE Trading Systems
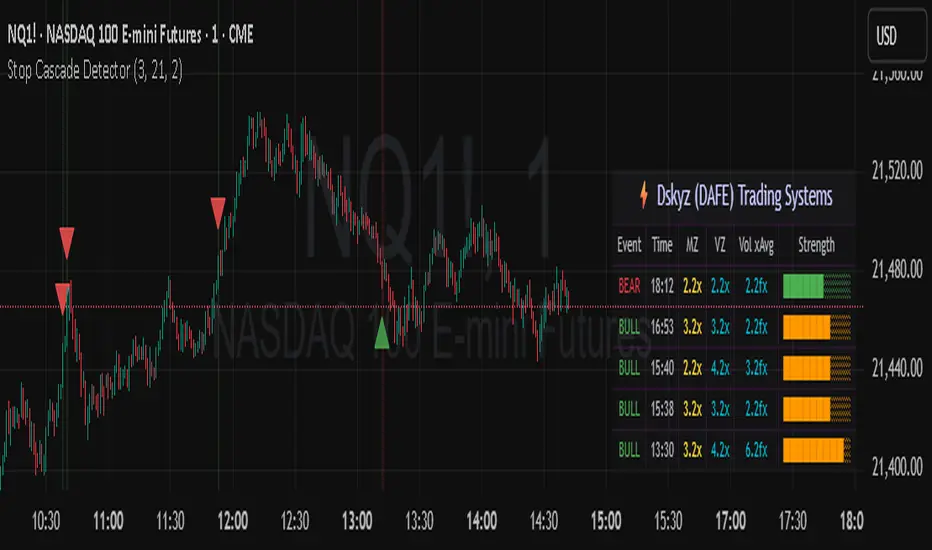
UVR Crypto TrendINDICATOR OVERVIEW: UVR CRYPTO TREND
The UVR Crypto Trend indicator is a custom-built tool designed specifically for cryptocurrency markets, utilizing advanced volatility, momentum, and trend-following techniques. It aims to identify trend reversals and provide buy and sell signals by analyzing multiple factors, such as price volatility(UVR), RSI (Relative Strength Index), CMF (Chaikin Money Flow), and EMA (Exponential Moving Average). The indicator is optimized for CRYPTO MARKETS only.
KEY FEATURES AND HOW IT WORKS
Volatility Analysis with UVR
The UVR (Ultimate Volatility Rate) is a proprietary calculation that measures market volatility by comparing significant price extremes and smoothing the data over time.
Purpose: UVR aims to reduce noise in low-volatility environments and highlight significant movements during higher-volatility periods. While it strives to improve filtering in low-volatility conditions, it does not guarantee perfect performance, making it a balanced and adaptable tool for dynamic markets like cryptocurrency.
HOW UVR (ULTIMATE VOLATILITY RATE) IS CALCULATED
UVR is calculated using a method that ensures precise measurement of market volatility by comparing price extremes across consecutive candles:
Volatility Components:
Two values are calculated to represent potential price fluctuations:
The absolute difference between the current candle's high and the previous candle's low:
Volatility Component 1=∣High−Low ∣
The absolute difference between the previous candle's high and the current candle's low:
Volatility Component 2=∣High −Low∣
Volatility Ratio:
The larger of the two components is selected as the Volatility Ratio, ensuring UVR captures the most significant movement:
Volatility Ratio=max(Volatility Component 1,Volatility Component 2)
Smoothing with SMMA:
To stabilize the volatility calculation, the Volatility Ratio is smoothed using a Smoothed Moving Average (SMMA) over a user-defined period (e.g., 14 candles):
UVR=(UVR(Previous)×(Period−1)+Volatility Ratio)/Period
This calculation ensures UVR adapts dynamically to market conditions, focusing on significant price movements while filtering out noise.
RSI FOR MOMENTUM DETECTION
RSI (Relative Strength Index) identifies overbought and oversold conditions.
Trend Confirmation at the 50 Level
RSI values crossing above 50 signal the potential start of an upward trend.
RSI values crossing below 50 indicate the potential start of a downward trend.
Key Reversals at Extreme Levels
RSI detects trend reversals at overbought (>70) and oversold (<30) levels.
For example:
Overbought Trend Reversal: RSI >70 followed by bearish price action signals a potential downtrend.
Oversold Trend Reversal: RSI <30 with bullish confirmation signals a potential uptrend.
Rare Extreme RSI Readings
Extreme levels, such as RSI <12 (oversold) or RSI >88 (overbought), are used to identify rare yet powerful reversals.
---HOW IT DIFFERS FROM OTHER INDICATORS---
Using UVR High and Low Values
The Ultimate Volatility Rate (UVR) focuses on analyzing the high and low price ranges of the market to measure volatility.
Unlike traditional trend indicators that rely primarily on momentum or moving average crossovers, UVR leverages price extremes to better identify trend reversals.
This approach ensures fewer false signals during low-volatility phases and more accurate trend detection during high-volatility conditions.
UVR as the Core Component
The indicator is fundamentally built around UVR as the primary filter, while supporting tools like RSI (momentum detection), CMF (volume confirmation), and EMA (trend validation) complement its functionality.
By integrating these additional components, the indicator provides a multidimensional analysis rather than relying solely on a single approach.
Dynamic Adaptation to Volatility
UVR dynamically adjusts to market conditions, striving to improve filtering in low-volatility phases. While not flawless, this approach minimizes false signals and adapts more effectively to varying levels of market activity.
Trend Clouds for Visual Guidance
UVR-based dynamic clouds visually mark high and low price areas, highlighting potential consolidation or retracement zones.
These clouds serve as guides for setting stop-loss or take-profit levels, offering clear risk management strategies.
BUY AND SELL SIGNAL LOGIC
BUY CONDITIONS
Momentum-Based Buy-Entry
RSI >50, CMF >0, and the close price is above EMA50.
The price difference between open and close exceeds a threshold based on UVR.
Oversold Reversal
RSI <30 and CMF >0 with a strong bullish candle (close > open and UVR-based sensitivity filter).
Breakout Confirmation
The price breaks above a previously identified resistance, with conditions for RSI and CMF supporting the breakout.
Reversal from Oversold RSI Extreme
RSI <12 on the previous candle with a strong rebound on the current candle with UVR confirmation filter.
SELL CONDITIONS
Momentum-Based Sell-Entry
RSI <50, CMF <0, and the close price is below EMA50.
The price difference between open and close exceeds the UVR threshold.
Overbought Reversal
RSI >70 with bearish price action (open > close and UVR-based sensitivity filter).
Breakdown Confirmation
The price breaks below a previously identified support, with RSI and CMF supporting the breakdown.
Reversal from Overbought RSI Extreme
RSI >88 on the previous candle with a bearish confirmation on the current candle with UVR confirmation filter.
BUY AND SELL SIGNALS VISUALIZATION
The UVR Crypto Trend Indicator visually represents buy and sell conditions using dynamic plots, making it easier for traders to interpret and act on the signals. Below is an explanation of the visual representation:
Buy Signals and Visualization
Signal Trigger:
A buy signal is generated when one of the defined Buy Conditions is met (e.g., RSI >50, CMF >0, price above EMA50).
Visual Representation:
A blue upward arrow appears at the candle where the buy condition is triggered.
A blue cloud forms above the price candles, representing the strength of the bullish trend. The cloud dynamically adapts to market volatility, using the UVR calculation to mark support zones or consolidation levels.
Purpose of the Blue Cloud:
It acts as a visual guide for price movements and stay horizontal when the trend is not moving up
Sell Signals and Visualization
Signal Trigger:
A sell signal is generated when one of the defined Sell Conditions is met (e.g., RSI <50, CMF <0, price below EMA50).
Visual Representation:
A red downward arrow appears at the candle where the sell condition is triggered.
A red cloud forms below the price candles, representing the strength of the bearish trend. Like the blue cloud, it uses the UVR calculation to dynamically mark resistance zones or potential retracement levels.
Purpose of the Red Cloud:
It acts as a visual guide for price movements and stay horizontal when the trend is not moving down.
CONCLUSION
The UVR Crypto Trend indicator provides a powerful tool for trend reversal detection by combining volatility analysis, momentum confirmation, and trend-following techniques. Its unique use of the Ultimate Volatility Rate (UVR) as a core element, supported by proven indicators like RSI, CMF, and EMA, ensures reliable and actionable signals tailored for the crypto market's dynamic nature. By leveraging UVR’s high and low price range analysis, it achieves a level of precision that traditional indicators lack, making it a high-performing system for cryptocurrency traders.

Uptrick: TimeFrame Trends: Performance & Sentiment Indicator### **Uptrick: TimeFrame Trends: Performance & Sentiment Indicator (TFT) - In-Depth Explanation**
#### **Overview**
The **Uptrick: TimeFrame Trends: Performance & Sentiment Indicator (TFT)** is a sophisticated trading tool designed to provide traders with a comprehensive view of market trends across multiple timeframes, combined with a sentiment gauge through the Relative Strength Index (RSI). This indicator offers a unique blend of performance analysis, sentiment evaluation, and visual signal generation, making it an invaluable resource for traders who seek to understand both the macro and micro trends within a financial instrument.
#### **Purpose**
The primary purpose of the TFT indicator is to empower traders with the ability to assess the performance of an asset over various timeframes while simultaneously gauging market sentiment through the RSI. By analyzing price changes over periods ranging from one week to one year, and complementing this with sentiment signals, TFT enables traders to make informed decisions based on a well-rounded analysis of historical price performance and current market conditions.
#### **Key Components and Features**
1. **Multi-Timeframe Performance Analysis:**
- **Performance Lookback Periods:**
- The TFT indicator calculates the percentage price change over several predefined timeframes: 7 days (1 week), 14 days (2 weeks), 30 days (1 month), 180 days (6 months), and 365 days (1 year). These timeframes provide a layered view of how an asset has performed over short, medium, and long-term periods.
- **Percentage Change Calculation:**
- The indicator computes the percentage change for each timeframe by comparing the current closing price to the closing price at the start of each period. This gives traders insight into the strength and direction of the trend over different periods, helping them identify consistent trends or potential reversals.
2. **Sentiment Analysis Using RSI:**
- **Relative Strength Index (RSI):**
- RSI is a widely-used momentum oscillator that measures the speed and change of price movements. It oscillates between 0 and 100 and is typically used to identify overbought or oversold conditions. In TFT, the RSI is calculated using a 14-period lookback, which is standard for most RSI implementations.
- **RSI Smoothing with EMA:**
- To refine the RSI signal and reduce noise, TFT applies a 10-period Exponential Moving Average (EMA) to the RSI values. This smoothed RSI is then used to generate buy, sell, and neutral signals based on its position relative to the 50 level:
- **Buy Signal:** Triggered when the smoothed RSI crosses above 50, indicating bullish sentiment.
- **Sell Signal:** Triggered when the smoothed RSI crosses below 50, indicating bearish sentiment.
- **Neutral Signal:** Triggered when the smoothed RSI equals 50, suggesting indecision or a balanced market.
3. **Visual Signal Generation:**
- **Signal Plots:**
- TFT provides clear visual cues directly on the price chart by plotting shapes at the points where buy, sell, or neutral signals are generated. These shapes are color-coded (green for buy, red for sell, yellow for neutral) and are positioned below or above the price bars for easy identification.
- **First Occurrence Trigger:**
- To avoid clutter and focus on significant market shifts, TFT only triggers the first occurrence of each signal type. This feature helps traders concentrate on the most relevant signals without being overwhelmed by repeated alerts.
4. **Customizable Performance & Sentiment Table:**
- **Table Display:**
- The TFT indicator includes a customizable table that displays the calculated percentage changes for each timeframe. This table is positioned on the chart according to user preference (top-left, top-right, bottom-left, bottom-right) and provides a quick reference to the asset’s performance across multiple periods.
- **Dynamic Text Color:**
- To enhance readability and provide immediate visual feedback, the text color in the table changes based on the direction of the percentage change: green for positive (upward movement) and red for negative (downward movement). This color-coding helps traders quickly assess whether the asset is in an uptrend or downtrend for each period.
- **Customizable Font Size:**
- Traders can adjust the font size of the table to fit their chart layout and personal preferences, ensuring that the information is accessible without being intrusive.
5. **Flexibility and Customization:**
- **Lookback Period Customization:**
- While the default lookback periods are set for common trading intervals (7 days, 14 days, etc.), these can be adjusted to match different trading strategies or market conditions. This flexibility allows traders to tailor the indicator to focus on the timeframes most relevant to their analysis.
- **RSI and EMA Settings:**
- The length of the RSI calculation and the smoothing EMA can also be customized. This is particularly useful for traders who prefer shorter or longer periods for their momentum analysis, allowing them to fine-tune the sensitivity of the indicator.
- **Table Position and Appearance:**
- The table’s position on the chart, along with its font size and colors, is fully customizable. This ensures that the indicator can be integrated seamlessly into any chart setup without obstructing key price data.
#### **Use Cases and Applications**
1. **Trend Identification and Confirmation:**
- **Short-Term Traders:**
- Traders focused on short-term movements can use the 7-day and 14-day performance metrics to identify recent trends and momentum shifts. The RSI signals provide additional confirmation, helping traders enter or exit positions based on the latest market sentiment.
- **Swing Traders:**
- For those holding positions over days to weeks, the 30-day and 180-day performance data are particularly useful. These metrics highlight medium-term trends, and when combined with RSI signals, they provide a robust framework for swing trading strategies.
- **Long-Term Investors:**
- Long-term investors can benefit from the 1-year performance data to gauge the overall health and direction of an asset. The indicator’s ability to track performance across different periods helps in identifying long-term trends and potential reversal points.
2. **Sentiment Analysis and Market Timing:**
- **Market Sentiment Tracking:**
- By using RSI in conjunction with performance metrics, TFT provides a clear picture of market sentiment. Traders can use this information to time their entries and exits more effectively, aligning their trades with periods of strong bullish or bearish sentiment.
- **Avoiding False Signals:**
- The smoothing of RSI helps reduce noise and avoid false signals that are common in volatile markets. This makes the TFT indicator a reliable tool for identifying true market trends and avoiding whipsaws that can lead to losses.
3. **Comprehensive Market Analysis:**
- **Multi-Timeframe Analysis:**
- TFT’s ability to analyze multiple timeframes simultaneously makes it an excellent tool for comprehensive market analysis. Traders can compare short-term and long-term performance to understand the broader market context, making it easier to align their trading strategies with the overall trend.
- **Performance Benchmarking:**
- The percentage change metrics provide a clear benchmark for an asset’s performance over time. This information can be used to compare the asset against broader market indices or other assets, helping traders make more informed decisions about where to allocate their capital.
4. **Custom Strategy Development:**
- **Tailoring to Specific Markets:**
- TFT can be customized to suit different markets, whether it’s stocks, forex, commodities, or cryptocurrencies. For instance, traders in volatile markets may opt for shorter lookback periods and more sensitive RSI settings, while those in stable markets may prefer longer periods for a smoother analysis.
- **Integrating with Other Indicators:**
- TFT can be used alongside other technical indicators to create a more comprehensive trading strategy. For example, combining TFT with moving averages, Bollinger Bands, or MACD can provide additional layers of confirmation and reduce the likelihood of false signals.
#### **Best Practices for Using TFT**
- **Regularly Adjust Lookback Periods:**
- Depending on the market conditions and the asset being traded, it’s important to regularly review and adjust the lookback periods for the performance metrics. This ensures that the indicator remains relevant and responsive to current market trends.
- **Combine with Volume Analysis:**
- While TFT provides a solid foundation for trend and sentiment analysis, combining it with volume indicators can further enhance its effectiveness. Volume can confirm the strength of a trend or signal potential reversals when divergences occur.
- **Use RSI with Other Momentum Indicators:**
- Although RSI is a powerful tool on its own, using it alongside other momentum indicators like Stochastic Oscillator or MACD can provide additional confirmation and help refine entry and exit points.
- **Customize Table Settings for Clarity:**
- Ensure that the performance table is positioned and sized appropriately on the chart. It should be easily readable without obstructing important price data. Adjust the text size and colors as needed to maintain clarity.
- **Monitor Multiple Timeframes:**
- Utilize the multi-timeframe analysis feature of TFT to monitor trends across different periods. This helps in identifying the dominant trend and avoiding trades that go against the broader market direction.
#### **Conclusion**
The **Uptrick: TimeFrame Trends: Performance & Sentiment Indicator (TFT)** is a comprehensive and versatile tool that combines the power of multi-timeframe performance analysis with sentiment gauging through RSI. Its ability to customize and adapt to various trading strategies and markets makes it a valuable asset for traders at all levels. By offering a clear visual representation of trends and market sentiment, TFT empowers traders to make more informed and confident trading decisions, whether they are focusing on short-term price movements or long-term investment opportunities. With its deep integration of performance metrics and sentiment analysis, TFT stands out as a must-have indicator for any trader looking to gain a holistic understanding of market dynamics.

Limit Order + ATR Stop-Loss [TANHEF]This indicator enables interactive placement of limit or stop-limit orders with a trailing ATR stop-loss and optional profit target (with alerts). Refer to the images below for further clarification.
Why use a trailing stop-loss?
A trailing stop-loss serves as an exit strategy when price moves against you, while also allowing you to adjust the exit point further into profit when price moves favorably. The ATR (Average True Range), a reliable measure of volatility, acts as an effective risk management tool, functioning as a trailing stop-loss.
Indicator Explanation
Initial indicator placement: Select Long Limit or Long-Stop Limit order.
Change Entry Type: Switch between Long and Short within settings.
Modify entry price: Drag circle, adjust in settings, or re-add indicator to chart.
Optional Profit Target: Use Risk/Reward ratio or specify price.
Entry anticipation: Estimated ATR stop-loss and profit target as blue circles (fluctuates with volatility changes).
Entry triggered: Actual ATR stop-loss and profit target plotted.
Exit conditions: Stop-loss or profit target hit, exit entry.
Update Frequency: Continuously, Bar Open, or Bar Open on entry then continuously.
ATR Overlap: no entry occurs if the ATR overlaps with price (stop-loss 'hit' already on entry bar)
Table: Displays input settings selected.
Show Only On Ticker: Ability to hide indicator on other tickers.
Long Limit
Long Stop-Limit
Short Limit
Short Stop-Limit
Alerts
1. 'Check' alerts to use within indicator settings (entry, trailing stop hit, profit target hit, and failed entry).
2. Select 'Create Alert'
3. Set the condition to 'Limit Order + ATR Stop-Loss''
4. Select create.
Additional details can be added to the alert message using these words in between Curly (Brace) Brackets:
{{trail}} = ATR trailing stop-loss (price)
{{target}} = Price target (price)
{{type}} = Long or Short stop-loss (word)
{{traildistance}} = Trailing Distance (%)
{{targetdistance}} = Target Distance (%)
{{starttime}} = Start time of position (day:hr:min)
{{maxdrawdown}} = max loss
{{maxprofit}} = max profit
{{update}} = stoploss update frequency
{{entrysource}} = entry as 1st bar source (yes/no)
{{triggerentry}} = Wick/Close Trigger entry input
{{triggerexit}} = Wick/Close Trigger exit input
{{triggertarget}} = Wick/Close Trigger target input
{{atrlength}} = ATR length input
{{atrmultiplier}} = ATR multiplier input
{{atrtype}} = ATR type input
{{ticker}} = Ticker of chart (word)
{{exchange}} = Exchange of chart (word)
{{description}} = Description of ticker (words)
{{close}} = Bar close (price)
{{open}} = Bar open (price)
{{high}} = Bar high (price)
{{low}} = Bar low (price)
{{hl2}} = Bar HL2 (price)
{{volume}} = Bar volume (value)
{{time}} = Current time (day:hr:min)
{{interval}} = Chart timeframe
{{newline}} = New line for text

Smart RSI MTF Matrix [DotGain]Summary
Are you tired of trading trend signals, only to miss the bigger picture because you are focused on a single timeframe?
The Smart RSI MTF Matrix is the ultimate "Cockpit View" for momentum traders. Unlike chart overlays that can sometimes clutter your price action, this indicator organizes RSI conditions across 10 different timeframes simultaneously into a clean, separate Heatmap pane.
It monitors everything from the 5-minute chart all the way up to the 12-Month view , giving you a complete X-ray vision of the market's momentum structure instantly.
⚙️ Core Components and Logic
The Smart RSI MTF Matrix relies on a sophisticated hierarchy to deliver clear, actionable context:
Multi-Timeframe Engine: The script runs 10 independent RSI calculations in the background, organized in rows from bottom (Short Term) to top (Long Term).
Classic RSI Thresholds:
Overbought (> 70): Indicates price may be extended to the upside.
Oversold (< 30): Indicates price may be extended to the downside.
Smart Visibility System (The "Secret Sauce"): Not all signals are equal. A 5-minute signal is "noise" compared to a Yearly signal. This indicator automatically applies Transparency to differentiate importance. The visibility increases by 10% for each higher timeframe slot (Row).
🚦 How to Read the Matrix
The indicator plots dots in 10 stacked rows. The position and opacity tell you the direction and significance:
🟥 RED DOTS (Overbought Condition)
Trigger: RSI is above 70 on that specific timeframe.
Meaning: Potential bearish reversal or pullback.
🟩 GREEN DOTS (Oversold Condition)
Trigger: RSI is below 30 on that specific timeframe.
Meaning: Potential bullish reversal or bounce.
⚪ GRAY DOTS (Neutral)
Trigger: RSI is between 30 and 70.
Meaning: No extreme momentum present.
👻 TRANSPARENCY (Signal Strength)
The visibility of the dot tells you exactly which Timeframe (Row) is triggered. The higher the row, the more solid the color:
Faint (10-30% Visibility): Rows 1-3 (5m, 15m, 1h). Used for scalping entries.
Medium (40-60% Visibility): Rows 4-6 (4h, 1D, 1W). Used for swing trading context.
Solid (70-100% Visibility): Rows 7-10 (1M, 3M, 6M, 12M). Used for identifying major macro cycles.
Visual Elements
Structure: Row 1 (Bottom) represents the 5-minute timeframe. Row 10 (Top) represents the 12-Month timeframe.
Vertical Alignment: If you see a vertical column of Red or Green dots, it indicates Multi-Timeframe Confluence —a highly probable reversal point.
Key Benefit
The goal of the Smart RSI MTF Matrix is to keep your main chart clean while providing maximum information. You can instantly see if a short-term pullback (Faint Green Dot) is happening within a long-term uptrend (Solid Gray/Red Dot), allowing for precision entries.
Have fun :)
Disclaimer
This "Smart RSI MTF Matrix" indicator is provided for informational and educational purposes only. It does not, and should not be construed as, financial, investment, or trading advice.
The signals generated by this tool (both "Buy" and "Sell" indications) are the result of a specific set of algorithmic conditions. They are not a direct recommendation to buy or sell any asset. All trading and investing in financial markets involves substantial risk of loss. You can lose all of your invested capital.
Past performance is not indicative of future results. The signals generated may produce false or losing trades. The creator (© DotGain) assumes no liability for any financial losses or damages you may incur as a result of using this indicator.
You are solely responsible for your own trading and investment decisions. Always conduct your own research (DYOR) and consider your personal risk tolerance before making any trades.

J12Matic Builder by galgoomA flexible Renko/tick strategy that lets you choose between two entry engines (Multi-Source 3-way or QBand+Moneyball), with a unified trailing/TP exit engine, NY-time trading windows with auto-flatten, daily profit/loss and trade-count limits (HALT mode), and clean webhook routing using {{strategy.order.alert_message}}.
Highlights
Two entry engines
Multi-Source (3): up to three long/short sources with Single / Dual / Triple logic and optional lookback.
QBand + Moneyball: Gate → Trigger workflow with timing windows, OR/AND trigger modes, per-window caps, optional same-bar fire.
Unified exit engine: Trailing by Bricks or Ticks, plus optional static TP/SL.
Session control (NY time): Evening / Overnight / NY Session windows; auto-flatten at end of any enabled window.
Day controls: Profit/Loss (USD) and Trade-count limits. When hit, strategy HALTS new entries, shows an on-chart label/background.
Alert routing designed for webhooks: Every order sets alert_message= so you can run alerts with:
Condition: this strategy
Notify on: Order fills only
Message: {{strategy.order.alert_message}}
Default JSONs or Custom payloads: If a Custom field is blank, a sensible default JSON is sent. Fill a field to override.
How to set up alerts (the 15-second version)
Create a TradingView alert with this strategy as Condition.
Notify on: Order fills only.
Message: {{strategy.order.alert_message}} (exactly).
If you want your own payloads, paste them into Inputs → 08) Custom Alert Payloads.
Leave blank → the strategy sends a default JSON.
Fill in → your text is sent as-is.
Note: Anything you type into the alert dialog’s Message box is ignored except the {{strategy.order.alert_message}} token, which forwards the payload supplied by the strategy at order time.
Publishing notes / best practices
Renko users: Make sure “Renko Brick Size” in Inputs matches your chart’s brick size exactly.
Ticks vs Bricks: Exit distances switch instantly when you toggle Exit Units.
Same-bar flips: If enabled, a new opposite signal will first close the open trade (with its exit payload), then enter the new side.
HALT mode: When day profit/loss limit or trade-count limit triggers, new entries are blocked for the rest of the session day. You’ll see a label and a soft background tint.
Session end flatten: Auto-closes positions at window ends; these exits use the “End of Session Window Exit” payload.
Bar magnifier: Strategy is configured for on-close execution; you can enable Bar Magnifier in Properties if needed.
Default JSONs (used when a Custom field is empty)
Open: {"event":"open","side":"long|short","symbol":""}
Close: {"event":"close","side":"long|short|flat","reason":"tp|sl|flip|session|limit_profit|limit_loss","symbol":""}
You can paste any text/JSON into the Custom fields; it will be forwarded as-is when that event occurs.
Input sections — user guide
01) Entries & Signals
Entry Logic: Choose Multi-Source (3) or QBand + Moneyball (pick one).
Enable Long/Short Signals: Master on/off switches for entering long/short.
Flip on opposite signal: If enabled, a new opposite signal will close the current position first, then open the other side.
Signal Logic (Multi-Source):
Single: any 1 of the 3 sources > 0
Dual: Source1 AND Source2 > 0
Triple (default): 1 AND 2 AND 3 > 0
Long/Short Signal Sources 1–3: Provide up to three series (often indicators). A positive value (> 0) is treated as a “pulse”.
Use Lookback: Keeps a source “true” for N bars after it pulses (helps catch late triggers).
Long/Short Lookback (bars): How many bars to remember that pulse.
01b) QBands + Moneyball (Gate -> Trigger)
Allow same-bar Gate->Trigger: If ON, a trigger can fire on the same bar as the gate pulse.
Trigger must fire within N bars after Gate: Size of the gate window (in bars).
Max signals per window (0 = unlimited): Cap the number of entries allowed while a gate window is open.
Buy/Sell Source 1 – Gate: Gate pulse sources that open the buy/sell window (often a regime/zone, e.g., QBands bull/bear).
Trigger Pulse Mode (Buy/Sell): How to detect a trigger pulse from the trigger sources (Change / Appear / Rise>0 / Fall<0).
Trigger A/B sources + Extend Bars: Primary/secondary triggers plus optional extension to persist their pulse for N bars.
Trigger Mode: Pick S2 only, S3 only, S2 OR S3, or S2 AND S3. AND mode remembers both pulses inside the window before firing.
02) Exit Units (Trailing/TP)
Exit Units: Choose Bricks (Renko) or Ticks. All distances below switch accordingly.
03) Tick-based Trailing / Stops (active when Exit Units = Ticks)
Initial SL (ticks): Starting stop distance from entry.
Start Trailing After (ticks): Start trailing once price moves this far in your favor.
Trailing Distance (ticks): Offset of the trailing stop from peak/trough once trailing begins.
Take Profit (ticks): Optional static TP distance.
Stop Loss (ticks): Optional static SL distance (overrides trailing if enabled).
04) Brick-based Trailing / Stops (active when Exit Units = Bricks)
Renko Brick Size: Must match your chart’s brick size.
Initial SL / Start Trailing After / Trailing Distance (bricks): Same definitions as tick mode, measured in bricks.
Take Profit / Stop Loss (bricks): Optional static distances.
05) TP / SL Switch
Enable Static Take Profit: If ON, closes the trade at the fixed TP distance.
Enable Static Stop Loss (Overrides Trailing): If ON, trailing is disabled and a fixed SL is used.
06) Trading Windows (NY time)
Use Trading Windows: Master toggle for all windows.
Evening / Overnight / NY Session: Define each session in NY time.
Flatten at End of : Auto-close any open position when a window ends (sends the Session Exit payload).
07) Day Controls & Limits
Enable Profit Limits / Profit Limit (Dollars): When daily net PnL ≥ limit → auto-flatten and HALT.
Enable Loss Limits / Loss Limit (Dollars): When daily net PnL ≤ −limit → auto-flatten and HALT.
Enable Trade Count Limits / Number of Trades Allowed: After N entries, HALT new entries (does not auto-flatten).
On-chart HUD: A label and soft background tint appear when HALTED; a compact status table shows Day PnL, trade count, and mode.
08) Custom Alert Payloads (used as strategy.order.alert_message)
Long/Short Entry: Payload sent on entries (if blank, a default open JSON is sent).
Regular Long/Short Exit: Payload sent on closes from SL/TP/flip (if blank, a default close JSON is sent).
End of Session Window Exit: Payload sent when any enabled window ends and positions are flattened.
Profit/Loss/Trade Limit Close: Payload sent when daily profit/loss limit causes auto-flatten.
Tip: Any tokens you include here are forwarded “as is”. If your downstream expects variables, do the substitution on the receiver side.
Known limitations
No bracket orders from Pine: This strategy doesn’t create OCO/attached brackets on the broker; it simulates exits with strategy logic and forwards your payloads for external automation.
alert_message is per order only: Alerts fire on order events. General status pings aren’t sent unless you wire a separate indicator/alert.
Renko specifics: Backtests on synthetic Renko can differ from live execution. Always forward-test on your instrument and settings.
Quick checklist before you publish
✅ Brick size in Inputs matches your Renko chart
✅ Exit Units set to Bricks or Ticks as you intend
✅ Day limits/Windows toggled as you want
✅ Custom payloads filled (or leave blank to use defaults)
✅ Your alert uses Order fills only + {{strategy.order.alert_message}}

Whaley Thrust — ADT / UDT / SPT (2010) + EDT (EMA) + Info BoxDescription
Implements Wayne Whaley’s 2010 Dow Award breadth-thrust framework on daily data, with a practical extension:
• ADT (Advances Thrust) — 5-day ratio of advances to (adv+dec). Triggers: > 73.66% (thrust), < 19.05% (capitulation).
• UDT (Up-Volume Thrust) — 5-day ratio of up-volume to (up+down). Triggers: > 77.88%, < 16.41%. Defaults to USI:UVOL / USI:DVOL (edit if your feed differs).
• SPT (Price Thrust) — 5-day % change of a benchmark (default SPY, toggle to use chart symbol). Triggers: > +10.05%, < −13.85%.
• EDT (EMA extension) — Declines-share thrust derived from WBT logic (not in Whaley’s paper): EMA/SMA of Declines / (Adv+Decl). Triggers: > 0.8095 (declines thrust), < 0.2634 (declines abating).
• All-Clear — Prints when ADT+ and UDT+ occur within N days (default 10); marks the second event and shades brighter green.
Visuals & Controls
• Shape markers for each event; toggle text labels on/off.
• Optional background shading (green for thrusts, red for capitulations; brighter green for All-Clear).
• Compact info box showing live ADT / UDT / SPT (white by default; turns green/red at thresholds).
• Min-spacing filter to prevent duplicate prints.
Tips
• Use on Daily charts (paper uses 5 trading days). Weekly views can miss mid-week crosses.
• If UDT shows 100%, verify your Down Volume symbol; the script requires both UVOL and DVOL to be > 0.
• Best use: treat capitulations (−) as setup context; act on thrusts (+)—especially when ADT+ & UDT+ cluster (All-Clear).
Credit
Core method from Wayne Whaley (2010), Planes, Trains and Automobiles (Dow Award). EDT is an added, complementary interpretation using WBT-style smoothing.

Multi-indicator Signal Builder [Skyrexio]Overview
Multi-Indicator Signal Builder is a versatile, all-in-one script designed to streamline your trading workflow by combining multiple popular technical indicators under a single roof. It features a single-entry, single-exit logic, intrabar stop-loss/take-profit handling, an optional time filter, a visually accessible condition table, and a built-in statistics label. Traders can choose any combination of 12+ indicators (RSI, Ultimate Oscillator, Bollinger %B, Moving Averages, ADX, Stochastic, MACD, PSAR, MFI, CCI, Heikin Ashi, and a “TV Screener” placeholder) to form entry or exit conditions. This script aims to simplify strategy creation and analysis, making it a powerful toolkit for technical traders.
Indicators Overview
1. RSI (Relative Strength Index)
Measures recent price changes to evaluate overbought or oversold conditions on a 0–100 scale.
2. Ultimate Oscillator (UO)
Uses weighted averages of three different timeframes, aiming to confirm price momentum while avoiding false divergences.
3. Bollinger %B
Expresses price relative to Bollinger Bands, indicating whether price is near the upper band (overbought) or lower band (oversold).
4. Moving Average (MA)
Smooths price data over a specified period. The script supports both SMA and EMA to help identify trend direction and potential crossovers.
5. ADX (Average Directional Index)
Gauges the strength of a trend (0–100). Higher ADX signals stronger momentum, while lower ADX indicates a weaker trend.
6. Stochastic
Compares a closing price to a price range over a given period to identify momentum shifts and potential reversals.
7. MACD (Moving Average Convergence/Divergence)
Tracks the difference between two EMAs plus a signal line, commonly used to spot momentum flips through crossovers.
8. PSAR (Parabolic SAR)
Plots a trailing stop-and-reverse dot that moves with the trend. Often used to signal potential reversals when price crosses PSAR.
9. MFI (Money Flow Index)
Similar to RSI but incorporates volume data. A reading above 80 can suggest overbought conditions, while below 20 may indicate oversold.
10. CCI (Commodity Channel Index)
Identifies cyclical trends or overbought/oversold levels by comparing current price to an average price over a set timeframe.
11. Heikin Ashi
A type of candlestick charting that filters out market noise. The script uses a streak-based approach (multiple consecutive bullish or bearish bars) to gauge mini-trends.
12. TV Screener
A placeholder condition designed to integrate external buy/sell logic (like a TradingView “Buy” or “Sell” rating). Users can override or reference external signals if desired.
Unique Features
1. Multi-Indicator Entry and Exit
You can selectively enable any subset of 12+ classic indicators, each with customizable parameters and conditions. A position opens only if all enabled entry conditions are met, and it closes only when all enabled exit conditions are satisfied, helping reduce false triggers.
2. Single-Entry / Single-Exit with Intrabar SL/TP
The script supports a single position at a time. Once a position is open, it monitors intrabar to see if the price hits your stop-loss or take-profit levels before the bar closes, making results more realistic for fast-moving markets.
3. Time Window Filter
Users may specify a start/end date range during which trades are allowed, making it convenient to focus on specific market cycles for backtesting or live trading.
4. Condition Table and Statistics
A table at the bottom of the chart lists all active entry/exit indicators. Upon each closed trade, an integrated statistics label displays net profit, total trades, win/loss count, average and median PnL, etc.
5. Seamless Alerts and Automation
Configure alerts in TradingView using “Any alert() function call.”
The script sends JSON alert messages you can route to your own webhook.
The indicator can be integrated with Skyrexio alert bots to automate execution on major cryptocurrency exchanges
6. Optional MA/PSAR Plots
For added visual clarity, optionally plot the chosen moving averages or PSAR on the chart to confirm signals without stacking multiple indicators.
Methodology
1. Multi-Indicator Entry Logic
When multiple entry indicators are enabled (e.g., RSI + Stochastic + MACD), the script requires all signals to align before generating an entry. Each indicator can be set for crossovers, crossunders, thresholds (above/below), etc. This “AND” logic aims to filter out low-confidence triggers.
2. Single-Entry Intrabar SL/TP
One Position At a Time: Once an entry signal triggers, a trade opens at the bar’s close.
Intrabar Checks: Stop-loss and take-profit levels (if enabled) are monitored on every tick. If either is reached, the position closes immediately, without waiting for the bar to end.
3. Exit Logic
All Conditions Must Agree: If the trade is still open (SL/TP not triggered), then all enabled exit indicators must confirm a closure before the script exits on the bar’s close.
4. Time Filter
Optional Trading Window: You can activate a date/time range to constrain entries and exits strictly to that interval.
Justification of Methodology
Indicator Confluence: Combining multiple tools (RSI, MACD, etc.) can reduce noise and false signals.
Intrabar SL/TP: Capturing real-time spikes or dips provides a more precise reflection of typical live trading scenarios.
Single-Entry Model: Straightforward for both manual and automated tracking (especially important in bridging to bots).
Custom Date Range: Helps refine backtesting for specific market conditions or to avoid known irregular data periods.
How to Use
1. Add the Script to Your Chart
In TradingView, open Indicators , search for “Multi-indicator Signal Builder”.
Click to add it to your chart.
2. Configure Inputs
Time Filter: Set a start and end date for trades.
Alerts Messages: Input any JSON or text payload needed by your external service or bot.
Entry Conditions: Enable and configure any indicators (e.g., RSI, MACD) for a confluence-based entry.
Close Conditions: Enable exit indicators, along with optional SL (negative %) and TP (positive %) levels.
3. Set Up Alerts
In TradingView, select “Create Alert” → Condition = “Any alert() function call” → choose this script.
Entry Alert: Triggers on the script’s entry signal.
Close Alert: Triggers on the script’s close signal (or if SL/TP is hit).
Skyrexio Alert Bots: You can route these alerts via webhook to Skyrexio alert bots to automate order execution on major crypto exchanges (or any other supported broker).
4. Visual Reference
A condition table at the bottom summarizes active signals.
Statistics Label updates automatically as trades are closed, showing PnL stats and distribution metrics.
Backtesting Guidelines
Symbol/Timeframe: Works on multiple assets and timeframes; always do thorough testing.
Realistic Costs: Adjust commissions and potential slippage to match typical exchange conditions.
Risk Management: If using the built-in stop-loss/take-profit, set percentages that reflect your personal risk tolerance.
Longer Test Horizons: Verify performance across diverse market cycles to gauge reliability.
Example of statistic calculation
Test Period: 2023-01-01 to 2025-12-31
Initial Capital: $1,000
Commission: 0.1%, Slippage ~5 ticks
Trade Count: 468 (varies by strategy conditions)
Win rate: 76% (varies by strategy conditions)
Net Profit: +96.17% (varies by strategy conditions)
Disclaimer
This indicator is provided strictly for informational and educational purposes .
It does not constitute financial or trading advice.
Past performance never guarantees future results.
Always test thoroughly in demo environments before using real capital.
Enjoy exploring the Multi-Indicator Signal Builder! Experiment with different indicator combinations and adjust parameters to align with your trading preferences, whether you trade manually or link your alerts to external automation services. Happy trading and stay safe!

time_libraryLibrary "time_library"
This library provides utilities for working with time intervals in milliseconds, seconds, minutes, hours, days, and weeks. It includes functions to handle conditions based on time rather than bars.
ms(TIME)
ms - Converts a time period in string format to milliseconds.
Parameters:
TIME (string) : (series ) - The time period ("ms", "s", "m", "h", "d", "w").
Returns: (int) - The corresponding time period in milliseconds.
true_in(timestamp, period, multiplier)
true_in - Checks if the current time has reached a specific time after the given timestamp.
Parameters:
timestamp (int) : (series ) - The starting timestamp.
period (string) : (series |series ) - The period in string format ("ms", "s", "m", "h", "d", "w"), or as an integer in milliseconds.
multiplier (float) : (series ) - Multiplier to extend the period.
Returns: (bool) - True if current time is equal or past the end date calculated from timestamp and period.
true_in(timestamp, period, multiplier)
true_in - Checks if the current time has reached a specific time after the given timestamp.
Parameters:
timestamp (int) : (series ) - The starting timestamp.
period (int) : (series |series ) - The period in string format ("ms", "s", "m", "h", "d", "w"), or as an integer in milliseconds.
multiplier (float) : (series ) - Multiplier to extend the period.
Returns: (bool) - True if current time is equal or past the end date calculated from timestamp and period.
true_after(trigger, period, multiplier)
true_after - Returns true after a specified period multiplied by a multiplier has passed since a trigger was last true.
Parameters:
trigger (bool) : (series ) - The condition that triggers the timer.
period (string) : (series |series ) - The period in string format ("ms", "s", "m", "h", "d", "w"), or as an integer in milliseconds.
multiplier (float) : (series ) - Multiplier to extend the period.
Returns: (bool) - True if the specified time has passed since the last trigger.
true_after(trigger, ms, multiplier)
true_after - Returns true after a specified period multiplied by a multiplier has passed since a trigger was last true.
Parameters:
trigger (bool) : (series ) - The condition that triggers the timer.
ms (int)
multiplier (float) : (series ) - Multiplier to extend the period.
Returns: (bool) - True if the specified time has passed since the last trigger.
MS
MS - Holds common time intervals in milliseconds.
Fields:
ms (series int) : (int) - Milliseconds.
s (series int) : (int) - Seconds converted to milliseconds.
m (series int) : (int) - Minutes converted to milliseconds.
h (series int) : (int) - Hours converted to milliseconds.
d (series int) : (int) - Days converted to milliseconds.
w (series int) : (int) - Weeks converted to milliseconds.
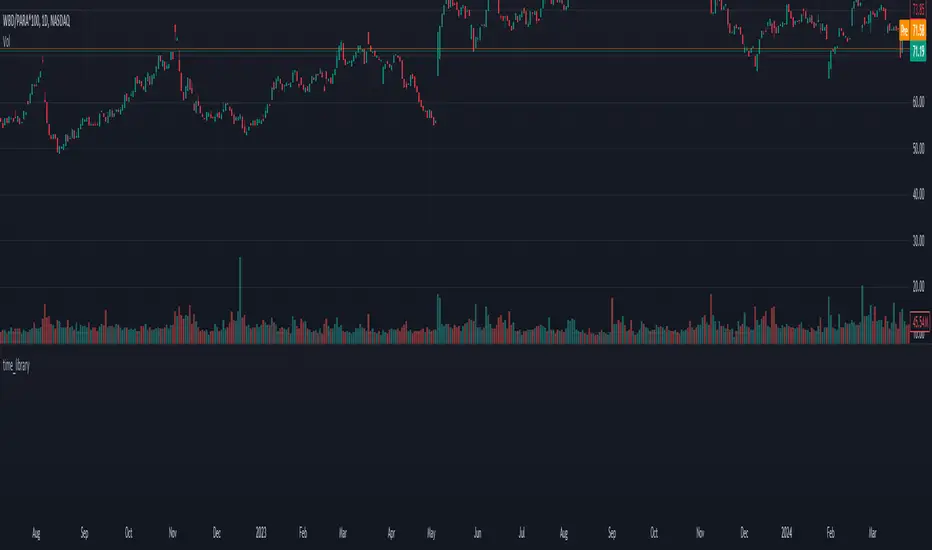
Rainbow Drift BetaRainbow Drift Beta is an indicator that detects the triggers of long and short positions at any TF.
It's based on two different type of approaches to the EMAs periods:
- Classic EMAs periods: 10 and 50
- Cycle EMAs perdios: 16, 64 and 256
The 256 period EMA (Annual Cycle) detects the trend: if the EMA 64 (Three-Weekly Cycle) is above, it shows an uptrend; while the EMA 64 is below, it means that the price action is in downtrend.
10 and 16 periods EMAs are working together as well as the 50 and the 64. The first couple reacts faster than the second one and as soon as the 10 is above the 16, the band shows the first attempt of the price action to go in the uptrend direction. The same concept is applied to the second couple (50, 64): when EMA 50 > EMA 64 it's a confirmation of the faster EMAs long direction. Viceverca happens for the downtrend but with the same concept.
As the EMA periods taken in consideration are quite often a sensitive level of reaction of the price, the indicator detects when there is trigger of a long or a short set up and plots a label on the chart. It's possibile to set up an alert as well.
Quite important, the indicator is looking for sideways patterns as the breakout of them shows a clear direction of the price.
Moreover, in order to privide the first and the best entry possibile, the indicator has a function that is triggering only one time as the trend reverted: for example, a long entry on the EMA 10-16 happens only one time since they crossover the EMA 64.
As included in the name, this is a beta version and new improvements will be added in the near future like suggested price entry, SL and TP, and the focus of the development is to avoid as much as possibile the false triggers.
Of course the best way to improve the code is to receive the users' feedbacks, so please feel free to post your comments and questions.

Third eye • StrategyThird eye • Strategy – User Guide
1. Idea & Concept
Third eye • Strategy combines three things into one system:
Ichimoku Cloud – to define market regime and support/resistance.
Moving Average (trend filter) – to trade only in the dominant direction.
CCI (Commodity Channel Index) – to generate precise entry signals on momentum breakouts.
The script is a strategy, not an indicator: it can backtest entries, exits, SL, TP and BreakEven logic automatically.
2. Indicators Used
2.1 Ichimoku
Standard Ichimoku settings (by default 9/26/52/26) are used:
Conversion Line (Tenkan-sen)
Base Line (Kijun-sen)
Leading Span A & B (Kumo Cloud)
Lagging Span is calculated but hidden from the chart (for visual simplicity).
From the cloud we derive:
kumoTop – top of the cloud under current price.
kumoBottom – bottom of the cloud under current price.
Flags:
is_above_kumo – price above the cloud.
is_below_kumo – price below the cloud.
is_in_kumo – price inside the cloud.
These conditions are used as trend / regime filters and for stop-loss & trailing stops.
2.2 Moving Average
You can optionally display and use a trend MA:
Types: SMA, EMA, DEMA, WMA
Length: configurable (default 200)
Source: default close
Filter idea:
If MA Direction Filter is ON:
When Close > MA → strategy allows only Long signals.
When Close < MA → strategy allows only Short signals.
The MA is plotted on the chart (if enabled).
2.3 CCI & Panel
The CCI (Commodity Channel Index) is used for entry timing:
CCI length and source are configurable (default length 20, source hlc3).
Two thresholds:
CCI Upper Threshold (Long) – default +100
CCI Lower Threshold (Short) – default –100
Signals:
Long signal:
CCI crosses up through the upper threshold
cci_val < upper_threshold and cci_val > upper_threshold
Short signal:
CCI crosses down through the lower threshold
cci_val > lower_threshold and cci_val < lower_threshold
There is a panel (table) in the bottom-right corner:
Shows current CCI value.
Shows filter status as colored dots:
Green = filter enabled and passed.
Red = filter enabled and blocking trades.
Gray = filter is disabled.
Filters shown in the panel:
Ichimoku Cloud filter (Long/Short)
Ichimoku Lines filter (Conversion/Base vs Cloud)
MA Direction filter
3. Filters & Trade Direction
All filters can be turned ON/OFF independently.
3.1 Ichimoku Cloud Filter
Purpose: trade only when price is clearly above or below the Kumo.
Long Cloud Filter (Use Ichimoku Cloud Filter) – when enabled:
Long trades only if close > cloud top.
Short Cloud Filter – when enabled:
Short trades only if close < cloud bottom.
If the cloud filter is disabled, this condition is ignored.
3.2 Ichimoku Lines Above/Below Cloud
Purpose: stronger trend confirmation: Ichimoku lines should also be on the “correct” side of the cloud.
Long Lines Filter:
Long allowed only if Conversion Line and Base Line are both above the cloud.
Short Lines Filter:
Short allowed only if both lines are below the cloud.
If this filter is OFF, the conditions are not checked.
3.3 MA Direction Filter
As described above:
When ON:
Close > MA → only Longs.
Close < MA → only Shorts.
4. Anti-Re-Entry Logic (Cloud Touch Reset)
The strategy uses internal flags to avoid continuous re-entries in the same direction without a reset.
Two flags:
allowLong
allowShort
After a Long entry, allowLong is set to false, allowShort to true.
After a Short entry, allowShort is set to false, allowLong to true.
Flags are reset when price touches the Kumo:
If Low goes into the cloud → allowLong = true
If High goes into the cloud → allowShort = true
If Close is inside the cloud → both allowLong and allowShort are set to true
There is a key option:
Wait Position Close Before Flag Reset
If ON: cloud touch will reset flags only when there is no open position.
If OFF: flags can be reset even while a trade is open.
This gives a kind of regime-based re-entry control: after a trend leg, you wait for a “cloud interaction” to allow new signals.
5. Risk Management
All risk management is handled inside the strategy.
5.1 Position Sizing
Order Size % of Equity – default 10%
The strategy calculates:
position_value = equity * (Order Size % / 100)
position_qty = position_value / close
So position size automatically adapts to your current equity.
5.2 Take Profit Modes
You can choose one of two TP modes:
Percent
Fibonacci
5.2.1 Percent Mode
Single Take Profit at X% from entry (default 2%).
For Long:
TP = entry_price * (1 + tp_pct / 100)
For Short:
TP = entry_price * (1 - tp_pct / 100)
One strategy.exit per side is used: "Long TP/SL" and "Short TP/SL".
5.2.2 Fibonacci Mode (2 partial TPs)
In this mode, TP levels are based on a virtual Fib-style extension between entry and stop-loss.
Inputs:
Fib TP1 Level (default 1.618)
Fib TP2 Level (default 2.5)
TP1 Share % (Fib) (default 50%)
TP2 share is automatically 100% - TP1 share.
Process for Long:
Compute a reference Stop (see SL section below) → sl_for_fib.
Compute distance: dist = entry_price - sl_for_fib.
TP levels:
TP1 = entry_price + dist * (Fib TP1 Level - 1)
TP2 = entry_price + dist * (Fib TP2 Level - 1)
For Short, the logic is mirrored.
Two exits are used:
TP1 – closes TP1 share % of position.
TP2 – closes remaining TP2 share %.
Same stop is used for both partial exits.
5.3 Stop-Loss Modes
You can choose one of three Stop Loss modes:
Stable – fixed % from entry.
Ichimoku – fixed level derived from the Kumo.
Ichimoku Trailing – dynamic SL following the cloud.
5.3.1 Stable SL
For Long:
SL = entry_price * (1 - Stable SL % / 100)
For Short:
SL = entry_price * (1 + Stable SL % / 100)
Used both for Percent TP mode and as reference for Fib TP if Kumo is not available.
5.3.2 Ichimoku SL (fixed, non-trailing)
At the time of a new trade:
For Long:
Base SL = cloud bottom minus small offset (%)
For Short:
Base SL = cloud top plus small offset (%)
The offset is configurable: Ichimoku SL Offset %.
Once computed, that SL level is fixed for this trade.
5.3.3 Ichimoku Trailing SL
Similar to Ichimoku SL, but recomputed each bar:
For Long:
SL = cloud bottom – offset
For Short:
SL = cloud top + offset
A red trailing SL line is drawn on the chart to visualize current stop level.
This trailing SL is also used as reference for BreakEven and for Fib TP distance.
6. BreakEven Logic (with BE Lines)
BreakEven is optional and supports two modes:
Percent
Fibonacci
Inputs:
Percent mode:
BE Trigger % (from entry) – move SL to BE when price goes this % in profit.
BE Offset % from entry – SL will be set to entry ± this offset.
Fibonacci mode:
BE Fib Level – Fib level at which BE will be activated (default 1.618, same style as TP).
BE Offset % from entry – how far from entry to place BE stop.
The logic:
Before BE is triggered, SL follows its normal mode (Stable/Ichimoku/Ichimoku Trailing).
When BE triggers:
For Long:
New SL = max(current SL, BE SL).
For Short:
New SL = min(current SL, BE SL).
This means BE will never loosen the stop – only tighten it.
When BE is activated, the strategy draws a violet horizontal line at the BreakEven level (once per trade).
BE state is cleared when the position is closed or when a new position is opened.
7. Entry & Exit Logic (Summary)
7.1 Long Entry
Conditions for a Long:
CCI signal:
CCI crosses up through the upper threshold.
Ichimoku Cloud Filter (optional):
If enabled → price must be above the Kumo.
Ichimoku Lines Filter (optional):
If enabled → Conversion Line and Base Line must be above the Kumo.
MA Direction Filter (optional):
If enabled → Close must be above the chosen MA.
Anti-re-entry flag:
allowLong must be true (cloud-based reset).
Position check:
Long entries are allowed when current position size ≤ 0 (so it can also reverse from short to long).
If all these conditions are true, the strategy sends:
strategy.entry("Long", strategy.long, qty = calculated_qty)
After entry:
allowLong = false
allowShort = true
7.2 Short Entry
Same structure, mirrored:
CCI signal:
CCI crosses down through the lower threshold.
Cloud filter: price must be below cloud (if enabled).
Lines filter: conversion & base must be below cloud (if enabled).
MA filter: Close must be below MA (if enabled).
allowShort must be true.
Position check: position size ≥ 0 (allows reversal from long to short).
Then:
strategy.entry("Short", strategy.short, qty = calculated_qty)
Flags update:
allowShort = false
allowLong = true
7.3 Exits
While in a position:
The strategy continuously recalculates SL (depending on chosen mode) and, in Percent mode, TP.
In Fib mode, fixed TP levels are computed at entry.
BreakEven may raise/tighten the SL if its conditions are met.
Exits are executed via strategy.exit:
Percent mode: one TP+SL exit per side.
Fib mode: two partial exits (TP1 and TP2) sharing the same SL.
At position open, the script also draws visual lines:
White line — entry price.
Green line(s) — TP level(s).
Red line — SL (if not using Ichimoku Trailing; with trailing, the red line is updated dynamically).
Maximum of 30 lines are kept to avoid clutter.
8. How to Use the Strategy
Choose market & timeframe
Works well on trending instruments. Try crypto, FX or indices on H1–H4, or intraday if you prefer more trades.
Adjust Ichimoku settings
Keep defaults (9/26/52/26) or adapt to your timeframe.
Configure Moving Average
Typical: EMA 200 as a trend filter.
Turn MA Direction Filter ON if you want to trade only with the main trend.
Set CCI thresholds
Default ±100 is classic.
Lower thresholds → more signals, higher noise.
Higher thresholds → fewer but stronger signals.
Enable/disable filters
Turn on Ichimoku Cloud and Ichimoku Lines if you want only “clean” trend trades.
Use Wait Position Close Before Flag Reset to control how often re-entries are allowed.
Choose TP & SL mode
Percent mode is simpler and easier to understand.
Fibonacci mode is more advanced: it aligns TP levels with the distance to stop, giving asymmetric RR setups (two partial TPs).
Choose Stable SL for fixed-risk trades, or Ichimoku / Ichimoku Trailing to tie stops to the cloud structure.
Set BreakEven
Enable BE if you want to lock in risk-free trades after a certain move.
Percent mode is straightforward; Fib mode keeps BreakEven in harmony with your Fib TP setup.
Run Backtest & Optimize
Press “Add to chart” → go to Strategy Tester.
Adjust parameters to your market and timeframe.
Look at equity curve, PF, drawdown, average trade, etc.
Live / Paper Trading
After you’re satisfied with backtest results, use the strategy to generate signals.
You can mirror entries/exits manually or connect them to alerts (if you build an alert-based execution layer).
