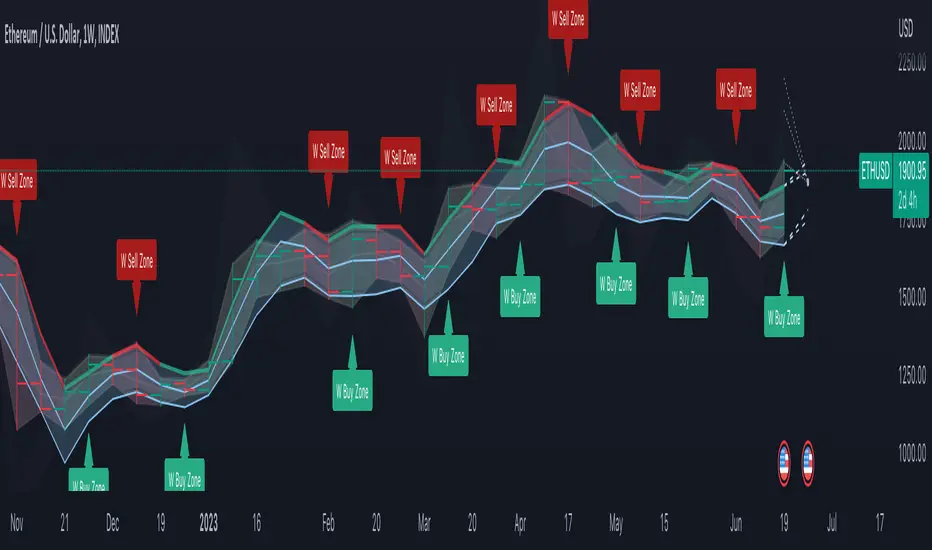
Support, Resistance & Liquidity Pool ZonesSupport, Resistance & Liquidity Pool Zones
This indicator automatically detects and plots support and resistance levels based on pivot points and highlights liquidity pool zones, areas where the trading volume exceeds the average over a set number of bars. It is designed to help traders identify key price levels and liquidity traps that can trigger significant market reactions.
Key Features:
Support & Resistance Levels:
The indicator identifies pivot highs and pivot lows as potential resistance and support levels, respectively.
You can customize the number of levels shown on the chart, making it easier to focus on the most recent and relevant price levels.
Liquidity Pool Zones:
The script detects liquidity pool zones, which are areas with above-average trading volume. These zones often act as regions of interest where price accumulation or distribution occurs, potentially leading to significant price moves.
Liquidity zones are shaded to help traders visually identify areas of high interest in the market.
Customizable Settings:
You can adjust the pivot period to fine-tune how the indicator calculates support and resistance.
Control the number of support/resistance levels displayed on the chart and the period used to detect liquidity pools.
Customize the colors for support, resistance, and liquidity zones to match your charting preferences.
Alerts:
The script includes built-in alerts for when the price breaks above resistance or falls below support, helping traders catch key breakout opportunities.
How It Works:
The script calculates support and resistance levels using pivot highs and lows based on the user-defined pivot period.
It monitors liquidity pool zones by comparing the current trading volume with the average volume over a customizable period. When the volume exceeds the set threshold, a liquidity pool zone is highlighted, providing insight into where the market may accumulate or distribute.
Alerts are triggered when the price breaks above the first resistance level or falls below the first support level, giving traders immediate notification of key market events.
How to Use:
Tune the Pivot Period: Adjust the pivot period to your preferred time horizon (default: 10 bars).
Set Liquidity Pool Parameters: Customize the number of bars considered for liquidity pool detection and the volume multiplier to detect high-volume zones.
Monitor Breakouts: Use the built-in alerts to catch potential breakout or breakdown opportunities near support and resistance levels.
This script is ideal for traders looking for an easy-to-use tool to visualize support and resistance levels and liquidity pools, aiding in decision-making and trade management.
Cari skrip untuk "trigger"

Uptrick: Dynamic AMA RSI Indicator### **Uptrick: Dynamic AMA RSI Indicator**
**Overview:**
The **Uptrick: Dynamic AMA RSI Indicator** is an advanced technical analysis tool designed for traders who seek to optimize their trading strategies by combining adaptive moving averages with the Relative Strength Index (RSI). This indicator dynamically adjusts to market conditions, offering a nuanced approach to trend detection and momentum analysis. By leveraging the Adaptive Moving Average (AMA) and Fast Adaptive Moving Average (FAMA), along with RSI-based overbought and oversold signals, traders can better identify entry and exit points with higher precision and reduced noise.
**Key Components:**
1. **Source Input:**
- The source input is the price data that forms the basis of all calculations. Typically set to the closing price, traders can customize this to other price metrics such as open, high, low, or even the output of another indicator. This flexibility allows the **Uptrick** indicator to be tailored to a wide range of trading strategies.
2. **Adaptive Moving Average (AMA):**
- The AMA is a moving average that adapts its sensitivity based on the dominant market cycle. This adaptation allows the AMA to respond swiftly to significant price movements while smoothing out minor fluctuations, making it particularly effective in trending markets. The AMA adjusts its responsiveness dynamically using a calculated phase adjustment from the dominant cycle, ensuring it remains responsive to the current market environment without being overly reactive to market noise.
3. **Fast Adaptive Moving Average (FAMA):**
- The FAMA is a more sensitive version of the AMA, designed to react faster to price changes. It serves as a signal line in the crossover strategy, highlighting shorter-term trends. The interaction between the AMA and FAMA forms the core of the signal generation, with crossovers between these lines indicating potential buy or sell opportunities.
4. **Relative Strength Index (RSI):**
- The RSI is a momentum oscillator that measures the speed and change of price movements, providing insights into whether an asset is overbought or oversold. In the **Uptrick** indicator, the RSI is used to confirm the validity of crossover signals between the AMA and FAMA, adding an additional layer of reliability to the trading signals.
**Indicator Logic:**
1. **Dominant Cycle Calculation:**
- The indicator starts by calculating the dominant market cycle using a smoothed price series. This involves applying exponential moving averages to a series of price differences, extracting cycle components, and determining the instantaneous phase of the cycle. This phase is then adjusted to provide a phase adjustment factor, which plays a critical role in determining the adaptive alpha.
2. **Adaptive Alpha Calculation:**
- The adaptive alpha, a key feature of the AMA, is computed based on the fast and slow limits set by the trader. This alpha is clamped within these limits to ensure the AMA remains appropriately sensitive to market conditions. The dynamic adjustment of alpha allows the AMA to be highly responsive in volatile markets and more conservative in stable markets.
3. **Crossover Detection:**
- The indicator generates trading signals based on crossovers between the AMA and FAMA:
- **CrossUp:** When the AMA crosses above the FAMA, it indicates a potential bullish trend, suggesting a buy opportunity.
- **CrossDown:** When the AMA crosses below the FAMA, it signals a potential bearish trend, indicating a sell opportunity.
4. **RSI Confirmation:**
- To enhance the reliability of these crossover signals, the indicator uses the RSI to confirm overbought and oversold conditions:
- **Buy Signal:** A buy signal is generated only when the AMA crosses above the FAMA and the RSI confirms an oversold condition, ensuring that the signal aligns with a momentum reversal from a low point.
- **Sell Signal:** A sell signal is triggered when the AMA crosses below the FAMA and the RSI confirms an overbought condition, indicating a momentum reversal from a high point.
5. **Signal Management:**
- To prevent signal redundancy during strong trends, the indicator tracks the last generated signal (buy or sell) and ensures that the next signal is only issued when there is a genuine reversal in trend direction.
6. **Signal Visualization:**
- **Buy Signals:** The indicator plots a "BUY" label below the bar when a buy signal is generated, using a green color to clearly mark the entry point.
- **Sell Signals:** A "SELL" label is plotted above the bar when a sell signal is detected, marked in red to indicate an exit or shorting opportunity.
- **Bar Coloring (Optional):** Traders have the option to enable bar coloring, where green bars indicate a bullish trend (AMA above FAMA) and red bars indicate a bearish trend (AMA below FAMA), providing a visual representation of the market’s direction.
**Customization Options:**
- **Source:** Traders can select the price data input that best suits their strategy (e.g., close, open, high, low, or custom indicators).
- **Fast Limit:** Adjustable sensitivity for the fast response of the AMA, allowing traders to tailor the indicator to different market conditions.
- **Slow Limit:** Sets the slower boundary for the AMA’s sensitivity, providing stability in less volatile markets.
- **RSI Length:** The period for the RSI calculation can be adjusted to fit different trading timeframes.
- **Overbought/Oversold Levels:** These thresholds can be customized to define the RSI levels that trigger buy or sell confirmations.
- **Enable Bar Colors:** Traders can choose whether to enable bar coloring based on the AMA/FAMA relationship, enhancing visual clarity.
**How Different Traders Can Use the Indicator:**
1. **Day Traders:**
- **Uptrick: Dynamic AMA RSI Indicator** is highly effective for day traders who need to make quick decisions in fast-moving markets. The adaptive nature of the AMA and FAMA allows the indicator to respond rapidly to intraday price swings. Day traders can use the buy and sell signals generated by the crossover and RSI confirmation to time their entries and exits with greater precision, minimizing exposure to false signals often prevalent in high-frequency trading environments.
2. **Swing Traders:**
- Swing traders can benefit from the indicator’s ability to identify and confirm trend reversals over several days or weeks. By adjusting the RSI length and sensitivity limits, swing traders can fine-tune the indicator to catch longer-term price movements, helping them to ride trends and maximize profits over medium-term trades. The dual confirmation of crossovers with RSI ensures that swing traders enter trades that have a higher probability of success.
3. **Position Traders:**
- For position traders who hold trades over longer periods, the **Uptrick** indicator offers a reliable method to stay in trades that align with the dominant trend while avoiding premature exits. By adjusting the slow limit and extending the RSI length, position traders can smooth out the indicator’s sensitivity, allowing them to focus on major market shifts rather than short-term volatility. The bar coloring feature also provides a clear visual indication of the overall trend, aiding in trade management decisions.
4. **Scalpers:**
- Scalpers, who seek to profit from small price movements, can use the fast responsiveness of the FAMA in conjunction with the RSI to identify micro-trends within larger market moves. The indicator’s ability to adapt quickly to changing conditions makes it a valuable tool for scalpers looking to execute numerous trades in a short period, capturing profits from minor price fluctuations while avoiding prolonged exposure.
5. **Algorithmic Traders:**
- Algorithmic traders can incorporate the **Uptrick** indicator into automated trading systems. The precise crossover signals combined with RSI confirmation provide clear and actionable rules that can be coded into algorithms. The adaptive nature of the indicator ensures that it can be used across different market conditions and timeframes, making it a versatile component of algorithmic strategies.
**Usage:**
The **Uptrick: Dynamic AMA RSI Indicator** is a versatile tool that can be integrated into various trading strategies, from short-term day trading to long-term investing. Its ability to adapt to changing market conditions and provide clear buy and sell signals makes it an invaluable asset for traders seeking to improve their trading performance. Whether used as a standalone indicator or in conjunction with other technical tools, **Uptrick** offers a dynamic approach to market analysis, helping traders to navigate the complexities of financial markets with greater confidence.
**Conclusion:**
The **Uptrick: Dynamic AMA RSI Indicator** offers a comprehensive and adaptable solution for traders across different styles and timeframes. By combining the strengths of adaptive moving averages with RSI confirmation, it delivers robust signals that help traders capitalize on market trends while minimizing the risk of false signals. This indicator is a powerful addition to any trader’s toolkit, enabling them to make informed decisions with greater precision and confidence. Whether you're a day trader, swing trader, or long-term investor, the **Uptrick** indicator can enhance your trading strategy and improve your market outcomes.

Breadth Thrust Strategy with Volatility Stop-LossThe "Breadth Thrust Strategy with Volatility Stop-Loss" is a trading strategy designed to capitalize on market momentum while managing risk through volatility-based stop-losses. Here's a detailed breakdown of the strategy:
Strategy Overview:
Market Breadth Analysis: The strategy uses the "Breadth Thrust Indicator," which evaluates market momentum by calculating the ratio of advancing stocks to the total number of stocks on the New York Stock Exchange (NYSE). This indicator helps identify bullish market conditions. An optional feature allows for the inclusion of volume data in this calculation, enhancing the signal's robustness.
Signal Generation: A long position is triggered when the smoothed breadth ratio (or the combined breadth and volume ratio) crosses above a specified low threshold (e.g., 0.4). This crossover indicates a potential shift towards positive market momentum.
Key Parameters:
Smoothing Length (length): Defines the period over which the breadth or combined ratio is smoothed using a simple moving average (SMA) to reduce noise and highlight the underlying trend.
Low Threshold (threshold_low): The level below which the smoothed ratio must fall before crossing back above to trigger a long signal.
Hold Periods (hold_periods): The minimum number of periods for which the position will be held once entered, ensuring the strategy captures a meaningful move.
Volatility Multiplier (volatility_multiplier): A multiplier applied to the Average True Range (ATR) to determine the distance of the stop-loss from the entry price, which adjusts according to market volatility.
Trade Management:
Entry Signal: The strategy enters a long position when the smoothed combined ratio crosses above the low threshold, signaling a potential bullish reversal.
ATR-Based Stop-Loss: Upon entering a trade, the strategy calculates a stop-loss level based on the ATR, which measures market volatility. The stop-loss is set at a distance from the entry price, determined by multiplying the ATR by the specified volatility multiplier. This adaptive stop-loss mechanism helps protect the position from adverse market moves.
Stop-Loss Adjustment: While the position is open, the stop-loss level is dynamically updated, ensuring it never decreases (trailing stop-loss effect) but can be adjusted upwards to reflect the latest price action relative to volatility.
Position Closure: The position is closed if:
The market price falls to or below the stop-loss level.
The position has been held for the specified number of periods (hold_periods), after which it is automatically closed.
Additional Settings:
Initial Capital: The strategy starts with an initial capital of $10,000.
Commissions and Slippage: Each trade incurs a commission of $5 per order, and slippage is accounted for at $1 per trade.
Background Highlighting: The chart background turns green when a position is open, providing a clear visual indication of the active trade.
This strategy is designed to identify and capitalize on upward momentum in the market while employing a volatility-adjusted stop-loss to manage risk. By combining market breadth analysis with volatility-based stop-losses, the strategy aims to balance profit potential with protection against sudden market reversals.

Monthly Day Long Strategy with VIX and Risk ManagementThis trading strategy is designed to open long positions on a specific day of the month, with the conditions for entry and exit based on the VIX index and additional risk management techniques. The strategy includes stop-loss and take-profit features to manage risk and lock in profits.
Inputs:
Entry Day of the Month (entry_day): Specifies which day of the month to consider for initiating a trade. The default value is the 27th.
Hold Duration (Days) (hold_duration_days): Defines how many days to hold the position after opening. The default value is 4 days.
VIX Threshold (vix_threshold): Sets the maximum acceptable value for the VIX index to consider an entry. If the VIX is below this threshold, it signals a potential trade. The default value is 20.0.
Stop Loss (%) (stop_loss_percentage): Determines the percentage below the entry price where the stop-loss will be triggered. The default value is 2.0%.
Take Profit (%) (take_profit_percentage): Sets the percentage above the entry price where the take-profit will be triggered. The default value is 5.0%.
Functions:
next_weekday(date): Adjusts the entry date to the next Monday if it falls on a weekend (Saturday or Sunday). This ensures trades do not occur on non-trading days.
Logic:
Entry Conditions:
Date Check: Opens a long position if the current date matches the adjusted entry date (the 27th or the next Monday if the 27th falls on a weekend).
VIX Filter: The VIX index value must be below the specified threshold (e.g., 20.0) to consider an entry.
Exit Conditions:
Time-Based Exit: Closes the position after the hold duration of 4 days.
Stop-Loss: Automatically closes the position if the price drops to a level that is a specified percentage below the entry price (e.g., 2.0%).
Take-Profit: Closes the position if the price rises to a level that is a specified percentage above the entry price (e.g., 5.0%).
Plots:
VIX Plot: Displays the VIX index on the chart for visual reference.
VIX Threshold Line: A horizontal line representing the VIX threshold value.
Summary:
The strategy aims to take advantage of specific entry days while filtering trades based on VIX levels to ensure market conditions are favorable. Risk management is enhanced through stop-loss and take-profit settings, which help in controlling potential losses and securing profits. The strategy ensures trades are only made on trading days and not on weekends, adjusting automatically to the next Monday if needed.
ChatGPT kann Fehler machen. Überprüfe wichtige Informationen.

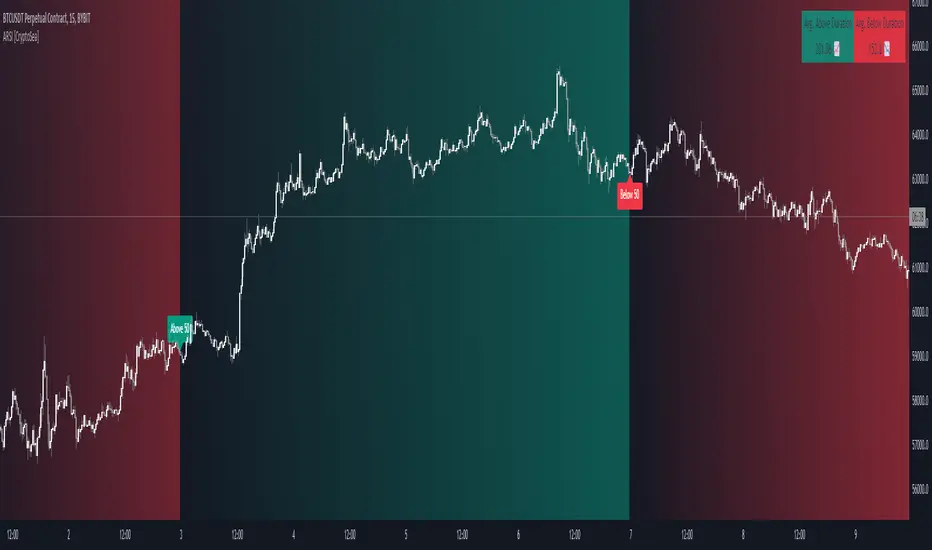
Advanced RSI [CryptoSea]The Advanced RSI Duration (ARSI) is a unique tool crafted to deepen your market insights by focusing on the duration the Relative Strength Index (RSI) spends above or below key thresholds. This innovative approach is designed to help traders anticipate potential market reversals by observing sustained overbought and oversold conditions.
Core Feature
Duration Monitoring ARSI's standout feature is its ability to track how long the RSI remains in overbought (>70) or oversold (<30) conditions. By quantifying these durations, traders can gauge the strength of current market trends and the likelihood of reversals.
Enhanced Functionality
Multi-Timeframe Flexibility : Analyze the RSI duration from any selected timeframe on your current chart, offering a layered view of market dynamics.
Customizable Alerts : Receive notifications when the RSI maintains its position above or below set levels for an extended period, signaling sustained market pressure.
Visual Customization : Adjust the visual elements, including colors for overbought and oversold durations, to match your analytical style and preferences.
Label Management : Control the frequency of labels marking RSI threshold crossings, ensuring clarity and focus on significant market events.
Settings Overview
RSI Timeframe & Length : Tailor the RSI calculation to fit your analysis, choosing from various timeframes and period lengths.
Threshold Levels : Define what you consider overbought and oversold conditions with customizable upper and lower RSI levels.
Duration Alert Threshold : Set a specific bar count for how long the RSI should remain beyond these thresholds to trigger an alert.
Visualization Options : Choose distinct colors for durations above and below thresholds, and adjust label visibility to suit your charting approach.
Application & Strategy
Use ARSI to identify potential turning points in the market
Trend Exhaustion : Extended periods in overbought or oversold territories may indicate a strong trend but also warn of possible exhaustion and impending reversals.
Comparative Analysis : By evaluating the current duration against historical averages, traders can assess the relative strength of ongoing market conditions.
Strategic Entries/Exits : Utilize duration insights to refine entry and exit points, capitalizing on the predictive nature of prolonged RSI levels.
Alert Conditions
The Advanced RSI (ARSI) offers critical alert mechanisms to aid traders in identifying prolonged market conditions that could lead to actionable trading opportunities. These conditions are designed to alert traders when the RSI remains at extremes longer than typical durations, signaling sustained market behaviors.
Above Upper Level Alert: This alert is triggered when the RSI sustains above the upper threshold (usually 70) for more than the configured duration, indicating strong bullish momentum or potential overbought conditions.
Below Lower Level Alert: Similarly, this alert is activated when the RSI stays below the lower threshold (commonly 30) for an extended period, suggesting significant bearish momentum or potential oversold conditions.
These alerts enable traders to respond swiftly to extend market conditions, enhancing their strategy by providing timely insights into potential trend reversals or continuations.
The Advanced RSI Duration Analysis empowers traders with a nuanced understanding of market states, beyond mere RSI values. It highlights the significance of how long markets remain in extreme conditions, offering a predictive edge in anticipating reversals. Whether you're strategizing entries or preparing for shifts in market momentum, ARSI is your companion for informed trading decisions.
garbage_collection_and_utilitiesGarbage Collection and Utilities is a library that offers a set of functions designed for efficient management of various types of arrays. This library provides garbage collection utilities to remove and delete excess elements, and also includes utilities for checking the size of arrays. It's particularly useful for developers who want to manage labels, lines, polylines, boxes, linefills, chart points, floats, integers, booleans, and strings efficiently within their scripts.
Both dump and trim act on the array backwards . This means that for trim , the elements that will be left start from 0. If you want the most recent element to be left after trim, you must use unshift().
Garbage Collection:
Functions to remove and delete excess elements from various types of arrays.
Useful for freeing up memory and keeping the arrays within desired size limits.
Size Checking:
Functions to check if arrays are larger than a specified size.
Helps in ensuring that arrays have enough elements before performing operations.
Supported Types:
Compatible with a wide range of array types, including labels, lines, polylines, boxes, linefills, chart points, floats, integers, booleans, and strings.
Usage:
The dump methods are ideal for clearing out unwanted elements from arrays, while the trim methods allow for more refined control over the size of arrays.
The ready methods enable you to verify if arrays have the required number of elements before proceeding with further operations.
Library "garbage_collection_and_utilities"
Provides garbage collection utilities for managing and trimming various types of arrays, and utilities to check if an array is of a specific size. Included types are: labels, lines, polylines, boxes, linefills, chart points, floats, integers, booleans, and strings.
method ready(self, size)
Checks if an array of labels is larger than a specified size
Namespace types: array
Parameters:
self (array)
size (int) : The minimum size of the array
Returns: A boolean indicating whether the array is ready
method ready(self, size)
Checks if an array of lines is larger than a specified size
Namespace types: array
Parameters:
self (array)
size (int) : The minimum size of the array
Returns: A boolean indicating whether the array is ready
method ready(self, size)
Checks if an array of polylines is larger than a specified size
Namespace types: array
Parameters:
self (array)
size (int) : The minimum size of the array
Returns: A boolean indicating whether the array is ready
method ready(self, size)
Checks if an array of boxes is larger than a specified size
Namespace types: array
Parameters:
self (array)
size (int) : The minimum size of the array
Returns: A boolean indicating whether the array is ready
method ready(self, size)
Checks if an array of linefills is larger than a specified size
Namespace types: array
Parameters:
self (array)
size (int) : The minimum size of the array
Returns: A boolean indicating whether the array is ready
method ready(self, size)
Checks if an array of chart points is larger than a specified size
Namespace types: array
Parameters:
self (array)
size (int) : The minimum size of the array
Returns: A boolean indicating whether the array is ready
method ready(self, size)
Checks if an array of floats is larger than a specified size
Namespace types: array
Parameters:
self (array)
size (int) : The minimum size of the array
Returns: A boolean indicating whether the array is ready
method ready(self, size)
Checks if an array of integers is larger than a specified size
Namespace types: array
Parameters:
self (array)
size (int) : The minimum size of the array
Returns: A boolean indicating whether the array is ready
method ready(self, size)
Checks if an array of booleans is larger than a specified size
Namespace types: array
Parameters:
self (array)
size (int) : The minimum size of the array
Returns: A boolean indicating whether the array is ready
method ready(self, size)
Checks if an array of strings is larger than a specified size
Namespace types: array
Parameters:
self (array)
size (int) : The minimum size of the array
Returns: A boolean indicating whether the array is ready
method dump(self, max_size, trigger)
Removes and deletes excess elements from an array of labels
Namespace types: array
Parameters:
self (array)
max_size (int) : The maximum size of the array
trigger (bool) : A condition to trigger the dumping process
Returns: void
method dump(self, max_size, trigger)
Removes and deletes excess elements from an array of lines
Namespace types: array
Parameters:
self (array)
max_size (int) : The maximum size of the array
trigger (bool) : A condition to trigger the dumping process
Returns: void
method dump(self, max_size, trigger)
Removes and deletes excess elements from an array of polylines
Namespace types: array
Parameters:
self (array)
max_size (int) : The maximum size of the array
trigger (bool) : A condition to trigger the dumping process
Returns: void
method dump(self, max_size, trigger)
Removes and deletes excess elements from an array of boxes
Namespace types: array
Parameters:
self (array)
max_size (int) : The maximum size of the array
trigger (bool) : A condition to trigger the dumping process
Returns: void
method dump(self, max_size, trigger)
Removes and deletes excess elements from an array of linefills
Namespace types: array
Parameters:
self (array)
max_size (int) : The maximum size of the array
trigger (bool) : A condition to trigger the dumping process
Returns: void
method dump(self, max_size, trigger)
Removes and deletes excess elements from an array of chart points
Namespace types: array
Parameters:
self (array)
max_size (int) : The maximum size of the array
trigger (bool) : A condition to trigger the dumping process
Returns: void
method dump(self, max_size, trigger)
Removes and deletes excess elements from an array of floats
Namespace types: array
Parameters:
self (array)
max_size (int) : The maximum size of the array
trigger (bool) : A condition to trigger the dumping process
Returns: void
method dump(self, max_size, trigger)
Removes and deletes excess elements from an array of integers
Namespace types: array
Parameters:
self (array)
max_size (int) : The maximum size of the array
trigger (bool) : A condition to trigger the dumping process
Returns: void
method dump(self, max_size, trigger)
Removes and deletes excess elements from an array of booleans
Namespace types: array
Parameters:
self (array)
max_size (int) : The maximum size of the array
trigger (bool) : A condition to trigger the dumping process
Returns: void
method dump(self, max_size, trigger)
Removes and deletes excess elements from an array of strings
Namespace types: array
Parameters:
self (array)
max_size (int) : The maximum size of the array
trigger (bool) : A condition to trigger the dumping process
Returns: void
method trim(self, max_size, min_size, trigger)
Removes excess elements and trims an array of labels
Namespace types: array
Parameters:
self (array)
max_size (int) : The maximum size of the array
min_size (int) : The minimum size of the array
trigger (bool) : A condition to trigger the trimming process
Returns: void
method trim(self, max_size, min_size, trigger)
Removes excess elements and trims an array of lines
Namespace types: array
Parameters:
self (array)
max_size (int) : The maximum size of the array
min_size (int) : The minimum size of the array
trigger (bool) : A condition to trigger the trimming process
Returns: void
method trim(self, max_size, min_size, trigger)
Removes excess elements and trims an array of polylines
Namespace types: array
Parameters:
self (array)
max_size (int) : The maximum size of the array
min_size (int) : The minimum size of the array
trigger (bool) : A condition to trigger the trimming process
Returns: void
method trim(self, max_size, min_size, trigger)
Removes excess elements and trims an array of boxes
Namespace types: array
Parameters:
self (array)
max_size (int) : The maximum size of the array
min_size (int) : The minimum size of the array
trigger (bool) : A condition to trigger the trimming process
Returns: void
method trim(self, max_size, min_size, trigger)
Removes excess elements and trims an array of linefills
Namespace types: array
Parameters:
self (array)
max_size (int) : The maximum size of the array
min_size (int) : The minimum size of the array
trigger (bool) : A condition to trigger the trimming process
Returns: void
method trim(self, max_size, min_size, trigger)
Removes excess elements and trims an array of chart points
Namespace types: array
Parameters:
self (array)
max_size (int) : The maximum size of the array
min_size (int) : The minimum size of the array
trigger (bool) : A condition to trigger the trimming process
Returns: void
method trim(self, max_size, min_size, trigger)
Removes excess elements and trims an array of floats
Namespace types: array
Parameters:
self (array)
max_size (int) : The maximum size of the array
min_size (int) : The minimum size of the array
trigger (bool) : A condition to trigger the trimming process
Returns: void
method trim(self, max_size, min_size, trigger)
Removes excess elements and trims an array of integers
Namespace types: array
Parameters:
self (array)
max_size (int) : The maximum size of the array
min_size (int) : The minimum size of the array
trigger (bool) : A condition to trigger the trimming process
Returns: void
method trim(self, max_size, min_size, trigger)
Removes excess elements and trims an array of booleans
Namespace types: array
Parameters:
self (array)
max_size (int) : The maximum size of the array
min_size (int) : The minimum size of the array
trigger (bool) : A condition to trigger the trimming process
Returns: void
method trim(self, max_size, min_size, trigger)
Removes excess elements and trims an array of strings
Namespace types: array
Parameters:
self (array)
max_size (int) : The maximum size of the array
min_size (int) : The minimum size of the array
trigger (bool) : A condition to trigger the trimming process
Returns: void

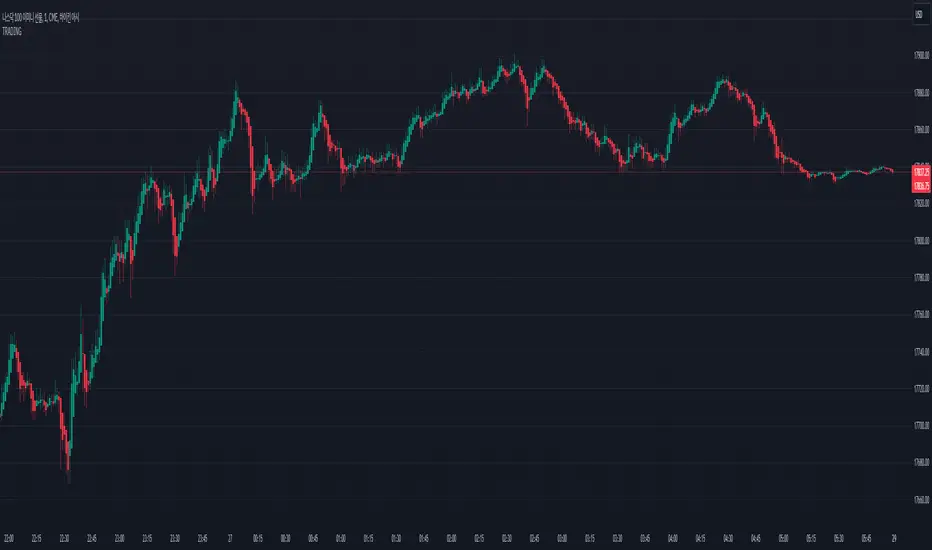
TRADINGLibrary "TRADING"
This library is a client script for making a webhook signal formatted string to PoABOT server.
entry_message(password, percent, leverage, margin_mode, kis_number)
Create a entry message for POABOT
Parameters:
password (string) : (string) The password of your bot.
percent (float) : (float) The percent for entry based on your wallet balance.
leverage (int) : (int) The leverage of entry. If not set, your levereage doesn't change.
margin_mode (string) : (string) The margin mode for trade(only for OKX). "cross" or "isolated"
kis_number (int) : (int) The number of koreainvestment account. Default 1
Returns: (string) A json formatted string for webhook message.
order_message(password, percent, leverage, margin_mode, kis_number)
Create a order message for POABOT
Parameters:
password (string) : (string) The password of your bot.
percent (float) : (float) The percent for entry based on your wallet balance.
leverage (int) : (int) The leverage of entry. If not set, your levereage doesn't change.
margin_mode (string) : (string) The margin mode for trade(only for OKX). "cross" or "isolated"
kis_number (int) : (int) The number of koreainvestment account. Default 1
Returns: (string) A json formatted string for webhook message.
close_message(password, percent, margin_mode, kis_number)
Create a close message for POABOT
Parameters:
password (string) : (string) The password of your bot.
percent (float) : (float) The percent for close based on your wallet balance.
margin_mode (string) : (string) The margin mode for trade(only for OKX). "cross" or "isolated"
kis_number (int) : (int) The number of koreainvestment account. Default 1
Returns: (string) A json formatted string for webhook message.
exit_message(password, percent, margin_mode, kis_number)
Create a exit message for POABOT
Parameters:
password (string) : (string) The password of your bot.
percent (float) : (float) The percent for exit based on your wallet balance.
margin_mode (string) : (string) The margin mode for trade(only for OKX). "cross" or "isolated"
kis_number (int) : (int) The number of koreainvestment account. Default 1
Returns: (string) A json formatted string for webhook message.
manual_message(password, exchange, base, quote, side, qty, price, percent, leverage, margin_mode, kis_number, order_name)
Create a manual message for POABOT
Parameters:
password (string) : (string) The password of your bot.
exchange (string) : (string) The exchange
base (string) : (string) The base
quote (string) : (string) The quote of order message
side (string) : (string) The side of order messsage
qty (float) : (float) The qty of order message
price (float) : (float) The price of order message
percent (float) : (float) The percent for order based on your wallet balance.
leverage (int) : (int) The leverage of entry. If not set, your levereage doesn't change.
margin_mode (string) : (string) The margin mode for trade(only for OKX). "cross" or "isolated"
kis_number (int) : (int) The number of koreainvestment account.
order_name (string) : (string) The name of order message
Returns: (string) A json formatted string for webhook message.
in_trade(start_time, end_time, hide_trade_line)
Create a trade start line
Parameters:
start_time (int) : (int) The start of time.
end_time (int) : (int) The end of time.
hide_trade_line (bool) : (bool) if true, hide trade line. Default false.
Returns: (bool) Get bool for trade based on time range.
real_qty(qty, precision, leverage, contract_size, default_qty_type, default_qty_value)
Get exchange specific real qty
Parameters:
qty (float) : (float) qty
precision (float) : (float) precision
leverage (int) : (int) leverage
contract_size (float) : (float) contract_size
default_qty_type (string)
default_qty_value (float)
Returns: (float) exchange specific qty.
method set(this, password, start_time, end_time, leverage, initial_capital, default_qty_type, default_qty_value, margin_mode, contract_size, kis_number, entry_percent, close_percent, exit_percent, fixed_qty, fixed_cash, real, auto_alert_message, hide_trade_line)
Set bot object.
Namespace types: bot
Parameters:
this (bot)
password (string) : (string) password for poabot.
start_time (int) : (int) start_time timestamp.
end_time (int) : (int) end_time timestamp.
leverage (int) : (int) leverage.
initial_capital (float)
default_qty_type (string)
default_qty_value (float)
margin_mode (string) : (string) The margin mode for trade(only for OKX). "cross" or "isolated"
contract_size (float)
kis_number (int) : (int) kis_number for poabot.
entry_percent (float) : (float) entry_percent for poabot.
close_percent (float) : (float) close_percent for poabot.
exit_percent (float) : (float) exit_percent for poabot.
fixed_qty (float) : (float) fixed qty.
fixed_cash (float) : (float) fixed cash.
real (bool) : (bool) convert qty for exchange specific.
auto_alert_message (bool) : (bool) convert alert_message for exchange specific.
hide_trade_line (bool) : (bool) if true, Hide trade line. Default false.
Returns: (void)
method print(this, message)
Print message using log table.
Namespace types: bot
Parameters:
this (bot)
message (string)
Returns: (void)
method start_trade(this)
start trade using start_time and end_time
Namespace types: bot
Parameters:
this (bot)
Returns: (void)
method entry(this, id, direction, qty, limit, stop, oca_name, oca_type, comment, alert_message, when)
It is a command to enter market position. If an order with the same ID is already pending, it is possible to modify the order. If there is no order with the specified ID, a new order is placed. To deactivate an entry order, the command strategy.cancel or strategy.cancel_all should be used. In comparison to the function strategy.order, the function strategy.entry is affected by pyramiding and it can reverse market position correctly. If both 'limit' and 'stop' parameters are 'NaN', the order type is market order.
Namespace types: bot
Parameters:
this (bot)
id (string) : (string) A required parameter. The order identifier. It is possible to cancel or modify an order by referencing its identifier.
direction (string) : (string) A required parameter. Market position direction: 'strategy.long' is for long, 'strategy.short' is for short.
qty (float) : (float) An optional parameter. Number of contracts/shares/lots/units to trade. The default value is 'NaN'.
limit (float) : (float) An optional parameter. Limit price of the order. If it is specified, the order type is either 'limit', or 'stop-limit'. 'NaN' should be specified for any other order type.
stop (float) : (float) An optional parameter. Stop price of the order. If it is specified, the order type is either 'stop', or 'stop-limit'. 'NaN' should be specified for any other order type.
oca_name (string) : (string) An optional parameter. Name of the OCA group the order belongs to. If the order should not belong to any particular OCA group, there should be an empty string.
oca_type (string) : (string) An optional parameter. Type of the OCA group. The allowed values are: "strategy.oca.none" - the order should not belong to any particular OCA group; "strategy.oca.cancel" - the order should belong to an OCA group, where as soon as an order is filled, all other orders of the same group are cancelled; "strategy.oca.reduce" - the order should belong to an OCA group, where if X number of contracts of an order is filled, number of contracts for each other order of the same OCA group is decreased by X.
comment (string) : (string) An optional parameter. Additional notes on the order.
alert_message (string) : (string) An optional parameter which replaces the {{strategy.order.alert_message}} placeholder when it is used in the "Create Alert" dialog box's "Message" field.
when (bool) : (bool) An optional parmeter. Condition, deprecated.
Returns: (void)
method order(this, id, direction, qty, limit, stop, oca_name, oca_type, comment, alert_message, when)
It is a command to place order. If an order with the same ID is already pending, it is possible to modify the order. If there is no order with the specified ID, a new order is placed. To deactivate order, the command strategy.cancel or strategy.cancel_all should be used. In comparison to the function strategy.entry, the function strategy.order is not affected by pyramiding. If both 'limit' and 'stop' parameters are 'NaN', the order type is market order.
Namespace types: bot
Parameters:
this (bot)
id (string) : (string) A required parameter. The order identifier. It is possible to cancel or modify an order by referencing its identifier.
direction (string) : (string) A required parameter. Market position direction: 'strategy.long' is for long, 'strategy.short' is for short.
qty (float) : (float) An optional parameter. Number of contracts/shares/lots/units to trade. The default value is 'NaN'.
limit (float) : (float) An optional parameter. Limit price of the order. If it is specified, the order type is either 'limit', or 'stop-limit'. 'NaN' should be specified for any other order type.
stop (float) : (float) An optional parameter. Stop price of the order. If it is specified, the order type is either 'stop', or 'stop-limit'. 'NaN' should be specified for any other order type.
oca_name (string) : (string) An optional parameter. Name of the OCA group the order belongs to. If the order should not belong to any particular OCA group, there should be an empty string.
oca_type (string) : (string) An optional parameter. Type of the OCA group. The allowed values are: "strategy.oca.none" - the order should not belong to any particular OCA group; "strategy.oca.cancel" - the order should belong to an OCA group, where as soon as an order is filled, all other orders of the same group are cancelled; "strategy.oca.reduce" - the order should belong to an OCA group, where if X number of contracts of an order is filled, number of contracts for each other order of the same OCA group is decreased by X.
comment (string) : (string) An optional parameter. Additional notes on the order.
alert_message (string) : (string) An optional parameter which replaces the {{strategy.order.alert_message}} placeholder when it is used in the "Create Alert" dialog box's "Message" field.
when (bool) : (bool) An optional parmeter. Condition, deprecated.
Returns: (void)
method close_all(this, comment, alert_message, immediately, when)
Exits the current market position, making it flat.
Namespace types: bot
Parameters:
this (bot)
comment (string) : (string) An optional parameter. Additional notes on the order.
alert_message (string) : (string) An optional parameter which replaces the {{strategy.order.alert_message}} placeholder when it is used in the "Create Alert" dialog box's "Message" field.
immediately (bool) : (bool) An optional parameter. If true, the closing order will be executed on the tick where it has been placed, ignoring the strategy parameters that restrict the order execution to the open of the next bar. The default is false.
when (bool) : (bool) An optional parmeter. Condition, deprecated.
Returns: (void)
method cancel(this, id, when)
It is a command to cancel/deactivate pending orders by referencing their names, which were generated by the functions: strategy.order, strategy.entry and strategy.exit.
Namespace types: bot
Parameters:
this (bot)
id (string) : (string) A required parameter. The order identifier. It is possible to cancel an order by referencing its identifier.
when (bool) : (bool) An optional parmeter. Condition, deprecated.
Returns: (void)
method cancel_all(this, when)
It is a command to cancel/deactivate all pending orders, which were generated by the functions: strategy.order, strategy.entry and strategy.exit.
Namespace types: bot
Parameters:
this (bot)
when (bool) : (bool) An optional parmeter. Condition, deprecated.
Returns: (void)
method close(this, id, comment, qty, qty_percent, alert_message, immediately, when)
It is a command to exit from the entry with the specified ID. If there were multiple entry orders with the same ID, all of them are exited at once. If there are no open entries with the specified ID by the moment the command is triggered, the command will not come into effect. The command uses market order. Every entry is closed by a separate market order.
Namespace types: bot
Parameters:
this (bot)
id (string) : (string) A required parameter. The order identifier. It is possible to close an order by referencing its identifier.
comment (string) : (string) An optional parameter. Additional notes on the order.
qty (float) : (float) An optional parameter. Number of contracts/shares/lots/units to exit a trade with. The default value is 'NaN'.
qty_percent (float) : (float) Defines the percentage (0-100) of the position to close. Its priority is lower than that of the 'qty' parameter. Optional. The default is 100.
alert_message (string) : (string) An optional parameter which replaces the {{strategy.order.alert_message}} placeholder when it is used in the "Create Alert" dialog box's "Message" field.
immediately (bool) : (bool) An optional parameter. If true, the closing order will be executed on the tick where it has been placed, ignoring the strategy parameters that restrict the order execution to the open of the next bar. The default is false.
when (bool) : (bool) An optional parmeter. Condition, deprecated.
Returns: (void)
ticks_to_price(ticks, from)
Converts ticks to a price offset from the supplied price or the average entry price.
Parameters:
ticks (float) : (float) Ticks to convert to a price.
from (float) : (float) A price that can be used to calculate from. Optional. The default value is `strategy.position_avg_price`.
Returns: (float) A price level that has a distance from the entry price equal to the specified number of ticks.
method exit(this, id, from_entry, qty, qty_percent, profit, limit, loss, stop, trail_price, trail_points, trail_offset, oca_name, comment, comment_profit, comment_loss, comment_trailing, alert_message, alert_profit, alert_loss, alert_trailing, when)
It is a command to exit either a specific entry, or whole market position. If an order with the same ID is already pending, it is possible to modify the order. If an entry order was not filled, but an exit order is generated, the exit order will wait till entry order is filled and then the exit order is placed. To deactivate an exit order, the command strategy.cancel or strategy.cancel_all should be used. If the function strategy.exit is called once, it exits a position only once. If you want to exit multiple times, the command strategy.exit should be called multiple times. If you use a stop loss and a trailing stop, their order type is 'stop', so only one of them is placed (the one that is supposed to be filled first). If all the following parameters 'profit', 'limit', 'loss', 'stop', 'trail_points', 'trail_offset' are 'NaN', the command will fail. To use market order to exit, the command strategy.close or strategy.close_all should be used.
Namespace types: bot
Parameters:
this (bot)
id (string) : (string) A required parameter. The order identifier. It is possible to cancel or modify an order by referencing its identifier.
from_entry (string) : (string) An optional parameter. The identifier of a specific entry order to exit from it. To exit all entries an empty string should be used. The default values is empty string.
qty (float) : (float) An optional parameter. Number of contracts/shares/lots/units to exit a trade with. The default value is 'NaN'.
qty_percent (float) : (float) Defines the percentage of (0-100) the position to close. Its priority is lower than that of the 'qty' parameter. Optional. The default is 100.
profit (float) : (float) An optional parameter. Profit target (specified in ticks). If it is specified, a limit order is placed to exit market position when the specified amount of profit (in ticks) is reached. The default value is 'NaN'.
limit (float) : (float) An optional parameter. Profit target (requires a specific price). If it is specified, a limit order is placed to exit market position at the specified price (or better). Priority of the parameter 'limit' is higher than priority of the parameter 'profit' ('limit' is used instead of 'profit', if its value is not 'NaN'). The default value is 'NaN'.
loss (float) : (float) An optional parameter. Stop loss (specified in ticks). If it is specified, a stop order is placed to exit market position when the specified amount of loss (in ticks) is reached. The default value is 'NaN'.
stop (float) : (float) An optional parameter. Stop loss (requires a specific price). If it is specified, a stop order is placed to exit market position at the specified price (or worse). Priority of the parameter 'stop' is higher than priority of the parameter 'loss' ('stop' is used instead of 'loss', if its value is not 'NaN'). The default value is 'NaN'.
trail_price (float) : (float) An optional parameter. Trailing stop activation level (requires a specific price). If it is specified, a trailing stop order will be placed when the specified price level is reached. The offset (in ticks) to determine initial price of the trailing stop order is specified in the 'trail_offset' parameter: X ticks lower than activation level to exit long position; X ticks higher than activation level to exit short position. The default value is 'NaN'.
trail_points (float) : (float) An optional parameter. Trailing stop activation level (profit specified in ticks). If it is specified, a trailing stop order will be placed when the calculated price level (specified amount of profit) is reached. The offset (in ticks) to determine initial price of the trailing stop order is specified in the 'trail_offset' parameter: X ticks lower than activation level to exit long position; X ticks higher than activation level to exit short position. The default value is 'NaN'.
trail_offset (float) : (float) An optional parameter. Trailing stop price (specified in ticks). The offset in ticks to determine initial price of the trailing stop order: X ticks lower than 'trail_price' or 'trail_points' to exit long position; X ticks higher than 'trail_price' or 'trail_points' to exit short position. The default value is 'NaN'.
oca_name (string) : (string) An optional parameter. Name of the OCA group (oca_type = strategy.oca.reduce) the profit target, the stop loss / the trailing stop orders belong to. If the name is not specified, it will be generated automatically.
comment (string) : (string) Additional notes on the order. If specified, displays near the order marker on the chart. Optional. The default is na.
comment_profit (string) : (string) Additional notes on the order if the exit was triggered by crossing `profit` or `limit` specifically. If specified, supercedes the `comment` parameter and displays near the order marker on the chart. Optional. The default is na.
comment_loss (string) : (string) Additional notes on the order if the exit was triggered by crossing `stop` or `loss` specifically. If specified, supercedes the `comment` parameter and displays near the order marker on the chart. Optional. The default is na.
comment_trailing (string) : (string) Additional notes on the order if the exit was triggered by crossing `trail_offset` specifically. If specified, supercedes the `comment` parameter and displays near the order marker on the chart. Optional. The default is na.
alert_message (string) : (string) Text that will replace the '{{strategy.order.alert_message}}' placeholder when one is used in the "Message" field of the "Create Alert" dialog. Optional. The default is na.
alert_profit (string) : (string) Text that will replace the '{{strategy.order.alert_message}}' placeholder when one is used in the "Message" field of the "Create Alert" dialog. Only replaces the text if the exit was triggered by crossing `profit` or `limit` specifically. Optional. The default is na.
alert_loss (string) : (string) Text that will replace the '{{strategy.order.alert_message}}' placeholder when one is used in the "Message" field of the "Create Alert" dialog. Only replaces the text if the exit was triggered by crossing `stop` or `loss` specifically. Optional. The default is na.
alert_trailing (string) : (string) Text that will replace the '{{strategy.order.alert_message}}' placeholder when one is used in the "Message" field of the "Create Alert" dialog. Only replaces the text if the exit was triggered by crossing `trail_offset` specifically. Optional. The default is na.
when (bool) : (bool) An optional parmeter. Condition, deprecated.
Returns: (void)
percent_to_ticks(percent, from)
Converts a percentage of the supplied price or the average entry price to ticks.
Parameters:
percent (float) : (float) The percentage of supplied price to convert to ticks. 50 is 50% of the entry price.
from (float) : (float) A price that can be used to calculate from. Optional. The default value is `strategy.position_avg_price`.
Returns: (float) A value in ticks.
percent_to_price(percent, from)
Converts a percentage of the supplied price or the average entry price to a price.
Parameters:
percent (float) : (float) The percentage of the supplied price to convert to price. 50 is 50% of the supplied price.
from (float) : (float) A price that can be used to calculate from. Optional. The default value is `strategy.position_avg_price`.
Returns: (float) A value in the symbol's quote currency (USD for BTCUSD).
bot
Fields:
password (series__string)
start_time (series__integer)
end_time (series__integer)
leverage (series__integer)
initial_capital (series__float)
default_qty_type (series__string)
default_qty_value (series__float)
margin_mode (series__string)
contract_size (series__float)
kis_number (series__integer)
entry_percent (series__float)
close_percent (series__float)
exit_percent (series__float)
log_table (series__table)
fixed_qty (series__float)
fixed_cash (series__float)
real (series__bool)
auto_alert_message (series__bool)
hide_trade_line (series__bool)
RSI TrendsThis TradingView script combines RSI trend analysis with FVG (Fair Value Gap) detection to identify potential buy and sell opportunities in financial markets. The script is customizable and provides extensive visual feedback directly on the chart, enhancing both strategic entry and exit points for traders. Raw code of FVG was taken from LuxAlgo
Features
FVG Detection: Identifies Fair Value Gaps (FVG), and provides options to display these gaps based on user settings.
RSI Trend Bars: Utilizes the Relative Strength Index (RSI) to paint bars indicating overbought and oversold conditions. This helps traders understand current market sentiment and potential reversal points.
Customizable Settings: Users can customize the timeframe, FVG types, and RSI thresholds. This flexibility allows the script to be adapted to various trading styles and timeframes.
Historical Analysis: Option to display or hide historical FVGs, helping users analyze past market behavior without cluttering the chart.
Alert System: Integrated alerts for detected buy and sell signals based on RSI conditions and the presence or absence of FVGs. This feature notifies traders of potential trading opportunities.
Trading Signals
Buy, Buy+, and Buy++ Signals: These signals are triggered based on overbought conditions without corresponding bearish FVG presence, with increasing stringency for higher tiers of buy signals.
Sell, Sell+, and Sell++ Signals: These signals are based on oversold conditions devoid of bullish FVG presence, with each subsequent plus sign indicating a higher level of confirmation required to trigger the signal.
Use Case
Ideal for traders who rely on technical analysis and are looking for an automated way to spot potential buy and sell points using both price action gaps and momentum indicators.
Customization
All input parameters are adjustable directly from the indicator's settings panel, making it easy to tailor the tool to your trading needs and preferences.

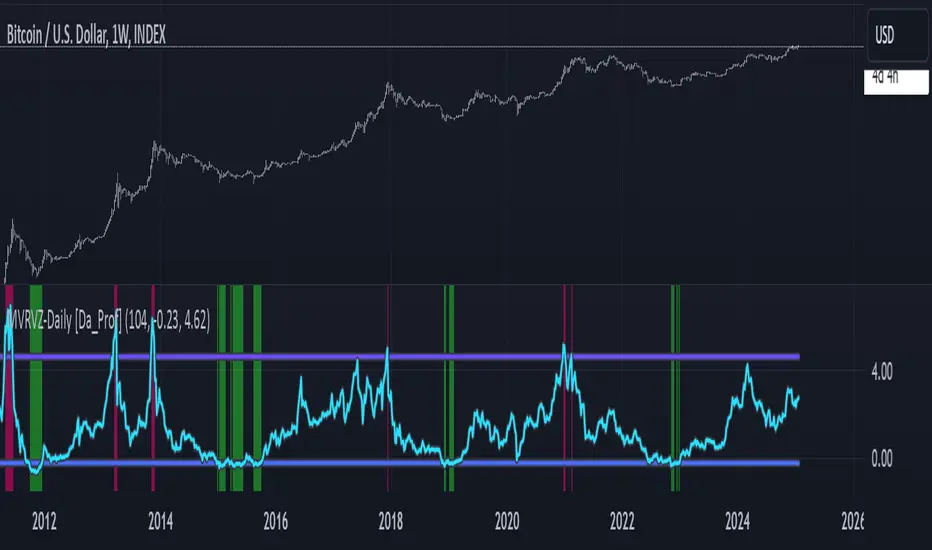
MVRVZ - MVRVZ Top and Bottom Indicator for BTC [Logue]Market Value-Realized Value Z-score (MVRVZ) - The MVRV-Z score measures the value of the bitcoin network by comparing the market cap to the realized value and dividing by the standard deviation of the market cap (market cap – realized cap) / std(market cap)). When the market value is significantly higher than the realized value, the bitcoin network is "overvalued". Very high values have signaled cycle tops in the past and low values have signaled bottoms. For tops, the default trigger value is above 6.85. For bottoms, the indicator is triggered when the MVRVZ is below -0.25 (default).
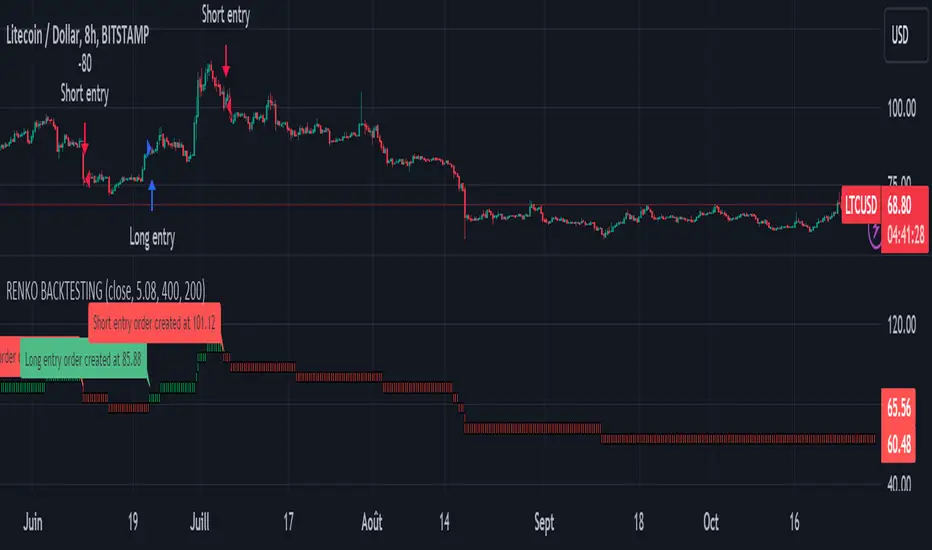
Renko StrategyRENKO STRATEGY
CAUTION : This strategy must be applied to a candlestick chart (not a Renko chart).
INTRODUCTION :
The Traditional Renko chart has been reproduced and is plotted according to the evolution of the price. It will enable us to receive buy or sell signals and follow major trends. This is a medium/long term strategy and depends a lot on the box size chosen in the parameters. There's also a money management method allowing us to reinvest part of the profits or reduce the size of orders in the event of substantial losses.
RENKO CHART :
Renko chart construction methodology :
The user must first choose the box size. The minimum is 0.00001 and there is no maximum. The default is 10. The user must then choose the source that will define the data on which the calculations will be based (high, low, open, close). By default, close is selected. The first candle on the chart is used to draw the first box with its high and low.
Each time the price changes by the amount of the box size relative to the high or low of the last box, a new box is added above or below the previous one. If price variations are less than the box size, the same box is added next to the previous one. If price variations are N (integer number) times greater than box size, N boxes are added above or below the previous one. Each box added above the previous one is a green box, while each box added below the previous one is a red box.
Conditions for drawing a green box above the previous one :
(source - high_of_the_last_box) / box_size > 1
Condition for drawing a red box below the previous one :
(low_of_the_last_box - source) / box_size > 1
If neither condition is triggered, the same box is drawn next to the previous one.
Example :
The last candle has drawn a box with low 12 and high 14. The box size is therefore 2. The strategy will look at the value of the close each time a candle ends. The current candle closes with a close equal to 15.5. As the variation from the previous high is only 1.5 (which is less than the box size), the same box is added next to the previous one. The next candle closes at 16.2. The price variation is therefore 2.2 compared with the previous high. We can now add a new green box just above the previous one, with a low of 14 and a high of 16. The same process applies if the candle's close is at least one box size below the low of the last box. In this case, a new red box is placed below the previous one.
PARAMETERS :
Source : Allows you to specify which data will be taken into account by the strategy when performing calculations. The default is close.
Box size : Size of Renko graph boxes. This is a very important parameter to choose carefully, as it has a strong impact on the strategy's performance. Defaults to 10.
Fixed Ratio : This is the amount of gain or loss at which the order quantity is changed. The default is 400, meaning that for each $400 gain or loss, the order size is increased or decreased by a user-selected amount.
Increasing Order Amount : This is the amount to be added to or subtracted from orders when the fixed ratio is reached. The default is $200, which means that for every $400 gain, $200 is reinvested in the strategy. On the other hand, for every $400 loss, the order size is reduced by $200.
Initial capital : $1000
Fees : Interactive Broker fees apply to this strategy. They are set at 0.18% of the trade value.
Slippage : 3 ticks or $0.03 per trade. Corresponds to the latency time between the moment the signal is received and the moment the order is executed by the broker.
Important : A bot has been used to test all possible box sizes to find out which one generates the highest return on BITSTAMP:LTCUSD while limiting the drawdown. This strategy is the most optimal with a box size equal to 5.08 in 8h timeframe.
BUY AND SHORT SIGNALS :
As the aim of this strategy is to follow major trends based on price movements, we need to be on the right side of price fluctuation. We trade every box reversal, i.e. we are LONG when the boxes are green indicating an uptrend and SHORT when they are red indicating a downtrend.
RISK MANAGEMENT :
This strategy can incur losses. The size of the box is decisive, as it is used to plot the RENKO chart and thus trigger buy or sell signals. It's also what allows us to manage risk. For every trade, we risk a maximum amount equal to 2 times the size of the box, i.e. :(5.08*2*nb_contract)/trade_value.
MONEY MANAGEMENT :
The fixed ratio method has been used to manage our gains and losses. For each gain of an amount equal to the value of the fixed ratio, we increase the order size by a value defined by the user in the "Increasing order amount" parameter. Similarly, each time we lose an amount equal to the value of the fixed ratio, we decrease the order size by the same user-defined value. This strategy not only increases our performance, but also our drawdown.
Enjoy the strategy and don't forget to take the trade :)
[blackcat] L3 SuperJThe SuperJ indicator is a powerful tool that utilizes VWMA (Volume Weighted Moving Average) and ALMA (Arnaud Legoux Moving Average) to filter and enhance the KDJ indicator, resulting in a smoother J line and the creation of the SuperJ indicator. By incorporating TVMA (Triggered Volume Moving Average), the SuperJ indicator can generate trigger signals that can form bullish and bearish crossovers with the J line, creating an oscillating pattern.
The combination of VWMA and ALMA helps to remove noise from the market and provides clearer trading signals. This is particularly useful when the market is highly volatile or the trend is ambiguous. The oscillations of the J line can help traders identify the true trend and avoid being misled by false signals.
Furthermore, by considering the values and trends of the J line in conjunction with other technical analysis tools, traders can make more accurate assessments of market trends and price movements. For example, when combined with moving averages, the SuperJ indicator can enhance the ability to identify price reversal points.
The SuperJ indicator also offers benefits in assessing overbought and oversold conditions in the market. By observing the values and trends of the J line, traders can more accurately evaluate market sentiment and strength. When the J line is above 80, it may indicate an overly optimistic market with a risk of overbought conditions. Conversely, when the J line is below 20, it may indicate an overly pessimistic market with an opportunity for oversold conditions. These signals can assist traders in determining when to buy or sell.
In summary, the SuperJ indicator, derived from the combination of VWMA, ALMA, and TVMA, provides traders with a valuable tool for identifying overbought and oversold conditions, predicting price reversals, and generating high-quality trading signals. Its application as a "buy low, sell high" strategy element is highly effective in maximizing trading opportunities and optimizing profitability.

Double Tops & Bottoms [QuantVue]This indicator is designed to detect and plot Double Tops and Double Bottoms, by setting the initial high or low using standard pivot points.
Double Tops
A Double Top is a bearish reversal pattern, typically found when an uptrend returns back to a prior peak. It signifies a potential turning point or resistance level and could potentially reverse in direction.
The pattern is confirmed as a Double Top when the price breaks above the resistance level, but closes below it. A decisive close below this level is seen as a confirmation of the bearish trend.
Double Bottoms
A Double Bottom, on the other hand, is a bullish reversal pattern typically found after a downtrend. It signals a potential turning point or support level where the price has bottomed and could potentially reverse upwards.
The pattern is confirmed as a Double Bottom when the price breaks below the support level, but closes above it. A decisive close above this level is viewed as a confirmation of the bullish trend.
Indicator Features
🔹Double Top Detection: When a double top is identified, a downward-pointing triangle will be plotted above the bar, and if the alerts are enabled, a notification will be triggered.
🔹Double Bottom Detection: When a double bottom is identified, an upward-pointing triangle will be plotted below the bar, and if the alerts are enabled, a notification will be triggered.
🔹Pivot Lookback: Defines the number of bars to the left and right of the pivot that must be lower/higher to qualify as a pivot.
🔹Maximum Length Between Tops/Bottoms: Maximum number of bars between two tops/bottoms to be considered a double top or bottom.
🔹Style Settings: Allows the user to customize the appearance of the lines indicating the tops/bottoms. Options include color selection, line style (dotted, dashed, or solid), and line thickness.
🔹Alerts: The user can enable or disable alerts for Double Top and Double Bottom.
Give this indicator a BOOST and COMMENT your thoughts!
We hope you enjoy.
Cheers!

RSRS (Resistance Support Relative Strength)The Resistance Support Relative Strength (RSRS) indicator, published by Everbright Securities, is a technical analysis tool that enjoys immense popularity among Chinese quantitative traders, owing to its stellar performance in China's stock markets.
🟠 Principle
The indicator treats daily highs and lows as resistance and support levels respectively. It measures market strength by comparing the magnitude of price changes in daily highs versus lows. Specifically, it fits a linear regression model to the (low, high) data points over the past N days (typically 18) and uses the slope (beta) as the RSRS value. A steeper slope indicates stronger market strength.
🟠 Algorithm
1. Collect the daily low and high prices over the past N days.
2. Apply Ordinary Least Squares to estimate the linear regression model: high = alpha + beta * low. The beta is the RSRS value.
3. Compute the z-score of the RSRS over the past M days (typically 600).
4. Compare the z-score to preset buy and sell thresholds (typically 0.7 and -0.7) to generate trading signals. If z-score > buy threshold, a buy signal is triggered. If z-score < sell threshold, a sell signal is triggered.

Backtests Are BrokenThis script demonstrates a fatal flaw with Trading View backtests involving trailing stops. Trading View assumes the most optimistic case for trailing stops, always giving you the best case high/low of a bar instead of the worst or average case. Within a bar, the price could reverse against your position after the open and trigger your trailing stop for a loss before the price goes in your favor, but Trading View backtests do not consider this and instead always give you the best case returns. This allows a trivial strategy to appear as though it would perform miracles.
This strategy enters on a random bar and sets a trailing stop triggered one tick better than the current price with 0 trailing distance. Trading View then generously gives this strategy the difference between the open price and best possible wick as a profit. The only way this strategy can lose money in simulation is if the price goes straight down after entry and never retraces. It works on all symbols on all timeframes due to this systematic problem with the Trading View backtester.

DB Change Forecast ProDB Change Forecast Pro
What does the indicator do?
The DB Change Forecast Pro is a unique indicator that uses price change on HLC3 to detect buy and sell periods along with plotting a linear regression price channel with oversold and undersold zones. It also has a linear regression change forecast mode to optionally project market direction.
Change is calculated by taking a two-bar change of HLC3 and dividing that by the price or, optionally, a fixed divisor.
A fast-moving change cloud is then calculated and displayed as the "regular version" plot (shown in light gray). When the cloud bottom is above low, a buy zone is detected. When the cloud top is below the high, a sell zone is detected.
The linear regression price channel is calculated similarly but using a much slower change rate. The linear regression price channel shows reasonable high, low and HLC3 ranges. At the bar's opening, the channel will be more compact and come fairly accurate about 1/4 into the bar timeframe.
The change forecasted price is projected on the right side of the current bar to indicate the current timeframe direction. Please note this forecasting feature is shown in orange when it's early in the timeframe and gray when the timeframe is more likely to produce an accurate direction forecast for the upcoming bar.
You can use these projected dashed lines to see possible market movements for the Current bar and possible market direction for the next bar. Kindly note these projects change; they should be used to understand possible extreme highs/lows for the current bar or market direction.
The indicator includes an optional change forecast projection feature hidden by default. It will project the market forecast channel with an offset of 1. The forecast is defaulted to an offset of 1 to show market direction. However, you can modify to zero the offset to show the current bar forecast and forecast history.
How should this indicator be used?
First, very important,
1. Settings > Set Symbol to Desired
2. Settings > Set High Timeframe to "Chart"
3. Settings > Ensure "Use price as divisor" is checked.
It's recommended to use this indicator in higher timeframes. Buy and sell signals are displayed in real-time. However, waiting until 1/4 to 1/2 into the current bar is recommended before taking action, and change can happen.
The buy/sell signals (zones) provide recommendations on playing a long vs. a short. When in a buy sone, only play longs. When in a sell zone, only play shorts.
Then use the linear regression price channel oversold and undersold zones to optionally open and close positions within the buy/sell zones.
For example, consider opening a long in a buy zone when the linear regression price channel shows undersold. Then consider closing the long when the price moves into the linear regression oversold or higher. Then repeat as long as it's in the buy zone. Then vice versa for sell zones and shorting.
At basic design, buy in the buy zone, sell or short in the sell zone. If you are up for higher trading frequencies, use the linear regression price channel as described in the example above.
Please note, as, with all indicators, you may need to adjust to fit the indicator to your symbol and desired timeframe.
This is only an example of use. Please use this indicator as your own risk and after doing your due diligence.
Does the indicator include any alerts?
Yes,
"DB CFHLC3: Signal BUY" - Is triggered when a buy signal is fired.
"DB CFHLC3: Signal SELL" - Is triggered when a sell signal is fired.
"DB CFHLC3: Zone BUY" - Is triggered when a buy zone is detected.
"DB CFHLC3: Zeon SELL" - Is triggered when a sell zone is detected.
"DB CFHLC3: Oversold SELL" - Is triggered when the price exceeds the oversold level.
"DB CFHLC3: Undersold BUY" - Is triggered when the price goes below the undersold level.
Any other tips?
Once you have configured the indicator for your symbol and chart timeframe. Meaning the plots are displayed over the price. Check out larger timeframes such as W, 2W, 3W, 4W, M, and 4M. It works wonderfully for showing market lows and highs for long-term investing too!
Another, tip is to combine it with your favorite indicator, such as TTM Squeeze or MACD for confirmation purposes. You may be surprised how fast the indicator shows market direction changes on higher timeframes.
You can just as easily use a high timeframe such as D, 2D, or 3D for day trading due to how the linear price channel works.
Why am I not selling this indicator?
I would like to bless the TradingView community, and I enjoy publishing custom indicators.
If you enjoy this indicator, please consider leaving a thumbs up or a comment for others to know about your experience or recommendations.
Enjoy!
DCA RSI Add funds exit simulatorThis script helps with planning on how to exit DCA deals that are in the negative.
The following deal information is required
- Current average position price
- Funds invested
- Required take profit
Additional indicator settings are
- The date/time on which to start the simulator
- Minimum deviation % to start adding funds
- Expected bounceback from when funds are added
The RSI trigger
Adding funds is triggered when the selected RSI settings yield a value that is at or beyond the selected threshold.
How it works
The amount of funds needed are calculated based on the supplied settings, such that the new average price matches the expected bounceback.
It will also show if the exit strategy has failed to hit the TP (this happens when the RSI threshold is hit again)
