Weekday Signal [QuantAlchemy]### Weekday Signal Indicator
#### Overview
The "Weekday Signal " indicator offers a method for triggering entry and exit signals based on specific weekdays and defined trading sessions. This allows traders to tailor their strategies to time slots and days, ensuring strategic execution and optimal trading periods.
Additionally, this indicator exposes signals for external use in other scripts, enabling integration with additional trading strategies or indicators, thereby enhancing its utility and flexibility for trading systems.
#### Definitions
- **Weekday Signal**: An indicator designed to trigger entry and exit signals based on specific weekdays within defined trading sessions.
- **Time Zone**: The local or preferred time zone setting to match market hours across global exchanges.
- **Trading Session**: The specific hours within a day when the trading signals are active.
#### Plots
- **Enter Signal**: Plots a signal when the conditions for entering a trade are met.
- **Exit Signal**: Plots a signal when the conditions for exiting a trade are met.
#### Properties
- **Flexible Time Zones**: Allows users to set their preferred time zone to align with global market hours.
- **Customizable Entry and Exit Days**: Users can select specific weekdays for entry and exit signals.
- **Defined Trading Sessions**: Users can define trading session hours to restrict signals to optimal market times.
- **Visual Indicators**: Provides clear visual plots and background colors on the chart to indicate when entry and exit criteria are met.
- **Dual Group Configuration**: Separate controls for entry and exit setups, offering flexibility in managing trading signals.
#### How to Read
1. **Green Background**: Indicates a potential entry signal.
2. **Red Background**: Indicates a potential exit signal.
3. **Status Line and Data Window**: Shows a value of 1 when an entry or exit condition is met and 0 otherwise.
#### Proposed Interpretations
- **Entry Signals**: When the background turns green and the status line/data window shows a value of 1, it indicates a potential time to enter a trade based on the selected weekday and session.
- **Exit Signals**: When the background turns red and the status line/data window shows a value of 1, it indicates a potential time to exit a trade based on the selected weekday and session.
#### Essential Knowledge
- **Weekdays and Trading Sessions**: Understanding the significance of specific trading days and sessions can help in optimizing trade timings.
- **Time Zones**: Correctly setting the time zone ensures alignment with market hours and accurate signal generation.
#### Deeper Concepts
- **Signal Filtering**: The script uses the `time_filter` library to determine if the current time falls within the defined entry or exit periods.
#### Typical Use Cases
- **Intraday Trading**: Traders who want to restrict their trades to specific weekdays and trading sessions.
- **Strategy Integration**: Users can integrate the signals from this indicator into broader trading strategies or other Pine Scripts using the signals as an external reference to an input.
#### Limitations
- **Time Zone Settings**: Incorrect time zone settings can lead to misaligned signals.
- **Trading Sessions**: Signals are limited to the defined trading session hours, which may not cover all market conditions.
#### Final Thoughts
The "Weekday Signal " indicator is a tool for traders looking to refine their entry and exit points based on specific days and sessions. By leveraging customizable time zones and trading sessions, traders can refine their strategic execution.
#### Disclaimer
This indicator is for educational purposes only and should not be construed as financial advice. Trading involves risk, and you should consult with a qualified financial advisor before making any trading decisions.
Cari skrip untuk "trigger"

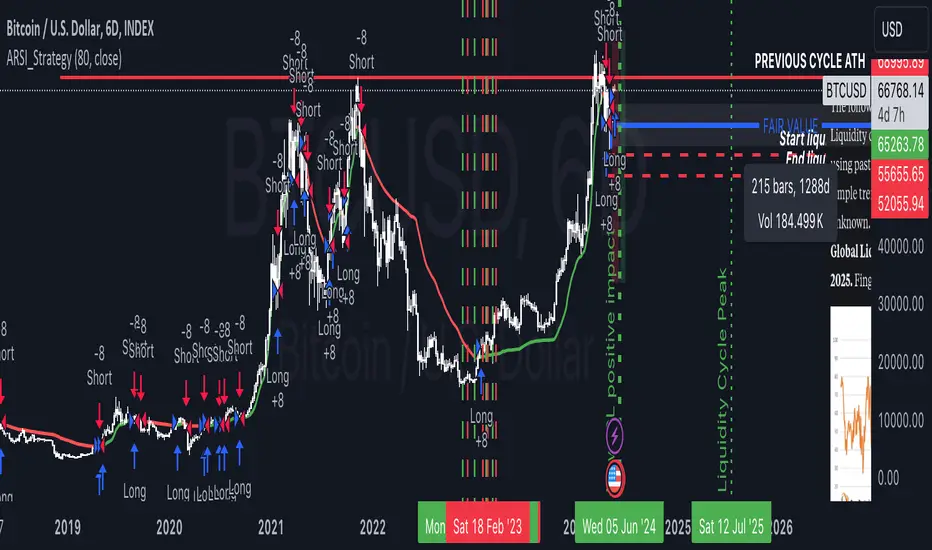
Adaptive RSI StrategyThe Adaptive RSI Strategy is designed to give you an edge by adapting to changing market conditions more effectively than the traditional RSI. By adjusting dynamically to recent price movements, this strategy aims to provide more timely and accurate trade signals.
How Does It Work?
You can set the number of periods for the RSI calculation. The default is 14, but feel free to experiment with different lengths to suit your trading style.
Choose the price data to base the RSI on, typically the closing price.
Decide if you want the strategy to visually highlight upward and downward movements of the Adaptive RSI (ARSI) on the chart. This can help you quickly spot trends.
Adaptive Calculation:
Alpha: The strategy uses an adaptive factor called alpha, which changes based on recent RSI values. This makes the RSI more sensitive to recent market conditions.
Adaptive RSI (ARSI): This is the core of our strategy. It calculates the ARSI using the adaptive alpha, making it more responsive to price changes compared to the traditional RSI.
Trade Signals:
Long Entry (Buy Signal): The strategy triggers a buy signal when the ARSI value crosses above its previous value. This indicates a potential upward trend, suggesting it's a good time to enter a long position.
Short Entry (Sell Signal): Conversely, a sell signal is triggered when the ARSI value crosses below its previous value, indicating a potential downward trend and suggesting it's a good time to enter a short position.
Visual Representation:
If you enable the highlight movements feature, the ARSI line on the chart will change color: green for upward movements and red for downward movements. This makes it easier to see potential trade opportunities at a glance.
Why Use the Adaptive RSI Strategy?
Responsiveness: The adaptive nature of this strategy means it's more sensitive to market changes, helping you react quicker to new trends.
Customization: You can tailor the length of the RSI period and decide whether to highlight movements, allowing you to adapt the strategy to your specific needs and preferences.
Visual Clarity: Highlighting the ARSI movements on the chart makes it easier to spot trends and potential entry points, giving you a clearer picture of the market.
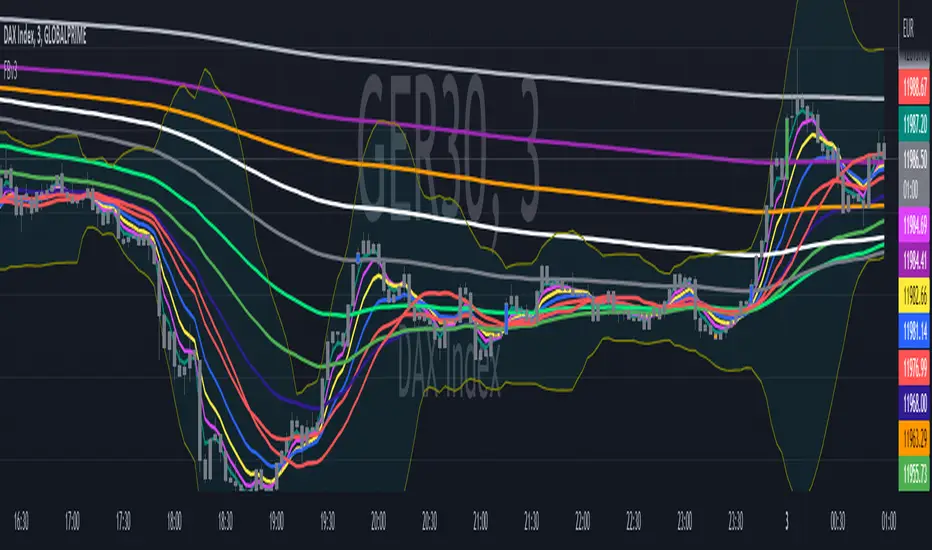
Triple MA HTF strategy - Dynamic SmoothingThe triple MA strategy is a simple but effective method to trade the trend. The advantage of this script over the existing triple MA strategies is that the user can open a lower time frame chart and select higher time frame inputs for different MA types mainting the visibility on the chart. The dynamic smoothing code makes sure the HTF trendlines are not jagged, but a fluid line visiable on the lower time frame chart. The script comes with a MA crossover and crossunder strategy explained below.
Moving Averages (MA) Crossover for Entry:
Long Entry: A long entry signal is triggered when the moving average line 1 crosses above the moving average line 2. This crossover indicates a potential shift in market sentiment towards the upside. However, to validate this signal, the strategy checks if the moving average 3 on a higher time frame (eg. 4 hour) is in an upward trend. This additional filter ensures that the trade aligns with the prevailing trend on a broader time scale, increasing the probability of success.
Short Entry: Conversely, a short entry signal occurs when the moving average line 1 crosses below the moving average line 2. This crossover suggests a possible downturn in market momentum. However, for a short trade to be confirmed, the strategy verifies that the moving average 3 on the higher time frame is in a downward trend. This confirmation ensures that the trade is in harmony with the overarching market direction.
Exit from Long Position: The strategy triggers an exit signal from a long position when the moving average line 1 crosses below the moving average line 2. This crossover indicates a potential reversal in the market trend, prompting the trader to close their long position and take profits or minimize losses.
Exit from Short Position: Similarly, an exit signal from a short position occurs when the moving average line 1 crosses above the moving average line 2. This crossover suggests a potential shift in market sentiment towards the upside, prompting the trader to exit their short position and manage their risk accordingly.
Features of the script
This Triple MA Strategy is basically the HTF Trend Filter displayed 3 times on the chart. For more infomation on how the MA with dynamic smoothing is calculated I recommend reading the following script:
For risk management I included a simple script to opt for % of eauity or # of contracts of in the instrument. For explanation on how the risk management settings work I refer to my ealier published script:
The strategy is a simplified example for setting up an entry and exit logic based on multiple moving avarages. Hence the script is meant for educational purposes only.

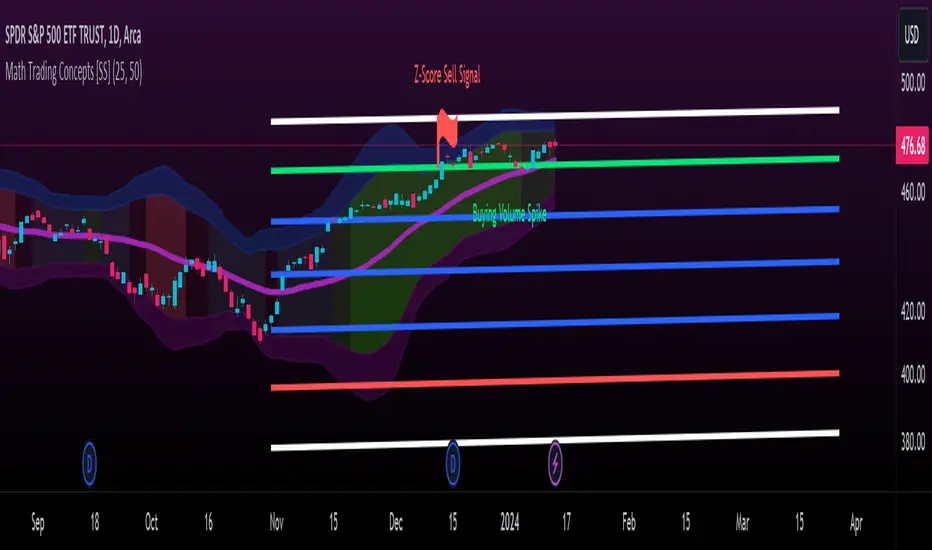
Math Trading Concepts [SS]Presenting a mashup of the key elements I use for day-to-day trading: Volume, Z-Score, Autoregressive Forecasting, and a new addition, ANOVA analysis of variance.
I've aptly named it "Math Trading Concepts" in a nod to established trading concepts like "Smart Money" and "liquidity," but it's also fitting because these elements are fundamental to most quantitative/mathematical trading strategies.
What does it do?
The indicator visualizes Z-Score bands over a user-selected lookback period (defaulted to 14), akin to Bollinger Bands. Within these bands, it provides additional data, including trend identification. Uptrends are displayed in varying shades of green (brighter for stronger trends), while downtrends appear in red (with intensity reflecting strength).
Now, let's delve into each point individually:
Volume:
The indicator converts volume into a Z-Score over the specified lookback period. It distinguishes between buying and selling volume, calculating separate Z-Scores for each. A signal is triggered when the Z-Score exceeds 2 (for buying) or falls below -2 (for selling).
Z-Score:
The Z-Score clouds represent the outer parameters of the standard deviation over the lookback period (set at 2 and 3). Users can adjust the lookback time, and the indicator analyzes previous Z-Score reversal areas over the last 75 candles, signaling buy or sell based on historical reversals.
If you want to make it like BB, select the lookback length for the Z-Score at 25.
Autoregressive Forecasting:
This unique approach to autoregressive forecasting involves regressing a lagged variable while incorporating a time element. The time length is auto-determined based on the strongest trend. The indicator plots both autoregressed highs and lows.
ANOVA:
ANOVA, a discovery of mine, is introduced here. It reliably triggers significant readings before a pivot or breakout by measuring variance between means. When a statistically significant ANOVA occurs using the high, low, and close lagged values, it indicates an impending significant market move. While ANOVA alerts are not specific about the nature of the move, complementary tools like Volume, trend analysis, and Z-Bands provide additional insights.
Expect more educational content on ANOVA in the future, given its unique discovery. I was hoping to do one before releasing anything ANOVA based but alas, I haven't had the time!
The remainder of the indicator is self-explanatory. Feel free to ask any questions that arise or were not addressed in this description.
Special thanks to @Trendoscope for his arrays library which has made it possible for you to use the autoregression forecast while actively trading without it intruding on the chart :-).
Safe trades, everyone!
Buy Below Prev_Low. Sell 100% Above Avg. Pyramiding.This is simple indicator script for long term investors. It will check if the low of today is less than low of yesterday (or any time frame candle) and if the condition is satisfied, then the alert will be triggerred and that particular stock will be bought.
Each time a unit is bought, the average price is calculated and also the trget selling price, which is set at 100% above the average buying price. So once the price reaches that selling price target, the entire holding is sold.
The code resets all the variables back to 0 once a sell signal is triggerred.

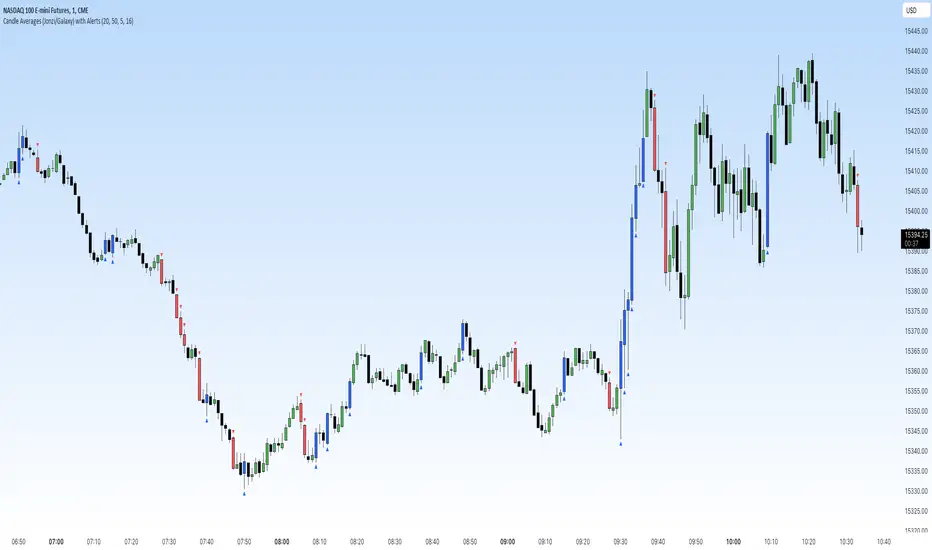
Candle Averages (Jonzi/Galaxy) with AlertsThis indicator is used to highlight outlying candles.
Our script takes the average of the trailing candles and then highlights and/or places a symbol at the candles outside the average.
Example: Your settings use the previous 20 candles and combine the range of each candle.
Divide by 20 and get the average. Let's assume the average is $10
Now if you have your settings at highlighting candles 50% larger than the average, once a candle gets to $15, the indicator would trigger the candle to be highlighted and/or place a symbol of your choice.
In case you don't want to pay attention to the consolidation, you can use the alerts feature. Just go on the timeframe you'd like to be notified on, set an alert for either a down close or up close trigger.
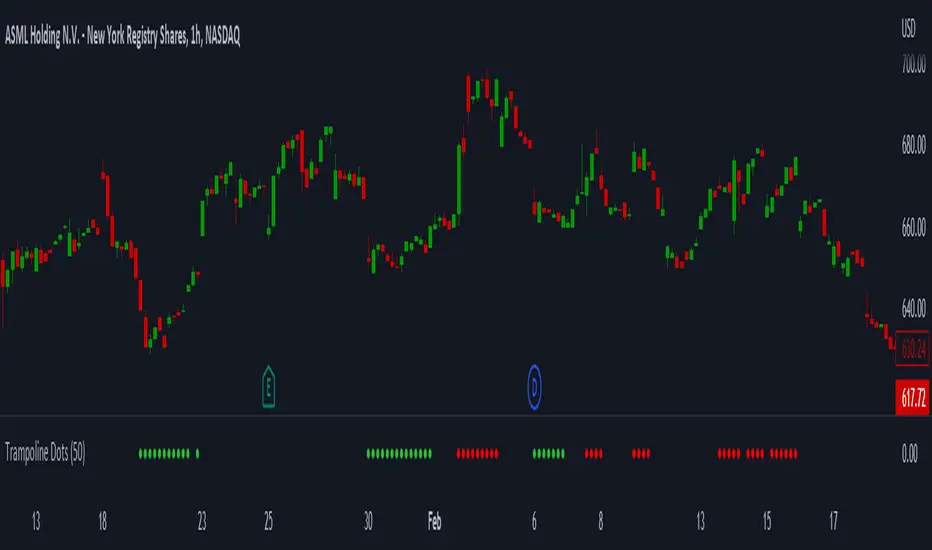
Trampoline DotsTrampoline Dots (Price Divergence)
Higher Time Frame Price Divergence:
Trampoline Dots serve as a "quick bounce" tool. These little dots will trigger whenever the higher aggregation MACD is above / below zero and the price is below / above the 50 period simple moving average. When these criteria are met, the price is usually under pressure of strong divergence, more often than not price will sharply reverse into the trend direction usually within the next few bars.
The Use of The Trampoline Dots:
This indicator can serve multiple ways. Obviously the main use case is the price divergence. These "dots" will not give you any precise & exact entry. But rather a zone of possible incoming reversal. There is no timing to it. All these dots will do is warn you about potential sharp reversal in the upcoming bars. It can be used by itself alone for sure, but the best way to utilize the dots is to use them in combination of other trend or momentum studies. The best signals are the ones that are within the larger time frame trend. Another great thing is that the visuals are really straight-forward and simple. It is either green dot or a red dot. Nothing more, nothing less. Also since the indicator is pretty small, it can be easily layered onto other studies as well which can create an additional confirmation for different patterns or setups.
Which Time Frame Are Reliable?
This indicator works on any time frame. But the most "stable" one is the daily & hourly time frame. My personal favorite is the hourly since these divergences can produce amazing entries in the daily trends (which are usually hidden on the daily chart). In the most aggresive trends, I like to see the green dots triggering around the 8 EMA and 13 EMA. Daily chart can show the daily and weekly (big divergences) that can take multiple days & weeks to resolve.
Hope it helps.
[MAD] almost RSII continue to add things to the multibit ready indicators:
This is a modified RSI indicator with some useful additions to make it bottrading ready:
Centered around 0, so from +50 to -50.
Short-Triggerline
Long Triggerline
following value mods are possible:
POW factor --> rsi^POW
final smoothings:
SMA smoothing (level 1)
EMA smoothing (level 2)
switch all smoothings on/off
signals on:
Crossout (moves outside the high/low).
Crossin (moves back inside the high/low)
Direction change outside
Direction change inside
Signal filter output
This is a multibit capable indicator, so signal and filter can be exported to a multibit capable daisychain.
More information can be found here:
have fun
Fibonacci EMA's with Bollinger Bands [Feniks]Many Fibonacci EMAs are calculated and then tracked using custom-colored candlesticks so that your chart remains very clean. This setup is mainly used for scalping on the 2min. Feniks uses gray candlesticks and then all of the custom-colored candlesticks to know when to react to price action.
WARNING: Do your own due diligence and try it out. Also, the script's default colors were determined with the chart's candlesticks being gray for both bullish/bearish candles. You'll probably have to change some of the colors to make use of the script if your chart's candlesticks are not similarly configured.
The main two strategies involve the 13/55 and 21/233.
The 13 EMA (blue) crosses above or below the 55 EMA (green).
- 13/55 Crossover is shown by the triggering candlestick being blue.
- 55/13 Crossunder is shown by the triggering candlestick being orange.
- (Alerts 1/2)
The 21 EMA (red) crosses above or below the 233 EMA (white).
- 21/233 Crossover is shown by the triggering candlestick being green.
- 233/21 Crossunder is shown by the triggering candlestick being red.
- (Alerts 3/4)
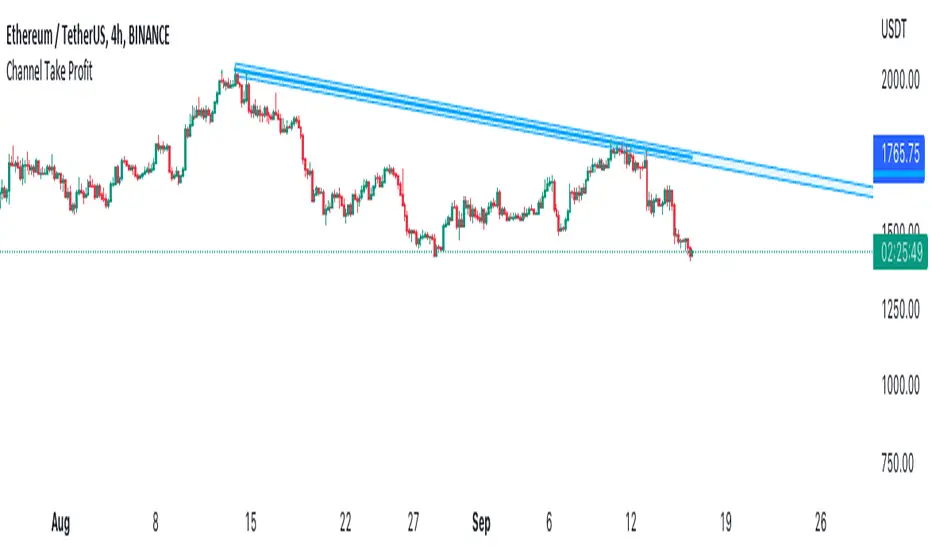
Channel Take Profit Tool for AlertatronWhat is this for
This tool is designed as a companion to an automated strategy running on Alertatron. Sometimes when a strategy opens a trade, you decide that based on TA you would like to close all or or a portion of your trade at a support or resistance level. The strategy may already be programmed to take profit but this tool allows you to add additional take profit criteria that can trigger an alert to Alertatron if it happens before the strategy closes.
How to use it
When you add the indicator to your chart, it will ask you to select two points on the chart. These two points will be connected by a line and create the parallel channel that will be used for triggering a take profit alert. The offset is how wide you want the channel to be. When the high or low of a candle enters the channel from either direction, the alert will be fired. AFTER you add the indicator to the chart and configure ALL of the settings, you need to create an alert on the indicator for "All Alert Functions" and paste your incoming alert webhook from Alertatron into the webhook input.
Alertatron Setup
You will need to provide the API name that you have configured in Alertatron that matches the account the trade is open in. This tool supports ByBit and FTX.us by may work with other exchanges too (this option just chooses which currency/pair divider is used in the alert message).
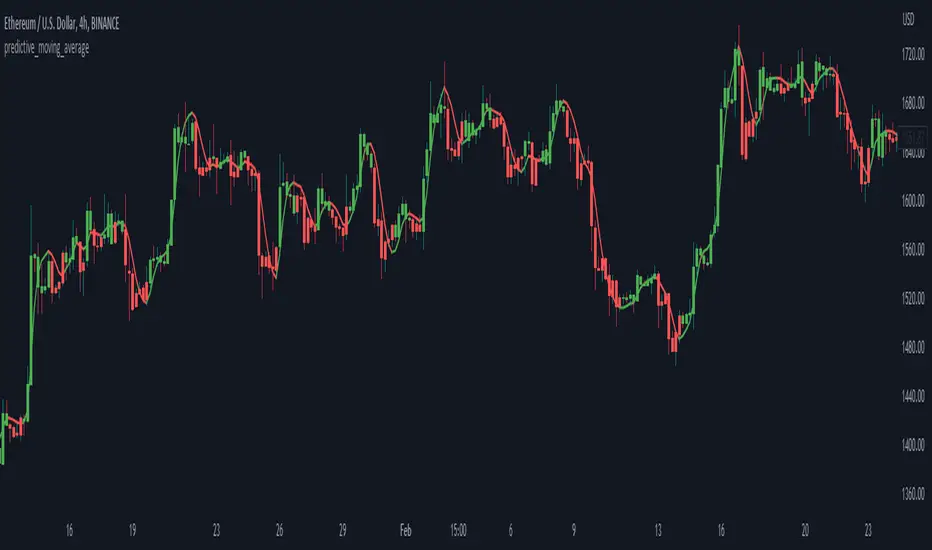
predictive_moving_average
Description:
Originated by John F. Ehlers, could be found within (Rocket Science for Traders, pg. 212). Aim to provide a leading indicator (I assumed for the shorter time period), which smoothed the price with no lag. The indicator derives from 2 lines crossing i.e. a weighted moving average, of higher length as a predictor and shorter length as a trigger.
Predictive Moving Average:
predict = 2*wma1 - wma2
trigger = (4*predict+3*predict +2*predict +predict)/10
Feature:
Predictive moving average
Deviation band
Notes
Consider the support/resistance (dynamic) when entering the position
Some short direction change might be identified from deviation shrink
Green indicates to enter/long, while red indicates to close/short position
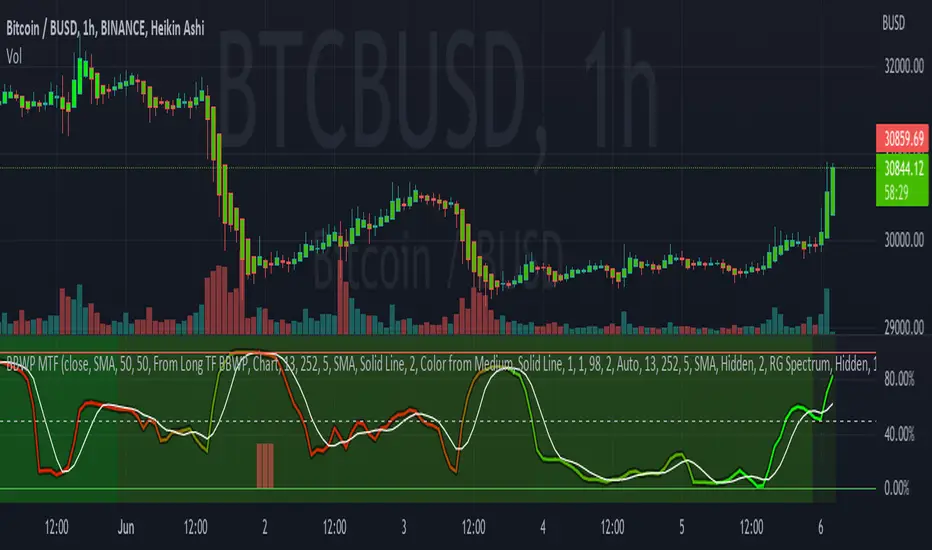
Bollinger Band Width Percentile - Multi Time FrameMy plan with this indicator was when trading at short timeframes, to modify my expectations on the potential impact of short term volatility based on volatility in longer timeframes, and when trading on longer timeframes to attempt to find an optimal entry point based on shorter term volatility.
The BBWP is calculated for a short, medium and long timeframe, alerts are triggered at extremities with the ability to filter by moving averages and chart movement. The alerts also trigger a plot to the "Backtest Signal" which can be used to trigger trades in a backtester.
Please see the discussions of how I'm using this indicator in the comments below.
Thanks to The_Caretaker for "Bollinger Band Width Percentile" upon which this multi time frame version is based.
B.Bands | Augmented | Intra-range | Long-OnlyHere you have the essential trading engine based on Bollinger Bands .
The idea behind is to trade the intra-range of the bands.
How is going to work?
Define which Bollinger Bands we want to use. Classic Bollinger Bands or Augmented Bollinger Bands . Without selecting, the algorithm doesn't show a strategy.
Define the length of the Moving Average and the Standard Deviation by default the classic 20-2.
Define the Bollinger Bands Spread Max Range (Upper-Lower) to be able to determine wheter or not you're in a price range or potential breakout.
Define data source to trigger exit and entry points.
Define profit based on Middle Band or Opposite Band.
Define Stop Loss % and activate Trailing Stop if desired with the percentage required.
Determine if you want to sell only on profit after triggering the entry signal. * Note Stop Loss remains activated.
Choose a date range if you want to study a specific period.
Bear in mind, this is the essential trading engine, open for you to test, try and improve under your requirements. You can determinate when is the ideal market to implement it based on many other indicators. Maybe you wish to change the stop loss settings for ATR, previous low, etc. Totally up to you.
Note the script comes with initial capital, fee % and slippage by deault. This may change for your assets. Make sure you define it in advance.
NOTE: If you trade assets such BTC, you must update the initial capital. By default 5000 (USD) The script doesn't support fraction trading such 0.01BTC.
Will be updated on next version.
Feel free to get in touch if you've got any question.

RSI Trend StrategyThis script uses the logic that within a trending market, there is no such thing as overbought and oversold..
BUY / SELL alert triggers when ADX > 100, and RSI is > 70 (buy) or < 30 (sell). I only consider taking a trade when BUY / SELL alert is triggered, but also only when there is a clear strong trend (you can use MA or Price Action for this). The logic does not work when market is not trending!
Test it out and let me know how it is working for you.

Profit Percentage TrackerThis script provides a quick and easy way to visualize profits in a chart, based on the given entry date and price.
Optionally, alerts can be sent when profits cross up the given " profit unit ".
In short:
Tracks how much profit one could take based on the input " entry date " and the input " entry price "
These inputs are interactive (www.tradingview.com)
Displays the result in a label on top of the last candle
(Optional) Sends alerts based on the given " profit unit ", that is: if ' 0.5 ' is given, then an alert is triggered every time the profit is raised by that number
(Be careful with low values, as TradingView could stop an alert if it triggers too much.)
For alerts to be displayed, a " script alert " must be created right after the script was added to the chart:
- www.tradingview.com
(Choose ' Profits ' as condition and ' Any alert() function call ')
Good to know: if you check " Notify on app ", alerts can be delivered directly to your phone:
i.imgur.com
Prerequirements :
The chart's timezone has to be set to " Exchange " (this is required in order to support the alert's logic):
- kodify.net

Bjorgum AutoTrailOne Time Trade Risk Management
Incorporating the new interactive feature, this script is meant as a one time trailing stop for the active trader to manage positional risk of an ongoing trade. As a crypto trader or Fx trader, many may find themselves in a position late into the evening, or perhaps daily life is calling while a trade progresses in their favor. Adding a trailing stop to a position thats trending can help to keep you in the trade and lock in gains if things turn around when you are unable to react.
To use the trail, the user would add the script to the chart. Once added, a set of crosshairs will appear allowing the user to choose a point to begin. Often choosing to start a trail from a swing high/ low can be an ideal option. This tends to provide some protection for a stop by placing it under support for a long trade or above resistance for a short trade.
Price based trail
The trail will automatically plot and the offset is a factor of the distance from price action selected by the crosshairs. If placed above price action the script will plot a short trail, if placed below it will trail for a long position.
Additionally, there are several other trail types other than price based. There is also percent based, which offsets the trail as a percent from close. A hard stop is placed at the cross hair value, then once the distance is exceeded by the percentage specified, the trail begins.
There are 2 more volatility based trails. There is a PSAR trail which can provide quicker and tighter stops that accelerate with the trend locking in gains faster, and an ATR trail that keeps a distance from price action as a function of volatility. Volatility levels can be adjusted from the menu.
Volatility based trail (ATR)
Volatility based trail (PSAR)
Lastly, within the code for more the more technical savvy, is some starting setups for string alerts to be sent to exchanges via 3rd party or custom API applications. Some string manipulation is required for specific providers to meet their requirements, but there is some building block alerts that will take the ticker symbol, recognize the asset your trading (Fx, Crypto, etc) and take input quantity or exchange names from the settings via inputs.
Complex strings can be built to perform almost any trade related task when to comes to alerts via web hook. A little setup this way with some technology to back your system can mean a semi-automated half man, half machine setup that actually manages your trail stop while you cannot. For those that don’t go this far, there is some basic alert functionality that well trigger when a trail is hit so you can react and make a decision.
Please note that for now, interactive mode is engaged only when the script is added to the chart. Additional stops, or for adjustments to be made it is best to add a new version. Also as real trades could be at play managing an actual position, alerts are designed to go off only once to ensure no duplicate orders are sent meaning alerts are not reoccurring. Once an alert is triggered, a new trail is to be set up.
A modified version of the TradingView built in SAR equation was used in this script. To provide the value of the SAR on the stop candle, it was necessary to alter the equation to extract this value as the regular SAR “flips” at this point. Thank you to TradingView for supplying access to the built in formula so that this SAR could behave the same as the built-in function outside of these alterations
Example of SAR value maintained in trigger candle
Cheers and happy trading.

MultiAlert, MultiTargets + TickersThis is my first script, completely made from scratch. Bear with me.
Script that allows one to set an alert for Multiple Price Levels, on Multiple Tickers, complete with Dynamic Messages showing you which ticker, at which price, at which alert (Stop loss, Target 1 etc.), set to Once Per Bar.
Select Ticker, type in price levels that you have for targets & stop loss, move on to the next, or don't and leave 0 and blank.
Disable the targets you do not need in STYLE tab to disable plotting & scaling, leave unused tickers & targets blank & 0.
Create Alert, select this indicator, anyfunction() alert.
MAKE SURE to remake the alert every time you change something, they are not smart enough to change as you change things. Can Confirm by using the numbers in the alert name. You will also have to set the profit level or stop loss to zero every time it triggers to avoid triggered again.
In fact, you do not need the indicator active at all. Add it to a chart and hide it by clicking on the little eyeball icon, to make an alert open the settings for the indicator and type in your targets like normal. Indicator will remain invisable.
I have not found a way to dynamic message the alert name, or else I would.
DISCLAIMER: NONE OF THIS IS FINANCIAL ADVICE. You are completely responsible for whatever happens to you. Do not use the targets in this chart. Do your own research before trading.
3Commas Bollinger StrategyThis strategy is intended for use as a way of backtesting various parameters available on 3commas.io composite bot using a bollinger band type trading strategy. While it's primary intention is to provide users a way of backtesting bot parameters, it can also be used to trigger a deal start by either using the {{strategy.open.alert_message}} field in your alert and providing the bot details in the configuration screen for the strategy or by including the usual deal start message provided by 3commas. You can find more information about how to do this from help.3commas.io
The primary inputs for the strategy are:
// USER INPUTS
Short MA Window - The length of the Short moving average
Long MA Window - The length of the Long moving average
Upper Band Offset - The offset to use for the upper bollinger offset
Lower Band Offset - The offset to use for the lower bollinger offset
Long Stop Loss % - The stop loss percentage to test
Long Take Profit % - The Take profit percentage to test
Initial SO Deviation % - The price deviation percentage required to place to first safety order
Safety Order Vol Step % - The volume scale to test
3Commas Bot ID - (self explanatory)
Bot Email Token - Found in the deal start message for your bot (see link in previous section for details)
3Commas Bot Trading Pair - The pair to include for composite bot start deals (should match format of 3commas, not TradingView IE. USDT_BTC not BTCUSDT)
Start Date, Month, Year and End Date, Month and Year all apply to the backtesting window. By default it will use as much data as it can given the current period select (there is less historical data available for periods below 1H) back as far as 2016 (there appears to be no historical data on Trading view much before this). If you would like to test a different period of time, just change these values accordingly.
Known Issues
Currently there are a couple of issues with this strategy that you should be aware of. I may fix them at some point in the future but they don't really bug me so this is more for informational purposes than a promise that they may one day be fixed.
Does not test trailing take profit
Number of safety orders and Safety Order Step Scale are currently not user configurable (must edit source code)
Using the user configuration to generate deal start message assumes you are triggering a composite bot, not a simple bot.

TradingView Alerts to MT4 MT5 - Forex, indices, commoditiesHowdy Algo-Traders! This example script has been created for educational purposes - to present how to use and automatically execute TradingView Alerts on real markets.
I'm posting this script today for a reason. TradingView has just released a new feature of the PineScript language - ALERT() function. Why is it important? It is finally possible to set alerts inside PineScript strategy-type script, without the need to convert the script into study-type. You may say triggering alerts straight from strategies was possible in PineScript before (since June 2020), but it had its limitations. Starting today you can attach alert to any custom event you might want to include in your PineScript code.
With the new feature, it is easier not only to execute strategies, but to maintain codebase - having to update 2 versions of the code with each single modification was... ahem... inconvenient. Moreover, the need to convert strategy into study also meant it was required to rip the code from all strategy...() calls, which carried a lot of useful information, like entry price, position size, and more, definitely influencing results calculated by strategy backtest. So the strategy without these features very likely produced different results than with them. While it was possible to convert these features into study with some advanced "coding gymnastics", it was also quite difficult to test whether those gymnastics didn't introduce serious, bankrupting bugs.
//////
How does this new feature work? It is really simple. On your custom events in the code like "GoLong" or "GoShort", create a string variable containing all the values you need inside your alert and this string variable will be your alert's message. Then, invoke brand new alert() function and that's it (see lines 67 onwards in the script). Set it up in CreateAlert popup and enjoy. Alerts will trigger on candle close as freq= parameter specifies. Detailed specification of the new alert() function can be found in TradingView's PineScript Reference (www.tradingview.com), but there's nothing more than message= and freq= parameters. Nothing else is needed, it is very simple. Yet powerful :)
//////
Alert syntax in this script is prepared to work with TradingConnector. Strategy here is not too complex, but also not the most basic one: it includes full exits, partial exits, stop-losses and it also utilizes dynamic variables calculated by the code (such as stop-loss price). This is only an example use case, because you could handle variety of other functionalities as well: conditional entries, pending entries, pyramiding, hedging, moving stop-loss to break-even, delivering alerts to multiple brokers and more.
//////
This script is a spin-off from my previous work, posted over a year ago here: Some comments on strategy parameters have been discussed there, but let me copy-paste most important points:
* Commission is taken into consideration.
* Slippage is intentionally left at 0. Due to shorter than 1 second delivery time of TradingConnector, slippage is practically non-existing.
* This strategy is NON-REPAINTING and uses NO TRAILING-STOP or any other feature known to be causing problems.
* The strategy was backtested on EURUSD 6h timeframe, will perform differently on other markets and timeframes.
Despite the fact this strategy seems to be still profitable, it is not guaranteed it will continue to perform well in the future. Remember the no.1 rule of backtesting - no matter how profitable and good looking a script is, it only tells about the past. There is zero guarantee the same strategy will get similar results in the future.
Full specs of TradingView alerts and how to set them up can be found here: www.tradingview.com

LZ IndicatorThis indicator will trigger based on these conditions:
If the average price today is less than 50% of the past 4 days, the indicator will be triggered as 1 (true). Else, the indicator will trigger as 0 (false).

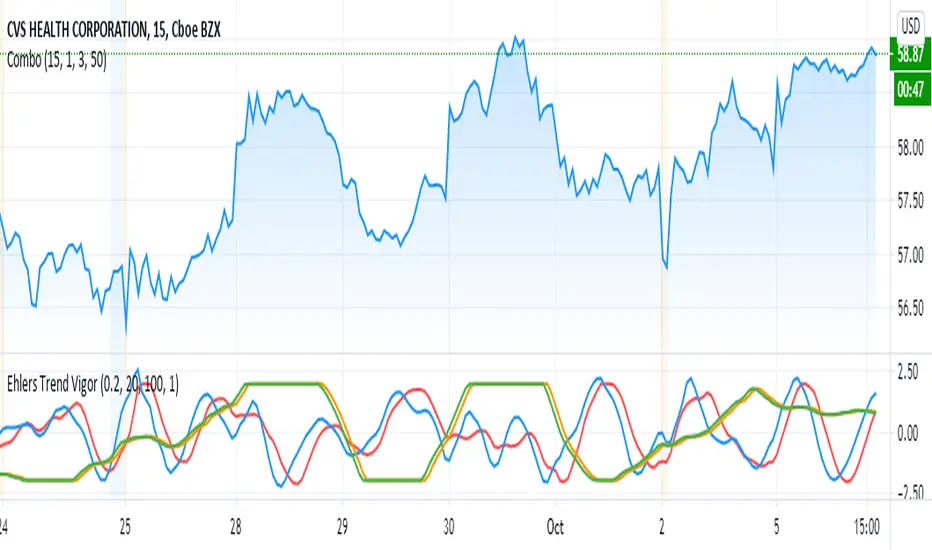
Ehlers Trend Vigor NormalizedThanks to MasBart, I updated the earlier version to normalize signal and lead according to vigor and trigger. Vigor and trigger are limited to +-2. Now signal and lead are also in that range.
The code of interest is lines 39-43:
tmpdif = (BP - nz(BP ))/close
a = array.new_float(0)
for i = 0 to win-1
array.push(a, tmpdif )
den = array.max(a)
den is then used to normalize the BP values (bandpass filter).
Grid Like StrategyIt is possible to use progressive position sizing in order to recover from past losses, a well-known position sizing system being the "martingale", which consists of doubling your position size after a loss, this allows you to recover any previous losses in a losing streak + winning an extra. This system has seen a lot of attention from the trading community (mostly from beginners), and many strategies have been designed around the martingale, one of them being "grid trading strategies".
While such strategies often shows promising results on paper, they are often subjects to many frictions during live trading that makes them totally unusable and dangerous to the trader. The motivations behind posting such a strategy isn't to glorify such systems, but rather to present the problems behind them, many users come to me with their ideas and glorious ways to make money, sometimes they present strategies using the martingale, and it is important to present the flaws of this methodology rather than blindly saying "you shouldn't use it".
Strategy Settings
Point determines the "grid" size and should be adjusted accordingly to the scale of the symbol you are applying the strategy to. Higher value would require larger price movements in order to trigger a trade, as such higher values will generate fewer trades.
The order size determines the number of contracts/shares to purchase.
The martingale multiplier determines the factor by which the position size is multiplied after a loss, using values higher to 2 will "squarify" your balance, while a value of 1 would use a constant position sizing.
Finally, the anti-martingale parameter determines whether the strategy uses a reverse martingale or not, if set to true then the position size is multiplied after any wins.
The Grid
Grid strategies are commons and do not present huge problems until we use certain position sizing methods such as the martingale. A martingale is extremely sensitive to any kind of friction (frictional costs, slippage...etc), the grid strategy aims to provide a stable and simple environment where a martingale might possibly behave well.
The goal of a simple grid strategy is to go long once the price crossover a certain level, a take profit is set at the level above the current one and stop loss is placed at the level below the current one, in a winning scenario the price reach the take profit, the position is closed and a new one is opened with the same setup. In a losing scenario, the price reaches the stop loss level, the position is closed and a short one is opened, the take profit is set at the level below the current one, and a stop loss is set at the level above the current one. Note that all levels are equally spaced.
It follows from this strategy that wins and losses should be constant over time, as such our balance would evolve in a linear fashion. This is a great setup for a martingale, as we are theoretically assured to recover all the looses in a losing streak.
Martingale - Exponential Decays - Risk/Reward
By using a martingale we double our position size (exposure) each time we lose a trade, if we look at our balance when using a martingale we see significant drawdowns, with our balance peaking down significantly. The martingale sequence is subject to exponential growth, as such using a martingale makes our balance exposed to exponential decays, that's really bad, we could basically lose all the initially invested capital in a short amount of time, it follows from this that the theoretical success of a martingale is determined by what is the maximum losing streak you can endure
Now consider how a martingale affects our risk-reward ratio, assuming unity position sizing our martingale sequence can be described by 2^(x-1) , using this formula we would get the amount of shares/contracts we need to purchase at the x trade of a losing streak, we would need to purchase 256 contracts in order to recover from a losing streak of size 9, this is enormous when you take into account that your wins are way smaller, the risk-reward ratio is totally unfair.
Of course, some users might think that a losing streak of size 9 is pretty unlikely, if the probability of winning and losing are both equal to 0.5, then the probability of 9 consecutive losses is equal to 0.5^9 , there are approximately 0.2% of chance of having such large losing streak, note however that under a ranging market such case scenario could happen, but we will see later that the length of a losing streak is not the only problem.
Other Problems
Having a capital large enough to tank 9any number of consecutive losses is not the only thing one should focus on, as we have to take into account market prices and trading dynamics, that's where the ugly part start.
Our first problem is frictional costs, one example being the spread, but this is a common problem for any strategy, however here a martingale is extra sensitive to it, if the strategy does not account for it then we will still double our positions costs but we might not recover all the losses of a losing streak, instead we would be recovering only a proportion of it, under such scenario you would be certain to lose over time.
Another problem are gaps, market price might open under a stop-loss without triggering it, and this is a big no-no.
Equity of the strategy on AMD, in a desired scenario the equity at the second arrow should have been at a higher position than the equity at the first arrow.
In order for the strategy to be more effective, we would need to trade a market that does not close, such as the cryptocurrency market. Finally, we might be affected by slippage, altho only extreme values might drastically affect our balance.
The Anti Martingale
The strategy lets you use an anti-martingale, which double the position size after a win instead of a loss, the goal here is not to recover from a losing strike but instead to profit from a potential winning streak.
Here we are exposing your balance to exponential gross but you might also lose a trade at the end a winning streak, you will generally want to reinitialize your position size after a few wins instead of waiting for the end of a streak.
Alternative
You can use other-kind of progressions for position sizing, such as a linear one, increasing your position size by a constant number each time you lose. More gentle progressions will recover a proportion of your losses in a losing streak.
You can also simulate the effect of a martingale without doubling your position size by doubling your target profit, if for example you have a 10$ profit-target/stop-loss and lose a trade, you can use a 20$ profit target to recover from the lost trade + gain a profit of 10$. While this approach does not introduce exponential decay in your balance, you are betting on the market reaching your take profits, considering the fact that you are doubling their size you are expecting market volatility to increase drastically over time, as such this approach would not be extremely effective for high losing streak.
Conclusion
You will see a lot of auto-trading strategies that are based on a grid approach, they might even use a martingale. While the backtests will look appealing, you should think twice before using such kind of strategy, remember that frictional costs will be a huge challenge for the strategy, and that it assumes that the trader has an important initial capital. We have also seen that the risk/reward ratio is theoretically the worst you can have on a strategy, having a low reward and a high risk. This does not mean that progressive position sizing is bad, but it should not be pushed to the extreme.
It is nice to note that the martingale is originally a betting system designed for casino games, which unlike trading are not subject to frictional costs, but even casino players don't use it, so why would you?
Thx for reading

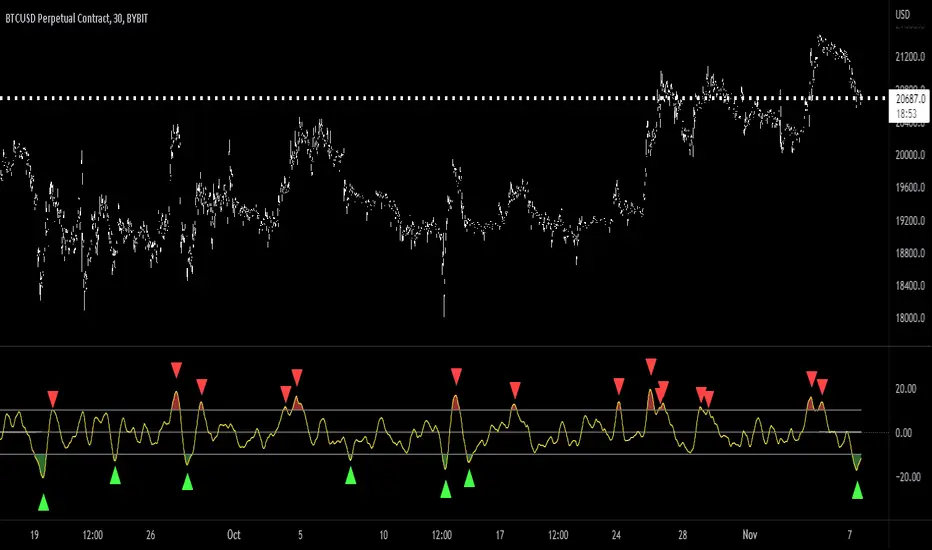
RSI + Composite Index [SHK]One of the most powerful indicator based and divergence strategies i have ever seen was made by Constance Brown.
The Composite Index:
The best way to think of the Composite Index as it applies to the RSI is to think of the RSI as Windows 3.0 and the Composite Index as Windows 10. Constance Brown discovered that the RSI, while it does create and detect divergences, does is not as accurate as it could be. It’s a bit of an oxymoron to say this but the RSI is a momentum indicator without any momentum calculation attached to it. The RSI actually misses a significant amount of important moves and even generates some bad moves. What Constance Brown did with the RSI is to input a momentum calculation within the RSI itself.
Usage:
1. Check hidden and regular divergences on RSI+COMPOSITE_INDEX and PRICE+COMPOSITE_INDEX.
2. After finding divergence wait for COMPOSITE_INDEX to cross under/over it's moving averages to trigger.
Useful Note:
"RSI overbought/oversold as filter", "RSI and COMPOSITE_INDEX trendline as trigger", "RSI 50 Over/Under as trend direction detection", ... can be add to this strategy.
Enjoy!
