ATR Levels and Zones with Signals📌 ATR Levels and Zones with Signals – User Guide Description
🔹 Overview
The ATR Levels and Zones with Signals indicator is a volatility-based trading tool that helps traders identify:
✔ Key support & resistance levels based on ATR (Average True Range)
✔ Buy & Sell signals triggered when price enters key ATR zones
✔ Breakout confirmations to detect high-momentum moves
✔ Dynamic Stop-Loss & Take-Profit suggestions
Unlike traditional ATR bands, this indicator creates layered ATR zones based on multiple ATR multipliers, allowing traders to gauge volatility and risk-adjust their trading strategies.
🔹 How It Works
🔸 The script calculates a baseline SMA (Simple Moving Average) of the price.
🔸 ATR (Average True Range) is then used to create six dynamic price levels above & below the baseline.
🔸 These levels define different risk zones—higher levels indicate increased volatility and potential trend exhaustion.
📈 ATR Zones Explained
🔹 Lower ATR Levels (Buying Opportunities)
📉 Lower Level 1-2 → Mild Oversold Zone (Potential trend continuation)
📉 Lower Level 3-4 → High Volatility Buy Zone (Aggressive traders start scaling in)
📉 Lower Level 5-6 → Extreme Oversold Zone (High-Risk Reversal Area)
🔹 If price enters these lower zones, it may indicate a potential buying opportunity, especially if combined with trend reversal confirmation.
🔹 Upper ATR Levels (Selling / Take Profit Zones)
📈 Upper Level 1-2 → Mild Overbought Zone (Potential pullback area)
📈 Upper Level 3-4 → High Volatility Sell Zone (Aggressive traders start scaling out)
📈 Upper Level 5-6 → Extreme Overbought Zone (High-Risk for Reversal)
🔹 If price enters these upper zones, it may indicate a potential selling opportunity or trend exhaustion, especially if momentum slows.
🔹 Sensitivity Modes
🔹 Aggressive Mode (More Frequent Signals) → Triggers buy/sell signals at Lower/Upper Level 3 & 4
🔹 Conservative Mode (Stronger Confirmation) → Triggers buy/sell signals at Lower/Upper Level 5 & 6
📌 Choose the mode based on your trading style:
✔ Scalpers & short-term traders → Use Aggressive Mode
✔ Swing & trend traders → Use Conservative Mode for stronger confirmations
🚀 How to Use the Indicator
🔹 For Trend Trading:
✅ Buy when price enters the lower ATR zones (especially in uptrends).
✅ Sell when price enters the upper ATR zones (especially in downtrends).
🔹 For Breakout Trading:
✅ Breakout Buy: Price breaks above Upper ATR Level 3 → Momentum entry for trend continuation
✅ Breakout Sell: Price breaks below Lower ATR Level 3 → Momentum short opportunity
🔹 Stop-Loss & Take-Profit Suggestions
🚨 Stop-Loss: Suggested at Lower ATR Level 6 (for longs) or Upper ATR Level 6 (for shorts)
🎯 Take-Profit: Suggested at Upper ATR Level 3 (for longs) or Lower ATR Level 3 (for shorts)
🔹 Why This Indicator is Unique
✔ Multiple ATR layers for better risk-adjusted trading decisions
✔ Combines ATR-based zones with SMA trend confirmation
✔ Both aggressive & conservative trading modes available
✔ Includes automatic stop-loss & take-profit suggestions
✔ Breakout signals for momentum traders
📢 Final Notes
✅ Free & open-source for the TradingView community!
⚠ Risk Warning: Always confirm signals with other confluences (trend, volume, support/resistance) before trading.
📌 Developed by: Maddog Blewitt
📩 Feedback & improvements are welcome! 🚀
Cari skrip untuk "trigger"

MACD Volume Strategy for XAUUSD (15m) [PineIndicators]The MACD Volume Strategy is a momentum-based trading system designed for XAUUSD on the 15-minute timeframe. It integrates two key market indicators: the Moving Average Convergence Divergence (MACD) and a volume-based oscillator to identify strong trend shifts and confirm trade opportunities. This strategy uses dynamic position sizing, incorporates leverage customization, and applies structured entry and exit conditions to improve risk management.
⚙️ Core Strategy Components
1️⃣ Volume-Based Momentum Calculation
The strategy includes a custom volume oscillator to filter trade signals based on market activity. The oscillator is derived from the difference between short-term and long-term volume trends using Exponential Moving Averages (EMAs)
Short EMA (default = 5) represents recent volume activity.
Long EMA (default = 8) captures broader volume trends.
Positive values indicate rising volume, supporting momentum-based trades.
Negative values suggest weak market activity, reducing signal reliability.
By requiring positive oscillator values, the strategy ensures momentum confirmation before entering trades.
2️⃣ MACD Trend Confirmation
The strategy uses the MACD indicator as a trend filter. The MACD is calculated as:
Fast EMA (16-period) detects short-term price trends.
Slow EMA (26-period) smooths out price fluctuations to define the overall trend.
Signal Line (9-period EMA) helps identify crossovers, signaling potential trend shifts.
Histogram (MACD – Signal) visualizes trend strength.
The system generates trade signals based on MACD crossovers around the zero line, confirming bullish or bearish trend shifts.
📌 Trade Logic & Conditions
🔹 Long Entry Conditions
A buy signal is triggered when all the following conditions are met:
✅ MACD crosses above 0, signaling bullish momentum.
✅ Volume oscillator is positive, confirming increased trading activity.
✅ Current volume is at least 50% of the previous candle’s volume, ensuring market participation.
🔻 Short Entry Conditions
A sell signal is generated when:
✅ MACD crosses below 0, indicating bearish momentum.
✅ Volume oscillator is positive, ensuring market activity is sufficient.
✅ Current volume is less than 50% of the previous candle’s volume, showing decreasing participation.
This multi-factor approach filters out weak or false signals, ensuring that trades align with both momentum and volume dynamics.
📏 Position Sizing & Leverage
Dynamic Position Calculation:
Qty = strategy.equity × leverage / close price
Leverage: Customizable (default = 1x), allowing traders to adjust risk exposure.
Adaptive Sizing: The strategy scales position sizes based on account equity and market price.
Slippage & Commission: Built-in slippage (2 points) and commission (0.01%) settings provide realistic backtesting results.
This ensures efficient capital allocation, preventing overexposure in volatile conditions.
🎯 Trade Management & Exits
Take Profit & Stop Loss Mechanism
Each position includes predefined profit and loss targets:
Take Profit: +10% of risk amount.
Stop Loss: Fixed at 10,100 points.
The risk-reward ratio remains balanced, aiming for controlled drawdowns while maximizing trade potential.
Visual Trade Tracking
To improve trade analysis, the strategy includes:
📌 Trade Markers:
"Buy" label when a long position opens.
"Close" label when a position exits.
📌 Trade History Boxes:
Green for profitable trades.
Red for losing trades.
📌 Horizontal Trade Lines:
Shows entry and exit prices.
Helps identify trend movements over multiple trades.
This structured visualization allows traders to analyze past performance directly on the chart.
⚡ How to Use This Strategy
1️⃣ Apply the script to a XAUUSD (Gold) 15m chart in TradingView.
2️⃣ Adjust leverage settings as needed.
3️⃣ Enable backtesting to assess past performance.
4️⃣ Monitor volume and MACD conditions to understand trade triggers.
5️⃣ Use the visual trade markers to review historical performance.
The MACD Volume Strategy is designed for short-term trading, aiming to capture momentum-driven opportunities while filtering out weak signals using volume confirmation.

Time-based Alerts for Trading Windows🌟 Time-based Alerts for Trading Windows 🌐📈
This is a re-uploaded script as the previous one got hidden.
This Time-based Alerts for Trading Windows script is a highly customizable and reliable tool designed to assist traders in managing automated strategies or manually monitoring specific market conditions. Inspired by CrossTrade's Time-based Alert, this script is tailored for those who rely on precise time windows to trigger actions, such as sending webhook signals or managing Expert Advisors (EAs).
Whether you are a scalper, day trader, or algorithmic trader, this script empowers you to stay on top of your trades with fully customizable time-based alerts.
🛠️ Customizable Time Alerts
This indicator allows you to create up to 12 unique time windows by specifying the exact hour and minute for each alert. Each time window corresponds to an individual alert condition, making it perfect for managing trades during specific market sessions or key time periods.
For example:
Alert 1 can be set at 9:30 AM (market open).
Alert 2 can be set at 3:55 PM (just before market close).
Each alert can be toggled on or off in the indicator settings, allowing you to manage alerts without having to reconfigure your script.
You can adjust the colours to fit any colour scheme you like!
🕒 Odd and Even Time Alerts
The script comes with three built-in alert type categories:
Odd Alerts (marked with a green triangle on the chart): These correspond to odd-numbered inputs like Alert 1, Alert 3, Alert 5, and so on.
Even Alerts (marked with a red triangle on the chart): These correspond to even-numbered inputs like Alert 2, Alert 4, Alert 6, and so on.
You can also customize all 12 alerts individually to include a custom alert message
These alerts serve as a convenient way to differentiate between multiple trading strategies or market conditions. You can customize alert messages for odd and even alerts directly from TradingView’s alert panel.
🔗 Webhook Integration for Automation
This script is fully compatible with webhook-based automation. By configuring your alerts in TradingView, you can send signals to trading bots, EAs, or any third-party system. For example, you can:
Turn off an EA at a specific time (e.g., 3:55 PM EST).
Send buy/sell signals to your bot during predefined trading windows.
Simply use TradingView’s alert message editor to format webhook payloads for your automation system.
🌐 Timezone Flexibility
Trading happens across multiple time zones, and this script accounts for that. You can toggle between:
Eastern Time (New York): Ideal for most US-based markets.
Central Time (Exchange): Useful for futures and commodities traders.
This ensures your alerts are always in sync with your preferred time zone, eliminating confusion.
🎨 Visual Indicators
The script plots visual markers directly on your chart to indicate active alerts:
Up Facing Triangles: Represent odd-numbered alerts, providing a quick reference for these time windows.
Down Facing Triangles: Represent even-numbered alerts, helping you track different strategies or conditions.
These visual markers make it easy to see when alerts are triggered, even at a glance.
📈 Practical Use Case
Let’s say you’re trading the USTEC index on a 1-minute chart. You want to:
Turn off your trading bot at 16:55 EST to avoid after-market volatility.
Trigger a re-entry signal at 17:30 EST to capture moves during the Asian session.
Visually monitor these actions on your chart for easy reference.
This script makes it possible with precision alerts and webhook integration. Simply configure the time windows in the settings and set up your alerts in TradingView.
🚨 How to Set Up Alerts
Enable or Disable Alerts: Use the script’s settings to toggle specific alerts on or off as needed.
Set Custom Time Windows: Define the hour and minute for each alert in the settings panel.
Create Alerts in TradingView:
Go to the TradingView alert panel.
Select the condition (e.g., "Odd Time-based Alert (Green)" or "Even Time-based Alert (Red)").
Customize the alert message for webhook integration or personal notification.
Choose the trigger type: Once Per Bar or Once Per Bar Close to keep the alert active.
Integrate with Webhooks: Use the alert message field to format payloads for automation systems like MT4, MT5, or third-party bots.
📋 Key Notes
Alerts can trigger indefinitely if set to "Once Per Bar" or "Once Per Bar Close".
Always ensure the expiration date is set far in the future to avoid unexpected alert deactivation.
Test webhook messages and alert configurations thoroughly before using them in live trading.
This script is a powerful addition to your trading toolbox, offering precision, flexibility, and automation capabilities. Whether you’re turning off an EA, managing trades during market sessions, or automating strategies via webhooks, this script is here to support you.
Start using the Time-based Alerts for Trading Windows today and trade with confidence! 🚀✨

[SHORT ONLY] Consecutive Close>High[1] Mean Reversion Strategy█ STRATEGY DESCRIPTION
The "Consecutive Close > High " Mean Reversion Strategy is a contrarian daily trading system for stocks and ETFs. It identifies potential shorting opportunities by counting consecutive days where the closing price exceeds the previous day's high. When this consecutive day count reaches a predetermined threshold, and if the close is below a 200-period EMA (if enabled), a short entry is triggered, anticipating a corrective pullback.
█ HOW ARE THE CONSECUTIVE BULLISH COUNTS CALCULATED?
The strategy uses a counter variable called `bullCount` to track how many consecutive bars meet a bullish condition. Here’s a breakdown of the process:
Initialize the Counter
var int bullCount = 0
Bullish Bar Detection
Every time the close exceeds the previous bar's high, increment the counter:
if close > high
bullCount += 1
Reset on Bearish Bar
When there is a clear bearish reversal, the counter is reset to zero:
if close < low
bullCount := 0
█ SIGNAL GENERATION
1. SHORT ENTRY
A Short Signal is triggered when:
The count of consecutive bullish closes (where close > high ) reaches or exceeds the defined threshold (default: 3).
The signal occurs within the specified trading window (between Start Time and End Time).
2. EXIT CONDITION
An exit Signal is generated when the current close falls below the previous bar’s low (close < low ), prompting the strategy to exit the position.
█ ADDITIONAL SETTINGS
Threshold: The number of consecutive bullish closes required to trigger a short entry (default is 3).
Start Time and End Time: The time window during which the strategy is allowed to execute trades.
EMA Filter (Optional): When enabled, short entries are only triggered if the current close is below the 200-period EMA.
█ PERFORMANCE OVERVIEW
This strategy is designed for Stocks and ETFs on the Daily timeframe and targets overextended bullish moves.
It aims to capture mean reversion by entering short after a series of consecutive bullish closes.
Further optimization is possible with additional filters (e.g., EMA, volume, or volatility).
Backtesting should be used to fine-tune the threshold and filter settings for specific market conditions.

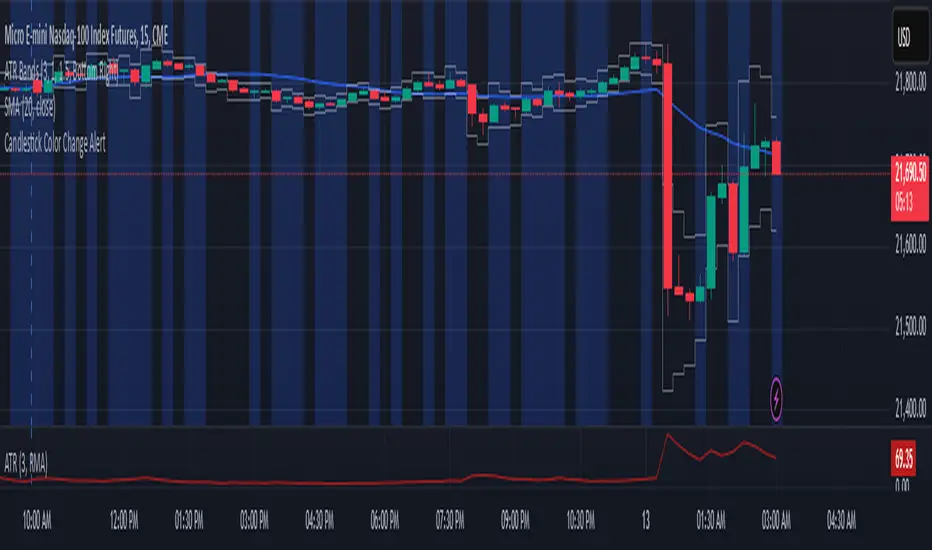
Candlestick Color Change AlertIt is an alert for change of candlestick color.
Identifies Candle Type
A candle is bullish if the closing price is higher than the opening price.
A candle is bearish if the closing price is lower than the opening price.
Detects a Color Change
The script checks if the current candle is bullish while the previous candle was bearish, or vice versa.
If a change is detected, an alert is triggered.
Triggers an Alert
Users receive an alert notification whenever a candlestick color change occurs.
Alerts can be set for popup, email, mobile push, or webhook notifications.
Visual Highlighting (Optional)
The script can also apply a background color (blue) on the chart to visually mark color changes.
Futures Engulfing Candle Size Strategy (Ticks, TP/SL)The Futures Candle Size Strategy is designed to identify and trade significant price movements in the futures market based on candle size. It is optimized for futures instruments like ES, NQ, or CL, where precise tick-level calculations are essential. The strategy includes a customizable take profit and stop loss in ticks and operates only within a specified time window (e.g., 7:00 AM to 9:15 AM CST).
Key Features:
Candle Size Threshold: Trades are triggered when the candle's high-to-low range exceeds the defined threshold in ticks.
Time Filter: Limits trades to the most active market hours, specifically between 7:00 AM and 9:15 AM CST.
Take Profit and Stop Loss: Customizable exit levels in ticks to manage risk and lock in profits.
Long and Short Trades: Automatically places buy or sell orders based on the candle's direction (bullish or bearish).
Alerts: Sends alerts whenever a trade is triggered, helping you stay informed in real-time.
How It Works:
The strategy calculates the size of each candle in ticks and compares it to the user-defined threshold.
If the candle size meets or exceeds the threshold within the specified time range, it triggers a long or short trade.
The trade automatically exits when the price hits the take profit or stop loss levels.

ENIGMA Signals with Retests Select higher Time FrameENIGMA Signals with Retests – Script Description
The "ENIGMA Signals with Retests" script is a unique indicator designed for traders who prefer precision trading based on price action retests of key levels derived from higher timeframes. This tool is ideal for those employing multi-timeframe analysis strategies, helping them detect high-probability trade entries when the price interacts with significant support and resistance levels.
What Does This Script Do?
This indicator identifies key levels from a higher timeframe selected by the user (e.g., 4-hour or daily), then tracks price action on lower timeframes to provide actionable buy and sell signals when the price retests these levels. It visually plots the key levels on the chart and triggers alerts for potential trade opportunities when conditions are met.
How It Works
Key Level Detection:
The script uses custom functions to detect recent swing highs and swing lows on the selected higher timeframe (such as 4H or Daily). These levels represent potential areas of support and resistance where price reactions are likely to occur.
Multi-Timeframe Analysis:
The indicator leverages the request.security() function to retrieve price data from the user-defined higher timeframe and plots horizontal lines on the chart for the most recent swing highs and lows.
Retest-Based Signals:
Once the key levels are plotted, the script continuously monitors the price on the lower timeframe:
A Buy Signal is triggered when the price closes below a key high level and then moves back above it, indicating a potential bullish retest.
A Sell Signal is triggered when the price closes above a key low level and then moves back below it, indicating a potential bearish retest.
These retest signals are displayed as green and red arrows on the chart, helping traders identify optimal entry points.
Alerts for Retests:
The script includes built-in alert conditions that notify traders when a valid retest signal occurs. This allows traders to react promptly without constantly monitoring the chart.
How to Use the Script
Select Your Key Timeframe:
From the input settings, choose a higher timeframe that suits your trading style (e.g., 4H for intraday trading or Daily for swing trading).
Adjust Visual Preferences:
Customize the line style (solid, dashed, or dotted) and length of the plotted levels.
Toggle labels for the levels on or off as per your preference.
Trade Execution:
Once a retest signal appears on the lower timeframe, consider entering a trade in the direction of the signal. The buy signal suggests a potential long entry, while the sell signal indicates a potential short entry.
Set Alerts:
Use the alert conditions provided to get notified whenever a valid retest occurs. This helps in reducing screen time and improving trading efficiency.
Underlying Concepts
This script is grounded in the principles of support and resistance, retests, and breakout trading. By focusing on multi-timeframe key levels, it aligns with widely used trading concepts like:
Breakout and Retest: Entering trades after a confirmed breakout and successful retest of a significant level.
Swing Highs and Lows: Recognizing swing points to identify strong price reaction zones.
Multi-Timeframe Confluence: Enhancing trade probability by ensuring that the signals on lower timeframes correspond with key levels from higher timeframes.
Why This Script Is Unique
Unlike many generic trend-following or scalping indicators, "ENIGMA Signals with Retests" offers:
Precision Signals: It only provides signals when specific retest conditions are met, reducing false signals and noise.
Multi-Timeframe Customization: Users can tailor the higher timeframe to their strategy, making it versatile for various trading styles.
Alert Functionality: Alerts are integrated, allowing traders to stay updated without constantly monitoring the charts.
This script is perfect for traders looking for a systematic way to trade retests of key levels across multiple timeframes. Whether you're a scalper, day trader, or swing trader, "ENIGMA Signals with Retests" can help improve your precision and timing in the market.

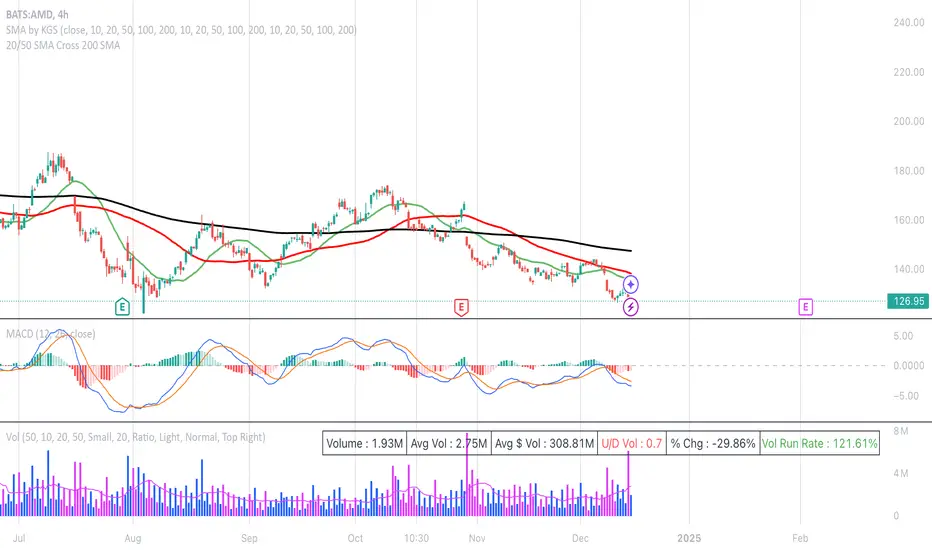
20/50 SMA Cross 200 SMAThis Pine Script code is designed to identify and visualize crossovers of two shorter-term Simple Moving Averages (SMAs), a 20-period SMA and a 50-period SMA, with a longer-term 200-period SMA on a price chart. It also includes alerts for these crossover events. Here's a breakdown:
**Purpose:**
The core idea behind this script is to detect potential trend changes. Crossovers of shorter-term moving averages over a longer-term moving average are often interpreted as bullish signals, while crossovers below are considered bearish.
**Key Components:**
1. **Moving Average Calculation:**
* `sma20 = ta.sma(close, 20)`: Calculates the 20-period SMA of the closing price.
* `sma50 = ta.sma(close, 50)`: Calculates the 50-period SMA of the closing price.
* `sma200 = ta.sma(close, 200)`: Calculates the 200-period SMA of the closing price.
2. **Crossover Detection:**
* `crossUp20 = ta.crossover(sma20, sma200)`: Returns `true` when the 20-period SMA crosses above the 200-period SMA.
* `crossDown20 = ta.crossunder(sma20, sma200)`: Returns `true` when the 20-period SMA crosses below the 200-period SMA.
* Similar logic applies for `crossUp50` and `crossDown50` with the 50-period SMA.
3. **Recent Crossover Tracking (Crucial Improvement):**
* `lookback = 7`: Defines a lookback period of 7 bars.
* `var bool hasCrossedUp20 = false`, etc.: Declares `var` (persistent) boolean variables to track if a crossover has occurred *within* the last 7 bars. This is the most important correction from previous versions.
* The logic using `ta.barssince()` is the key:
* If a crossover happens (`crossUp20` is true), the corresponding `hasCrossedUp20` is set to `true`.
* If no crossover happens on the current bar, it checks if a crossover happened within the last 7 bars using `ta.barssince(crossUp20) <= lookback`. If so, it keeps `hasCrossedUp20` as `true`. After 7 bars, it becomes `false`.
4. **Plotting Crossovers:**
* `plotshape(...)`: Plots circles on the chart to visually mark the crossovers.
* Green circles below the bars for bullish crossovers (20 and 50).
* Red circles above the bars for bearish crossovers (20 and 50).
* Different shades of green/red (green/lime, red/maroon) distinguish between 20 and 50 SMA crossovers.
5. **Plotting Moving Averages (Optional but Helpful):**
* `plot(sma20, color=color.blue, linewidth=1)`: Plots the 20-period SMA in blue.
* Similar logic for the 50-period SMA (orange) and 200-period SMA (gray).
6. **Alerts:**
* `alertcondition(...)`: Triggers alerts when crossovers occur. This is essential for real-time trading signals.
**How it Works (in Simple Terms):**
The script continuously calculates the 20, 50, and 200 SMAs. It then monitors for instances where the 20 or 50 SMA crosses the 200 SMA. When such a crossover happens, a colored circle is plotted on the chart, and an alert is triggered. The key improvement is that it remembers if a crossover occurred in the last 7 bars and continues to display the circle during that period.
**Use Case:**
Traders use this type of indicator to identify potential entry and exit points in the market. A bullish crossover (shorter SMA crossing above the longer SMA) might be a signal to buy, while a bearish crossover might be a signal to sell.
**Key Improvements over Previous Versions:**
* **Correct Lookback Implementation:** The use of `ta.barssince()` and `var` variables is the correct and efficient way to check for crossovers within a lookback period. This fixes the major flaw in earlier versions.
* **Clear Visualizations:** The use of `plotshape` with distinct colors makes it easy to distinguish between 20 and 50 SMA crossovers.
* **Alerts:** The inclusion of alerts makes the script much more practical for real-time trading.
This improved version provides a robust and useful tool for identifying and tracking SMA crossovers.
ATT + Key Levels with SessionsKey Features:
ATT Turning Point Numbers:
This input allows the user to define specific numbers (e.g., "3,11,17,29,41,47,53,59") that mark turning points in price action, which are checked using the bar_index modulo 60. If the current bar index matches one of these turning points, it triggers potential buy or sell signals.
RSI (Relative Strength Index):
The RSI is calculated based on a user-defined period (rsi_period), typically 14, and used to indicate overbought or oversold conditions. The script defines overbought (70) and oversold (30) levels, which are used to filter buy or sell signals.
Session Times:
The script includes predefined session times for major trading markets:
New York: From 9:30 AM EST to 4:00 PM EST.
London: From 8:00 AM GMT to 4:30 PM GMT.
Asia: From 12:00 AM GMT to 9:00 AM GMT.
These session times are used to restrict the buy and sell signals to specific market sessions.
Key Levels:
The script calculates and plots key market levels for the current day and week:
Daily High and Low: The highest and lowest prices of the current day.
Weekly High and Low: The highest and lowest prices of the current week.
These levels are plotted with different colors for visual reference.
Signal Logic:
Buy Signal: Triggered when the current bar is a turning point (according to the ATT model), the RSI is below the oversold threshold, and the current time is within the active session times (New York, London, or Asia).
Sell Signal: Triggered when the current bar is a turning point, the RSI is above the overbought threshold, and the current time is within the active session times.
Signal Limitations:
A user-defined limit (max_signals_per_session) controls the maximum number of signals that can be plotted within each session. This prevents excessive signal generation.
Plotting and Background Highlights:
Buy and Sell Signals: The script plots shapes (labels) above or below the bars to indicate buy or sell signals when the conditions are met.
Background Highlight: The background color is highlighted in yellow when the current bar matches one of the defined ATT turning points.
In Summary:
The indicator combines multiple technical factors to generate trading signals:
Turning points in price action (based on custom ATT numbers),
RSI levels (overbought/oversold),
Market session times (New York, London, Asia),
Key price levels (daily and weekly highs and lows).
This combination helps traders identify potential buying and selling opportunities while considering broader market dynamics and limiting the number of signals during each session.

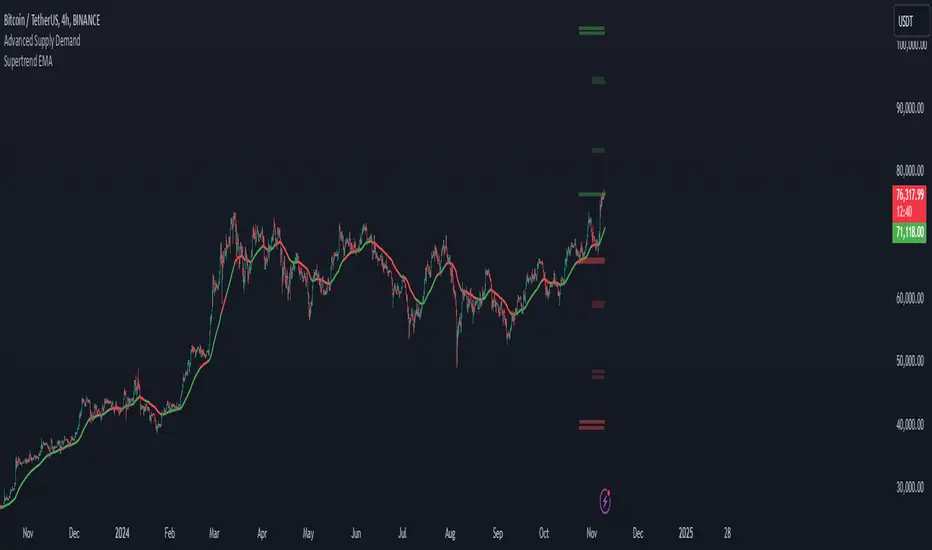
Supertrend EMA & KNNSupertrend EMA & KNN
The Supertrend EMA indicator cuts through the noise to deliver clear trend signals.
This tool is built using the good old Exponential Moving Averages (EMAs) with a novel of machine learning; KNN (K Nearest Neighbors) breakout detection method.
Key Features:
Effortless Trend Identification: Supertrend EMA simplifies trend analysis by automatically displaying a color-coded EMA. Green indicates an uptrend, red signifies a downtrend, and the absence of color suggests a potential range.
Dynamic Breakout Detection: Unlike traditional EMAs, Supertrend EMA incorporates a KNN-based approach to identify breakouts. This allows for faster color changes compared to standard EMAs, offering a more dynamic picture of the trend.
Customizable Parameters: Fine-tune the indicator to your trading style. Adjust the EMA length for trend smoothing, KNN lookback window for breakout sensitivity, and breakout threshold for filtering noise.
A Glimpse Under the Hood:
Dual EMA Power: The indicator utilizes two EMAs. A longer EMA (controlled by the "EMA Length" parameter) provides a smooth trend direction, while a shorter EMA (controlled by the "Short EMA Length" parameter) triggers color changes, aiming for faster response to breakouts.
KNN Breakout Detection: This innovative feature analyzes price action over a user-defined lookback period (controlled by the "KNN Lookback Length" parameter) to identify potential breakouts. If the price surpasses a user-defined threshold (controlled by the "Breakout Threshold" parameter) above the recent highs, a green color is triggered, signaling a potential uptrend. Conversely, a breakdown below the recent lows triggers a red color, indicating a potential downtrend.
Trading with Supertrend EMA:
Ride the Trend: When the indicator displays green, look for long (buy) opportunities, especially when confirmed by bullish price action patterns on lower timeframes. Conversely, red suggests potential shorting (sell) opportunities, again confirmed by bearish price action on lower timeframes.
Embrace Clarity: The color-coded EMA provides a clear visual representation of the trend, allowing you to focus on price action and refine your entry and exit strategies.
A Word of Caution:
While Supertrend EMA offers faster color changes than traditional EMAs, it's important to acknowledge a slight inherent lag. Breakout detection relies on historical data, and there may be a brief delay before the color reflects a new trend.
To achieve optimal results, consider:
Complementary Tools: Combine Supertrend EMA with other indicators or price action analysis for additional confirmation before entering trades.
Solid Risk Management: Always practice sound risk management strategies such as using stop-loss orders to limit potential losses.
Supertrend EMA is a powerful tool designed to simplify trend identification and enhance your trading experience. However, remember, no single indicator guarantees success. Use it with a comprehensive trading strategy and disciplined risk management for optimal results.
Disclaimer:
While the Supertrend EMA indicator can be a valuable tool for identifying potential trend changes, it's important to note that it's not infallible. Market conditions can be highly dynamic, and indicators may sometimes provide false signals. Therefore, it's crucial to use this indicator in conjunction with other technical analysis tools and sound risk management practices. Always conduct thorough research and consider consulting with a financial advisor before making any investment decisions.
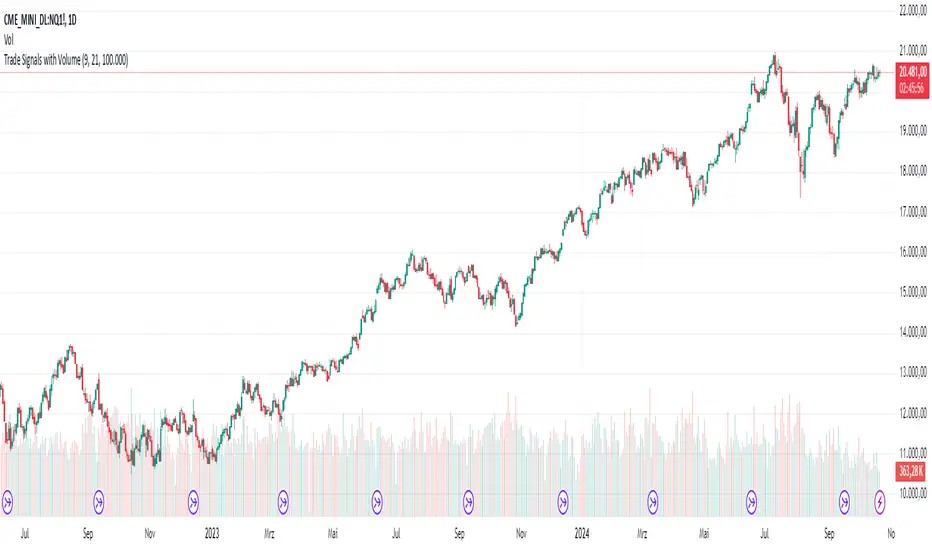
AndreundCristianIndicator Overview:
The "Trade Signals with Volume" indicator is a custom script that generates buy and sell signals based on the crossover of two moving averages (a fast one and a slow one) and adds a volume filter to validate these signals. It plots these signals directly on the chart, using arrows or labels to indicate where buy and sell signals occur.
Key Features:
Moving Averages (MA):
The indicator uses two Simple Moving Averages (SMA): a fast SMA and a slow SMA.
A buy signal is triggered when the fast MA crosses above the slow MA, signaling potential bullish momentum.
A sell signal is triggered when the fast MA crosses below the slow MA, indicating potential bearish momentum.
Volume Filter:
To ensure that signals are more reliable, the indicator only triggers a buy or sell signal if the volume is above a certain threshold. This threshold can be adjusted by the user in the input settings.
For example, if the volume exceeds 100,000 (or any set value), and a crossover occurs, the signal is validated.
Visual Representation:
Buy signals are represented with green labels or arrows below the price bars.
Sell signals are represented with red labels or arrows above the price bars.
The MAs are also plotted on the chart for visual reference.
Input Parameters:
Fast Moving Average Length: The number of periods for the fast SMA (default is 9 periods).
Slow Moving Average Length: The number of periods for the slow SMA (default is 21 periods).
Volume Threshold: The minimum volume required to validate a buy or sell signal (default is 100,000).
ICT Panther (By Obicrypto) V1 ICT Panther Indicator: Full and Detailed Description
The ICT Panther Indicator, created by Obicrypto, is an advanced technical analysis tool designed specifically for traders looking to identify key price action events based on institutional trading techniques, particularly in the context of the Inner Circle Trader (ICT) methodology. This indicator helps traders spot market structure breaks, order blocks, and potential trade opportunities driven by institutional behaviors in the market. Here's a detailed breakdown of its features and how it works:
What Does the ICT Panther Indicator Do?
1. Market Structure Breaks (MSB) Identification:
The ICT Panther identifies critical points where the market changes direction, commonly referred to as a break of structure (BoS). When the price breaks above or below certain key levels (based on highs and lows or opens and closes), it signals a potential shift in market sentiment. These break-of-structure points are essential for traders to determine whether the market is likely to continue its trend or reverse.
2. Order Blocks Visualization:
The indicator plots demand (bullish) and supply (bearish) boxes, which represent areas where institutional traders might place significant buy or sell orders. These zones, known as order blocks, are areas where the price tends to pause or reverse, giving traders key insights into potential entry and exit points. The indicator shows these areas graphically as colored boxes on the chart, which can be used to plan trades based on market structure and price action.
3. Pivot Point Detection:
The ICT Panther identifies important pivot points by tracking higher highs and lower lows. These pivot points are critical in determining the strength of a trend and can help traders confirm the direction of the market. The indicator uses a unique algorithm to detect two levels of pivot points:
- First-Order Pivots: Major pivot points where the price makes notable highs and lows.
- Second-Order Pivots: Smaller pivot points, useful for detecting microtrends within the larger market structure.
4. Bullish and Bearish Break of Structure Lines:
When a significant market structure break (BoS) occurs, the indicator will automatically draw red lines (for bearish break of structure) and green lines (for bullish break of structure) at key price levels. These lines help traders quickly see where institutional moves have occurred in the past and where potential future price moves could originate from.
5. Tested and Filled Boxes:
The ICT Panther also has a built-in mechanism to dim previously tested order blocks. When the price tests an order block (returns to a previous demand or supply zone), the box's color dims to indicate that the area has already been tested, reducing its significance. If the price fully fills an order block, the box stops plotting, providing a clear and clutter-free chart.
Key Features
1. Market Structure Break (MSB) Trigger:
- The indicator allows users to select between highs/lows or opens/closes as the trigger for market structure breaks. This flexibility lets traders adjust the indicator to suit their personal trading style or the behavior of specific assets.
2. Order Block Detection and Visualization:
- The tool automatically plots bullish and bearish demand and supply boxes, representing institutional order blocks on the chart. These boxes provide visual cues for areas of potential price action, where institutional traders might be active.
3. Second-Order Pivot Highlighting:
- The ICT Panther offers an option to plot second-order pivots, highlighting smaller pivot points within the larger market structure. These pivots can be helpful for short-term traders who need to react to smaller price movements while still keeping the larger trend in mind.
4. Box Test and Fill Delays:
- Users can configure delays for box tests and box fills, meaning the indicator will only mark a box as tested or filled after a certain number of bars. This prevents false signals and helps confirm that a zone is truly significant in the market.
5. Customization and Visual Clarity:
- The indicator is highly customizable, allowing users to turn on or off various features like:
- Displaying second-order pivots.
- Highlighting candles that broke structure.
- Plotting market structure broke lines.
- Showing or hiding tested and filled demand boxes.
- Setting custom delays for box testing and filling to suit different market conditions.
6. Tested and Filled Order Block Visualization:
- The indicator visually adjusts the tested and filled order blocks, dimming tested zones and removing filled zones to avoid clutter on the chart. This ensures that traders can focus on active trading opportunities without distractions from historical data.
How Does It Work?
1. Detecting Market Structure Breaks (BoS):
- The indicator continuously tracks the market for key price action signals. When the price breaks through previous highs or lows (or opens and closes, depending on your selection), the indicator marks this as a break of structure. This is a critical signal used by institutional traders and retail traders alike to determine potential future price movements.
2. Order Block Identification:
- Whenever a bullish break of structure occurs, the indicator plots a green demand box to show the area where institutional buyers might have placed significant orders. Similarly, for a bearish break of structure, it plots a red supply box representing areas where institutional sellers are active.
3. Pivot Analysis and Tracking:
- As the market moves, the indicator continuously updates first-order and second-order pivot points based on highs and lows. These points help traders identify whether the market is trending or consolidating. Traders can use these pivot points in combination with the order blocks to make informed trading decisions.
4. Box Testing and Filling:
- When the price retests an existing order block, the box dims to show it has been tested. If the price fully fills the box, it is no longer shown, which helps traders focus on the most relevant, untested order blocks.
Benefits for Traders
- Improved Decision-Making: With clear visuals and advanced logic based on institutional trading strategies, this indicator provides a deeper understanding of market structure and price action.
- Reduced Clutter: The indicator intelligently manages the display of order blocks and pivot points, ensuring that traders focus only on the most relevant information.
- Adaptability: Whether you are a swing trader or a day trader, the ICT Panther can be adjusted to fit your trading style, offering robust and flexible tools for tracking market structure and order blocks.
- Institutional Edge: By identifying institutional-level order blocks and market structure breaks, traders using this indicator can trade in line with the strategies of large market participants.
Who Should Use the ICT Panther Indicator?
This indicator is ideal for:
- Crypto, Forex, and Stock Traders who want to incorporate institutional trading concepts into their strategies.
- Technical Analysts looking for precise tools to measure the market structure and price action.
- ICT Traders who follow the Inner Circle Trader methodology and want an advanced tool to automate and enhance their analysis.
- Price Action Traders seeking a reliable indicator to track pivot points, order blocks, and market structure breaks.
The ICT Panther Indicator is a powerful, versatile tool that brings institutional trading techniques to the fingertips of retail traders. Whether you are looking to identify key market structure breaks, order blocks, or crucial pivot points, this indicator offers detailed visualizations and customizable options to help you make more informed trading decisions. With its ability to track the activities of institutional traders, the ICT Panther Indicator equips traders with the insights needed to stay ahead of the market and trade with confidence.
With the ICT Panther Indicator, traders can follow the movements of institutional money, making it easier to predict market direction and capitalize on high-probability trading opportunities.
Enjoy it and share it with your friends!

Fibonacci Swing Trading BotStrategy Overview for "Fibonacci Swing Trading Bot"
Strategy Name: Fibonacci Swing Trading Bot
Version: Pine Script v5
Purpose: This strategy is designed for swing traders who want to leverage Fibonacci retracement levels and candlestick patterns to enter and exit trades on higher time frames.
Key Components:
1. Multiple Timeframe Analysis:
The strategy uses a customizable timeframe for analysis. You can choose between 4hour, daily, weekly, or monthly time frames to fit your preferred trading horizon. The high and low-price data is retrieved from the selected timeframe to identify swing points.
2. Fibonacci Retracement Levels:
The script calculates two key Fibonacci retracement levels:
0.618: A common level where price often retraces before resuming its trend.
0.786: A deeper retracement level, often used to identify stronger support/resistance areas.
These levels are dynamically plotted on the chart based on the highest high and lowest low over the last 50 bars of the selected timeframe.
3. Candlestick Based Entry Signals:
The strategy uses candlestick patterns as the only indicator for trade entries:
Bullish Candle: A green candle (close > open) that forms between the 0.618 retracement level and the swing high.
Bearish Candle: A red candle (close < open) that forms between the 0.786 retracement level and the swing low.
When these candlestick patterns align with the Fibonacci levels, the script triggers buy or sell signals.
4. Risk Management:
Stop Loss: The stop loss is set at 1% below the entry price for long trades and 1% above the entry price for short trades. This tight risk management ensures controlled losses.
Take Profit: The strategy uses a 2:1 risk-to-reward ratio. The take profit is automatically calculated based on this ratio relative to the stop loss.
5. Buy/Sell Logic:
Buy Signal: Triggered when a bullish candle forms above the 0.618 retracement level and below the swing high. The bot then places a long position.
Sell Signal: Triggered when a bearish candle forms below the 0.786 retracement level and above the swing low. The bot then places a short position.
The stop loss and take profit levels are automatically managed once the trade is placed.
Strengths of This Strategy:
Swing Trading Focus: The strategy is ideal for swing traders, targeting longer-term price moves that can take days or weeks to play out.
Simple Yet Effective Indicators: By only relying on Fibonacci retracement levels and basic candlestick patterns, the strategy avoids complexity while capitalizing on well-known support and resistance zones.
Automated Risk Management: The built-in stop loss and take profit mechanism ensures trades are protected, adhering to a strict 2:1 risk/reward ratio.
Multiple Timeframe Analysis: The script adapts to various market conditions by allowing users to switch between different timeframes (4hour, daily, weekly, monthly), giving traders flexibility.
Strategy Use Cases:
Retracement Traders: Traders who focus on entering the market at key retracement levels (0.618 and 0.786) will find this strategy especially useful.
Trend Reversal Traders: The strategy’s reliance on candlestick formations at Fibonacci levels helps traders spot potential reversals in price trends.
Risk Conscious Traders: With its 1% risk per trade and 2:1 risk/reward ratio, the strategy is ideal for traders who prioritize risk management in their trades.

Elite By Ashu4750Inside Bar Detection:
The script identifies inside bars, which are candles where the high is lower and the low is higher than the previous bar. It tracks the high and low of the mother candle (the candle preceding the inside bars) and plots the ranges on the chart using lines and labels.
Exponential Moving Averages (EMA):
Three EMAs are calculated and plotted (with default periods of 9, 21, and 50). This is a classic trend-following technique used to smooth price data and identify the direction of the market.
Bollinger Bands (BB):
The script includes a Bollinger Band calculation using the simple moving average (SMA) with a standard deviation multiplier. The bands help visualize volatility and potential overbought or oversold conditions.
The user can configure settings like the length of the SMA and the multiplier for the upper and lower bands.
Volume Weighted Average Price (VWAP):
The VWAP is plotted on the chart and reset based on user-defined timeframes (e.g., session, week, month). VWAP is a popular indicator for institutional trading, as it shows the average price weighted by volume and can act as support or resistance.
Crossover Signals (Buy/Sell):
A combination of crossovers between VWAP, EMAs, and Bollinger Bands triggers buy and sell signals. Specifically:
Buy signal is generated when VWAP crosses over the 9 EMA, the close crosses over the Bollinger Band line, and VWAP crosses over the Bollinger Band.
Sell signal is triggered when VWAP crosses under the 9 EMA, and similar conditions exist for the other indicators.
These signals are plotted with a green "Buy" or red "Sell" marker below the bars, and alerts are set up for both buying and selling.
Additional Bollinger Band Configuration:
The script provides more flexibility in Bollinger Bands by allowing the user to select between SMA, EMA, or SMMA for the moving average.
The user can also choose the standard deviation multiplier and whether to display the bands.
Alerts:
Buy and sell conditions are linked to alert conditions, allowing the user to be notified when a signal is triggered, based on the defined crossover logic.
Technical Breakdown:
Inside Bar Logic: Tracks inside bars and plots lines representing the high and low of the mother candle. The line and label functions are used to draw these on the chart, which provides a visual representation of the range.
EMA and VWAP Crossovers:
The 9, 21, and 50-period EMAs are calculated and used in crossover logic with VWAP. Crossovers between VWAP and EMAs are a common method for identifying potential trend changes.
Bollinger Bands:
The Bollinger Band component allows for volatility analysis by calculating the upper and lower bands based on the moving average's standard deviation.
Alert System:
Alerts are set for crossover signals, allowing for real-time notifications of potential buy and sell opportunities.
Visualization:
The script plots the EMAs, VWAP, and Bollinger Bands on the price chart. It highlights inside bar patterns and displays buy/sell markers on the chart when the specified conditions are met. These visual cues make it easier to follow the market’s movements and spot trading opportunities.
Customizability:
The script is highly customizable with inputs for:
EMA periods.
VWAP settings.
Bollinger Band parameters (moving average type, length, standard deviation).
Candle color options for inside bars.
In this traders looking for multiple indicators to analyze market trends, volatility, and price action.

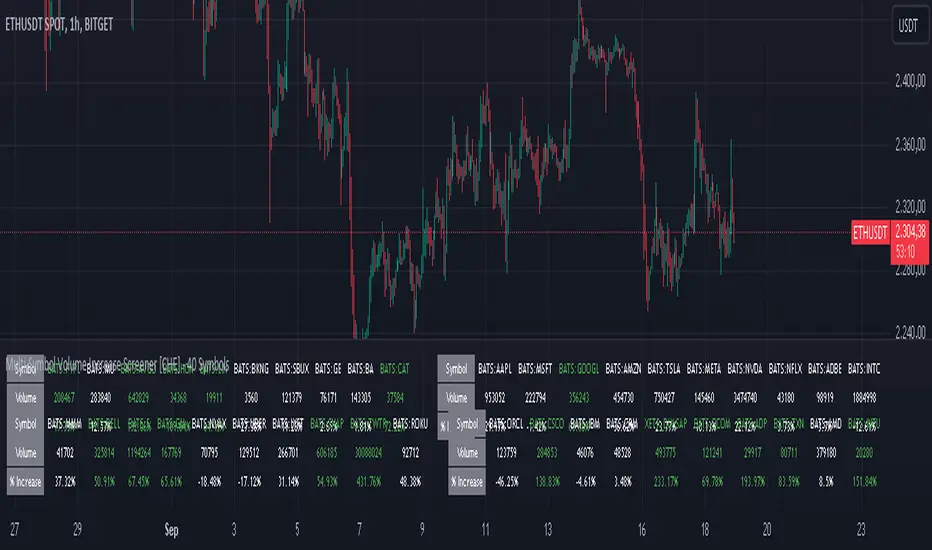
Multi-Symbol Volume Increase Screener [CHE] MultiSymbol Volume Increase Screener
Designed for TradingView
Presented by Chervolino
Introduction
Welcome to the presentation of the MultiSymbol Volume Increase Screener—a powerful tool designed to enhance your trading strategy on TradingView. Developed at the request of jscott143, this screener provides traders with realtime insights into significant volume movements across multiple symbols, enabling more informed and timely trading decisions.
Purpose and Objectives
Identify HighVolume Opportunities: Detect symbols experiencing a significant increase in volume compared to their historical average.
Monitor Multiple Symbols Simultaneously: Efficiently track up to five symbols in one view.
RealTime Alerts: Receive instant notifications when predefined volume conditions are met.
Comprehensive Overview: Display volume data and percentage increases in an organized table for easy analysis.
Key Features
1. MultiSymbol Monitoring
Track up to five different symbols simultaneously.
Customize the list of symbols based on your trading portfolio.
2. Volume Analysis
Compare current candle volume against the average volume over a specified period.
Calculate and display the percentage increase in volume.
3. RealTime Alerts
Set a volume increase multiplier (e.g., 1.5x) to trigger alerts.
Receive alerts via email, popup, or SMS when conditions are met.
4. UserFriendly Table Display
View symbols, their current volume, and percentage increase in a clear, concise table.
Colorcoded indicators highlight significant volume changes.
5. Customizable Parameters
Adjust the average volume period to suit different trading strategies.
Set your preferred volume increase multiplier for alerts.
How It Works
1. User Inputs:
Symbols Selection: Choose up to five symbols you wish to monitor.
Average Volume Period: Define the number of bars over which the average volume is calculated (default is 20).
Volume Increase Multiplier: Set the threshold for volume increase to trigger alerts (default is 1.5x).
2. Volume Calculation:
The screener fetches the current volume and calculates the simple moving average (SMA) of volume over the defined period for each symbol.
It then determines if the current volume exceeds the average volume by the specified multiplier.
3. Data Display:
A table is generated on the chart displaying each symbol, its current volume, and the percentage increase.
Green text indicates that the volume increase condition has been met.
4. Alert Generation:
When a symbol's current volume surpasses the average volume by the set multiplier, an alert is triggered.
Alerts are customizable and can be set to notify you through various channels.
Benefits
Enhanced DecisionMaking: Quickly identify highvolume trading opportunities across multiple assets.
Time Efficiency: Monitor several symbols without the need to switch between charts.
Proactive Trading: Stay informed with realtime alerts, allowing for timely trading actions.
Customization: Tailor the screener settings to align with your unique trading strategies and preferences.
Setup Instructions
1. Add the Screener to TradingView:
Navigate to TradingView and open the Pine Editor.
Add the MultiSymbol Volume Increase Screener indicator to your chart.
Save and apply the indicator.
2. Configure User Inputs:
Select up to five symbols you wish to monitor in the input fields "Symbol 1" to "Symbol 5".
Adjust the "Average Volume Period" and "Volume Increase Multiplier" as needed.
3. Set Up Alerts:
Click on the Alarm icon (🔔) in the TradingView toolbar.
In the "Condition" dropdown, select the "MultiSymbol Volume Increase Screener".
Choose the specific alert condition for each symbol (e.g., "Volume Increase Alert for Symbol 1").
Configure the alert actions (e.g., email, popup, SMS) and click "Create".
Repeat this process for each symbol you wish to monitor.
Visual Demonstration
Table Display Example:
| Symbol | Volume | % Increase |
| AAPL | 150,000 | 50.00% |
| MSFT | 120,000 | 20.00% |
| GOOGL | 180,000 | 80.00% |
| AMZN | 130,000 | 30.00% |
| TSLA | 160,000 | 60.00% |
Green Text: Indicates that the volume increase condition has been met for that symbol.
Alert Notification Example:
```
🚀 Symbol 1 shows a volume increase!
```
Note: Replace "Symbol 1" with the actual symbol as per your configuration.
Customization Options
Increase the Number of Symbols:
While the current screener monitors five symbols, it can be extended to monitor more by adding additional input fields and corresponding calculations. However, be mindful of TradingView's Pine Script limitations and potential performance impacts.
Adjust Volume Period and Multiplier:
Tailor the "Average Volume Period" and "Volume Increase Multiplier" to align with your specific trading strategies and market conditions.
Enhance Table Information:
Incorporate additional data points such as current price, price change percentage, or other technical indicators to enrich your analysis.
Benefits of Using the Screener
Efficiency: Saves time by providing a consolidated view of multiple symbols' volume activity.
Proactive Trading: Enables you to act swiftly on significant volume movements, which often precede price changes.
DataDriven Decisions: Facilitates informed trading decisions based on realtime volume analysis.
Customization: Offers flexibility to adapt the screener to various trading styles and preferences.
Conclusion
The MultiSymbol Volume Increase Screener is an invaluable tool for traders looking to capitalize on significant volume movements across multiple assets. Developed at the request of jscott143, this screener integrates seamlessly with TradingView, providing realtime insights and alerts to enhance your trading strategy.
Q&A
Feel free to ask any questions or request further customization to better suit your trading needs.
Contact Information
Created for: jscott143
Thank you for your attention!
Alligator + Fractals + Divergent & Squat Bars + Signal AlertsThe indicator includes Williams Alligator, Williams Fractals, Divergent Bars, Market Facilitation Index, Highest and Lowest Bars, maximum and minimum peak of Awesome Oscillator, and signal alerts based on Bill Williams' Profitunity strategy.
MFI and Awesome Oscillator
According to the Market Facilitation Index Oscillator, the Squat bar is colored blue, all other bars are colored according to the Awesome Oscillator color, except for the Fake bars, colored with a lighter AO color. In the indicator settings, you can enable the display of "Green" bars (in the "Green Bars > Show" field). In the indicator style settings, you can disable changing the color of bars in accordance with the AO color (in the "AO bars" field), including changing the color for Fake bars (in the "Fake AO bars" field).
MFI is calculated using the formula: (high - low) / volume.
A Squat bar means that, compared to the previous bar, its MFI has decreased and at the same time its volume has increased, i.e. MFI < previous bar and volume > previous bar. A sign of a possible price reversal, so this is a particularly important signal.
A Fake bar is the opposite of a Squat bar and means that, compared to the previous bar, its MFI has increased and at the same time its volume has decreased, i.e. MFI > previous bar and volume < previous bar.
A "Green" bar means that, compared to the previous bar, its MFI has increased and at the same time its volume has increased, i.e. MFI > previous bar and volume > previous bar. A sign of trend continuation. But a more significant trend confirmation or warning of a possible reversal is the Awesome Oscillator, which measures market momentum by calculating the difference between the 5 Period and 34 Period Simple Moving Averages (SMA 5 - SMA 34) based on the midpoints of the bars (hl2). Therefore, by default, the "Green" bars and their opposite "Fade" bars are colored according to the color of the Awesome Oscillator.
According to Bill Williams' Profitunity strategy, using the Awesome Oscillator, the third Elliott wave is determined by the maximum peak of AO in the range from 100 to 140 bars. The presence of divergence between the maximum AO peak and the subsequent lower AO peak in this interval also warns of a possible correction, especially if the AO crosses the zero line between these AO peaks. Therefore, the chart additionally displays the prices of the highest and lowest bars, as well as the maximum or minimum peak of AO in the interval of 140 bars from the last bar. In the indicator settings, you can hide labels, lines, change the number of bars and any parameters for the AO indicator - method (SMA, Smoothed SMA, EMA and others), length, source (open, high, low, close, hl2 and others).
Bullish Divergent bar
🟢 A buy signal (Long) is a Bullish Divergent bar with a green circle displayed above it if such a bar simultaneously meets all of the following conditions:
The high of the bar is below all lines of the Alligator indicator.
The closing price of the bar is above its middle, i.e. close > (high + low) / 2.
The low of the bar is below the low of 2 previous bars or below the low of one previous bar, and the low of the second previous bar is a lower fractal (▼). By default, Divergent bars are not displayed, the low of which is lower than the low of only one previous bar and the low of the 2nd previous bar is not a lower fractal (▼), but you can enable the display of any Divergent bars in the indicator settings (by setting the value "no" in the " field Divergent Bars > Filtration").
The following conditions strengthen the Bullish Divergent bar signal:
The opening price of the bar, as well as the closing price, is higher than its middle, i.e. Open > (high + low) / 2.
The high of the bar is below all lines of the open Alligator indicator, i.e. the green line (Lips) is below the red line (Teeth) and the red line is below the blue line (Jaw). In this case, the color of the circle above the Bullish Divergent bar is dark green.
Squat Divergent bar.
The bar following the Bullish Divergent bar corresponds to the green color of the Awesome Oscillator.
Divergence on Awesome Oscillator.
Formation of the lower fractal (▼), in which the low of the Divergent bar is the peak of the fractal.
Bearish Divergent bar
🔴 A signal to sell (Short) is a Bearish Divergent bar under which a red circle is displayed if such a bar simultaneously meets all the following conditions:
The low of the bar is above all lines of the Alligator indicator.
The closing price of the bar is below its middle, i.e. close < (high + low) / 2.
The high of the bar is higher than the high of 2 previous bars or higher than the high of one previous bar, and the high of the second previous bar is an upper fractal (▲). By default, Divergent bars are not displayed, the high of which is higher than the high of only one previous bar and the high of the 2nd previous bar is not an upper fractal (▲), but you can enable the display of any Divergent bars in the indicator settings (by setting the value "no" in the " field Divergent Bars > Filtration").
The following conditions strengthen the Bearish Divergent bar signal:
The opening price of the bar, as well as the closing price, is below its middle, i.e. open < (high + low) / 2.
The low of the bar is above all lines of the open Alligator indicator, i.e. the green line (Lips) is above the red line (Teeth) and the red line is above the blue line (Jaw). In this case, the color of the circle under the Bearish Divergent bar is dark red.
Squat Divergent bar.
The bar following the Bearish Divergent bar corresponds to the red color of the Awesome Oscillator.
Divergence on Awesome Oscillator.
Formation of the upper fractal (▲), in which the high of the Divergent bar is the peak of the fractal.
Alligator lines crossing
Bars crossing the green line (Lips) of the open Alligator indicator is the first warning of a possible correction (price rollback) if one of the following conditions is met:
If the bar closed below the Lips line, which is above the Teeth line, and the Teeth line is above the Jaw line, while the closing price of the previous bar is above the Lips line.
If the bar closed above the Lips line, which is below the Teeth line, and the Teeth line is below the Jaw line, while the closing price of the previous bar is below the Lips line.
The intersection of all open Alligator lines by bars is a sign of a deep correction and a warning of a possible trend change.
Frequent intersection of Alligator lines with each other is a sign of a sideways trend (flat).
Signal Alerts
To receive notifications about signals when creating an alert, you must select the condition "Any alert() function is call", in which case notifications will arrive in the following format:
D — timeframe, for example: D, 4H, 15m.
🟢 BDB⎾ - a signal for a Bullish Divergent bar to buy (Long), triggers once after the bar closes and includes additional signals:
/// — if Alligator is open.
⏉ — if the opening price of the bar, as well as the closing price, is above its middle.
+ Squat 🔷 - Squat bar or + Green ↑ - "Green" bar or + Fake ↓ - Fake bar.
+ AO 🟩 - if after the Divergent bar closes, the oscillator color change for the next bar corresponds the green color of the Awesome Oscillator. ┴/┬ — AO above/below the zero line. ∇ — if there is divergence on AO in the interval of 140 bars from the last bar.
🔴 BDB⎿ - a signal for a Bearish Divergent bar to sell (Short), triggers once after the bar closes and includes additional signals:
/// — if Alligator is open.
⏊ — if the opening price of the bar, as well as the closing price, is below its middle.
+ Squat 🔷 - Squat bar or + Green ↑ - "Green" bar or + Fake ↓ - Fake bar.
+ AO 🟥 - if after the Divergent bar closes, the oscillator color change for the next bar corresponds to the red color of the Awesome Oscillator. ┴/┬ — AO above/below the zero line. ∇ — if there is divergence on AO in the interval of 140 bars from the last bar.
Alert for bars crossing the green line (Lips) of the open Alligator indicator (can be disabled in the indicator settings in the "Alligator > Enable crossing lips alerts" field):
🔴 Crossing Lips ↓ - if the bar closed below the Lips line, which is above than the other lines, while the closing price of the previous bar is above the Lips line.
🟢 Crossing Lips ↑ - if the bar closed above the Lips line, which is below the other lines, while the closing price of the previous bar is below the Lips line.
The fractal signal is triggered after the second bar closes, completing the formation of the fractal, if alerts about fractals are enabled in the indicator settings (the "Fractals > Enable alerts" field):
🟢 Fractal ▲ - upper (Bearish) fractal.
🔴 Fractal ▼ — lower (Bullish) fractal.
⚪️ Fractal ▲/▼ - both upper and lower fractal.
↳ (H=high - L=low) = difference.
If you redirect notifications to a webhook URL, for example, to a Telegram bot, then you need to set the notification template for the webhook in the indicator settings in the "Webhook > Message" field (contains a tooltip with an example), in which you just need to specify the text {{message}}, which will be automatically replaced with the alert text with a ticker and a link to TradingView.
‼️ A signal is not a call to action, but only a reason to analyze the chart to make a decision based on the rules of your strategy.
***
Индикатор включает в себя Williams Alligator, Williams Fractals, Дивергентные бары, Market Facilitation Index, самый высокий и самый низкий бары, максимальный и минимальный пик Awesome Oscillator, а также оповещения о сигналах на основе стратегии Profitunity Билла Вильямса.
MFI и Awesome Oscillator
В соответствии с осциллятором Market Facilitation Index Приседающий бар окрашен в синий цвет, все остальные бары окрашены в соответствии с цветом Awesome Oscillator, кроме Фальшивых баров, которые окрашены более светлым цветом AO. В настройках индикатора вы можете включить отображение "Зеленых" баров (в поле "Green Bars > Show"). В настройках стиля индикатора вы можете выключить изменение цвета баров в соответствии с цветом AO (в поле "AO bars"), в том числе изменить цвет для Фальшивых баров (в поле "Fake AO bars").
MFI рассчитывается по формуле: (high - low) / volume.
Приседающий бар означает, что по сравнению с предыдущим баром его MFI снизился и в тоже время вырос его объем, т.е. MFI < предыдущего бара и объем > предыдущего бара. Признак возможного разворота цены, поэтому это особенно важный сигнал.
Фальшивый бар является противоположностью Приседающему бару и означает, что по сравнению с предыдущим баром его MFI увеличился и в тоже время снизился его объем, т.е. MFI > предыдущего бара и объем < предыдущего бара.
"Зеленый" бар означает, что по сравнению с предыдущим баром его MFI увеличился и в тоже время вырос его объем, т.е. MFI > предыдущего бара и объем > предыдущего бара. Признак продолжения тренда. Но более значимым подтверждением тренда или предупреждением о возможном развороте является Awesome Oscillator, который измеряет движущую силу рынка путем вычисления разницы между 5 Периодной и 34 Периодной Простыми Скользящими Средними (SMA 5 - SMA 34) по средним точкам баров (hl2). Поэтому по умолчанию "Зеленые" бары и противоположные им "Увядающие" бары окрашены в соответствии с цветом Awesome Oscillator.
По стратегии Profitunity Билла Вильямса с помощью осциллятора Awesome Oscillator определяется третья волна Эллиота по максимальному пику AO в интервале от 100 до 140 баров. Наличие дивергенции между максимальным пиком AO и следующим за ним более низким пиком AO в этом интервале также предупреждает о возможной коррекции, особенно если AO переходит через нулевую линию между этими пиками AO. Поэтому на графике дополнительно отображаются цены самого высокого и самого низкого баров, а также максимальный или минимальный пик АО в интервале 140 баров от последнего бара. В настройках индикатора вы можете скрыть метки, линии, изменить количество баров и любые параметры для индикатора AO – метод (SMA, Smoothed SMA, EMA и другие), длину, источник (open, high, low, close, hl2 и другие).
Бычий Дивергентный бар
🟢 Сигналом на покупку (Long) является Бычий Дивергентный бар над которым отображается зеленый круг, если такой бар соответствует одновременно всем следующим условиям:
Максимум бара ниже всех линий индикатора Alligator.
Цена закрытия бара выше его середины, т.е. close > (high + low) / 2.
Минимум бара ниже минимума 2-х предыдущих баров или ниже минимума одного предыдущего бара, а минимум второго предыдущего бара является нижним фракталом (▼). По умолчанию не отображаются Дивергентные бары, минимум которых ниже минимума только одного предыдущего бара и минимум 2-го предыдущего бара не является нижним фракталом (▼), но вы можете включить отображение любых Дивергентных баров в настройках индикатора (установив значение "no" в поле "Divergent Bars > Filtration").
Усилением сигнала Бычьего Дивергентного бара являются следующие условия:
Цена открытия бара, как и цена закрытия, выше его середины, т.е. Open > (high + low) / 2.
Максимум бара ниже всех линий открытого индикатора Alligator, т.е. зеленая линия (Lips) ниже красной линии (Teeth) и красная линия ниже синей линии (Jaw). В этом случае цвет круга над Бычьим Дивергентным баром окрашен в темно-зеленый цвет.
Приседающий Дивергентный бар.
Бар, следующий за Бычьим Дивергентным баром, соответствует зеленому цвету Awesome Oscillator.
Дивергенция на Awesome Oscillator.
Образование нижнего фрактала (▼), у которого минимум Дивергентного бара является пиком фрактала.
Медвежий Дивергентный бар
🔴 Сигналом на продажу (Short) является Медвежий Дивергентный бар под которым отображается красный круг, если такой бар соответствует одновременно всем следующим условиям:
Минимум бара выше всех линий индикатора Alligator.
Цена закрытия бара ниже его середины, т.е. close < (high + low) / 2.
Максимум бара выше маскимума 2-х предыдущих баров или выше максимума одного предыдущего бара, а максимум второго предыдущего бара является верхним фракталом (▲). По умолчанию не отображаются Дивергентные бары, максимум которых выше максимума только одного предыдущего бара и максимум 2-го предыдущего бара не является верхним фракталом (▲), но вы можете включить отображение любых Дивергентных баров в настройках индикатора (установив значение "no" в поле "Divergent Bars > Filtration").
Усилением сигнала Медвежьего Дивергентного бара являются следующие условия:
Цена открытия бара, как и цена закрытия, ниже его середины, т.е. open < (high + low) / 2.
Минимум бара выше всех линий открытого индикатора Alligator, т.е. зеленая линия (Lips) выше красной линии (Teeth) и красная линия выше синей линии (Jaw). В этом случае цвет круга под Медвежьим Дивергентным Баром окрашен в темно-красный цвет.
Приседающий Дивергентный бар.
Бар, следующий за Медвежьим Дивергентным баром, соответствует красному цвету Awesome Oscillator.
Дивергенция на Awesome Oscillator.
Образование верхнего фрактала (▲), у которого максимум Дивергентного бара является пиком фрактала.
Пересечение линий Alligator
Пересечение барами зеленой линии (Lips) открытого индикатора Alligator является первым предупреждением о возможной коррекции (откате цены) при выполнении одного из следующих условий:
Если бар закрылся ниже линии Lips, которая выше линии Teeth, а линия Teeth выше линии Jaw, при этом цена закрытия предыдущего бара находится выше линии Lips.
Если бар закрылся выше линии Lips, которая ниже линии Teeth, а линия Teeth ниже линии Jaw, при этом цена закрытия предыдущего бара находится ниже линии Lips.
Пересечение барами всех линий открытого Alligator является признаком глубокой коррекции и предупреждением о возможной смене тренда.
Частое пересечение линий Alligator между собой является признаком бокового тренда (флэт).
Оповещения о сигналах
Для получения уведомлений о сигналах при создании оповещения необходимо выбрать условие "При любом вызове функции alert()", в таком случае уведомления будут приходить в следующем формате:
D — таймфрейм, например: D, 4H, 15m.
🟢 BDB⎾ — сигнал Бычьего Дивергентного бара на покупку (Long), срабатывает один раз после закрытия бара и включает дополнительные сигналы:
/// — если Alligator открыт.
⏉ — если цена открытия бара, как и цена закрытия, выше его середины.
+ Squat 🔷 — Приседающий бар или + Green ↑ — "Зеленый" бар или + Fake ↓ — Фальшивый бар.
+ AO 🟩 — если после закрытия Дивергентного бара, изменение цвета осциллятора для следующего бара соответствует зеленому цвету Awesome Oscillator. ┴/┬ — AO выше/ниже нулевой линии. ∇ — если есть дивергенция на AO в интервале 140 баров от последнего бара.
🔴 BDB⎿ — сигнал Медвежьего Дивергентного бара на продажу (Short), срабатывает один раз после закрытия бара и включает дополнительные сигналы:
/// — если Alligator открыт.
⏊ — если цена открытия бара, как и цена закрытия, ниже его середины.
+ Squat 🔷 — Приседающий бар или + Green ↑ — "Зеленый" бар или + Fake ↓ — Фальшивый бар.
+ AO 🟥 — если после закрытия Дивергентного бара, изменение цвета осциллятора для следующего бара соответствует красному цвету Awesome Oscillator. ┴/┬ — AO выше/ниже нулевой линии. ∇ — если есть дивергенция на AO в интервале 140 баров от последнего бара.
Сигнал пересечения барами зеленой линии (Lips) открытого индикатора Alligator (можно отключить в настройках индикатора в поле "Alligator > Enable crossing lips alerts"):
🔴 Crossing Lips ↓ — если бар закрылся ниже линии Lips, которая выше остальных линий, при этом цена закрытия предыдущего бара находится выше линии Lips.
🟢 Crossing Lips ↑ — если бар закрылся выше линии Lips, которая ниже остальных линий, при этом цена закрытия предыдущего бара находится ниже линии Lips.
Сигнал фрактала срабатывает после закрытия второго бара, завершающего формирование фрактала, если оповещения о фракталах включены в настройках индикатора (поле "Fractals > Enable alerts"):
🟢 Fractal ▲ — верхний (Медвежий) фрактал.
🔴 Fractal ▼ — нижний (Бычий) фрактал.
⚪️ Fractal ▲/▼ — одновременно верхний и нижний фрактал.
↳ (H=high - L=low) = разница.
Если вы перенаправляете оповещения на URL вебхука, например, в бота Telegram, то вам необходимо установить шаблон оповещения для вебхука в настройках индикатора в поле "Webhook > Message" (содержит подсказку с примером), в котором в качестве текста сообщения достаточно указать текст {{message}}, который будет автоматически заменен на текст оповещения с тикером и ссылкой на TradingView.
‼️ Сигнал — это не призыв к действию, а лишь повод проанализировать график для принятия решения на основе правил вашей стратегии.

MACD / Connectable [Azullian]Enhance your market insight with the MACD indicator. Monitor momentum to make more informed trading decisions, facilitating the development of stronger strategies.
This connectable MACD indicator is part of an indicator system designed to help test, visualize and build strategy configurations without coding. Like all connectable indicators , it interacts through the TradingView input source, which serves as a signal connector to link indicators to each other. All connectable indicators send signal weight to the next node in the system until it reaches either a connectable signal monitor, signal filter and/or strategy.
█ UNIFORM SETTINGS AND A WAY OF WORK
Although connectable indicators may have specific weight scoring conditions, they all aim to follow a standardized general approach to weight scoring settings, as outlined below.
■ Connectable indicators - Settings
• 🗲 Energy: Energy applies an ATR multiplier to the plotted shapes on the chart. A higher value plots shapes farther away from the candle, enhancing visibility.
• ☼ Brightness: Brightness determines the opacity of the shape plotted on the chart, aiding visibility. Indicator weight also influences opacity.
• → Input: Use the input setting to specify a data source for the indicator. Here you can connect the indicator to other indicators.
• ⌥ Flow: Determine where you want to receive signals from:
○ Both: Weights from this indicator and the connected indicator will apply
○ Indicator only: Only weights from this indicator will apply
○ Input only: Only weights from the connected indicator will apply
• ⥅ Weight multiplier: Multiply all weights in the entire indicator by a given factor, useful for quickly testing different indicators in a granular setup.
• ⥇ Threshold: Set a threshold to indicate the minimum amount of weight it should receive to pass it through to the next indicator.
• ⥱ Limiter: Set a hard limit to the maximum amount of weight that can be fed through the indicator.
■ Connectable indicators - Weight scoring settings
▢ Weight scoring conditions
• SM – Signal mode: Enable specific conditions for weight scoring
○ All: All signals will be scored.
○ Entries only: Only entries will score.
○ Exits only: Only exits will score.
○ Entries & exits: Both entries and exits will score.
○ Zone: Continuous scoring for each candle within the zone.
• SP – Signal period: Defines a range of candles within which a signal can score.
• SC - Signal count: Specifies the number of bars to retrospectively examine and score.
○ Single: Score for a single occurrence
○ All occurrences: Score for all occurrences
○ Single + Threshold: Score for single occurrences within the signal period (SP)
○ Every + Threshold: Score for all occurrences within the signal period (SP)
▢ Weight scoring direction
• ES: Enter Short weight
• XL: Exit long weight
• EL: Enter Long weight
• XS: Exit Short weight
▢ Weight scoring values
• Weights can hold either positive or negative scores. Positive weights enhance a particular trading direction, while negative weights diminish it.
█ MACD - INDICATOR SETTINGS
■ Main settings
• Enable/Disable Indicator: Toggle the entire indicator on or off.
• S - Source: Choose an alternative data source for the MACD calculation.
• T - Timeframe: Select an alternative timeframe for the MACD calculation.
• FL - Fast Length: Define the number of bars or periods used in the MACD calculation for the fast length.
• SL - Fast Length: Define the number of bars or periods used in the MACD calculation for the slow length.
• SM - Smoothing: Smooths the averaged MACD over a specified period.
• C - Condition Define the smoothing amount
○ Above/Below zero: : Trigger when the MACD line is above or below zero
○ All: : Trigger on all conditions
■ MACD Scoring functionality
• The MACD scores long entries when it crosses above its smoothed value and is below the zero line.
• The MACD scores long exits when it crosses below its smoothed value after a long entry.
• The MACD scores long zones the entire time the MACD line is above its smoothed value and below zero.
• The MACD scores short entries when it crosses below its smoothed value and is above the zero line.
• The MACD scores short exits when it crosses above its smoothed value after a short entry.
• The MACD scores short zones the entire time the MACD line is below its smoothed value and above zero.
█ PLOTTING
• Standard: Symbols (EL, XS, ES, XL) appear relative to candles based on set conditions. Their opacity and position vary with weight.
• Conditional Settings: A larger icon appears if global conditions are met. For instance, with a Threshold(⥇) of 12, Signal Period (SP) of 3, and Scoring Condition (SC) set to "EVERY", an MACD signaling over two times in 3 candles (scoring 6 each) triggers a larger icon.
█ USAGE OF CONNECTABLE INDICATORS
■ Connectable chaining mechanism
Connectable indicators can be connected directly to the signal monitor, signal filter or strategy , or they can be daisy chained to each other while the last indicator in the chain connects to the signal monitor, signal filter or strategy. When using a signal filter you can chain the filter to the strategy input to make your chain complete.
• Direct chaining: Connect an indicator directly to the signal monitor, signal filter or strategy through the provided inputs (→).
• Daisy chaining: Connect indicators using the indicator input (→). The first in a daisy chain should have a flow (⌥) set to 'Indicator only'. Subsequent indicators use 'Both' to pass the previous weight. The final indicator connects to the signal monitor, signal filter, or strategy.
■ Set up this indicator with a signal filter and strategy
The indicator provides visual cues based on signal conditions. However, its weight system is best utilized when paired with a connectable signal filter, monitor, or strategy .
Let's connect the MACD to a connectable signal filter and a strategy :
1. Load all relevant indicators
• Load MACD / Connectable
• Load Signal filter / Connectable
• Load Strategy / Connectable
2. Signal Filter: Connect the MACD to the Signal Filter
• Open the signal filter settings
• Choose one of the three input dropdowns (1→, 2→, 3→) and choose : MACD / Connectable: Signal Connector
• Toggle the enable box before the connected input to enable the incoming signal
3. Signal Filter: Update the filter signals settings if needed
• The default settings of the filter enable EL (Enter Long), XL (Exit Long), ES (Enter Short) and XS (Exit Short).
4. Signal Filter: Update the weight threshold settings if needed
• All connectable indicators load by default with a score of 6 for each direction (EL, XL, ES, XS)
• By default, weight threshold (TH) is set at 5. This allows each occurrence to score, as the default score in each connectable indicator is 1 point above the threshold. Adjust to your liking.
5. Strategy: Connect the strategy to the signal filter in the strategy settings
• Select a strategy input → and select the Signal filter: Signal connector
6. Strategy: Enable filter compatible directions
• Set the signal mode of the strategy to a compatible direction with the signal filter.
Now that everything is connected, you'll notice green spikes in the signal filter representing long signals, and red spikes indicating short signals. Trades will also appear on the chart, complemented by a performance overview. Your journey is just beginning: delve into different scoring mechanisms, merge diverse connectable indicators, and craft unique chains. Instantly test your results and discover the potential of your configurations. Dive deep and enjoy the process!
█ BENEFITS
• Adaptable Modular Design: Arrange indicators in diverse structures via direct or daisy chaining, allowing tailored configurations to align with your analysis approach.
• Streamlined Backtesting: Simplify the iterative process of testing and adjusting combinations, facilitating a smoother exploration of potential setups.
• Intuitive Interface: Navigate TradingView with added ease. Integrate desired indicators, adjust settings, and establish alerts without delving into complex code.
• Signal Weight Precision: Leverage granular weight allocation among signals, offering a deeper layer of customization in strategy formulation.
• Advanced Signal Filtering: Define entry and exit conditions with more clarity, granting an added layer of strategy precision.
• Clear Visual Feedback: Distinct visual signals and cues enhance the readability of charts, promoting informed decision-making.
• Standardized Defaults: Indicators are equipped with universally recognized preset settings, ensuring consistency in initial setups across different types like momentum or volatility.
• Reliability: Our indicators are meticulously developed to prevent repainting. We strictly adhere to TradingView's coding conventions, ensuring our code is both performant and clean.
█ COMPATIBLE INDICATORS
Each indicator that incorporates our open-source 'azLibConnector' library and adheres to our conventions can be effortlessly integrated and used as detailed above.
For clarity and recognition within the TradingView platform, we append the suffix ' / Connectable' to every compatible indicator.
█ COMMON MISTAKES, CLARIFICATIONS AND TIPS
• Removing an indicator from a chain: Deleting a linked indicator and confirming the "remove study tree" alert will also remove all underlying indicators in the object tree. Before removing one, disconnect the adjacent indicators and move it to the object stack's bottom.
• Point systems: The azLibConnector provides 500 points for each direction (EL: Enter long, XL: Exit long, ES: Enter short, XS: Exit short) Remember this cap when devising a point structure.
• Flow misconfiguration: In daisy chains the first indicator should always have a flow (⌥) setting of 'indicator only' while other indicator should have a flow (⌥) setting of 'both'.
• Hide attributes: As connectable indicators send through quite some information you'll notice all the arguments are taking up some screenwidth and cause some visual clutter. You can disable arguments in Chart Settings / Status line.
• Layout and abbreviations: To maintain a consistent structure, we use abbreviations for each input. While this may initially seem complex, you'll quickly become familiar with them. Each abbreviation is also explained in the inline tooltips.
• Inputs: Connecting a connectable indicator directly to the strategy delivers the raw signal without a weight threshold, meaning every signal will trigger a trade.
█ A NOTE OF GRATITUDE
Through years of exploring TradingView and Pine Script, we've drawn immense inspiration from the community's knowledge and innovation. Thank you for being a constant source of motivation and insight.
█ RISK DISCLAIMER
Azullian's content, tools, scripts, articles, and educational offerings are presented purely for educational and informational uses. Please be aware that past performance should not be considered a predictor of future results.

Stochastic Trend Evaluator (STE)Stochastic Trend Evaluator (STE): Detailed Description
Overview :
The Stochastic Trend Evaluator (STE) is a sophisticated trading tool designed for TradingView that combines stochastic oscillation analysis with Exponential Moving Average (EMA) trends. It is tailored to assist traders in identifying potential buy and sell opportunities in various market conditions, particularly focusing on trend reversals and momentum shifts.
Functionality & Concept :
The STE is built on two core components – the Stochastic Oscillator and the 200-period EMA.
Stochastic Oscillator :
This oscillator is a momentum indicator comparing a particular closing price of a security to a range of its prices over a certain period.
Settings:
- %K Length: 14
- %K Smoothing: 3
- %D Smoothing: 3
The %K line is the main line indicating momentum, while the %D line is a moving average of %K, providing signal triggers.
200 EMA :
The 200-period EMA serves as a dynamic trend indicator.
It helps in distinguishing between bullish and bearish market phases.
A closing price above the 200 EMA suggests a bullish trend, while below it indicates a bearish trend.
Signal Generation :
STE generates signals based on the interaction between the Stochastic Oscillator and the 200 EMA.
Buy Signal :
Occurs when the stochastic %K crosses above 20 (indicative of oversold conditions), and the closing price is above the 200 EMA.
Represented visually by green label-up arrows.
Sell Signal :
Triggered when the stochastic %K crosses below 80 (suggestive of overbought conditions), and the closing price is below the 200 EMA.
Indicated by red label-down arrows.
Background Color Indicator :
The background color of the chart changes to enhance visual interpretation of the market condition.
Green background for a bullish market scenario (when a buy signal is active).
Red background for a bearish market scenario (when a sell signal is active).
Usage Guidelines :
The STE is best used in markets that exhibit clear trends.
Ideal for traders focusing on medium to long-term trade setups.
Can be used in conjunction with other indicators for confirmation and risk management.
Note : The STE, being a proprietary tool, is based on a unique blend of standard technical analysis concepts and custom logic to provide these trading signals. It is designed to give traders a comprehensive view of the market momentum and trend strength without revealing the intricate details of its algorithm.

Marubozu PatternsMarubozu Candlestick Patterns Indicator
This TradingView script identifies two types of Marubozu candlestick patterns: the bearish Marubozu and the bullish Marubozu. Marubozu patterns are characterized by a lack of shadows and a long body, indicating strong market sentiment. The indicator displays labels and triggers alerts when these patterns are detected on the price chart.
Features:
Identifies bearish Marubozu and bullish Marubozu candlestick patterns.
Alerts triggered for both patterns.
Labels displayed to highlight pattern occurrences on the chart.
How it works:
The script calculates various properties of candlesticks, such as body length, shadows, and body type. It then identifies both bearish and bullish Marubozu patterns based on specific conditions. When a pattern is detected, a label is shown on the chart with a corresponding tooltip description. Additionally, a background color change emphasizes the presence of detected patterns. Alerts are triggered for both pattern types, helping traders to quickly spot potential trading opportunities.
Note:
This script is designed for use on the TradingView platform using Pine Script. It aids traders in recognizing Marubozu candlestick patterns, providing visual cues and alerts for potential bullish and bearish market sentiments.
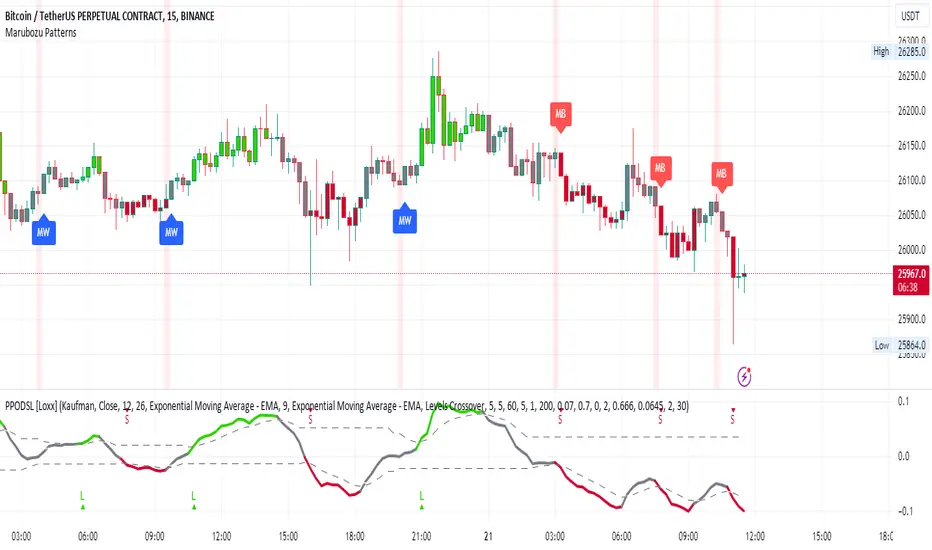
Financial Ratios Fundamental StrategyWhat are financial ratios?
Financial ratios are basic calculations using quantitative data from a company’s financial statements. They are used to get insights and important information on the company’s performance, profitability, and financial health.
Common financial ratios come from a company’s balance sheet, income statement, and cash flow statement.
Businesses use financial ratios to determine liquidity, debt concentration, growth, profitability, and market value.
The common financial ratios every business should track are
1) liquidity ratios
2) leverage ratios
3)efficiency ratio
4) profitability ratios
5) market value ratios.
Initially I had a big list of 20 different ratios for testing, but in the end I decided to stick for the strategy with these ones :
Current ratio: Current Assets / Current Liabilities
The current ratio measures how a business’s current assets, such as cash, cash equivalents, accounts receivable, and inventories, are used to settle current liabilities such as accounts payable.
Interest coverage ratio: EBIT / Interest expenses
Companies generally pay interest on corporate debt. The interest coverage ratio shows if a company’s revenue after operating expenses can cover interest liabilities.
Payables turnover ratio: Cost of Goods sold (or net credit purchases) / Average Accounts Payable
The payables turnover ratio calculates how quickly a business pays its suppliers and creditors.
Gross margin: Gross profit / Net sales
The gross margin ratio measures how much profit a business makes after the cost of goods and services compared to net sales.
With this data, I have created the long and long exit strategy:
For long, if any of the 4 listed ratios,such as current ratio or interest coverage ratio or payable turn ratio or gross margin ratio is ascending after a quarter, its a potential long entry.
For example in january the gross margin ratio is at 10% and in april is at 15%, this is an increase from a quarter to another, so it will get a long entry trigger.
The same could happen if any of the 4 listed ratios follow the ascending condition since they are all treated equally as important
For exit, if any of the 4 listed ratios are descending after a quarter, such as current ratio or interest coverage ratio or payable turn ratio or gross margin ratio is descending after a quarter, its a potential long exit.
For example in april we entered a long trade, and in july data from gross margin comes as 12% .
In this case it fell down from 15% to 12%, triggering an exit for our trade.
However there is a special case with this strategy, in order to make it more re active and make use of the compound effect:
So lets say on july 1 when the data came in, the gross margin data came descending (indicating an exit for the long trade), however at the same the interest coverage ratio came as positive, or any of the other 3 left ratios left . In that case the next day after the trade closed, it will enter a new long position and wait again until a new quarter data for the financial is being published.
Regarding the guidelines of tradingview, they recommend to have more than 100 trades.
With this type of strategy, using Daily timeframe and data from financials coming each quarter(4 times a year), we only have the financial data available since 2016, so that makes 28 quarters of data, making a maximum potential of 28 trades.
This can however be "bypassed" to check the integrity of the strategy and its edge, by taking for example multiple stocks and test them in a row, for example, appl, msft, goog, brk and so on, and you can see the correlation between them all.
At the same time I have to say that this strategy is more as an educational one since it miss a risk management and other additional filters to make it more adapted for real live trading, and instead serves as a guiding tool for those that want to make use of fundamentals in their trades
If you have any questions, please let me know !
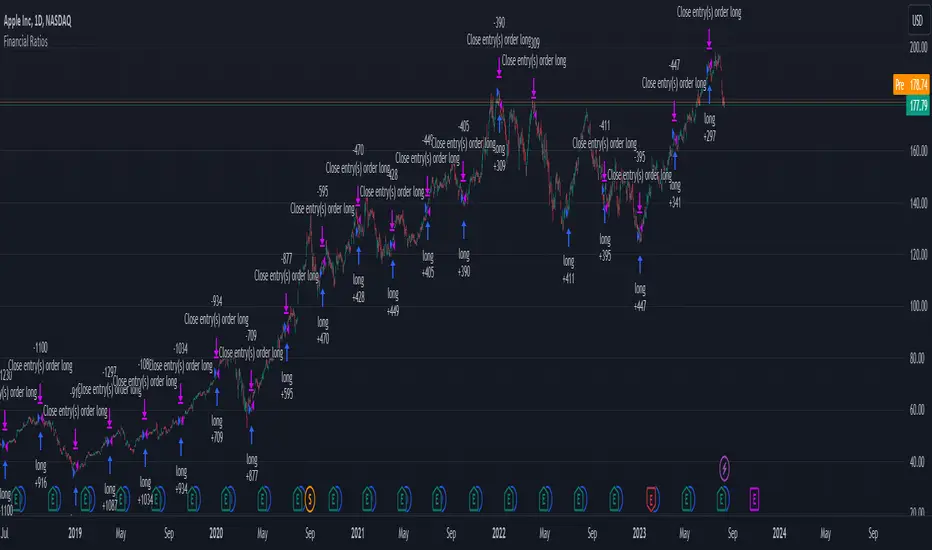
7 Week RuleThe 7 week rule was shared by Gil Morales in his book “Trade Like an O’Neil Disciple”. The rule is described as: Stocks that have shown a tendency to “obey” or “respect” the 10-day moving average for at least 7 weeks in an uptrend should often be sold once the stock violates the 10-day line. A “violation” is defined as a close below the 10-day moving average followed by a move on the next day below the intraday low of the first day.
This indicator makes using the 7 week rule easy. Once a stock has closed above its selected moving average (10SMA by default) for 35 days the 7 week rule is triggered. Once the stock then “violates” the moving average, a sell signal is printed on the chart.
Indicator Customizations
Moving Average Length & Type
Show or Hide Moving Average
Show Running Count of Days Above Selected MA
Highlight When 7 Week Rule Triggers
Option to Show First Day Above MA
Indicator is dynamic and will continue the count if no violation occurs.
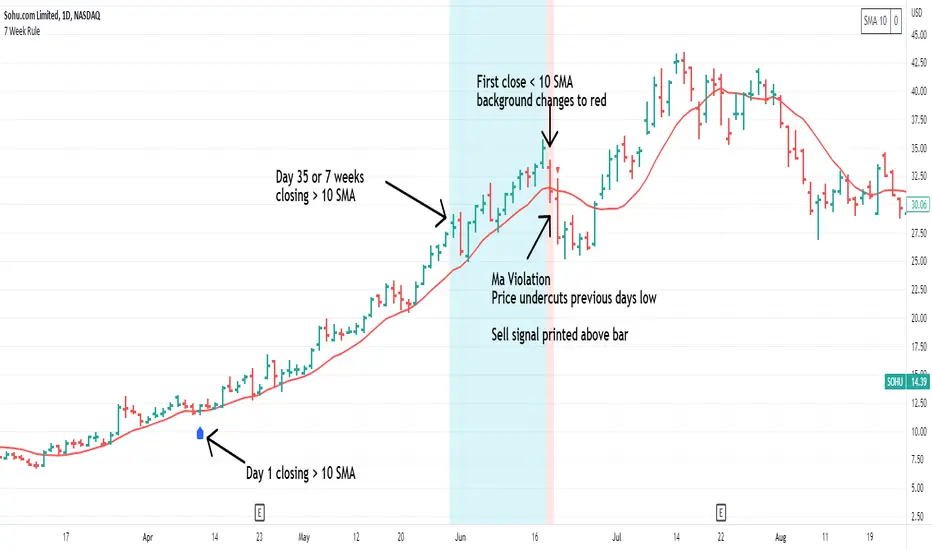
Top 40 High Low Strategy for SPY, 5minThis strategy is developed based on my High Low Index SPY Top 40 indicator
Notes:
- this strategy is only developed for SPY on the 5 min chart . It seems to work with QQQ as well, but it isn't optimized for it
- P/L shown is based on 10 SPY option contracts, call or put, with strike price closest to the entry SPY price and expiry of 0 to 1 day. This includes commissions (can be changed). This is only an estimate calculated using an arbitrary multiplier factor, this can be changed in the setting
- P/L is based on $5000 initial capital
- Works with both regular / extended trading session turned on/off. However, max drawdown is 1/2 with extended trading session ON
- there is still a bug that doesn't allow alert to be created due to calculation error, will update once fixed
This strategy combines signals from the following indicators to determine entry signals:
- High Low Index SPY Top 40
- MACD
- Linear Regression Slope
Entry signal is triggered when:
- High Low Index line crosses the EMA line
- MACD trending in the same direction
- Linear Regression slope is accelerating above a threshold in the same direction, indicating a strong trend
Profit target(PT) and stop loss(SL) are determined using ATR value, with 2:1 Reward to Risk ratio as default.
Exit signal may be triggered prior to PT or SL trigger when:
- High Low Index SPY Top 40 shows a reversal after overbought or oversold conditions (optional)
- Opposite entry signal is triggered
There are a number of optional settings:
- Turn on/off "option trading", P/L will be calculated using share price only without multiplication factor for trading option contracts
- # of options per trade, default to 10
- Reinvest with profit made
- Trade with trailing SL after PT hit
- Take profit early based on Top 40 overbought/oversold
- Trade 0/1 day expiry. This will signal exit by the end of the day on Mon/Wed/Fri, and only exits 1/2 of positions (if in profit) on Tues/Thurs
- Can reduce the SL level without impacting PT
- No entry between 10:05 - 10:20 (don't ask me why, but statistically it performs better)
Consider donating me some of your profit if you make $$$ hahaha~ ;)
Enjoy~~

RJM Indicator for 10EMA Swing trade strategyIndicator for a 10ema trading strategy.
Green triangle below a candle indicates a bearish candle that closed above the 10ema. Indicates it may be a good time to go long on this stock. Entry could be a stop limit buy above the high of the candle that triggered the indicator. Stop could be set below the 10ema line, and the low of the candle.
Red triangle above a candle indicates a bullish candle that closed below the 10ema. Indicates it may be a good time to go short on this stock. Entry could be a stop limit sell below the low of the candle that triggered the indicator. Stop could be set above the 10ema and the high of the candle.
Generally, look to setup based on the first candle that triggers the indicator in a given direction. Target is generally 1.2R above entry (where R = Entry Price - Stop Price)
When deciding whether to take the trade, keep in mind any other support/resistance levels that may be evident between your entry price and your target price.
Only trade within your own risk tolerance. Always use stops. Remember you are the one clicking the buttons - take responsibility for your own trades, and as with any strategy, make sure you backtest it before trading live.
