Multi Condition Stock Screener & Alert SystemMulti Condition Stock Screener & Strategy Builder
This script is a comprehensive Stock Screener and Strategy Builder designed to scan predefined groups of stocks (specifically focused on BIST/Istanbul Stock Exchange symbols) or a custom list of symbols based on user-defined technical conditions.
It allows users to combine multiple technical indicators to create complex entry or exit conditions without writing code. The script iterates through a list of symbols and triggers alerts when the conditions are met.
Key Features
• Custom Strategy Building: Users can define up to 6 separate conditions. • Logical Operators: Conditions can be linked using logical operators (AND / OR) to create flexible strategies. • Predefined Groups: Includes 14 groups of stocks (covering BIST symbols) for quick scanning. • Custom Scanner: Users can select the "SPECIAL" group to manually input up to 40 custom symbols to scan. • Directional Scanning: Capable of scanning for both Buy/Long and Sell/Short signals. • Alert Integration: Generates JSON-formatted alert messages suitable for webhook integrations (e.g., sending notifications to Telegram bots).
Supported Indicators for Conditions
The script utilizes built-in ta.* functions to calculate the following indicators:
• MA (Moving Average): Supports EMA, SMA, RMA, and WMA. • RSI (Relative Strength Index) • CCI (Commodity Channel Index) • ATR (Average True Range) • BBW (Bollinger Bands Width) • ADX (Average Directional Index) • MFI (Money Flow Index) • MOM (Momentum)
How it Works
The script uses request.security() to fetch data for the selected group of symbols based on the current timeframe. It evaluates the user-defined logic (Condition 1 to 6) for each symbol.
• Comparison Logic: You can compare an indicator against a value (e.g., RSI > 50 ) or against another indicator (e.g., MA1 CrossOver MA2 ). • Signal Generation: If the logical result is TRUE based on the "AND/OR" settings, a visual label is plotted on the chart, and an alert condition is triggered.
Alert Configuration
The script produces a JSON output containing the Ticker, Signal Type, Period, and Price. This is optimized for users who want to parse alerts programmatically or send them to external messaging apps via webhooks.
Disclaimer This tool is for informational purposes only and does not constitute financial advice. Since it uses request.security across multiple symbols, please allow time for the script to load data on the chart.
Cari skrip untuk "trigger"

NIFTY Options Breakout StrategyThis strategy trades NIFTY 50 Options (CALL & PUT) using 5-minute breakout logic, strict trend filters, expiry-based symbol validation, and a dynamic trailing-profit engine.
1️⃣ Entry Logic
Only trades NIFTY 50 options, filtered automatically by symbol.
Trades only between 10:00 AM – 2:15 PM (5m bars).
Breakout trigger:
Price enters the buy breakout zone (high of last boxLookback bars ± buffer).
Trend filter:
Price must be above EMA50 or EMA200,
AND EMA50 ≥ EMA100 (to avoid weak conditions).
Optional strengthening:
EMA20>EMA50 OR EMA50>EMA100 recent cross can be enforced.
Higher-timeframe trend check:
EMA50 > EMA200 (bullish regime only).
Start trading options only after expiry–2 months (auto-parsed).
2️⃣ One Trade Per Day
Maximum 1 long trade per day.
No shorting (long-only strategy).
3️⃣ Risk Management — SL, TP & Trailing
Includes three types of exits:
🔹 A) Hard SL/TP
Hard Stop-Loss: -15%
Hard Take-Profit: +40%
🔹 B) Step-Ladder Trailing Profit
As the option price rises, trailing activates:
Max Profit Reached Exit Trigger When Falls To
≥ 35% ≤ 30%
≥ 30% ≤ 25%
≥ 25% ≤ 20%
≥ 20% ≤ 15%
≥ 15% ≤ 10%
≥ 5% ≤ 0%
🔹 C) Loss-Recovery Exit
If loss reaches –10% but then recovers to 0%, exit at breakeven.
4️⃣ Trend-Reversal Exit
If price closes below 5m EMA50, the long is exited instantly.
5️⃣ Optional Intraday Exit
EOD square-off at 3:15 PM.
6️⃣ Alerts for Automation
The strategy provides alerts for:
BUY entry
TP/SL/Trailing exit
EMA50 reversal exit
EOD exit

3TF Supertrend Resonance— 4H/1H/15m+ 3TP/SLMTF Supertrend — 4H / 1H / 15m Confluence + Dynamic TP/SL + Adaptive Trend/Range Filters
This script is a multi-timeframe Supertrend confluence system designed for traders who operate on lower timeframes (15m / 1m) but want higher-timeframe structure, trend confirmation, and dynamic TP/SL projections.
It combines 4H + 1H + 15m Supertrend, trend alignment detection, range filtering, and auto-projected risk-based targets, providing a complete directional framework for both scalping and intraday swing entries.
👉1. Multi-Timeframe Supertrend Framework (4H / 1H / 15m)
The script calculates Supertrend levels and direction on three major timeframes:
-4H Supertrend
-1H Supertrend
-15m Supertrend
Users can choose between:
-Confirmed HTF values (no repaint)
-Live HTF values (more sensitive but may repaint)
Each Supertrend level is plotted on the current chart as a horizontal line, extended far to the left and slightly to the right, with optional lightweight labels showing direction and price.
These levels function as HTF dynamic support/resistance during intraday trading.
👉2. Confluence Detection (4H = 1H = 15m)
A trend confluence occurs when:
-4H direction = 1H direction = 15m direction
When the three timeframes align:
A full-height vertical line marks the first candle of confluence (color-coded bullish/bearish).
An alert is triggered:
“Triple-TF Trend Confluence — First Candle”
This identifies the earliest moment when the market shifts into unified directional behavior.
👉3. Trend Background Coloring (15m + 1m)
When confluence is active:
-Bullish confluence → Green background
-Bearish confluence → Red background
Background visualization is applied on:
-15m timeframe (main directional chart)
-1m timeframe (scalping entries with HTF alignment)
This ensures lower-timeframe decisions always stay aligned with higher-timeframe direction.
👉4. Weak-Trend / Range Detection (Only on 15m)
Even if all three timeframes are aligned, momentum may be weak.
Range/weak-trend detection activates when:
-Confluence = true
-AND (ADX < threshold OR Choppiness > threshold)
On 15m charts:
A grey overlay appears, covering green/red confluence colors.
First candle entering range shows a vertical grey mark (optional).
Alert:
“Confluence but Weak Momentum — First Candle”
This identifies moments where the market is aligned but lacking trend strength — a “trend that doesn’t move.”
👉5. Dynamic TP/SL Projection (1.5R / 3R / 4.5R)
Using the current timeframe’s Supertrend as a structural stop-loss:
SL = current Supertrend line
Risk = | Close - SL |
The script auto-calculates:
TP1 = 1.5 × risk
TP2 = 3.0 × risk
TP3 = 4.5 × risk
All projected upward for bullish trends and downward for bearish trends.
Displayed visually:
Dotted short-range lines for SL, TP1, TP2, TP3
Lightweight left-side labels showing:
SL price + distance
Individual TP prices
This provides an immediate R-multiple framework for trade planning.
👉6. 15m Supertrend Flip Indicator (Minimalistic)
When the 15m Supertrend changes direction:
A tiny circle marker is plotted:
-Bullish flip → below the bar, green
-Bearish flip → above the bar, red
Alerts:
“15m ST Flip Up (Bear → Bull)”
“15m ST Flip Down (Bull → Bear)”
This highlights early shifts in short-term structure before confluence or major trend changes occur.
👉7. Alerts Included
The script provides alerts for:
-Triple-TF Trend Confluence — First Candle
-Weak Trend / Range Start
-15m Supertrend Flip Up
-15m Supertrend Flip Down
These are practical for automated notifications when key structural conditions appear.
Summary
This script provides:
✅ Higher-Timeframe Context
4H, 1H, and 15m Supertrend levels + direction.
✅ Directional Certainty
Triple-timeframe confluence with visual + alert confirmation.
✅ Smart Background Guidance
Color-coded trend zones for 15m & 1m.
✅ Range / Weak Trend Filtering
Avoid false trends using ADX + Choppiness.
✅ Actionable TP/SL Framework
Auto-projected 1.5R / 3R / 4.5R + SL lines based on Supertrend structure.
✅ Precise Intraday Signals
15m Supertrend flips marked with minimalistic dots.

QQQ TimingThis is a trend-following position trading strategy designed for the QQQ and the leveraged ETF QLD (ProShares Ultra QQQ). The primary goal is to capture multi-month holds for maximal profit.
Key Instruments & Performance
The strategy performs best with QLD, which yields far superior results compared to QQQ.
TQQQ (triple-leveraged) results in higher drawdowns and is not the optimal choice.
Important: The system is not intended for use with other indexes, individual stocks, or investments (like crypto or gold), as performance can vary widely.
Buy Signals
The strategy's signals are rooted in the S&P 500 Index (SPX), as testing showed it provides more reliable triggers than using QQQ itself.
Primary Buy Signal (Credit to IBD/Mike Webster): The SPX triggers a buy when its low closes above the 21-day Exponential Moving Average (EMA) for three consecutive days.
Refinement with Downtrend Lines: During corrective or bear periods, results and drawdowns can be significantly improved by incorporating downtrend lines. These lines connect lower highs. The strategy waits for the price to close above a drawn downtrend line before executing a buy. This refinement can modify the primary signal, either by allowing for an earlier entry or, in some cases, completely nullifying a false signal until the trend change proves itself.
Risk Management & Exit Strategy
Initial Buy Risk: A 3.7% stop loss is applied immediately upon the initial entry.
Initial Exit Rule: An exit is required if the QQQ's low drops below the 50-day Simple Moving Average (SMA).
Note: The 3.7% stop often provides protection when the initial buy occurs below the 50-day SMA. However, if QQQ is already trading above its 50-day SMA at the time of the SPX signal (indicating relative strength), historically, it has been better to use the 50-day SMA rule to give the position more room to run.
Trend Exit (Profit-Taking): To stay in a strong trend for the optimal amount of time, the long position is exited when a moving average crossover to the downside is triggered, based around the 107-day Simple Moving Average (SMA).

ONLY LONG – 4H Breakout → 1H EMA(12/21) [Signals]🔹 ONLY LONG – 4H Breakout → 1H EMA(12/21)
Author: SystemsOverFeelings
Type: Signal-only indicator (non-repainting)
Timeframe: Designed for the 1H chart
Markets: BTCUSDT perpetual& major pairs
📖 Concept
A high-timeframe confirmation model for trend-continuation longs.
It detects:
A 4-Hour breakout candle closing above recent range highs,
With very-high volume confirmation, and
Then waits for a 1-Hour pullback into the EMA(12/21) band or a Break of Structure (BOS) to re-enter.
No repainting — all 4H logic uses request.security(..., lookahead_off) for confirmed data.
🧩 Signal Logic
✅ 4H Trigger: Breakout candle with volume > SMA(20) × user multiplier.
✅ Armed Regime: Green background = system ready for 1H entries.
🟢 LONG Signal: 1H candle consolidates inside or touches the EMA band, or shows BOS confirmation.
❌ EXIT Signal: 4H EMA(12) crosses below EMA(21).
All signals are visually marked and alert-ready.
⚙️ Adjustable Parameters
4H volume multiplier
Range lookback days
Pullback strictness (inside/touch)
1H BOS pivot length & mode
Expiry time for invalidated setups
🔔 Alerts
Built-in alerts for:
4H breakout trigger
1H long entry signal
4H band exit
Use them directly via “Create Alert → Condition → This Script → Choose Signal.”
💡 Notes
Works best on BTC/ETH 1H chart.
Non-repainting, multi-timeframe logic.
Use for directional bias or entry timing — not financial advice.

Order Blocks Zones with Signals█ OVERVIEW
“Order Blocks Zones with Signals” is a technical analysis tool that automatically identifies Order Blocks (OB) and optionally Fair Value Gaps (FVG) on the chart.
The script visualizes these zones as colored rectangles, offering full customization of style, transparency, and signal display.
It also generates entry and exit signals (Break & Exit) that can serve as confirmations in strategies based on price action and market structure.
Thanks to flexible candle size filters and rich visual options, the indicator maintains chart clarity and readability.
█ CONCEPTS
Order Blocks (OB) are key zones on the chart where significant price movements previously occurred — areas where large market participants (institutions, so-called smart money) initiated or closed positions.
An OB is the last candle that followed the prior trend before the market reversed (e.g., for a Bullish OB: the last bearish candle before a pivot low and a strong upward impulse).
The script detects these levels using local price pivots, analyzing candle direction to filter out less significant movements.
FVG (Fair Value Gaps) represent areas of imbalance between buyers and sellers — price gaps formed by a sharp impulse where full trading did not occur due to one-sided order dominance (e.g., excess buy or sell orders).
Why combine OB and FVG in one indicator?
Combining OB and FVG analysis is essential because these phenomena often occur sequentially in the institutional market cycle:
1. Order Block — institutions enter the market in the OB zone, absorbing orders and building positions.
2. Strong impulse — after smart money entry, a rapid price move creates an FVG (imbalance gap).
3. Retest — price naturally returns to these zones (OB or FVG), drawn by unfilled orders and the search for equilibrium.
Such areas strongly attract price, as they represent not only historical institutional levels but also open “holes” in the order book. Retests of OB and FVG are ideal entry opportunities with high reaction probability (rebound or breakout). The indicator combines these two interconnected elements, enabling comprehensive market structure analysis in a single tool.
Order Blocks are labeled as:
Bullish OB – demand zones, often accumulation areas before an upmove.
Bearish OB – supply zones, signaling potential impulse end or correction start.
█ FEATURES
Order Block Detection (OB Detection):
- Automatic identification of demand and supply zones based on pivots.
- OB is the last candle aligned with the prior trend, just before the market reversal — precisely identified through candle sequence analysis around the pivot.
- OB zones appear with a delay equal to Pivot Length (default 10 bars).
- Break signals trigger when a candle’s body (close) fully pierces the zone, causing the zone to disappear immediately (e.g., close < low of Bullish OB → Break Down and zone deletion).
- Minimum size filtering via OB Size Multiplier.
- Option to create OB without wicks (Include Wicks in OB): when disabled, OB zones are based solely on candle bodies (open/close), ignoring wicks (high/low).
Fair Value Gap Detection (FVG Detection):
- Optional, with enable/disable capability.
- FVG are detected without delay — immediately upon gap occurrence.
- Size filtering via Candle Size Period and FVG Size Multiplier.
Customizable Styling:
- Separate colors and border styles (Solid / Dashed / Dotted) for each zone type.
- Adjustable transparency and border thickness.
- Unified color for box, border, and signal of the same type.
Breakout and Exit Signals:
- Break Up – triggered when a candle’s close breaks above a Bearish OB, causing the zone to disappear.
- Break Down – triggered when a candle’s close breaks below a Bullish OB, causing the zone to disappear.
- Exit Up / Exit Down – temporary exit from the zone without full breakout (price leaves the zone but doesn’t close beyond it). Signal type selection: Break, Exit, or Both.
- Alerts: built-in alerts for all signal types — triggered automatically on candle close confirming breakout or exit from OB.
█ HOW TO USE
Adding to chart: import the code into Pine Editor and run the script on TradingView.
Settings configuration:
- Pivot Length: controls swing detection sensitivity and OB display delay (default 10).
- Include Wicks in OB: enabled (default) – OB includes wicks; disabled – OB uses bodies only.
- Size Filter: adjust Candle Size Period and OB/FVG Size Multiplier to filter out small zones.
- Colors & Styles: set colors, styles, and transparency for each zone type.
- Signal Type: choose which signals to display (Break, Exit, or Both).
Signal interpretation:
- OB Break Up: price closes above Bearish OB → zone disappears → potential bullish continuation.
- OB Break Down: price closes below Bullish OB → zone disappears → potential bearish continuation.
- Exit Signals: price leaves the zone temporarily without breakout — often signals impending reversal or pullback.
Tips:
- Use OB signals alongside other indicators like RSI, MACD, SMI, or trend filters.
- Order Blocks from higher timeframes (e.g., 4H, 1D) carry greater significance and reaction strength.
- Remember: FVG are detected immediately, OB with delay — a complementary approach!
█ APPLICATIONS
- Smart Money Concepts (SMC): use OB zones as dynamic support and resistance levels. In an uptrend, look for buy opportunities in bullish OBs, which price often retests before further gains. Combining with RSI, MACD, or Fibonacci levels enhances zone significance, confirming institutional demand.
- Breakout Trading: trade based on OB breakout signals. A buy signal after breaking a bearish OB may indicate a strong upward impulse, especially if supported by rising MACD or RSI above 50. Similarly for sell signals after Break Down.
- Reversal Zones: Exit signals may indicate the end of a move or correction. Safest to use in alignment with higher-timeframe trend and confirmed by another indicator (e.g., RSI divergence, Fibonacci levels).
- Confluence Analysis: combine OB and FVG for deeper market structure and equilibrium insight. When an Order Block overlaps or borders an FVG, we get confluence of two institutional phenomena — OB (smart money entry) + FVG (imbalance) — making these areas particularly strong price magnets, increasing retest and reaction probability.
█ NOTES
- FVG can be fully disabled for a cleaner chart view.
- In consolidation periods, signals may appear more frequently — always confirm with additional trend filters.
- Works on all markets and timeframes (crypto, forex, indices, stocks).

HA Reversal + Doji 🔥 Heikin Ashi Reversal + Stochastic Filter (Precision Entry System)
This indicator is designed to detect high–quality reversal entries using a Heikin Ashi candle pattern (Doji + 2 no–wick confirmation) combined with a strict Stochastic filter that uses memory of extreme touches to control trade direction.
✅ Entry Logic
🔹 Bullish BUY Signal
A BUY is triggered only when:
A valid reversal pattern is detected:
Doji candle (pivot) 3 bars back
Followed by 2 bullish candles with no lower wicks
Stochastic touched Oversold (≤ 20) at least once before the signal
Pattern + Stoch alignment = BUY
🔹 Bearish SELL Signal
A SELL is triggered only when:
Valid bearish reversal pattern:
Doji candle (pivot) 3 bars back
Followed by 2 bearish candles with no upper wicks
Stochastic touched Overbought (≥ 80) before the signal
Pattern + Stoch alignment = SELL
🧠 Stochastic “Memory” Filter
This is not a basic OB/OS filter — it uses event memory:
If Stochastic touches Oversold, the system becomes ready for BUY
If it touches Overbought, it becomes ready for SELL
Both directions can be armed at once
Once a BUY or SELL actually triggers, memory resets to neutral
Prevents “signal spam” during chop and keeps direction meaningful
🎯 Why This Works
✔ Filters out random countertrend noise
✔ Only trades after momentum exhaustion
✔ Uses strict Heikin Ashi reversal structure
✔ Works great across crypto, forex, indices, metals
✔ Designed for precision entries and swing continuation traps
⚙️ Customizable Options
Doji detection mode (body % / ticks / hybrid)
Wick tolerance
Heikin Ashi source (chart or calculated)
Stochastic source (raw or smoothed)
Option to avoid duplicate same-direction signals
Visual aids: pattern markers, blocked signals, doji debugging
📌 Best Use Cases
Reversal scalping on 5m/15m
Swing entries on 1H/4H
Trend exhaustion confirmation
Smart Money Concepts entry refinement
Entry timing after liquidity sweeps
🚨 Important
This is not a repainting system. Signals are generated at bar close only. Always combine with proper risk management and market context.
Let me know if you want:
✅ A shorter description
✅ An SEO optimized TradingView title
✅ A strategy version with backtesting
✅ Alerts version for automation

Triple SuperTrend + RSI + Fib BBTriple SuperTrend + RSI + Fibonacci Bollinger Bands Strategy
📊 Overview
This advanced trading strategy combines the power of three SuperTrend indicators with RSI confirmation and Fibonacci Bollinger Bands to generate high-probability trade signals. The strategy is designed to capture strong trending moves while filtering out false signals through multi-indicator confluence.
🔧 Core Components
Three SuperTrend Indicators
The strategy uses three SuperTrend indicators with progressively longer periods and multipliers:
SuperTrend 1: 10-period ATR, 1.0 multiplier (fastest, most sensitive)
SuperTrend 2: 11-period ATR, 2.0 multiplier (medium sensitivity)
SuperTrend 3: 12-period ATR, 3.0 multiplier (slowest, most stable)
This layered approach ensures that all three timeframe perspectives align before generating a signal, significantly reducing false entries.
RSI Confirmation (7-period)
The Relative Strength Index acts as a momentum filter:
Long signals require RSI > 50 (bullish momentum)
Short signals require RSI < 50 (bearish momentum)
This prevents entries during weak or divergent price action.
Fibonacci Bollinger Bands (200, 2.618)
Uses a 200-period Simple Moving Average with 2.618 standard deviation bands (Fibonacci ratio). These bands serve dual purposes:
Visual representation of price extremes
Automatic exit trigger when price reaches overextended levels
📈 Entry Logic
LONG Entry (BUY Signal)
A LONG position is opened when ALL of the following conditions are met simultaneously:
All three SuperTrend indicators turn green (bullish)
RSI(7) is above 50
This is the first bar where all conditions align (no repainting)
SHORT Entry (SELL Signal)
A SHORT position is opened when ALL of the following conditions are met simultaneously:
All three SuperTrend indicators turn red (bearish)
RSI(7) is below 50
This is the first bar where all conditions align (no repainting)
🚪 Exit Logic
Positions are automatically closed when ANY of these conditions occur:
SuperTrend Color Change: Any one of the three SuperTrend indicators changes direction
Fibonacci BB Touch: Price reaches or exceeds the upper or lower Fibonacci Bollinger Band (2.618 standard deviations)
This dual-exit approach protects profits by:
Exiting quickly when trend momentum shifts (SuperTrend change)
Taking profits at statistical price extremes (Fib BB touch)
🎨 Visual Features
Signal Arrows
Green Up Arrow (BUY): Appears below the bar when long entry conditions are met
Red Down Arrow (SELL): Appears above the bar when short entry conditions are met
Yellow Down Arrow (EXIT): Appears above the bar when exit conditions are met
Background Coloring
Light Green Tint: All three SuperTrends are bullish (uptrend environment)
Light Red Tint: All three SuperTrends are bearish (downtrend environment)
SuperTrend Lines
Three colored lines plotted with varying opacity:
Solid line (ST1): Most responsive to price changes
Semi-transparent (ST2): Medium-term trend
Most transparent (ST3): Long-term trend structure
Dashboard
Real-time information panel showing:
Individual SuperTrend status (UP/DOWN)
Current RSI value and color-coded status
Current position (LONG/SHORT/FLAT)
Net Profit/Loss
⚙️ Customizable Parameters
SuperTrend Settings
ATR periods for each SuperTrend (default: 10, 11, 12)
Multipliers for each SuperTrend (default: 1.0, 2.0, 3.0)
RSI Settings
RSI length (default: 7)
RSI source (default: close)
Fibonacci Bollinger Bands
BB length (default: 200)
BB multiplier (default: 2.618)
Strategy Options
Enable/disable long trades
Enable/disable short trades
Initial capital
Position sizing
Commission settings
💡 Strategy Philosophy
This strategy is built on the principle of confluence trading - waiting for multiple independent indicators to align before taking a position. By requiring three SuperTrend indicators AND RSI confirmation, the strategy filters out the majority of low-probability setups.
The multi-timeframe SuperTrend approach ensures that short-term, medium-term, and longer-term trends are all in agreement, which typically occurs during strong, sustainable price moves.
The exit strategy is equally important, using both trend-following logic (SuperTrend changes) and mean-reversion logic (Fibonacci BB touches) to adapt to different market conditions.
📊 Best Use Cases
Trending Markets: Works best in markets with clear directional bias
Higher Timeframes: Designed for 15-minute to daily charts
Volatile Assets: SuperTrend indicators excel in assets with clear trends
Swing Trading: Hold times typically range from hours to days
⚠️ Important Notes
No Repainting: All signals are confirmed and will not change on historical bars
One Signal Per Setup: The strategy prevents duplicate signals on consecutive bars
Exit Protection: Always exits before potentially taking an opposite position
Visual Clarity: All three SuperTrend lines are visible simultaneously for transparency
🎯 Recommended Settings
While default parameters are optimized for general use, consider:
Crypto/Volatile Markets: May benefit from slightly higher multipliers
Forex: Default settings work well for major pairs
Stocks: Consider longer BB periods (250-300) for daily charts
Lower Timeframes: Reduce all periods proportionally for scalping
📝 Alerts
Built-in alert conditions for:
BUY signal triggered
SELL signal triggered
EXIT signal triggered
Set up notifications to never miss a trade opportunity!
Disclaimer: This strategy is for educational and informational purposes only. Past performance does not guarantee future results. Always backtest thoroughly and practice proper risk management before live trading.

Daytrade Forex Scalper TwinPulse Auction Timer IndicatorWhat this indicator is
TwinPulse Auction Timer is a multi component execution aid designed for liquid markets. It looks for two families of opportunities
Breakouts that leave a compression area after a fresh sweep
Reversals that trigger after a sweep with strong wick polarity
It does not try to predict future prices. It measures present auction conditions with transparent rules and shows you when those conditions align. You get a simple table that says LONG SHORT or WAIT, optional session shading, clean entry and exit level visuals, and alerts you can wire to your workflow.
Why it is different
Most tools show a single signal. TwinPulse combines several independent signals into an Edge Score that you can tune. The components are
• Pulse. A signed measure of wick asymmetry with candle body direction
• Compression. Current true range compared with an average range
• Sweep timer. Bars elapsed since the most recent sweep of a prior high or low
• Bias. Direction of a higher timeframe candle
• Regime. Efficiency ratio and the relation of micro to macro volatility
• Location. Distance from the daily anchored VWAP
• Session. London and New York filter by time windows
Each component is visible in the inputs and in the table so you can understand why a suggestion appears. The script uses request.security() with lookahead off in all calls so it does not peek into the future. Shapes may move while a bar is open since price is still forming. They stop moving when the bar closes.
What you will see on the chart
• L and S shapes on entry bars
• An Exit shape at the price where a stop or the runner target would have been hit
• Four horizontal lines while a trade is active
Entry
Stop
TP1 at one R
TP2 at the runner target expressed in R
• Labels anchored to each line so you can instantly read Entry SL TP1 and TP2 with current values
• Optional shading during your session windows
• Optional daily VWAP line
The table in the top right shows
Action LONG SHORT IN LONG IN SHORT or WAIT
Session ON or OFF
Bias UP DOWN or FLAT
Pulse value
Compression value
Edge L percent and Edge S percent
How it works in detail
Pulse
For each bar the script measures up wick minus down wick divided by range and multiplies that by the sign of the candle body. The result is averaged with pulse_len. Positive numbers indicate aggressive buying. Negative numbers indicate aggressive selling. You control the minimum absolute value with pulse_thr.
Compression
Compression is the ratio of current range to an average range. You can choose the range basis. HL SMA uses simple high minus low smoothed by range_len. ATR uses classic True Range smoothed by atr_len. Values below comp_thr indicate a coil.
Sweeps and the timer
A sweep occurs when price trades beyond the highest high or lowest low seen in the previous sweep_len bars. A strict sweep requires a close back inside that prior range. The timer measures how many bars have elapsed since the last sweep. Breakout setups require the timer to exceed timer_thr.
Bias on a confirmation timeframe
A higher timeframe candle is read with confirm_tf. If close is above open bias is UP. If close is below open bias is DOWN. This keeps breakouts aligned with the prevailing drift.
Regime filters
Efficiency ratio measures the straight line change over the sum of absolute bar to bar changes over er_len. It rises in trendy conditions and falls in noise. Minimum efficiency is controlled by er_min.
Micro to macro volatility ratio compares a short lookback average range with a longer lookback average range using your chosen basis. For breakouts you usually want micro volatility to be near or above macro hence mvr_min. For reversals you often want micro volatility that is not overheated relative to macro hence mvr_max_rev.
VWAP distance gate
Daily anchored VWAP is rebuilt from the open of each session. The script computes the absolute distance from VWAP in units of your average range and requires that distance to exceed vwap_dist_thr when use_vwap_gate is true. This keeps entries away from the mean.
Edge Score
Each gate contributes a weight that you control. The script sums weights of the satisfied gates and divides by the sum of all weights to produce an Edge percent for long and an Edge percent for short. You can then require a minimum Edge percent using edge_min_pct. This turns the indicator into a step by step checklist that you can tune to your taste.
Using the indicator step by step
Choose markets and timeframes
The logic is designed for liquid instruments. Major currency pairs, index futures and cash index CFDs, and the most liquid crypto pairs work well. On intraday use one to fifteen minutes for signals and fifteen to sixty minutes for confirmation. On swing use one hour to one day for signals and one day for confirmation.
Decide on entry mode
Breakouts require a compression area and a sweep timer. Reversals require a strict sweep and a strong pulse. If you are unsure leave the default which allows both.
Pick a range basis
For FX and crypto HL SMA is often stable. For indices and single name equities with gaps ATR can adapt better. If results look too reactive increase the window. If results are too slow reduce it.
Tune regime filters
If you trade trend continuation raise er_min and mvr_min. If you trade counter rotation lower them and rely on the reversal path with the strict sweep condition.
Set the VWAP gate
Enabling it helps you avoid entries at the mean. Push the threshold higher on range bound days. Reduce it in strong trend days.
Table driven decision
Watch Action and the Edge percents. If the script says WAIT you can read Pulse and Compression to see what is missing. Often the best trades appear when both Edge percents are well separated and your session switch is ON.
Use the visuals
When a suggestion triggers you will see entry stop and targets. You can mirror the levels in your own workflow or use alerts.
Consider bar close
Signals are computed in real time. For a strict process you can wait until the bar closes to reduce noise.
Inputs explained with quick guidance
Setup
Signal TF chooses where the logic is computed. Leave blank to use the chart.
Confirm TF sets the higher timeframe for bias.
Session filter restricts signals to the London and New York windows you specify.
Invert flips long and short. It is useful on inverse instruments.
Logic options
Entry mode allows Breakouts Reversals or Both.
Average range basis selects HL SMA or ATR.
ATR length is used when ATR is selected.
Pulse source can be Regular OHLC or Heikin Ashi. Heikin Ashi smooths noisy series, but the script still runs on regular bars and you should publish and use it on standard candles to respect the platform guidance.
Core numeric settings
Sweep lookback controls the size of the liquidity pool targeted by the sweep condition.
Pulse window smooths the wick polarity measure.
Average range window controls your base range when you use HL SMA.
Pulse threshold sets the minimum polarity required.
Compression threshold sets the maximum current range relative to average to consider the market coiled.
Expansion timer bars sets how much time has passed since the last sweep before you allow a breakout.
Regime filters
Efficiency ratio length and minimum value keep you out of aimless drift.
Micro and Macro range lengths feed the micro to macro ratio.
Minimum micro to macro for breakouts and maximum micro to macro for reversals steer the two entry families.
VWAP gate and distance threshold keep you away from the mean.
Levels and trade management visuals
Runner target in R sets TP2 as a multiple of initial risk.
Stop distance as average range multiple sets initial risk size for the visuals.
Move stop to entry after one R touch turns on break even logic once price has traveled one risk unit.
Trail buffer as R fraction uses the last sweep as an anchor and keeps a dynamic stop at a chosen fraction of R beyond it.
Cooldown after exit prevents immediate re entries.
Edge Score
Weights for pulse compression timer bias efficiency ratio micro to macro VWAP gate and session let you align the checklist with your style.
Minimum Edge percent to suggest applies a final filter to LONG or SHORT suggestions.
UI
Table and markers switch the compact dashboard and the shapes.
TP and SL lines and labels draw and name each level.
TP1 partial label percent is printed in the TP1 label for clarity.
Session shading helps with focus.
Daily VWAP line is optional.
Alerts
The script provides alerts for Long Short Exit and for Edge percent crossing the threshold on either side. Use them to drive notifications or to sync with webhooks and your broker integration. Alerts trigger in real time and will repaint during a bar. For conservative use trigger on bar close.
Recommended presets
Intraday trend continuation
Confirm TF fifteen minutes
Entry mode Breakouts
Range basis HL SMA
Pulse threshold near 0.10
Compression threshold near 0.60
Timer around 18
Minimum efficiency ratio near 0.20
Minimum micro to macro near 1.00
VWAP gate enabled with distance near 0.35
Edge minimum 50 or higher
Intraday mean reversion at sweeps
Entry mode Reversals
Pulse source Regular OHLC
Compression threshold can be a little higher
Maximum micro to macro near 1.60
Efficiency ratio minimum lower near 0.12
VWAP gate enabled
Edge minimum 40 to 60
Swing trend continuation
Signal TF one hour
Confirm TF one day
Range basis ATR
ATR length around 14
Average range window 20 to 30
Efficiency ratio minimum near 0.18
Micro to macro windows 12 and 60
Edge minimum 50 to 70
These are starting points only. Your instrument and timeframe will require small adjustments.
Limitations and honest warnings
No indicator is perfect. TwinPulse will mark attractive conditions that do not always lead to profitable trades. During economic releases or very thin liquidity the assumptions behind compression and sweeps may fail. In strong gap environments the HL SMA basis may lag while ATR may overreact. Heikin Ashi pulse can help in choppy markets but it will lag during sharp reversals. Session times use the exchange time of your chart. If you switch symbol or exchange verify the windows.
Edge percent is not a probability of profit. It is the fraction of satisfied gates with your chosen weights. Two traders can set different weights and see different Edge readings on the same bar. That is the design. The score is a guide that helps you act with discipline.
This indicator does not place orders or manage real risk. The lines and labels show a model entry a model stop and two model targets built from the average range at entry and from recent swing points. Use them as references and not as hard rules. Always test on historical data and demo first. Past results do not guarantee anything in the future.
Credits and originality
All code in this publication is original and written for this indicator. The concept of the efficiency ratio originates from Perry Kaufman. The use of a daily anchored volume weighted average price is a standard industry tool. The specific combination of pulse from wick polarity strict sweep timing compression and the tunable Edge Score is unique to this script at the time of publication. If you reuse parts of the open source code in your own work remember to credit the author and contribute meaningful improvements.
How to read the table at a glance
Action reflects your current state.
IN LONG or IN SHORT appears while a trade is active.
LONG or SHORT appears when conditions for entry are met and the Edge threshold is satisfied.
WAIT appears when at least one gate is missing.
Session shows ON during your chosen windows.
Bias shows the color of the confirmation candle.
Pulse is the smoothed polarity number.
Comp shows current range divided by the average range. Values below one mean compression.
Edge L percent and Edge S percent show the long and short checklists as percents.
Final thoughts
Markets move because orders accumulate at certain prices and at certain times. The indicator tries to measure two things that often matter at those turning points. One is the existence of a hidden imbalance revealed by wick polarity and by sweeps of prior extremes. The other is the presence of energy stored in a coil that can release in the direction of a drift. Neither force guarantees profit. Together they can improve your selection and your timing.
Use the defaults for a few days so you learn the personality of the signals. After that adjust one group at a time. Start with the session filter and the Edge threshold. Then tune compression and the timer. Finally adjust the regime filters. Keep notes. You will learn which weights matter for your market and timeframe. The result is a process you can apply with consistency.
Disclaimer
This script and description are for education and analysis. They are not investment advice and they do not promise future results. Use at your own risk. Test thoroughly on historical data and in simulation before considering any live use.

Session Volume Spike DetectorSession Volume Spike Detector (Buy/Sell, Dual Windows, MTF + Edge/Cooldown)
What it does
Detects statistically significant buy/sell volume spikes inside two DST-aware Mountain Time sessions and projects 1m / 5m / 10m signals onto any chart timeframe (even 1s). Spikes are confirmed at the close of their native bar and are edge-triggered with optional cooldowns to prevent duplicate alerts.
How spikes are detected
Volume ≥ SMA × multiplier
Optional jump vs recent highest volume
Optional Z-Score gate for significance
Separate Buy/Sell logic using your Direction Mode (Prev Close or Candle Body)
Multi-Timeframe (MTF) display
Shows 1m, 5m, 10m arrows on your current chart
Each HTF fires once on its bar close (no repaint after close)
Sessions (DST-aware, MT)
Morning: 05:30–08:30
Midday: 11:00–13:30
Spikes only count inside these windows.
Inputs & styling
Thresholds: SMA length, multipliers, recent lookback, Z-Score toggle/level
Toggles for which TFs to display (chart TF, 1m, 5m, 10m)
Per-TF colors + cooldowns (seconds) for Any TF, 1m, 5m, 10m
Alerts (edge + cooldown)
MTF Volume Spike (Any TF) — fires on the first qualifying spike across enabled TFs
1m / 5m / 10m Volume Spike — per-TF alerts, Buy or Sell
Recommended: set alert Trigger = Once per bar close. Cooldowns tame “triggered too often” warnings.
Great with
FVG zones, bank/insto levels, session range breaks, and trend filters. Use the MTF arrows as a participation/pressure tell to confirm or fade moves.
Notes
Works on any symbol/timeframe; best viewed on 1m or sub-minute charts.
HTF spikes appear on the bar close of 1m/5m/10m respectively.
No dynamic plot titles; Pine v6-safe.
Short summary (≤250 chars):
MTF volume-spike detector for intraday sessions (DST-aware, MT). Projects 1m/5m/10m buy/sell spikes onto any chart, with edge-triggered alerts and per-TF cooldowns to prevent duplicates. Ideal for spotting institutional participation.

Adaptive HMA SignalsAdaptive HMA Signals
This indicator pairs nicely with the Contrarian 100 MA and can be located here:
Overview
The "Adaptive HMA Signals" indicator is a sophisticated technical analysis tool designed for traders aiming to capture trend changes with precision. By leveraging Hull Moving Averages (HMAs) that adapt dynamically to market conditions (volatility or volume), this indicator generates actionable buy and sell signals based on price interactions with adaptive HMAs and slope analysis. Optimized for daily charts, it is highly customizable and suitable for trading forex, stocks, cryptocurrencies, or other assets. The indicator is ideal for swing traders and trend followers seeking to time entries and exits effectively.
How It Works
The indicator uses two adaptive HMAs—a primary HMA and a minor HMA—whose periods adjust dynamically based on user-selected market conditions (volatility via ATR or volume via RSI). It calculates the slope of the primary HMA to identify trend strength and generates exit signals when the price crosses the minor HMA under specific slope conditions. Signals are plotted as circles above or below the price, with inverted colors (white for buy, blue for sell) to enhance visibility on any chart background.
Key Components
Adaptive HMAs: Two HMAs (primary and minor) with dynamic periods that adjust based on volatility (ATR-based) or volume (RSI-based) conditions. Periods range between user-defined minimum and maximum values, adapting by a fixed percentage (3.141%).
Slope Analysis: Calculates the slope of the primary HMA over a 34-bar period to gauge trend direction and strength, normalized using market range data.
Signal Logic: Generates buy signals (white circles) when the price falls below the minor HMA with a flat or declining slope (indicating a potential trend reversal) and sell signals (blue circles) when the price rises above the minor HMA with a flat or rising slope.
Signal Visualization: Plots signals at an offset based on ATR for clarity, using semi-transparent colors to avoid chart clutter.
Mathematical Concepts
Dynamic Period Adjustment:
Primary HMA period adjusts between minLength (default: 144) and maxLength (default: 200).
Minor HMA period adjusts between minorMin (default: 55) and minorMax (default: 89).
Periods decrease by 3.141% under high volatility/volume and increase otherwise.
HMA Calculation:
Uses the Hull Moving Average formula: WMA(2 * WMA(src, length/2) - WMA(src, length), sqrt(length)).
Provides a smoother, faster-responding moving average compared to traditional MAs.
Slope Calculation:
Computes the slope of the primary HMA using a 34-bar period, normalized by the market range (highest high - lowest low over 34 bars).
Slope angle is converted to degrees using arccosine for intuitive trend strength interpretation.
Signal Conditions:
Buy: Slope ≥ 17° (flat or rising), price < minor HMA, low volatility/volume.
Sell: Slope ≤ -17° (flat or declining), price > minor HMA, low volatility/volume.
Signals are triggered only on confirmed bars to avoid repainting.
Entry and Exit Rules
Buy Signal (White Circle): Triggered when the price crosses below the minor HMA, the slope of the primary HMA is flat or rising (≥17°), and volatility/volume is low. The signal appears as a white circle above the price bar, offset by 0.72 * ATR(5).
Sell Signal (Blue Circle): Triggered when the price crosses above the minor HMA, the slope of the primary HMA is flat or declining (≤-17°), and volatility/volume is low. The signal appears as a blue circle below the price bar, offset by 0.72 * ATR(5).
Exit Rules: Exit a buy position on a sell signal and vice versa. Combine with other tools (e.g., support/resistance, RSI) for additional confirmation. Always apply proper risk management.
Recommended Usage
The "Adaptive HMA Signals" indicator is optimized for daily charts but can be adapted to other timeframes (e.g., 1H, 4H) with adjustments to period lengths. It performs best in trending or range-bound markets with clear reversal points. Traders should:
Backtest the indicator on their chosen asset and timeframe to validate signal reliability.
Combine with other technical tools (e.g., trendlines, Fibonacci retracements) for stronger trade setups.
Adjust minLength, maxLength, minorMin, and minorMax based on market volatility and timeframe.
Use the Charger input to toggle between volatility (ATR) and volume (RSI) adaptation for optimal performance in specific market conditions.
Customization Options
Source: Choose the price source (default: close).
Show Signals: Toggle visibility of buy/sell signals (default: true).
Charger: Select adaptation trigger—Volatility (ATR-based) or Volume (RSI-based) (default: Volatility).
Main HMA Periods: Set minimum (default: 144) and maximum (default: 200) periods for the primary HMA.
Minor HMA Periods: Set minimum (default: 55) and maximum (default: 89) periods for the minor HMA.
Slope Period: Fixed at 34 bars for slope calculation, adjustable via code if needed.
Why Use This Indicator?
The "Adaptive HMA Signals" indicator combines the responsiveness of HMAs with dynamic adaptation to market conditions, offering a robust tool for identifying trend reversals. Its clear visual signals, customizable periods, and adaptive logic make it versatile for various markets and trading styles. Whether you’re a beginner or an experienced trader, this indicator enhances your ability to time entries and exits with precision.
Tips for Users
Test the indicator thoroughly on your chosen market and timeframe to optimize settings (e.g., adjust period lengths for non-daily charts).
Use in conjunction with price action or other indicators (e.g., RSI, MACD) for stronger trade confirmation.
Monitor volatility/volume conditions to ensure the Charger setting aligns with market dynamics.
Ensure your chart timeframe aligns with the selected period lengths for accurate signal generation.
Apply strict risk management to protect against false signals in choppy markets.
Happy trading with the Adaptive HMA Signals indicator! Share your feedback and strategies in the TradingView community!

BB Crosses Optimized - [JTCAPITAL]BB Crosses Optimized - is a modified way to use Bollinger Bands combined with volatility filtering (ATR) and flexible smoothing methods for Trend-Following.
The indicator works by calculating in the following steps:
Source Selection & Smoothing
The script begins by letting the user select a preferred price source (default is Close, but options include Open, High, Low, HL2, etc.). This raw input is then passed through a smoothing process.
Multiple smoothing techniques can be chosen: SMA, EMA, HMA, DEMA, TEMA, RMA, and FRAMA. Each method reduces short-term noise differently, ensuring flexibility for traders who prefer faster or slower reaction speeds in trend detection.
Bollinger Band Construction
Once the smoothed source is prepared, Bollinger Bands are calculated. The middle band is a moving average of the smoothed data over the defined BB Period . The upper and lower bands are then generated by adding and subtracting the Standard Deviation × Deviation multiplier . These dynamic bands capture volatility and help define breakout zones.
ATR Volatility Measurement
Parallel to the band calculation, the Average True Range (ATR) is computed over the chosen ATR Period . This measures market volatility. The ATR can optionally act as a filter, refining buy and sell levels so signals adapt to current market conditions rather than being fixed to price alone.
Bollinger Band Signals
-If the smoothed price closes above the upper band, a potential bullish event is marked.
-If the smoothed price closes below the lower band, a potential bearish event is marked.
Trend Line Construction
When a bullish event occurs, the script anchors a trend-following line beneath price. If ATR filtering is enabled, the line is set at Low – ATR , otherwise at the simple Low. Conversely, when a bearish event occurs, the line is anchored above price at High + ATR (or just High without the filter). The line is designed to only move in the direction of the trend—if price action does not exceed the prior value, the previous level is held. This prevents unnecessary whipsaws and keeps the indicator aligned with dominant momentum.
Final Trend Detection
The slope of the trend line defines the trend itself:
-Rising line → bullish trend.
-Falling line → bearish trend.
Visual Output
The indicator plots the trend line with dynamic coloring: Blue for bullish phases, Purple for bearish phases. A subtle filled background area emphasizes the active trend zone for clearer chart interpretation.
Buy and Sell Conditions:
- Buy Signal : Triggered when smoothed price closes above the upper Bollinger Band. Trend line then anchors below price (with or without ATR offset depending on settings).
- Sell Signal : Triggered when smoothed price closes below the lower Bollinger Band. Trend line then anchors above price (with or without ATR offset).
Additional filtering is possible via:
- ATR Toggle : Switch ATR on or off to adapt the strategy to either volatile or steady markets.
- Smoothing Method : Adjust smoothing to speed up or slow down responsiveness.
- Deviation Multiplier : Tight or wide bands adjust the sensitivity of signals.
Features and Parameters:
- Source : Choose between Close, Open, High, Low, HL2, etc.
- Average Type : Options include SMA, EMA, HMA, DEMA, TEMA, RMA, FRAMA.
- ATR Period : Defines how ATR volatility is measured.
- BB Period : Lookback length for Bollinger Band construction.
- Deviation : Multiplier for the standard deviation in Bollinger Bands.
- Smoothing Period : Controls how much the source data is smoothed.
- ATR Filter On/Off : Enables or disables ATR integration in signal calculation.
Specifications:
Smoothing (MA Types)
Smoothing is essential to reduce chart noise. By offering multiple MA choices, traders can balance between lag (SMA, RMA) and responsiveness (EMA, HMA, FRAMA). This flexibility allows the indicator to adapt across asset classes and trading styles.
Bollinger Bands
Bollinger Bands measure price deviation around a moving average. They help identify volatility expansion and contraction. In this script, the bands serve as breakout triggers—price crossing outside suggests momentum strong enough to sustain a trend.
Standard Deviation
Standard Deviation is a statistical measure that quantifies the dispersion of price data around the mean. With a multiplier applied, it creates bands that contain a probabilistic portion of price action. Crossing beyond these suggests a higher likelihood of trend continuation.
ATR (Average True Range)
ATR measures the degree of volatility. Instead of simply reacting to price crossing the bands, ATR ensures the trend line placement adapts to current conditions. In volatile markets, wider buffers prevent premature signals; in calmer markets, tighter placement keeps signals responsive.
Trend Line Logic
The trend line only adjusts in the direction of the trend. If new values do not exceed the prior, the line remains unchanged. This prevents false reversals and makes the line a reliable visual confirmation of trend direction.
Signal Detection
The indicator does not repaint: signals are based on confirmed closes relative to the Bollinger Bands. This makes it more reliable for both live trading and backtesting scenarios.
Visual Enhancements
The use of dual plots and fill shading creates a clearer separation of bullish vs. bearish phases. This helps traders visually align entries and exits without second-guessing.
Enjoy!

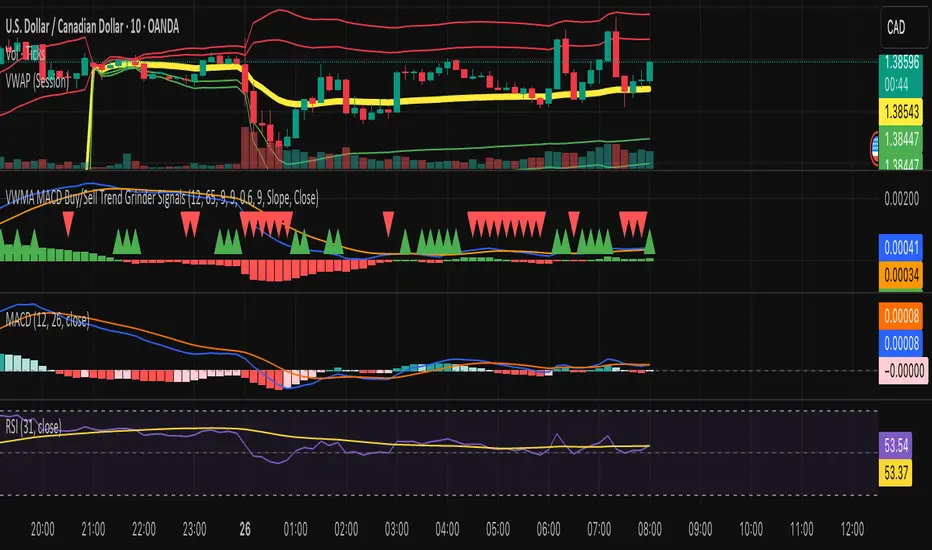
VWMA MACD Trend Grinder Buy/Sell SignalsDescription:
This indicator combines a VWMA-based MACD with volume and trend filters to reduce false buy and sell signals.
It is designed to give more reliable entry and exit points in trending markets while avoiding low-volume noise.
Features:
1. VWMA MACD:
- MACD is calculated using Volume-Weighted Moving Averages (VWMA) instead of standard EMAs.
- Histogram shows the difference between MACD and its signal line.
2. Volume Filter:
- Signals are only triggered when current volume exceeds a multiple of its moving average.
- Reduces false signals in low-volume periods.
3. Trend Filter:
- Only triggers buy signals when price is above a long-term VWMA (uptrend).
- Only triggers sell signals when price is below the long-term VWMA (downtrend).
- Helps avoid counter-trend trades.
4. Plots:
- MACD (blue), Signal (orange), Histogram (green/red)
- Trend VWMA (purple)
- Buy and Sell arrows in the indicator pane (green/red)
5. Alerts:
- Configurable alerts for buy and sell signals filtered by volume and trend.
Inputs:
- Fast Length: VWMA period for the fast MACD line (default 12)
- Slow Length: VWMA period for the slow MACD line (default 26)
- Signal Length: EMA period for the MACD signal line (default 9)
- Volume MA Length: Length for volume moving average filter (default 20)
- Volume Threshold Multiplier: Multiplier for volume filter (default 1.2)
- Trend VWMA Length: Period for long-term trend VWMA (default 50)
- Price Source: Close, HL2, HLC3, OHLC4
Usage:
- Use as a confirmation tool along with other analysis techniques.
- Buy when the green triangle appears (MACD crossover, above trend VWMA, sufficient volume).
- Sell when the red triangle appears (MACD crossunder, below trend VWMA, sufficient volume).
- Trend VWMA helps visually confirm the market trend.
Dip Hunter [BackQuant]Dip Hunter
What this tool does in plain language
Dip Hunter is a pullback detector designed to find high quality buy-the-dip opportunities inside healthy trends and to avoid random knife catches. It watches for a quick drop from a recent high, checks that the drop happened with meaningful participation and volatility, verifies short-term weakness inside a larger uptrend, then scores the setup and paints the chart so you can act with confidence. It also draws clean entry lines, provides a meter that shows dip strength at a glance, and ships with alerts that match common execution workflows.
How Dip Hunter thinks
It defines a recent swing reference, measures how far price has dipped off that high, and only looks at candidates that meet your minimum percentage drop.
It confirms the dip with real activity by requiring a volume spike and a volatility spike.
It checks structure with two EMAs. Price should be weak in the short term while the larger context remains constructive.
It optionally requires a higher-timeframe trend to be up so you focus on pullbacks in trending markets.
It bundles those checks into a score and shows you the score on the candles and on a gradient meter.
When everything lines up it paints a green triangle below the bar, shades the background, and (if you wish) draws a horizontal entry line at your chosen level.
Inputs and what they mean
Dip Hunter Settings
• Vol Lookback and Vol Spike : The script computes an average volume over the lookback window and flags a spike when current volume is a multiple of that average. A multiplier of 2.0 means today’s volume must be at least double the average. This helps filter noise and focuses on dips that other traders actually traded.
• Fast EMA and Slow EMA : Short-term and medium-term structure references. A dip is more credible if price closes below the fast EMA while the fast EMA is still below the slow EMA during the pullback. That is classic corrective behavior inside a larger trend.
• Price Smooth : Optional smoothing length for price-derived series. Use this if you trade very noisy assets or low timeframes.
• Volatility Len and Vol Spike (volatility) : The script checks both standard deviation and true range against their own averages. If either expands beyond your multiplier the market confirms the move with range.
• Dip % and Lookback Bars : The engine finds the highest high over the lookback window, then computes the percentage drawdown from that high to the current close. Only dips larger than your threshold qualify.
Trend Filter
• Enable Trend Filter : When on, Dip Hunter will only trigger if the market is in an uptrend.
• Trend EMA Period : The longer EMA that defines the session’s backbone trend.
• Minimum Trend Strength : A small positive slope requirement. In practice this means the trend EMA should be rising, and price should be above it. You can raise the value to be more selective.
Entries
• Show Entry Lines : Draws a horizontal guide from the signal bar for a fixed number of bars. Great for limit orders, scaling, or re-tests.
• Line Length (bars) : How far the entry guide extends.
• Min Gap (bars) : Suppresses new entry lines if another dip fired recently. Prevents clutter during choppy sequences.
• Entry Price : Choose the line level. “Low” anchors at the signal candle’s low. “Close” anchors at the signal close. “Dip % Level” anchors at the theoretical level defined by recent_high × (1 − dip%). This lets you work resting orders at a consistent discount.
Heat / Meter
• Color Bars by Score : Colors each candle using a red→white→green gradient. Red is overheated, green is prime dip territory, white is neutral.
• Show Meter Table : Adds a compact gradient strip with a pointer that tracks the current score.
• Meter Cells and Meter Position : Resolution and placement of the meter.
UI Settings
• Show Dip Signals : Plots green triangles under qualifying bars and tints the background very lightly.
• Show EMAs : Plots fast, slow, and the trend EMA (if the trend filter is enabled).
• Bullish, Bearish, Neutral colors : Theme controls for shapes, fills, and bar painting.
Core calculations explained simply
Recent high and dip percent
The script finds the highest high over Lookback Bars , calls it “recent high,” then calculates:
dip% = (recent_high − close) ÷ recent_high × 100.
If dip% is larger than Dip % , condition one passes.
Volume confirmation
It computes a simple moving average of volume over Vol Lookback . If current volume ÷ average volume > Vol Spike , we have a participation spike. It also checks 5-bar ROC of volume. If ROC > 50 the spike is forceful. This gets an extra score point.
Volatility confirmation
Two independent checks:
• Standard deviation of closes vs its own average.
• True range vs ATR.
If either expands beyond Vol Spike (volatility) the move has range. This prevents false triggers from quiet drifts.
Short-term structure
Price should close below the Fast EMA and the fast EMA should be below the Slow EMA at the moment of the dip. That is the anatomy of a pullback rather than a full breakdown.
Macro trend context (optional)
When Enable Trend Filter is on, the Trend EMA must be rising and price must be above it. The logic prefers “micro weakness inside macro strength” which is the highest probability pattern for buying dips.
Signal formation
A valid dip requires:
• dip% > threshold
• volume spike true
• volatility spike true
• close below fast EMA
• fast EMA below slow EMA
If the trend filter is enabled, a rising trend EMA with price above it is also required. When all true, the triangle prints, the background tints, and optional entry lines are drawn.
Scoring and visuals
Binary checks into a continuous score
Each component contributes to a score between 0 and 1. The script then rescales to a centered range (−50 to +50).
• Low or negative scores imply “overheated” conditions and are shaded toward red.
• High positive scores imply “ripe for a dip buy” conditions and are shaded toward green.
• The gradient meter repeats the same logic, with a pointer so you can read the state quickly.
Bar coloring
If you enable “Color Bars by Score,” each candle inherits the gradient. This makes sequences obvious. Red clusters warn you not to buy. White means neutral. Increasing green suggests the pullback is maturing.
EMAs and the trend EMA
• Fast EMA turns down relative to the slow EMA inside the pullback.
• Trend EMA stays rising and above price once the dip exhausts, which is your cue to focus on long setups rather than bottom fishing in downtrends.
Entry lines
When a fresh signal fires and no other signal happened within Min Gap (bars) , the indicator draws a horizontal level for Line Length bars. Use these lines for limit entries at the low, at the close, or at the defined dip-percent level. This keeps your plan consistent across instruments.
Alerts and what they mean
• Market Overheated : Score is deeply negative. Do not chase. Wait for green.
• Close To A Dip : Score has reached a healthy level but the full signal did not trigger yet. Prepare orders.
• Dip Confirmed : First bar of a fresh validated dip. This is the most direct entry alert.
• Dip Active : The dip condition remains valid. You can scale in on re-tests.
• Dip Fading : Score crosses below 0.5 from above. Momentum of the setup is fading. Tighten stops or take partials.
• Trend Blocked Signal : All dip conditions passed but the trend filter is offside. Either reduce risk or skip, depending on your plan.
How to trade with Dip Hunter
Classic pullback in uptrend
Turn on the trend filter.
Watch for a Dip Confirmed alert with green triangle.
Use the entry line at “Dip % Level” to stage a limit order. This keeps your entries consistent across assets and timeframes.
Initial stop under the signal bar’s low or under the next lower EMA band.
First target at prior swing high, second target at a multiple of risk.
If you use partials, trail the remainder under the fast EMA once price reclaims it.
Aggressive intraday scalps
Lower Dip % and Lookback Bars so you catch shallow flags.
Keep Vol Spike meaningful so you only trade when participation appears.
Take quick partials when price reclaims the fast EMA, then exit on Dip Fading if momentum stalls.
Counter-trend probes
Disable the trend filter if you intentionally hunt reflex bounces in downtrends.
Require strong volume and volatility confirmation.
Use smaller size and faster targets. The meter should move quickly from red toward white and then green. If it does not, step aside.
Risk management templates
Stops
• Conservative: below the entry line minus a small buffer or below the signal bar’s low.
• Structural: below the slow EMA if you aim for swing continuation.
• Time stop: if price does not reclaim the fast EMA within N bars, exit.
Position sizing
Use the distance between the entry line and your structural stop to size consistently. The script’s entry lines make this distance obvious.
Scaling
• Scale at the entry line first touch.
• Add only if the meter stays green and price reclaims the fast EMA.
• Stop adding on a Dip Fading alert.
Tuning guide by market and timeframe
Equities daily
• Dip %: 1.5 to 3.0
• Lookback Bars: 5 to 10
• Vol Spike: 1.5 to 2.5
• Volatility Len: 14 to 20
• Trend EMA: 100 or 200
• Keep trend filter on for a cleaner list.
Futures and FX intraday
• Dip %: 0.4 to 1.2
• Lookback Bars: 3 to 7
• Vol Spike: 1.8 to 3.0
• Volatility Len: 10 to 14
• Use Min Gap to avoid clusters during news.
Crypto
• Dip %: 3.0 to 6.0 for majors on higher timeframes, lower on 15m to 1h
• Lookback Bars: 5 to 12
• Vol Spike: 1.8 to 3.0
• ATR and stdev checks help in erratic sessions.
Reading the chart at a glance
• Green triangle below the bar: a validated dip.
• Light green background: the current bar meets the full condition.
• Bar gradient: red is overheated, white is neutral, green is dip-friendly.
• EMAs: fast below slow during the pullback, then reclaim fast EMA on the bounce for quality continuation.
• Trend EMA: a rising spine when the filter is on.
• Entry line: a fixed level to anchor orders and risk.
• Meter pointer: right side toward “Dip” means conditions are maturing.
Why this combination reduces false positives
Any single criterion will trigger too often. Dip Hunter demands a dip off a recent high plus a volume surge plus a volatility expansion plus corrective EMA structure. Optional trend alignment pushes odds further in your favor. The score and meter visualize how many of these boxes you are actually ticking, which is more reliable than a binary dot.
Limitations and practical tips
• Thin or illiquid symbols can spoof volume spikes. Use larger Vol Lookback or raise Vol Spike .
• Sideways markets will show frequent small dips. Increase Dip % or keep the trend filter on.
• News candles can blow through entry lines. Widen stops or skip around known events.
• If you see many back-to-back triangles, raise Min Gap to keep only the best setups.
Quick setup recipes
• Clean swing trader: Trend filter on, Dip % 2.0 to 3.0, Vol Spike 2.0, Volatility Len 14, Fast 20 EMA, Slow 50 EMA, Trend 100 EMA.
• Fast intraday scalper: Trend filter off, Dip % 0.7 to 1.0, Vol Spike 2.5, Volatility Len 10, Fast 9 EMA, Slow 21 EMA, Min Gap 10 bars.
• Crypto swing: Trend filter on, Dip % 4.0, Vol Spike 2.0, Volatility Len 14, Fast 20 EMA, Slow 50 EMA, Trend 200 EMA.
Summary
Dip Hunter is a focused pullback engine. It quantifies a real dip off a recent high, validates it with volume and volatility expansion, enforces corrective structure with EMAs, and optionally restricts signals to an uptrend. The score, bar gradient, and meter make reading conditions instant. Entry lines and alerts turn that read into an executable plan. Tune the thresholds to your market and timeframe, then let the tool keep you patient in red, selective in white, and decisive in green.

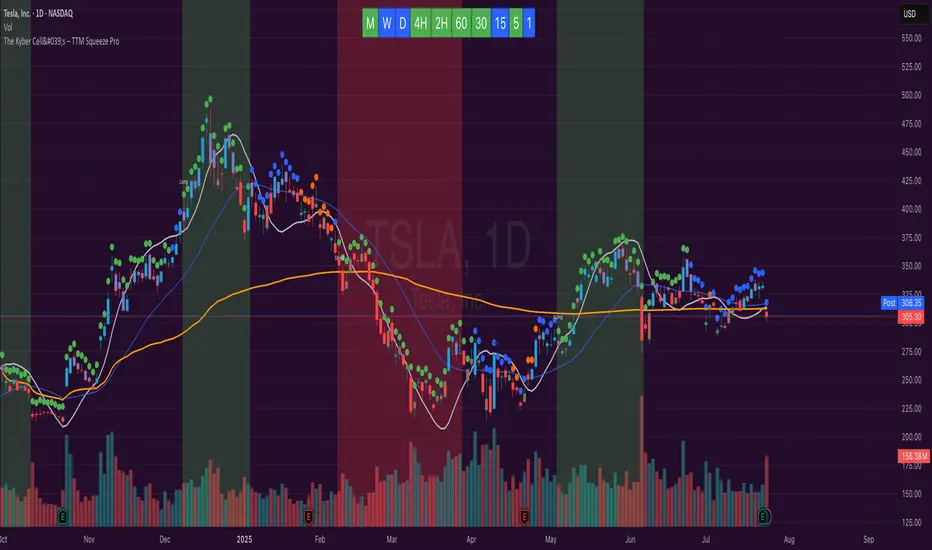
The Kyber Cell's – TTM Squeeze ProThe Kyber Cell’s TTM Squeeze Pro
TTM Squeeze + ALMA + VWAP for Precision Trade Timing
⸻
1. Introduction
Kyber Cell’s Squeeze Pro is a comprehensive, all-in-one overlay indicator built on top of John Carter’s famous TTM Squeeze concept. It integrates advanced momentum and trend analysis using Arnaud Legoux Moving Averages (ALMA), a scroll-aware VWAP with optional deviation bands, and a clean, user-friendly visual system. The goal is simple: give traders a clear and configurable chart that identifies price compression, detects release moments, confirms direction, and helps manage risk and reward visually and effectively.
This tool is intended for traders of all styles — scalpers, swing traders, or intraday strategists — looking for cleaner signals, better visual cues, and more confidence in entry/exit timing.
⸻
2. Core Concepts
At its heart, the Squeeze Pro builds an in-chart visualization of the TTM Squeeze, a strategy that identifies when price volatility compresses inside a Bollinger Band that is narrower than a Keltner Channel. These moments often precede explosive breakouts. This version categorizes squeezes into three levels of compression:
• Blue Dot – Low Compression
• Orange Dot – Medium Compression
• Red Dot – High Compression
When the squeeze “fires” (i.e., the Bollinger Bands expand beyond all Keltner thresholds), the indicator flips to a Green Dot, signaling potential entry if confirmed by trend direction.
The indicator also includes a momentum model using linear regression on smoothed price deviation to determine directional bias. Momentum is further reinforced by a customizable trend engine, allowing you to switch between EMA-21 or HMA 34/144 logic.
An ALMA ribbon is plotted across the chart to represent smoothed trend strength with minimal lag, and a scroll-aware VWAP (Volume-Weighted Average Price) line, optionally with ±σ bands, helps confirm mean-reversion or momentum continuation setups.
⸻
3. Visual Components
Squeeze Pro replaces the traditional histogram with bar coloring logic based on your selected overlay mode:
• Momentum Mode colors bars based on whether momentum is rising or falling and in which direction (aqua/blue for bullish, red/yellow for bearish).
• Trend Mode colors bars using EMA or HMA logic to identify whether price is in a bullish, bearish, or neutral trend state.
A colored backdrop is triggered when a squeeze fires and momentum direction is confirmed. It remains green for bullish runs and red for bearish runs. The background disappears when the trend exhausts or reverses.
Each squeeze level (low, medium, high) is plotted as tiny dots above or below candles, with configurable colors. On the exact bar where the squeeze fires, the indicator optionally plots entry markers — either arrows or triangles — which can be placed with adjustable padding using ATR. These provide an at-a-glance signal of possible long or short entries.
EXPERIMENTAL : For risk and reward management, protective stop lines and limit targets can be toggled on. Stops are calculated using either recent swing highs/lows or a fixed ATR multiple, depending on user preference. Limit targets are calculated from entry price using ATR-based projections.
All colors are customizable.
⸻
4. Multi-Timeframe Squeeze Panel
An optional MTF Squeeze Panel appears in the top-right corner of the chart, displaying the squeeze status across multiple timeframes — from 1-minute to Monthly. Each timeframe is color-coded:
• Red for High Compression
• Orange for Medium Compression
• Blue for Low Compression
• Yellow for Open/No Compression
This provides rapid context for whether multiple timeframes are simultaneously compressing (a common precursor to explosive moves), helping traders align higher- and lower-timeframe signals. Colors are customizable.
The MTF panel dynamically adjusts to chart space and only renders the selected intervals for clarity and performance.
⸻
5. Inputs and Configuration Options
Squeeze Pro offers a rich configuration suite:
• Squeeze Settings: Control the Bollinger Band standard deviation, and three separate Keltner Channel multipliers (for low, medium, and high compression zones).
• ALMA Controls: Adjust the smoothing length, offset, and σ factor to control ribbon sensitivity.
• VWAP Options: Toggle VWAP on/off and optionally show ±σ bands for mean reversion signals.
• Entry Markers: Customize marker shape (arrow or triangle), size (tiny to huge), color, and padding using ATR multipliers.
• Stops and Targets:
• Choose between Swing High/Low or ATR-based stop logic.
• Define separate ATR lengths and multipliers for stops and targets.
• Independently toggle their visibility and color.
• Bar Coloring Mode: Select either Momentum or Trend logic for bar overlays.
• Trend Engine: Choose between EMA-21 or HMA 34/144 for identifying trend direction.
• Squeeze Dot Colors: Customize the colors for each compression level and release state.
• MTF Panel: Toggle visibility per timeframe — from 1m to Monthly.
This high degree of customization ensures that the indicator can adapt to nearly any trading style or preference.
⸻
6. Trade Workflow Suggestions
To get the most out of this tool, traders can follow a consistent workflow:
1. Watch Dot Progression: Blue → Orange → Red indicates increasing compression and likelihood of breakout.
2. Enter on Green Dot: When the squeeze fires (green dot), confirm entry direction with bar color and backdrop.
3. Use Confirmation Tools:
• ALMA should slope in the trade direction.
• VWAP should support the price move or confirm expansion away from mean.
4. Manage Risk and Reward (experimental):
• Respect stop-loss placements (Swing/ATR).
• Use ATR-based limit targets if enabled.
5. Exit:
• Consider exiting when momentum crosses zero.
• Or exit when the background color disappears, signaling potential trend exhaustion.
⸻
7. Alerts
Includes built-in alert conditions to notify you when a squeeze fires in either direction:
• “Squeeze Long”: Triggers when a green dot appears and momentum is bullish.
• “Squeeze Short”: Triggers when a green dot appears and momentum is bearish.
You can use these alerts for automation or to stay notified of new setups even when away from the screen.
⸻
8. Disclaimer
This indicator is designed for educational purposes only and should not be interpreted as financial advice. Trading is inherently risky, and any decisions based on this tool should be made with full awareness of personal risk tolerance and capital exposure.
Buysell Martingale Signal - CustomBuysell Martingale Signal - Custom Indicator
Introduction:
This indicator provides a dynamic buy and sell signal system incorporating an adaptive Martingale logic. Built upon the signalLib_yashgode9/2 library, it is designed for use across various markets and timeframes.
Key Features:
Primary Buy & Sell Signals: Identifies initial buy and sell opportunities based on directional changes derived from the signalLib.
Martingale Signals:
For Short (Sell) Positions: A Martingale Sell signal is triggered when the price moves against the existing short position by a specified stepPercent from the last entry price, indicating a potential opportunity to average down or increase position size.
For Long (Buy) Positions: Similarly, a Martingale Buy signal is triggered when the price moves against the existing long position by a stepPercent from the last entry price.
On-Chart Labels: Displays clear, customizable labels on the chart for primary Buy, Sell, Martingale Buy, and Martingale Sell signals.
Customizable Colors: Allows users to set distinct colors for primary signals and Martingale signals for better visual distinction.
Adjustable Sensitivity: Features configurable parameters (DEPTH_ENGINE, DEVIATION_ENGINE, BACKSTEP_ENGINE) to fine-tune the sensitivity of the underlying signal generation.
Webhook Support (Static Message Alerts): This indicator provides alerts with static messages for both primary and Martingale buy/sell signals. These alerts can be leveraged for automation by external systems (such as trading bots or exchange-provided Webhook Signal Trading services).
Important Note: When using these alerts for automation, an external system is required to handle the complex Martingale logic and position management (e.g., tracking steps, PnL calculation, hedging, dynamic quantity sizing), as this indicator solely focuses on signal generation and sending predefined messages.
How to Use:
Add the indicator to your desired chart.
Adjust the input parameters in the indicator's settings to match your specific trading symbol and timeframe.
For automation, you can set up TradingView alerts for the Buy Signal (Main/Martingale) and Sell Signal (Main/Martingale) conditions, pointing them to your preferred Webhook URL.
Configurable Parameters:
DEPTH_ENGINE: (e.g., 30) Controls the depth of analysis for the signal algorithm.
DEVIATION_ENGINE: (e.g., 5) Defines the allowable deviation for signal generation.
BACKSTEP_ENGINE: (e.g., 5) Specifies the number of historical bars to look back.
Martingale Step Percent: (e.g., 0.5) The percentage price movement against the current position that triggers a Martingale signal.
Labels Transparency: Adjusts the transparency of the on-chart signal labels.
Buy-Color / Sell-Color: Sets the color for primary Buy and Sell signal labels.
Martingale Buy-Color / Martingale Sell-Color: Sets the color for Martingale Buy and Sell signal labels.
Label size: Controls the visual size of the labels.
Label Offset: Adjusts the vertical offset of the labels from the candlesticks.
Risk Warning:
Financial trading inherently carries significant risk. Martingale strategies are particularly high-risk and can lead to substantial losses or even complete liquidation of capital if the market moves strongly and persistently against your position. Always backtest thoroughly and practice with a demo account, fully understanding the associated risks, before engaging with real capital.
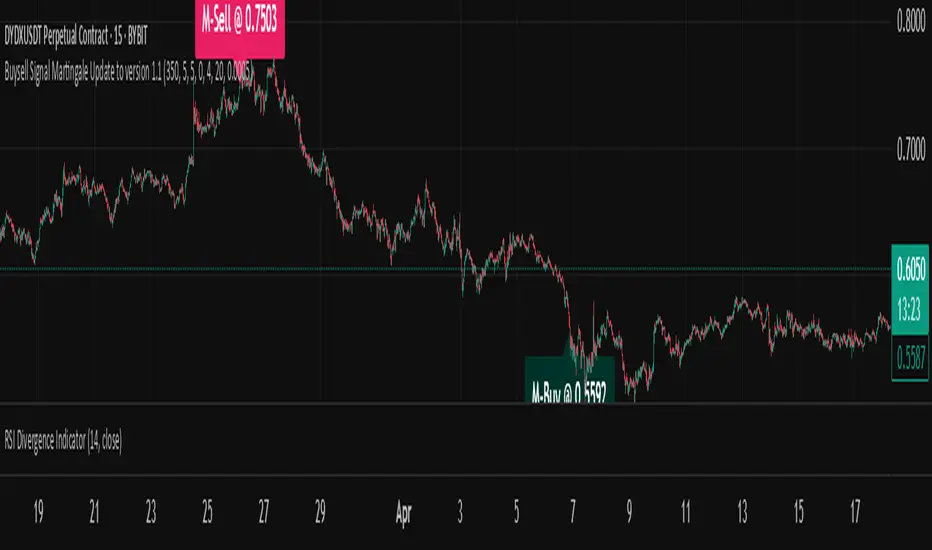
System 0530 - Stoch RSI Strategy with ATR filterStrategy Description: System 0530 - Multi-Timeframe Stochastic RSI with ATR Filter
Overview:
This strategy, "System 0530," is designed to identify trading opportunities by leveraging the Stochastic RSI indicator across two different timeframes: a shorter timeframe for initial signal triggers (assumed to be the chart's current timeframe, e.g., 5-minute) and a longer timeframe (15-minute) for signal confirmation. It incorporates an ATR (Average True Range) filter to help ensure trades are taken during periods of adequate market volatility and includes a cooldown mechanism to prevent rapid, successive signals in the same direction. Trade exits are primarily handled by reversing signals.
How It Works:
1. Signal Initiation (e.g., 5-Minute Timeframe):
Long Signal Wait: A potential long entry is considered when the 5-minute Stochastic RSI %K line crosses above its %D line, AND the %K value at the time of the cross is at or below a user-defined oversold level (default: 30).
Short Signal Wait: A potential short entry is considered when the 5-minute Stochastic RSI %K line crosses below its %D line, AND the %K value at the time of the cross is at or above a user-defined overbought level (default: 70). When these conditions are met, the strategy enters a "waiting state" for confirmation from the 15-minute timeframe.
2. Signal Confirmation (15-Minute Timeframe):
Once in a waiting state, the strategy looks for confirmation on the 15-minute Stochastic RSI within a user-defined number of 5-minute bars (wait_window_5min_bars, default: 5 bars).
Long Confirmation:
The 15-minute Stochastic RSI %K must be greater than or equal to its %D line.
The 15-minute Stochastic RSI %K value must be below a user-defined threshold (stoch_15min_long_entry_level, default: 40).
Short Confirmation:
The 15-minute Stochastic RSI %K must be less than or equal to its %D line.
The 15-minute Stochastic RSI %K value must be above a user-defined threshold (stoch_15min_short_entry_level, default: 60).
3. Filters:
ATR Volatility Filter: If enabled, trades are only confirmed if the current ATR value (converted to ticks) is above a user-defined minimum threshold (min_atr_value_ticks). This helps to avoid taking signals during periods of very low market volatility. If the ATR condition is not met, the strategy continues to wait for the condition to be met within the confirmation window, provided other conditions still hold.
Signal Cooldown Filter: If enabled, after a signal is generated, the strategy will wait for a minimum number of bars (min_bars_between_signals) before allowing another signal in the same direction. This aims to reduce overtrading.
4. Entry and Exit Logic:
Entry: A strategy.entry() order is placed when all trigger, confirmation, and filter conditions are met.
Exit: This strategy primarily uses reversing signals for exits. For example, if a long position is open, a confirmed short signal will close the long position and open a new short position. There are no explicit take profit or stop loss orders programmed into this version of the script.
Key User-Adjustable Parameters:
Stochastic RSI Parameters: RSI Length, Stochastic RSI Length, %K Smoothing, %D Smoothing.
Signal Trigger & Confirmation:
5-minute %K trigger levels for long and short.
15-minute %K confirmation thresholds for long and short.
Wait window (in 5-minute bars) for 15-minute confirmation.
Filters:
Enable/disable and configure the Signal Cooldown filter (minimum bars between signals).
Enable/disable and configure the ATR Volatility filter (ATR period, minimum ATR value in ticks).
Strategy Parameters:
Leverage Multiplier (Note: This primarily affects theoretical position sizing for backtesting calculations in TradingView and does not simulate actual leveraged trading risks).
Recommendations for Users:
Thorough Backtesting: Test this strategy extensively on historical data for the instruments and timeframes you intend to trade.
Parameter Optimization: Experiment with different parameter settings to find what works best for your trading style and chosen markets. The default values are starting points and may not be optimal for all conditions.
Understand the Logic: Ensure you understand how each component (Stochastic RSI on different timeframes, ATR filter, cooldown) interacts to generate signals.
Risk Management: Since this version does not include explicit stop-loss orders, ensure you have a clear risk management plan in place if trading this strategy live. You might consider manually adding stop-loss orders through your broker or using TradingView's separate strategy order settings for stop-loss if applicable.
Disclaimer:
This strategy description is for informational purposes only and does not constitute financial advice. Past performance is not indicative of future results. Trading involves significant risk of loss. Always do your own research and understand the risks before trading.

Opening Range Retest█ OVERVIEW
This indicator shows the opening range as a box. It also draws markers and triggers alerts when the opening range is retested. The opening range time is configurable, as is the period of time that must elapse before each return to the opening range is considered a retest.
█ FEATURES
Opening range time configurable in bars or minutes
Configurable "resting" period between the end of the opening range or since the last retest before a new retest is considered valid
Configurable tolerance so that a retest can trigger sooner
Active time range can be used to filter alerts and markers to a specific time window
Visual box showing the opening range, which can be optionally limited to the above-mentioned active time window
Well-documented, high-quality, open-source code for those interested
█ CONCEPTS
This indicator can be used for an opening range retest trading strategy, where long or short positions are taken on the retest of the opening range.
The opening range can be user-configured, so it is suitable for use with any opening range time period (e.g., 1-min, 5-min, 15-min, etc.).
The markers and alerts are equivalent, in the sense that whenever a marker appears, an alert will also trigger (assuming the user has set an alert up).
The alert active time range is simply used as a filter for markers and alerts, meaning that these will not draw or trigger outside of the specified time range.
█ LIMITATIONS
The indicator is intended for equities that have a highly active regular market open. For other security types, it will draw the opening range box from whenever TradingView specifies the market open time.
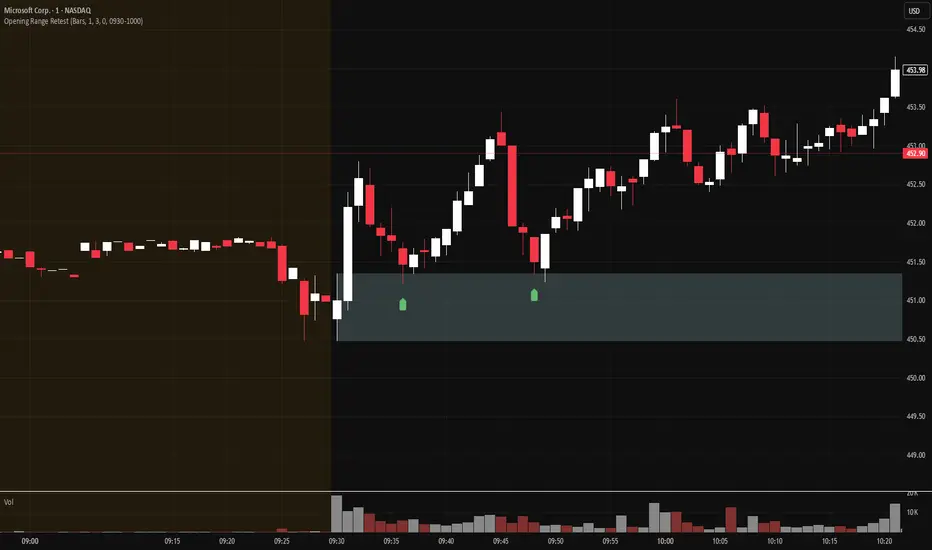
Smart Trend Lines [The_lurker]
Smart Trend Lines
A multi-level trend classifier that detects bullish and bearish conditions using a methodology based on drawing trend lines—main, intermediate, and short-term—by identifying peaks and troughs. The tool highlights trend strength by applying filters such as the Average Directional Index (ADX) (A), Relative Strength Index (RSI) (R), and Volume (V), making it easier to interpret trend strength. The filter markers (V, A, R) in the Smart Trend Lines indicator are powerful tools for assessing the reliability of breakouts. Breakouts containing are the most reliable, as they indicate strong volume support, trend strength, and favorable momentum. Breakouts with partial filters (such as or ) require additional confirmation, while breakouts without filters ( ) should be avoided unless supported by other strong signals. By understanding the meaning of each filter and the market context.
Core Functionality
1. Trend Line Types
The indicator generates three distinct trend line categories, each serving a specific analytical purpose:
Main Trend Lines: These are long-term trend lines designed to capture significant market trends. They are calculated based on pivot points over a user-defined period (default: 50 bars). Main trend lines are ideal for identifying macro-level support and resistance zones.
Mid Trend Lines: These are medium-term trend lines (default: 21 bars) that focus on intermediate price movements. They provide a balance between short-term fluctuations and long-term trends, suitable for swing trading strategies.
Short Trend Lines: These are short-term trend lines (default: 9 bars) that track rapid price changes. They are particularly useful for scalping or day trading, highlighting immediate support and resistance levels.
Each trend line type can be independently enabled or disabled, allowing traders to tailor the indicator to their preferred timeframes.
2. Breakout Detection
The indicator employs a robust breakout detection system that identifies when the price crosses a trend line, signaling a potential trend reversal or continuation. Breakouts are validated using the following filters:
ADX Filter: The Average Directional Index (ADX) measures trend strength. A user-defined threshold (default: 20) ensures that breakouts occur during strong trends, reducing false signals in range-bound markets.
RSI Filter: The Relative Strength Index (RSI) identifies overbought or oversold conditions. Breakouts are filtered based on RSI thresholds (default: 65 for overbought, 35 for oversold) to avoid signals in extreme market conditions.
Volume Filter: Breakouts are confirmed only when trading volume exceeds a moving average (default: 20 bars) and aligns with the breakout direction (e.g., higher volume on bullish breakouts when the candle closes higher).
Breakout events are marked with labels on the chart, indicating the type of trend line broken (Main, Mid, or Short) and the filters satisfied (Volume, ADX, RSI). Alerts are triggered for each breakout, providing real-time notifications.
3. Customization Options
The indicator offers extensive customization through input settings, organized into logical groups for ease of use:
Main Trend Line Settings
Length: Defines the number of bars used to calculate pivot points (default: 50).
Bullish Color: Color for upward-sloping (bullish) main trend lines (default: green).
Bearish Color: Color for downward-sloping (bearish) main trend lines (default: red).
Style: Line style options include solid, dashed, or dotted (default: solid).
Mid Trend Line Settings
Length: Number of bars for mid-term pivot points (default: 21).
Show/Hide: Toggle visibility of mid trend lines (default: enabled).
Bullish Color: Color for bullish mid trend lines (default: lime).
Bearish Color: Color for bearish mid trend lines (default: maroon).
Style: Line style (default: dashed).
Short Trend Line Settings
Length: Number of bars for short-term pivot points (default: 9).
Show/Hide: Toggle visibility of short trend lines (default: enabled).
Bullish Color: Color for bullish short trend lines (default: teal).
Bearish Color: Color for bearish short trend lines (default: purple).
Style: Line style (default: dotted).
General Display Settings
Break Check Price: Selects the price type for breakout detection (Close, High, or Low; default: Close).
Show Previous Trendlines: Option to display historical main trend lines (default: disabled).
Label Size: Size of breakout labels (Tiny, Small, Normal, Large, Huge; default: Small).
Filter Settings
ADX Threshold: Minimum ADX value for trend strength confirmation (default: 25).
Volume MA Period: Period for the volume moving average (default: 20).
RSI Filter: Enable/disable RSI filtering (default: enabled).
RSI Upper Threshold: Upper RSI limit for overbought conditions (default: 65).
RSI Lower Threshold: Lower RSI limit for oversold conditions (default: 35).
4. Technical Calculations
The indicator relies on several technical calculations to ensure accuracy:
Pivot Points: Pivot highs and lows are detected using the ta.pivothigh and ta.pivotlow functions, with separate lengths for Main, Mid, and Short trend lines.
Slope Calculation: The slope of each trend line is calculated as the change in price divided by the change in bar index between two pivot points.
ADX Calculation: ADX is computed using a 14-period Directional Movement Index (DMI), with smoothing over 14 bars.
RSI Calculation: RSI is calculated over a 14-period lookback using the ta.rsi function.
Volume Moving Average: A simple moving average (SMA) of volume is used to determine if current volume exceeds the average.
5. Strict Mode Validation
To ensure the reliability of trend lines, the indicator employs a strict mode check:
For bearish trend lines, all prices between pivot points must remain below the projected trend line.
For bullish trend lines, all prices must remain above the projected trend line.
Post-pivot break checks ensure that no breakouts occur between pivot points, enhancing the validity of the trend line.
6. Trend Line Extension
Trend lines are dynamically extended forward until a breakout occurs. The extension logic:
Projects the trend line using the calculated slope.
Continuously validates the extension using strict mode checks.
Stops extension upon a breakout, fixing the trend line at the breakout point.
7. Alerts and Labels
Labels: Breakout labels are placed above (for bearish breakouts) or below (for bullish breakouts) the price bar. Labels include:
A prefix indicating the trend line type (B for Main, M for Mid, S for Short).
A suffix showing satisfied filters (e.g., for Volume, ADX, and RSI).
Alerts: Each breakout triggers a one-time alert per bar close, with a descriptive message indicating the trend line type and filters met.
Detailed Code Breakdown
1. Initialization and Inputs
The script begins by defining the indicator with indicator('Smart Trend Lines ', overlay = true), ensuring it overlays on the price chart. Input settings are grouped into categories (Main, Mid, Short, General Display, Filters) for user convenience. Each input includes a tooltip in both English and Arabic, enhancing accessibility.
2. Technical Indicator Calculations
Volume MA: Calculated using ta.sma(volume, volPeriod) to compare current volume against the average.
ADX: Computed using custom dirmov and adx functions, which calculate the Directional Movement Index and smooth it over 14 periods.
RSI: Calculated with ta.rsi(close, rsiPeriod) over 14 periods.
Price Selection: The priceToCheck function selects the price type (Close, High, or Low) for breakout detection.
3. Pivot Detection
Pivot points are detected using ta.pivothigh and ta.pivotlow for each trend line type. The lookback period is set to the respective trend line length (e.g., 50 for Main, 21 for Mid, 9 for Short).
4. Trend Line Logic
For each trend line type (Main, Mid, Short):
Bearish Trend Lines: Identified when two consecutive pivot highs form a downward slope. The script validates the trend line using strict mode and post-pivot break checks.
Bullish Trend Lines: Identified when two consecutive pivot lows form an upward slope, with similar validation.
Trend lines are drawn using line.new, with separate lines for the initial segment (between pivots) and the extended segment (from the second pivot forward).
5. Breakout Detection and Labeling
Breakouts are detected when the selected price crosses the trend line level. The script checks:
Volume conditions (above average and aligned with candle direction).
ADX condition (above threshold).
RSI condition (within thresholds if enabled). Labels are created with label.new, and alerts are triggered with alert.
6. Trend Line Extension
The extendTrendline function dynamically updates the trend line’s endpoint unless a breakout occurs. It uses strict mode checks to ensure the trend line remains valid.
7. Previous Trend Lines
If enabled, previous main trend lines are stored in arrays (previousBearishStartLines, previousBullishTrendLines, etc.) and displayed on the chart, providing historical context.
Disclaimer:
The information and publications are not intended to be, nor do they constitute, financial, investment, trading, or other types of advice or recommendations provided or endorsed by TradingView.

Kaito Box with RSI Div(Dynamic Adjustment + MA + Long)The script implements a dynamic trading strategy that combines box range detection, RSI divergence signals, and moving average trend analysis. It is designed for use on OKX Signal Bots and includes features for dynamic position scaling and partial position closing. Below is a summary of its key functionalities:
Key Features:
Box Range Detection:
The script identifies price ranges using the highest high and lowest low of a configurable boxLength period.
These levels are plotted on the chart to visualize the price range.
RSI Divergence Detection:
The script calculates RSI using a configurable rsiLength.
Detects bullish divergence when price makes a lower low, but RSI makes a higher low.
Detects bearish divergence when price makes a higher high, but RSI makes a lower high.
Includes separate left and right lookback periods (leftLookback, rightLookback) for precise local extrema detection.
Customizable Moving Averages:
Supports multiple types of Moving Averages (SMA, EMA, SMMA, WMA, VWMA).
Calculates and plots MA20, MA50, MA100, and MA200 on a user-defined timeframe (custom_timeframe).
Identifies uptrends and downtrends based on the alignment of the moving averages and price levels.
Dynamic Position Scaling:
Implements dynamic position sizing for long entries and partial position closing for exits.
The percentage of position size added or closed is based on the difference between the current price and the average position price (avgPrice), with configurable minimum thresholds (minEnterPercent, minExitPercent).
Signal Integration for OKX Bots:
Sends buy/sell signals to OKX Signal Bots using the configured signalToken.
Supports market or limit orders with configurable price offsets and investment types.
Trend-Based Signal Filtering:
Only triggers long signals during downtrends and short signals during uptrends, ensuring trades align with the overall market context.
Visual Annotations:
Plots bullish and bearish divergence signals on the chart.
Displays labels showing dynamic position size adjustments and current average price during trades.
How It Works:
Long Signals:
Triggered when the price breaches the lower box range, and a bullish RSI divergence is detected.
Additional filtering ensures long trades are executed only during downtrend conditions.
Dynamically adjusts the position size based on the price difference from the average entry price.
Short Signals:
Triggered when the price breaches the upper box range, and a bearish RSI divergence is detected.
Additional filtering ensures short trades are executed only during uptrend conditions.
Dynamically closes portions of the position based on price movement relative to the average entry price.
Alerts:
Generates actionable alerts formatted for OKX bots, including order type, signal token, and dynamically calculated position sizes.
Use Case:
This strategy is well-suited for automated trading on platforms like OKX, where it can:
Exploit price ranges and RSI divergences for precise entries and exits.
Dynamically manage position sizes to optimize risk-reward.
Adapt to different market conditions using configurable parameters like moving averages, divergence lookbacks, and trend filters.
This script provides a robust foundation for traders looking to automate their strategies while maintaining flexibility and control over their trading logic.

[blackcat] L3 Volatility Ehlers Stochastic CGOOVERVIEW
This advanced indicator integrates the Center of Gravity Oscillator (CGO) with an Ehlers-Stochastic framework and an Adaptive Local Minimum-Maximum Average (ALMA) smoothing algorithm. Designed for non-overlaid charts, it identifies market momentum shifts by analyzing price action through multi-layer volatility analysis.
FEATURES
• Dual-line system:
✓ Stochastic CGO: Core oscillating line derived from weighted OHLC price calculations
✓ ALMA Lagging Line: Smoothing component using customizable offset/sigma parameters
• Dynamic color scheme:
✓ Green/red trend differentiation via crossover comparison
✓ Optional fill areas between lines (toggleable)
• Clear trade signals:
✓ Buy/Sell labels triggered by mathematically defined crossovers
✓ Zero-reference baseline marker (#0ebb23)
• Customizable parameters:
Fast Length (9 default) controls CGO sensitivity
Slow Length (5 default) governs ALMA responsiveness
ALMA Offset/Sigma allow adaptive curve optimization
HOW TO USE
Configure core parameters:
• Adjust Fast Length (CGO timeframe window)
• Set Slow Length, ALMA Offset, and Sigma for smoother/laggier response
Interpret visuals:
• Bullish trend = green shaded zone (when primary line above lagging line)
• Bearish trend = red shaded zone (primary line below lagging line)
Analyze signals:
• Buy triggers occur when rising CGO crosses above ALMA while below zero
• Sell triggers activate when falling CGO breaks below ALMA after exceeding zero base
Optimize display:
✓ Enable/disable fill area via Fill Between Lines
LIMITATIONS
• Relies heavily on lookback periods - rapid market changes may reduce predictive accuracy
• Signal frequency increases during high-volatility environments
• Requires additional confirmation methods due to occasional premature crossovers
• Default parameter settings may lack universality across asset classes
NOTES
• Best paired with volume-based confirmations for stronger signals
• Reducing ALMA Sigma sharpens line responsiveness at cost of noise susceptibility
• Increasing Fast Length extends calculation horizon while reducing peak sensitivity
• Weighted OHLC source formula prioritizes closing prices for swing direction assessment
Multi-Anchored Linear Regression Channels [TANHEF]█ Overview:
The 'Multi-Anchored Linear Regression Channels ' plots multiple dynamic regression channels (or bands) with unique selectable calculation types for both regression and deviation. It leverages a variety of techniques, customizable anchor sources to determine regression lengths, and user-defined criteria to highlight potential opportunities.
Before getting started, it's worth exploring all sections, but make sure to review the Setup & Configuration section in particular. It covers key parameters like anchor type, regression length, bias, and signal criteria—essential for aligning the tool with your trading strategy.
█ Key Features:
⯁ Multi-Regression Capability:
Plot up to three distinct regression channels and/or bands simultaneously, each with customizable anchor types to define their length.
⯁ Regression & Deviation Methods:
Regressions Types:
Standard: Uses ordinary least squares to compute a simple linear trend by averaging the data and deriving a slope and endpoints over the lookback period.
Ridge: Introduces L2 regularization to stabilize the slope by penalizing large coefficients, which helps mitigate multicollinearity in the data.
Lasso: Uses L1 regularization through soft-thresholding to shrink less important coefficients, yielding a simpler model that highlights key trends.
Elastic Net: Combines L1 and L2 penalties to balance coefficient shrinkage and selection, producing a robust weighted slope that handles redundant predictors.
Huber: Implements the Huber loss with iteratively reweighted least squares (IRLS) and EMA-style weights to reduce the impact of outliers while estimating the slope.
Least Absolute Deviations (LAD): Reduces absolute errors using iteratively reweighted least squares (IRLS), yielding a slope less sensitive to outliers than squared-error methods.
Bayesian Linear: Merges prior beliefs with weighted data through Bayesian updating, balancing the prior slope with data evidence to derive a probabilistic trend.
Deviation Types:
Regressive Linear (Reverse): In reverse order (recent to oldest), compute weighted squared differences between the data and a line defined by a starting value and slope.
Progressive Linear (Forward): In forward order (oldest to recent), compute weighted squared differences between the data and a line defined by a starting value and slope.
Balanced Linear: In forward order (oldest to newest), compute regression, then pair to source data in reverse order (newest to oldest) to compute weighted squared differences.
Mean Absolute: Compute weighted absolute differences between each data point and its regression line value, then aggregate them to yield an average deviation.
Median Absolute: Determine the weighted median of the absolute differences between each data point and its regression line value to capture the central tendency of deviations.
Percent: Compute deviation as a percentage of a base value by multiplying that base by the specified percentage, yielding symmetric positive and negative deviations.
Fitted: Compare a regression line with high and low series values by computing weighted differences to determine the maximum upward and downward deviations.
Average True Range: Iteratively compute the weighted average of absolute differences between the data and its regression line to yield an ATR-style deviation measure.
Bias:
Bias: Applies EMA or inverse-EMA style weighting to both Regression and/or Deviation, emphasizing either recent or older data.
⯁ Customizable Regression Length via Anchors:
Anchor Types:
Fixed: Length.
Bar-Based: Bar Highest/Lowest, Volume Highest/Lowest, Spread Highest/Lowest.
Correlation: R Zero, R Highest, R Lowest, R Absolute.
Slope: Slope Zero, Slope Highest, Slope Lowest, Slope Absolute.
Indicator-Based: Indicators Highest/Lowest (ADX, ATR, BBW, CCI, MACD, RSI, Stoch).
Time-Based: Time (Day, Week, Month, Quarter, Year, Decade, Custom).
Session-Based: Session (Tokyo, London, New York, Sydney, Custom).
Event-Based: Earnings, Dividends, Splits.
External: Input Source Highest/Lowest.
Length Selection:
Maximum: The highest allowed regression length (also fixed value of “Length” anchor).
Minimum: The shortest allowed length, ensuring enough bars for a valid regression.
Step: The sampling interval (e.g., 1 checks every bar, 2 checks every other bar, etc.). Increasing the step reduces the loading time, most applicable to “Slope” and “R” anchors.
Adaptive lookback:
Adaptive Lookback: Enable to display regression regardless of too few historical bars.
⯁ Selecting Bias:
Bias applies separately to regression and deviation.
Positive values emphasize recent data (EMA-style), negative invert, and near-zero maintains balance. (e.g., a length 100, bias +1 gives the newest price ~7× more weight than the oldest).
It's best to apply bias to both (regression and deviation) or just the deviation. Biasing only regression may distort deviation visually, while biasing both keeps their relationship intuitive. Using bias only for deviation scales it without altering regression, offering unique analysis.
⯁ Scale Awareness:
Supports linear and logarithmic price scaling, the regression and deviations adjust accordingly.
⯁ Signal Generation & Alerts:
Customizable entry/exit signals and alerts, detailed in the dedicated section below.
⯁ Visual Enhancements & Real-World Examples:
Optional on-chart table display summarizing regression input criteria (display type, anchor type, source, regression type, regression bias, deviation type, deviation bias, deviation multiplier) and key calculated metrics (regression length, slope, Pearson’s R, percentage position within deviations, etc.) for quick reference.
█ Understanding R (Pearson Correlation Coefficient):
Pearson’s R gauges data alignment to a straight-line trend within the regression length:
Range: R varies between –1 and +1.
R = +1 → Perfect positive correlation (strong uptrend).
R = 0 → No linear relationship detected.
R = –1 → Perfect negative correlation (strong downtrend).
This script uses Pearson’s R as an anchor, adjusting regression length to target specific R traits. Strong R (±1) follows the regression channel, while weak R (0) shows inconsistency.
█ Understanding the Slope:
The slope is the direction and rate at which the regression line rises or falls per bar:
Positive Slope (>0): Uptrend – Steeper means faster increase.
Negative Slope (<0): Downtrend – Steeper means sharper drop.
Zero or Near-Zero Slope: Sideways – Indicating range-bound conditions.
This script uses highest and lowest slope as an anchor, where extremes highlight strong moves and trend lines, while values near zero indicate sideways action and possible support/resistance.
█ Setup & Configuration:
Whether you’re new to this script or want to quickly adjust all critical parameters, the panel below shows the main settings available. You can customize everything from the anchor type and maximum length to the bias, signal conditions, and more.
Scale (select Log Scale for logarithmic, otherwise linear scale).
Display (regression channel and/or bands).
Anchor (how regression length is determined).
Length (control bars analyzed):
• Max – Upper limit.
• Min – Prevents regression from becoming too short.
• Step – Controls scanning precision; increasing Step reduces load time.
Regression:
• Type – Calculation method.
• Bias – EMA-style emphasis (>0=new bars weighted more; <0=old bars weighted more).
Deviation:
• Type – Calculation method.
• Bias – EMA-style emphasis (>0=new bars weighted more; <0=old bars weighted more).
• Multiplier - Adjusts Upper and Lower Deviation.
Signal Criteria:
• % (Price vs Deviation) – (0% = lower deviation, 50% = regression, 100% = upper deviation).
• R – (0 = no correlation, ±1 = perfect correlation; >0 = +slope, <0 = -slope).
Table (analyze table of input settings, calculated results, and signal criteria).
Adaptive Lookback (display regression while too few historical bars).
Multiple Regressions (steps 2 to 7 apply to #1, #2, and #3 regressions).
█ Signal Generation & Alerts:
The script offers customizable entry and exit signals with flexible criteria and visual cues (background color, dots, or triangles). Alerts can also be triggered for these opportunities.
Percent Direction Criteria:
(0% = lower deviation, 50% = regression line, 100% = upper deviation)
Above %: Triggers if price is above a specified percent of the deviation channel.
Below %: Triggers if price is below a specified percent of the deviation channel.
(Blank): Ignores the percent‐based condition.
Pearson's R (Correlation) Direction Criteria:
(0 = no correlation, ±1 = perfect correlation; >0 = positive slope, <0 = negative slope)
Above R / Below R: Compares the correlation to a threshold.
Above│R│ / Below│R│: Uses absolute correlation to focus on strength, ignoring direction.
Zero to R: Checks if R is in the 0-to-threshold range.
(Blank): Ignores correlation-based conditions.
█ User Tips & Best Practices:
Choose an anchor type that suits your strategy, “Bar Highest/Lowest” automatically spots commonly used regression zones, while “│R│ Highest” targets strong linear trends.
Consider enabling or disabling the Adaptive Lookback feature to ensure you always have a plotted regression if your chart doesn’t meet the maximum-length requirement.
Use a small Step size (1) unless relying on R-correlation or slope-based anchors as the are time-consuming to calculate. Larger steps speed up calculations but reduce precision.
Fine-tune settings such as lookback periods, regression bias, and deviation multipliers, or trend strength. Small adjustments can significantly affect how channels and signals behave.
To reduce loading time , show only channels (not bands) and disable signals, this limits calculations to the last bar and supports more extreme criteria.
Use the table display to monitor anchor type, calculated length, slope, R value, and percent location at a glance—especially if you have multiple regressions visible simultaneously.
█ Conclusion:
With its blend of advanced regression techniques, flexible deviation options, and a wide range of anchor types, this indicator offers a highly adaptable linear regression channeling system. Whether you're anchoring to time, price extremes, correlation, slope, or external events, the tool can be shaped to fit a variety of strategies. Combined with customizable signals and alerts, it may help highlight areas of confluence and support a more structured approach to identifying potential opportunities.

Adaptive Fibonacci Volatility Bands (AFVB)
**Adaptive Fibonacci Volatility Bands (AFVB)**
### **Overview**
The **Adaptive Fibonacci Volatility Bands (AFVB)** indicator enhances standard **Fibonacci retracement levels** by dynamically adjusting them based on market **volatility**. By incorporating **ATR (Average True Range) adjustments**, this indicator refines key **support and resistance zones**, helping traders identify **more reliable entry and exit points**.
**Key Features:**
- **ATR-based adaptive Fibonacci levels** that adjust to changing market volatility.
- **Buy and Sell signals** based on price interactions with dynamic support/resistance.
- **Toggleable confirmation filter** for refining trade signals.
- **Customizable color schemes** and alerts.
---
## **How This Indicator Works**
The **AFVB** operates in three main steps:
### **1️⃣ Detecting Key Fibonacci Levels**
The script calculates **swing highs and swing lows** using a user-defined lookback period. From this, it derives **Fibonacci retracement levels**:
- **0% (High)**
- **23.6%**
- **38.2%**
- **50% (Mid-Level)**
- **61.8%**
- **78.6%**
- **100% (Low)**
### **2️⃣ Adjusting for Market Volatility**
Instead of using **fixed retracement levels**, this indicator incorporates an **ATR-based adjustment**:
- **Resistance levels** shift **upward** based on ATR.
- **Support levels** shift **downward** based on ATR.
- This makes levels more **responsive** to price action.
### **3️⃣ Generating Buy & Sell Signals**
AFVB provides **two types of signals** based on price interactions with key levels:
✔ **Buy Signal**:
Occurs when price **dips below** a support level (78.6% or 100%) and **then closes back above it**.
- **Optionally**, a confirmation buffer can be enabled to require price to close **above an additional threshold** (based on ATR).
✔ **Sell Signal**:
Triggered when price **breaks above a resistance level** (0% or 23.6%) and **then closes below it**.
📌 **Important:**
- The **buy threshold setting** allows traders to **fine-tune** entry conditions.
- Turning this setting **off** generates **more frequent** buy signals.
- Keeping it **on** reduces false signals but may result in **fewer trade opportunities**.
---
## **How to Use This Indicator in Trading**
### 🔹 **Entry Strategy (Buying)**
1️⃣ Look for **buy signals** at the **78.6% or 100% Fibonacci levels**.
2️⃣ Ensure price **closes above** the support level before entering a long trade.
3️⃣ **Enable or disable** the buy threshold filter depending on desired trade strictness.
### 🔹 **Exit Strategy (Selling)**
1️⃣ Watch for **sell signals** at the **0% or 23.6% Fibonacci levels**.
2️⃣ If price **breaks above resistance and then closes below**, consider exiting long positions.
3️⃣ Can be used **alone** or **combined with trend confirmation tools** (e.g., moving averages, RSI).
### 🔹 **Using the Toggleable Buy Threshold**
- **ON**: Buy signal requires **extra confirmation** (reduces false signals but fewer trades).
- **OFF**: Buy triggers as soon as price **closes back above support** (more signals, but may include weaker setups).
---
## **User Inputs**
### **🔧 Customization Options**
- **ATR Length**: Defines the period for **ATR calculation**.
- **Swing Lookback**: Determines how far back to find **swing highs and lows**.
- **ATR Multiplier**: Adjusts the size of **volatility-based modifications**.
- **Buy/Sell Threshold Factor**: Fine-tunes the **entry signal strictness**.
- **Show Level Labels**: Enables/disables **Fibonacci level annotations**.
- **Color Settings**: Customize **support/resistance colors**.
### **📢 Alerts**
AFVB includes built-in **alert conditions** for:
- **Buy Signals** ("AFVB BUY SIGNAL - Possible reversal at support")
- **Sell Signals** ("AFVB SELL SIGNAL - Possible reversal at resistance")
- **Any Signal Triggered** (Useful for automated alerts)
---
## **Who Is This Indicator For?**
✅ **Scalpers & Day Traders** – Helps identify **short-term reversals**.
✅ **Swing Traders** – Useful for **buying dips** and **selling rallies**.
✅ **Trend Traders** – Can be combined with **momentum indicators** for confirmation.
**Best Timeframes:**
⏳ **15-minute, 1-hour, 4-hour, Daily charts** (works across multiple assets).
---
## **Limitations & Considerations**
🚨 **Important Notes**:
- **No indicator guarantees profits**. Always **combine** it with **risk management strategies**.
- Works best **in trending & mean-reverting markets**—may generate false signals in **choppy conditions**.
- Performance may vary across **different assets & timeframes**.
📢 **Backtesting is recommended** before using it for live trading.
