Supertrend TP SL (PRO)2. Main Components:
Supertrend Indicator:
Theoretical basis: The Supertrend indicator is based on two main concepts: Average True Range (ATR) and Factor. ATR measures the extent of price fluctuations in a given period of time, while Factor determines the sensitivity of the indicator to price changes.
Mechanism of operation: The indicator calculates two possible lines: one line representing the potential support level and another line representing the potential resistance level. The selection of the appropriate line depends on the current price direction. When the price is above the line, the indicator is considered to be in an uptrend, and vice versa.
Customizable inputs:
atrPeriod: Allows the trader to specify the time period for calculating the ATR. Shorter periods make the indicator more sensitive to price changes, while longer periods reduce its sensitivity.
factor: Allows the adjustment of the factor. Higher values make the indicator less likely to give false signals, but they may also delay entry signals.
Risk Management:
Take Profit and Stop Loss Orders:
TPPoints: Specifies the distance between the entry price and the take profit level. This distance is expressed in points, and is converted to an actual price value using syminfo.mintick (the smallest possible price movement of the traded asset).
SLPoints: Specifies the distance between the entry price and the stop loss level.
Importance: These orders allow the trader to specify the maximum loss he is willing to take and the profit target he is aiming to achieve, which helps in effective risk management.
Activate/Disable Trades:
isLongEnabled: Allows buy trades to be enabled or disabled, which allows the trader to trade in one direction only (for example, only trade in the uptrend during a bull market).
isShortEnabled: Allows sell trades to be enabled or disabled.
isTakeProfitEnabled: Allows take profit orders to be enabled or disabled. The trader may wish to disable them if he prefers to manage his trades manually.
isStopLossEnabled: Allows you to enable or disable stop loss orders. Although disabling them may seem tempting in some cases, it is a very risky move.
Visual Customization:
Line Style and Width:
lineStyle: Allows the trader to choose the style of lines used to draw TP and SL levels (Solid, Dashed, Dotted).
lineWidth: Sets the thickness of the lines.
Label Size:
labelSize: Allows you to set the size of the labels that display TP and SL levels (Small, Normal, Large).
Colors:
bullColor, bearColor, tpColor, slColor: Allows the trader to customize the colors of the different elements on the chart, making visual analysis easier.
3. Strategy Logic:
Determining Entry Signals: The strategy relies on the Supertrend indicator to determine entry signals. When the Supertrend trend changes from bearish to bullish, a buy trade is triggered (if isLongEnabled is enabled). When the trend changes from bullish to bearish, a sell trade is triggered (if isShortEnabled is enabled).
Order Execution: Once the entry signal is triggered, the strategy automatically places buy or sell orders.
Trade Management: After opening a trade, the strategy monitors the price and automatically triggers Take Profit and Stop Loss orders if the price reaches the specified levels.
Visualization: The strategy displays useful information on the chart, such as TP and SL lines, entry and exit signals, which helps the trader understand the strategy’s behavior and evaluate its performance.
4. Advanced Tips:
Optimizing Settings: The strategy’s performance can be improved by adjusting different input values. For example, the trader can experiment with different values for atrPeriod and factor to improve the accuracy of Supertrend signals.
Combining Indicators: This strategy can be combined with other indicators to improve the accuracy of entry signals. For example, the Relative Strength Index (RSI) can be used to confirm Supertrend signals.
Time Analysis: The strategy’s performance can be analyzed over different time periods to evaluate its effectiveness in various market conditions.
Strategy Testing: Before using the strategy in real trading, it should be tested on historical data (Backtesting) to evaluate its performance and determine the optimal settings.
5. Associated Risks:
False Signals: The Supertrend indicator may sometimes give false signals, especially in volatile markets.
Losses: Even with the use of stop loss orders, the trader may be exposed to significant losses.
Over-optimization: Over-optimization of settings on historical data may lead to misleading results. The trader should be careful about generalizing the results to future data.
Over-reliance on automation: The automated strategy should not be relied upon completely. The trader should monitor the trades and make appropriate decisions when necessary.
6. Disclaimer:
I am not a licensed financial advisor. This strategy is provided for educational and illustrative purposes only and should not be considered as investment advice. Trading in financial markets involves significant risks and you may lose your invested capital. Before making any investment decisions, consult a qualified financial advisor and conduct your own research. You alone are responsible for your trading decisions and their results. By using this strategy, you acknowledge and agree that I am not responsible for any losses or damages you may incur.
2. المكونات الرئيسية:
مؤشر Supertrend:
الأساس النظري: يعتمد مؤشر Supertrend على مفهومين رئيسيين هما: متوسط المدى الحقيقي (Average True Range - ATR) ومعامل الضرب (Factor). ATR يقيس مدى تقلبات الأسعار في فترة زمنية محددة، بينما Factor يحدد مدى حساسية المؤشر لتغيرات الأسعار.
آلية العمل: يقوم المؤشر بحساب خطين محتملين: خط يمثل مستوى الدعم المحتمل وخط آخر يمثل مستوى المقاومة المحتمل. يعتمد اختيار الخط المناسب على اتجاه السعر الحالي. عندما يكون السعر أعلى من الخط، يعتبر المؤشر في اتجاه صاعد، والعكس صحيح.
المدخلات القابلة للتخصيص:
atrPeriod: يتيح للمتداول تحديد الفترة الزمنية لحساب ATR. الفترات الأقصر تجعل المؤشر أكثر حساسية لتغيرات الأسعار، بينما الفترات الأطول تقلل من حساسيته.
factor: يسمح بتعديل معامل الضرب. القيم الأعلى تجعل المؤشر أقل عرضة لإعطاء إشارات خاطئة، ولكنها قد تؤخر أيضًا إشارات الدخول.
إدارة المخاطر:
أوامر جني الأرباح وإيقاف الخسارة:
TPPoints: يحدد المسافة بين سعر الدخول ومستوى جني الأرباح. يتم التعبير عن هذه المسافة بالنقاط (Points)، ويتم تحويلها إلى قيمة سعرية فعلية باستخدام syminfo.mintick (أصغر حركة سعرية ممكنة للأصل المتداول).
SLPoints: يحدد المسافة بين سعر الدخول ومستوى إيقاف الخسارة.
الأهمية: تتيح هذه الأوامر للمتداول تحديد الحد الأقصى للخسارة التي يرغب في تحملها والهدف الربحي الذي يسعى لتحقيقه، مما يساعد على إدارة المخاطر بشكل فعال.
تفعيل/تعطيل الصفقات:
isLongEnabled: يسمح بتفعيل أو تعطيل صفقات الشراء، مما يمكن المتداول من التداول في اتجاه واحد فقط (على سبيل المثال، التداول فقط في الاتجاه الصاعد خلال سوق صاعدة).
isShortEnabled: يسمح بتفعيل أو تعطيل صفقات البيع.
isTakeProfitEnabled: يسمح بتفعيل أو تعطيل أوامر جني الأرباح. قد يرغب المتداول في تعطيلها إذا كان يفضل إدارة صفقاته يدويًا.
isStopLossEnabled: يسمح بتفعيل أو تعطيل أوامر إيقاف الخسارة. على الرغم من أن تعطيلها قد يبدو مغريًا في بعض الحالات، إلا أنه يعتبر خطوة محفوفة بالمخاطر للغاية.
التخصيص المرئي:
نمط وعرض الخطوط:
lineStyle: يتيح للمتداول اختيار نمط الخطوط المستخدمة لرسم مستويات TP و SL (Solid, Dashed, Dotted).
lineWidth: يحدد سمك الخطوط.
حجم الملصقات:
labelSize: يسمح بتحديد حجم الملصقات التي تعرض مستويات TP و SL (Small, Normal, Large).
الألوان:
bullColor, bearColor, tpColor, slColor: تتيح للمتداول تخصيص ألوان العناصر المختلفة على الرسم البياني، مما يسهل عملية التحليل البصري.
3. منطق عمل الاستراتيجية:
تحديد إشارات الدخول: تعتمد الاستراتيجية على مؤشر Supertrend لتحديد إشارات الدخول. عندما يتغير اتجاه Supertrend من هابط إلى صاعد، يتم تفعيل صفقة شراء (إذا كانت isLongEnabled مفعلة). وعندما يتغير الاتجاه من صاعد إلى هابط، يتم تفعيل صفقة بيع (إذا كانت isShortEnabled مفعلة).
تنفيذ الأوامر: بمجرد تفعيل إشارة الدخول، تقوم الاستراتيجية بوضع أوامر الشراء أو البيع تلقائيًا.
إدارة الصفقات: بعد فتح الصفقة، تقوم الاستراتيجية بمراقبة السعر وتفعيل أوامر جني الأرباح وإيقاف الخسارة تلقائيًا في حالة وصول السعر إلى المستويات المحددة.
التمثيل المرئي: تعرض الاستراتيجية معلومات مفيدة على الرسم البياني، مثل خطوط TP و SL وإشارات الدخول والخروج، مما يساعد المتداول على فهم سلوك الاستراتيجية وتقييم أدائها.
4. نصائح متقدمة:
تحسين الإعدادات: يمكن تحسين أداء الاستراتيجية من خلال تعديل قيم المدخلات المختلفة. على سبيل المثال، يمكن للمتداول تجربة قيم مختلفة لـ atrPeriod و factor لتحسين دقة إشارات Supertrend.
الجمع بين المؤشرات: يمكن دمج هذه الاستراتيجية مع مؤشرات أخرى لتحسين دقة إشارات الدخول. على سبيل المثال، يمكن استخدام مؤشر القوة النسبية (RSI) لتأكيد إشارات Supertrend.
التحليل الزمني: يمكن تحليل أداء الاستراتيجية على مدى فترات زمنية مختلفة لتقييم مدى فعاليتها في ظروف السوق المتنوعة.
اختبار الاستراتيجية: قبل استخدام الاستراتيجية في التداول الحقيقي، يجب اختبارها على بيانات تاريخية (Backtesting) لتقييم أدائها وتحديد الإعدادات المثلى.
5. المخاطر المرتبطة:
الإشارات الخاطئة: قد يعطي مؤشر Supertrend إشارات خاطئة في بعض الأحيان، خاصة في الأسواق المتقلبة.
الخسائر: حتى مع استخدام أوامر إيقاف الخسارة، قد يتعرض المتداول لخسائر كبيرة.
التحسين المفرط: قد يؤدي التحسين المفرط للإعدادات على بيانات تاريخية إلى نتائج مضللة. يجب أن يكون المتداول حذرًا بشأن تعميم النتائج على البيانات المستقبلية.
الاعتماد الزائد على الأتمتة: يجب عدم الاعتماد بشكل كامل على الاستراتيجية الآلية. يجب على المتداول مراقبة الصفقات واتخاذ القرارات المناسبة عند الضرورة.
6. إخلاء المسؤولية:
أنا لست مستشارًا ماليًا مرخصًا. هذه الاستراتيجية مقدمة لأغراض تعليمية وتوضيحية فقط، ولا ينبغي اعتبارها نصيحة استثمارية. التداول في الأسواق المالية ينطوي على مخاطر كبيرة، وقد تخسر رأس المال المستثمر. قبل اتخاذ أي قرارات استثمارية، استشر مستشارًا ماليًا مؤهلاً وقم بإجراء بحثك الخاص. أنت وحدك المسؤول عن قراراتك التجارية ونتائجها. باستخدام هذه الاستراتيجية، فإنك تقر وتوافق على أنني لست مسؤولاً عن أي خسائر أو أضرار قد تتكبدها.
Cari skrip untuk "trigger"

Blockchain Fundamentals: Liquidity Cycle MomentumLiquidity Cycle Momentum Indicator
Overview:
This indicator analyzes global liquidity trends by calculating a unique Liquidity Index and measuring its year-over-year (YoY) percentage change. It then applies a momentum oscillator to the YoY change, providing insights into the cyclical momentum of liquidity. The indicator incorporates a limited historical data workaround to ensure accurate calculations even when the chart’s history is short.
Features Breakdown:
1. Limited Historical Data Workaround
Function: The limit(length) function adjusts the lookback period when there isn’t enough historical data (i.e., near the beginning of the chart), ensuring that calculations do not break due to insufficient data.
2. Global Liquidity Calculation
Data Sources:
TVC:CN10Y (10-year yield from China)
TVC:DXY (US Dollar Index)
ECONOMICS:USCBBS (US Central Bank Balance Sheet)
FRED:JPNASSETS (Japanese assets)
ECONOMICS:CNCBBS (Chinese Central Bank Balance Sheet)
FRED:ECBASSETSW (ECB assets)
Calculation Methodology:
A ratio is computed (cn10y / dxy) to adjust for currency influences.
The Liquidity Index is then derived by multiplying this ratio with the sum of the other liquidity components.
3. Year-over-Year (YoY) Percent Change
Computation:
The indicator determines the number of bars that approximately represent one year.
It then compares the current Liquidity Index to its value one year ago, calculating the YoY percentage change.
4. Momentum Oscillator on YoY Change
Oscillator Components:
1. Calculated using the Chande Momentum Oscillator (CMO) applied to the YoY percent change with a user-defined momentum length.
2. A weighted moving average (WMA) that smooths the momentum signal.
3. Overbought and Oversold zones
Signal Generation:
Buy Signal: Triggered when the momentum crosses upward from an oversold condition, suggesting a potential upward shift in liquidity momentum.
Sell Signal: Triggered when crosses below an overbought condition, indicating potential downward momentum.
State Management:
The indicator maintains a state variable to avoid repeated signals, ensuring that a new buy or sell signal is only generated when there’s a clear change in momentum.
5. Visual Presentation and Alerts
Plots:
The oscillator value and signalline are plotted for visual analysis.
Overbought and oversold levels are marked with dashed horizontal lines.
Signal Markers:
Buy and sell signals are marked with green and maroon circles, respectively.
Background Coloration:
Optionally, the chart’s background bars are colored (yellow for buy signals and fuchsia for sell signals) to enhance visual cues when signals are triggered.
Conclusion
In summary, the Liquidity Cycle Momentum Indicator provides a robust framework to analyze liquidity trends by combining global liquidity data, YoY changes, and momentum oscillation. This makes it an effective tool for traders and analysts looking to identify cyclical shifts in liquidity conditions and potential turning points in the market.

9-20 EMA Crossover with TP and SL9-20 EMA Crossover: This script tracks the crossover of the 9-period EMA and the 20-period EMA.
When the 9 EMA crosses above the 20 EMA, a buy signal is triggered.
When the 9 EMA crosses below the 20 EMA, a sell signal is triggered.
Take Profit and Stop Loss Levels:
The take profit for a long position is set at 3% above the entry price (close * 1.03).
The stop loss for a long position is set at 1% below the entry price (close * 0.99).
The take profit for a short position is set at 3% below the entry price (close * 0.97).
The stop loss for a short position is set at 1% above the entry price (close * 1.01).
Leverage: The strategy uses 20x leverage for both long and short positions (leverage=20).
Alerts: Alerts are set up for the buy signal when the 9 EMA crosses above the 20 EMA and the sell signal when the 9 EMA crosses below the 20 EMA. These alerts can be used with a webhook to trigger trades on Binance Futures.
Strategy:
For long trades: The strategy enters a long position and sets a take profit at 3% above the entry price and a stop loss at 1% below the entry price.
For short trades: The strategy enters a short position and sets a take profit at 3% below the entry price and a stop loss at 1% above the entry price.

CHAKRA RISS ENGULFING CANDLESTICK STRATEGYChakra RISS Engulfing Candlestick Strategy
Type: Technical Indicator & Strategy
Platform: TradingView
Script Version: Pine Script v6
Overview:
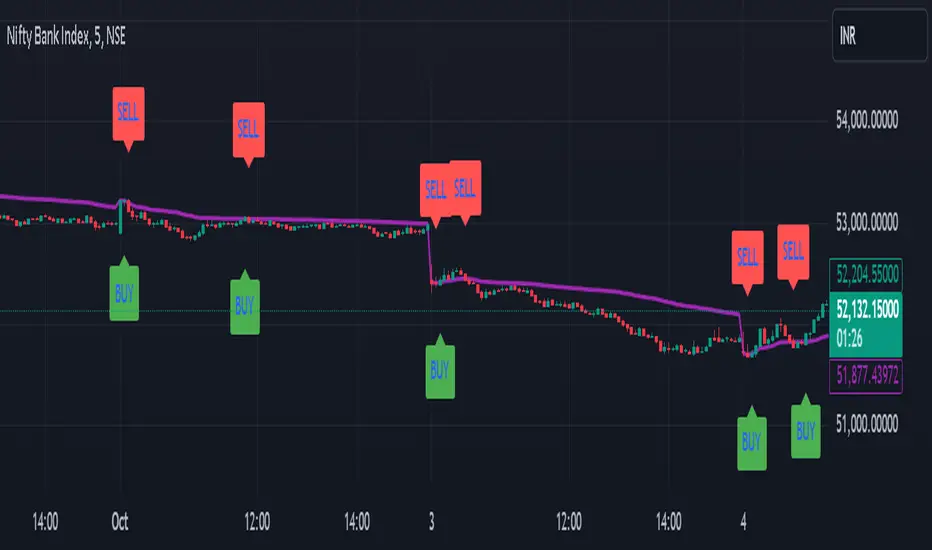
The Chakra RISS Engulfing Candlestick Strategy combines a momentum-based approach using the Relative Strength Index (RSI) with Engulfing Candlestick Patterns to generate buy and sell signals. The strategy filters trades based on price movement relative to a 50-period Simple Moving Average (SMA), making it a trend-following strategy.
The indicator uses color-coded bars to visually represent market conditions, helping traders easily identify bullish and bearish trends. The strategy is designed to be dynamic, adapting to changing market conditions and filtering out noise using key technical indicators.
How It Works:
RSI-Based Color Conditions:
Green Bars: When the RSI crosses above a specified UpLevel (default: 50), indicating a bullish momentum and signaling potential buy conditions.
Red Bars: When the RSI crosses below a specified DownLevel (default: 50), indicating a bearish momentum and signaling potential sell conditions.
Buy Signal:
Triggered when the following conditions are met:
RSI crosses from below the UpLevel (default: 50) to above it, signaling increasing bullish momentum.
The close price is above the 50-period Simple Moving Average (SMA), confirming an uptrend.
The Buy Signal is plotted below the bar with a green arrow and a "BUY" label.
Sell Signal:
Triggered when the following conditions are met:
RSI crosses from above the DownLevel (default: 50) to below it, signaling increasing bearish momentum.
The close price is below the 50-period Simple Moving Average (SMA), confirming a downtrend.
The Sell Signal is plotted above the bar with a red arrow and a "SELL" label.
Stop Loss and Take Profit:
For long trades (buy signals), the stop loss is placed below the previous bar's low, and the take profit is set at 3% above the entry price.
For short trades (sell signals), the stop loss is placed above the previous bar's high, and the take profit is set at 3% below the entry price.
Dynamic Bar Coloring:
The bar colors change dynamically based on RSI levels:
Green Bars: Indicating a potential uptrend (bullish).
Red Bars: Indicating a potential downtrend (bearish).
These visual cues help traders quickly identify market trends and potential reversals.
Trend Filtering:
The 50-period Simple Moving Average (SMA) is used to filter trades based on the overall market trend:
Buy signals are only considered when the price is above the moving average, indicating an uptrend.
Sell signals are only considered when the price is below the moving average, indicating a downtrend.
Alerting System:
Alerts can be set for both buy and sell signals. These alerts notify traders in real-time when potential trades are generated, allowing them to act promptly.
Alerts can be configured to send notifications through email, SMS, or a webhook for integration with other services like IFTTT or Zapier.
Key Features:
RSI and Moving Average-Based Signals: Combines RSI with a moving average for more accurate trade signals.
Stop Loss and Take Profit: Dynamic risk management with custom stop loss and take profit levels based on previous high and low prices.
Buy and Sell Alerts: Provides real-time alerts when a buy or sell signal is triggered.
Trend Confirmation: Uses the 50-period Simple Moving Average to filter signals and confirm the direction of the trend.
Visual Bar Color Changes: Makes it easy to identify bullish or bearish trends with color-coded bars.
Usage:
This strategy is suitable for traders who prefer a trend-following approach and want to combine momentum indicators (RSI) with price action (Engulfing Candlestick patterns). It is particularly useful in volatile markets where quick identification of trend changes can lead to profitable trades.
Best Used For: Day trading, swing trading, and trend-following strategies.
Timeframes: Works well on various timeframes, from 1-minute charts for scalping to daily charts for swing trading.
Markets: Can be applied to any market with sufficient liquidity (stocks, forex, crypto, etc.).
Settings:
UpLevel: The RSI level above which the market is considered bullish (default: 50).
DownLevel: The RSI level below which the market is considered bearish (default: 50).
SMA Length: The period of the Simple Moving Average used to filter trades (default: 50).
Risk Management: Customizable stop loss and take profit settings based on price action (default: 3% above/below the entry price).

Gold Trade Setup Strategy
Title: Profitable Gold Setup Strategy with Adaptive Moving Average & Supertrend
Introduction:
This trading strategy for Gold (XAU/USD) combines the Adaptive Moving Average (AMA) and Supertrend, tailored for high-probability setups during specific trading hours. The AMA identifies the trend, while the Supertrend confirms entry and exit points. The strategy is optimized for swing and intraday traders looking to capitalize on Gold’s price movements with precise trade timing.
Strategy Components:
1. Adaptive Moving Average (AMA):
• Reacts dynamically to market conditions, filtering noise in choppy markets.
• Serves as the primary trend indicator.
2. Supertrend:
• Confirms entry signals with clear buy and sell levels.
• Acts as a trailing stop-loss to protect profits.
Trading Rules:
Trading Hours:
• Only take trades between 8:30 AM and 10:30 PM IST.
• Avoid trading outside these hours to reduce noise and low-volume setups.
Buy Setup:
1. Trend Confirmation: The Adaptive Moving Average (AMA) must be green.
2. Signal Confirmation: The Supertrend should turn green after the AMA is green.
3. Trigger: Take the trade when the high of the trigger candle (the candle that turned Supertrend green) is broken.
Sell Setup (Optional if included):
• Reverse the rules for a short trade: AMA and Supertrend should both indicate bearish conditions (red), and take the trade when the low of the trigger candle is broken.
Stop-Loss and Targets:
• Place the stop-loss at the low of the trigger candle for long trades.
• Set a 1:2 risk-reward ratio or use the Supertrend line as a trailing stop-loss.
Timeframes:
• Recommended timeframes: 1H, 4H, or Daily for swing trading.
• For intraday trading, use 15-minute or 30-minute charts.
Why This Strategy Works:
• Combines trend-following (AMA) with momentum-based entries (Supertrend).
• Focused trading hours filter out low-probability setups.
• Provides precise entry, stop-loss, and target levels for disciplined trading.
Conclusion:
This Gold Setup Strategy is designed for traders seeking a structured approach to trading Gold. Follow the rules strictly, backtest the strategy extensively, and share your results. Let’s master the Gold market together!
Tags: #Gold #XAUUSD #SwingTrading #Intraday #Supertrend #AMA #TechnicalAnalysis #GoldStrategy

TearRepresentative's Rule-Based Dip Buying Strategy Rule-Based Dip Buying Strategy Indicator
This TradingView indicator, inspired by TearRepresentative [ , is a refined tool designed to assist traders in implementing a rule-based dip buying strategy. The indicator automates the identification of optimal buy and sell points, helping traders stay disciplined and minimize emotional biases. It is tailored to index trading, specifically leveraged ETFs like SPXL, to capture opportunities in market pullbacks and recoveries.
Key Features
Dynamic Buy Levels:
Tracks the local high over a customizable lookback period and calculates three buy levels based on percentage drops from the high:
Buy Level 1: First entry point (e.g., 15% drop).
Buy Level 2: Second entry point (e.g., additional 10% drop).
Buy Level 3: Third entry point (e.g., additional 7% drop).
Average Price Tracking:
Dynamically calculates the average price for entered positions when multiple buy levels are triggered.
Sell Level:
Computes a take-profit level (e.g., 20% above the average price) to automate profit-taking when the market rebounds.
Signal Visualization:
Buy Signals: Displayed as green triangles at each buy level.
Sell Signals: Displayed as red triangles at the sell level.
Alerts:
Configurable alerts notify traders when buy or sell signals are triggered, ensuring no opportunity is missed.
Visual Aids:
Semi-transparent and dynamic lines represent buy and sell levels for clear visualization.
Labels provide additional clarity for active levels, helping traders quickly identify actionable signals.
How It Works
The indicator analyzes market movements to identify dips based on predefined thresholds.
Buy signals are triggered when the market price reaches specified levels below the local high.
Once a position is taken, the indicator dynamically adjusts the average entry price and calculates the corresponding sell level.
A sell signal is generated when the market price rises above the calculated take-profit level.
Why Use This Indicator?
Discipline: Automates decision-making, removing emotional factors from trading.
Clarity: Provides clear entry and exit points to simplify complex market dynamics.
Versatility: Suitable for all market conditions, especially during pullbacks and rebounds.
Customization: Allows traders to tailor parameters to their preferred trading style and risk tolerance.
Acknowledgment
This indicator is based on the strategy and insights provided by TearRepresentative, whose expertise in rule-based trading has inspired countless traders. TearRepresentative's approach emphasizes simplicity, reliability, and consistency, offering a robust framework for long-term success.

Eze Profit - VWAP + MACD Combined SignalThe Eze Profit - VWAP + MACD Combined Signal is an advanced trading tool designed to help traders align price trends with momentum confirmation for better decision-making. By combining Volume-Weighted Average Price (VWAP) and Moving Average Convergence Divergence (MACD), this indicator provides clear entry and exit signals, allowing traders to follow trends and take advantage of momentum shifts.
How It Works:
VWAP:
VWAP represents the average price of an asset, weighted by volume, over a specific period.
It acts as a dynamic support/resistance level and trend filter. Price above VWAP indicates bullish conditions, while price below VWAP suggests bearish conditions.
MACD:
MACD measures momentum through the difference between fast and slow exponential moving averages (EMAs).
Signals are generated when the MACD line crosses its signal line:
Bullish Crossover: Indicates increasing upward momentum.
Bearish Crossunder: Indicates increasing downward momentum.
Combined Logic:
Long Signal: Triggered when price is above VWAP, and MACD exhibits a bullish crossover.
Short Signal: Triggered when price is below VWAP, and MACD exhibits a bearish crossunder.
The script tracks the trader's "in-position" state to prevent redundant signals and ensure clarity.
How to Use:
Use this script to identify potential long and short trading opportunities:
Buy Signal: Enter a long position when the price moves above VWAP and MACD confirms bullish momentum.
Sell Signal: Exit or short when the price drops below VWAP and MACD confirms bearish momentum.
Combine with additional tools like support/resistance, volume analysis, or candlestick patterns for confirmation.
Features:
VWAP Trend Filter: Dynamically adjusts to the trading session to identify overall trend direction.
MACD Momentum Confirmation: Detects key momentum shifts with configurable settings for fast, slow, and signal lengths.
Position State Tracking: Avoids signal redundancy by monitoring open positions.
Buy/Sell Visualizations: Plots Buy/Sell signals directly on the chart for ease of use.
Alerts: Notifies traders in real-time when a long or short signal is triggered.
Customizable Settings:
MACD Fast Length, Slow Length, and Signal Smoothing parameters.
VWAP timeframe resolution to adapt to different trading styles (e.g., intraday or daily).
Credits:
This script is based on standard VWAP and MACD calculations provided by TradingView’s library and has been enhanced with unique logic for combined signal generation.
Notes:
This indicator is intended for educational purposes and should not be considered financial advice. Use it as part of a broader trading strategy alongside other tools for optimal results.

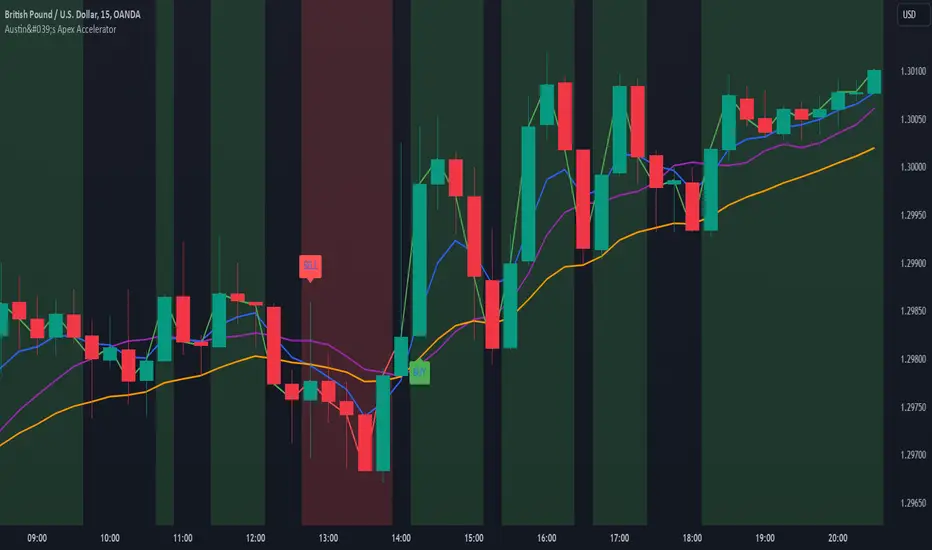
Austin's Apex AcceleratorIndicator Name: Austin’s Apex Accelerator
Overview
The Austin’s Apex Accelerator is a highly aggressive trading indicator designed specifically for high-frequency Forex trading. It combines several technical analysis tools to identify rapid entry and exit points, making it well-suited for intraday or even lower timeframe trades. The indicator leverages a combination of exponential moving averages (EMAs), Bollinger Bands, volume filters, and volatility-adjusted ranges to detect breakout opportunities and manage risk with precision.
Core Components
Fast and Slow EMAs: The two EMAs act as trend and momentum indicators. When the shorter EMA crosses the longer EMA, it signals a change in momentum. The crossover of these EMAs often indicates a potential entry point, especially when combined with volume and volatility filters.
ATR-Based Range Filter: Using the Average True Range (ATR) for dynamic range calculation, the indicator adapts to market volatility. Higher ATR values widen the range, helping the indicator adjust for volatile conditions.
Volume Filter: A volume condition ensures that buy and sell signals only trigger when there’s significant market interest, reducing the likelihood of false signals in low-liquidity environments.
Bollinger Bands: The Bollinger Bands provide additional context for potential overbought or oversold conditions, highlighting opportunities for price reversals or trend continuations.
Key Features
Aggressive Buy and Sell Signals:
Buy Signal: A buy signal is generated when the fast EMA crosses above the slow EMA, confirming bullish momentum, and the volume condition is met. If the price is also near the lower Bollinger Band, it adds further confirmation of an oversold condition.
Sell Signal: A sell signal is generated when the fast EMA crosses below the slow EMA, confirming bearish momentum, with sufficient trading volume. If the price is near the upper Bollinger Band, it signals a potential overbought condition, which supports the sell signal.
Dynamic Range with ATR:
The indicator uses a volatility-based range, derived from the ATR, to adjust the signal sensitivity based on recent price fluctuations. This dynamic range ensures that signals are responsive in both high and low volatility conditions.
The range’s upper and lower bands act as thresholds, with trades often occurring when the price breaches these levels, signaling momentum shifts or trend reversals.
Trend Background Color:
A green background highlights bullish trends when the fast EMA is above the slow EMA.
A red background signifies bearish trends when the fast EMA is below the slow EMA, providing a visual indication of the overall market trend direction.
Trend Line:
The indicator plots a dynamic trend line that changes color based on the price's relationship to the EMAs, helping traders quickly assess the current trend’s strength and direction.
Alerts:
The indicator includes configurable alerts for buy and sell signals, allowing traders to be notified of entry opportunities without needing to monitor the chart continuously.
How to Use Austin’s Apex Accelerator
Identify Entry Points:
Buy Entry: When the fast EMA crosses above the slow EMA, a buy signal is triggered. Confirm this signal by checking if the price is near or below the lower Bollinger Band (indicating an oversold condition) and if trading volume meets the set threshold.
Sell Entry: When the fast EMA crosses below the slow EMA, a sell signal is triggered. Confirm the signal by ensuring the price is near or above the upper Bollinger Band (suggesting an overbought condition) and that volume is sufficient.
Exit Strategy:
Take Profit: The take profit level is calculated as 1.5 times the ATR from the entry point. This ensures that each trade aims to achieve a positive risk/reward ratio.
Stop Loss: The stop loss is set at 1 ATR from the entry, providing a tight risk control mechanism that limits potential losses on each trade.
Trend Identification and Background Colors:
Use the background colors to assess the trend direction. A green background indicates a bullish trend, while a red background suggests a bearish trend. These colors can help you filter signals that go against the trend, increasing the chances of a successful trade.
Volume Confirmation:
This indicator has an inbuilt volume filter to prevent trading in low-volume conditions. Look for signals only when volume exceeds the average volume threshold, which is set by the multiplier. This helps avoid trading during quieter times when false signals are more likely.
Alerts:
Set up alerts for buy and sell signals to be notified in real-time whenever a new trading opportunity arises, so you can act on high-quality signals promptly.
Practical Tips for Using Austin’s Apex Accelerator
Timeframe: Best suited for short timeframes such as 5-minute or 15-minute charts for high-frequency trading.
Cumulative Volume Delta with VWAP-based Buy/Sell AlertsDescription:
This script combines Cumulative Volume Delta (CVD) with Volume Weighted Average Price (VWAP) to generate buy and sell signals. It plots both the cumulative volume delta and its moving average on the chart, but the actual buy and sell signals are now based on the crossover and crossunder of the price with the VWAP, a popular tool for tracking price relative to the volume-weighted average over time.
Features:
Cumulative Volume Delta (CVD) Plot:
CVD helps visualize the net buying or selling pressure by accumulating volume when the price is rising and subtracting it when the price is falling. The cumulative volume is plotted on the chart as a blue line.
Moving Average of CVD:
A simple moving average (SMA) of the cumulative volume delta is plotted in orange to smooth out fluctuations and help detect the trend of volume flow.
VWAP Calculation:
VWAP (Volume Weighted Average Price) is a standard benchmark widely used in trading. It gives insight into whether the price is trading above or below the average price at which most of the volume has traded, weighted by volume. The VWAP is plotted as a purple line on the chart.
Buy/Sell Signals Based on VWAP:
Buy Signal: Triggered when the price crosses above the VWAP, indicating potential upward momentum.
Sell Signal: Triggered when the price crosses below the VWAP, signaling potential downward momentum.
These signals are displayed on the chart with clear labels:
Buy Signal: A green upward label appears below the price.
Sell Signal: A red downward label appears above the price.
Alerts for Buy/Sell Conditions:
Alerts are built into the script, so traders can receive notifications when the following conditions are met:
Buy Alert: The price crosses above the VWAP.
Sell Alert: The price crosses below the VWAP.
Use Case:
This script is useful for traders looking to incorporate both volume-based indicators and the VWAP into their trading strategy. The combination of CVD and VWAP provides a more comprehensive view of both price and volume dynamics:
VWAP helps traders understand whether the price is trading above or below its volume-weighted average.
CVD highlights buying or selling pressure through cumulative volume analysis.
Customization:
Anchor Periods: The user can customize the anchor period to suit different timeframes and trading styles.
Custom Alerts: The alert conditions can be easily modified to integrate into any trader’s strategy.
This script can be adapted for both short-term and long-term trading strategies and is especially useful in high-volume markets.
How to Use:
Add the script to your TradingView chart.
Customize the timeframe and anchor period, if needed, to match your preferred trading style.
Watch for Buy/Sell signals based on price crossing the VWAP.
Set up alerts to receive notifications when Buy or Sell signals are triggered.
This script is designed to help traders make informed decisions based on both price action relative to volume and Cumulative Delta volume trends, giving a more comprehensive view of the market dynamics.
Uptrick: MultiTrend Squeeze System**Uptrick: MultiTrend Squeeze System Indicator: The Ultimate Trading Tool for Precision and Versatility 📈🔥**
### Introduction
The MultiTrend Squeeze System is a powerful, multi-faceted trading indicator designed to provide traders with precise buy and sell signals by combining the strengths of multiple technical analysis tools. This script isn't just an indicator; it's a comprehensive trading system that merges the power of SuperTrend, RSI, Volume Filtering, and Squeeze Momentum to give you an unparalleled edge in the market. Whether you're a day trader looking for short-term opportunities or a swing trader aiming to catch longer-term trends, this indicator is tailored to meet your needs.
### Key Features and Unique Aspects
1. **SuperTrend with Dynamic Adjustments 📊**
- **Adaptive SuperTrend Calculation:** The SuperTrend is a popular trend-following indicator that adjusts dynamically based on market conditions. It uses the Average True Range (ATR) to calculate upper and lower bands, which shift according to market volatility. This script takes it further by combining it with the RSI and Volume filtering to provide more accurate signals.
- **Direction Sensitivity:** The SuperTrend here is not static. It adjusts based on the direction of the previous SuperTrend value, ensuring that the indicator remains relevant even in choppy markets.
2. **RSI Integration for Overbought/Oversold Conditions 💹**
- **RSI Calculation:** The Relative Strength Index (RSI) is incorporated to identify overbought and oversold conditions, adding an extra layer of precision. This helps in filtering out false signals and ensuring that trades are taken only in optimal conditions.
- **Customizable RSI Settings:** The RSI settings are fully customizable, allowing traders to adjust the RSI length and the overbought/oversold levels according to their trading style and market.
3. **Volume Filtering for Enhanced Signal Confirmation 📉**
- **Volume Multiplier:** This unique feature integrates volume analysis, ensuring that signals are only generated when there is sufficient market participation. The Volume Multiplier can be adjusted to filter out weak signals that occur during low-volume periods.
- **Optional Volume Filtering:** Traders have the flexibility to turn the volume filter on or off, depending on their preference or market conditions. This makes the indicator versatile, allowing it to be used across different asset classes and market conditions.
4. **Squeeze Momentum Indicator (SMI) for Market Pressure Analysis 💥**
- **Squeeze Detection:** The Squeeze Momentum Indicator detects periods of market compression and expansion. This script goes beyond the traditional Bollinger Bands and Keltner Channels by incorporating true range calculations, offering a more nuanced view of market momentum.
- **Customizable Squeeze Settings:** The lengths and multipliers for both Bollinger Bands and Keltner Channels are customizable, giving traders the flexibility to fine-tune the indicator based on their specific needs.
5. **Visual and Aesthetic Customization 🎨**
- **Color-Coding for Clarity:** The indicator is color-coded to make it easy to interpret signals. Bullish trends are marked with a vibrant green color, while bearish trends are highlighted in red. Neutral or unconfirmed signals are displayed in softer tones to reduce noise.
- **Histogram Visualization:** The primary trend direction and strength are displayed as a histogram, making it easy to visualize the market's momentum at a glance. The height and color of the bars provide immediate feedback on the strength and direction of the trend.
6. **Alerts for Real-Time Trading 🚨**
- **Custom Alerts:** The script is equipped with custom alerts that notify traders when a buy or sell signal is generated. These alerts can be configured to send notifications through various channels, including email, SMS, or directly to the trading platform.
- **Immediate Reaction:** The alerts are triggered based on the confluence of SuperTrend, RSI, and Volume signals, ensuring that traders are notified only when the most robust trading opportunities arise.
7. **Comprehensive Input Customization ⚙️**
- **SuperTrend Settings:** Adjust the ATR length and factor to control the sensitivity of the SuperTrend. This allows you to adapt the indicator to different market conditions, whether you're trading a volatile cryptocurrency or a more stable stock.
- **RSI Settings:** Customize the RSI length and thresholds for overbought and oversold conditions, enabling you to tailor the indicator to your specific trading strategy.
- **Volume Settings:** The Volume Multiplier and the option to toggle the volume filter provide an additional layer of customization, allowing you to fine-tune the indicator based on market liquidity and participation.
- **Squeeze Momentum Settings:** The lengths and multipliers for Bollinger Bands and Keltner Channels can be adjusted to detect different levels of market compression, providing flexibility for both short-term and long-term traders.
### How It Works: A Deep Dive Into the Mechanics 🛠️
1. **SuperTrend Calculation:**
- The SuperTrend is calculated using the ATR, which measures market volatility. The indicator creates upper and lower bands around the price, adjusting these bands based on the current level of market volatility. The direction of the trend is determined by the position of the price relative to these bands.
- The script enhances the standard SuperTrend by ensuring that the bands do not flip-flop too quickly, reducing the chances of false signals in a choppy market. The direction is confirmed by checking the position of the close relative to the previous band, making the trend detection more reliable.
2. **RSI Integration:**
- The RSI is calculated over a customizable length and compared to user-defined overbought and oversold levels. When the RSI crosses below the oversold level, and the SuperTrend indicates a bullish trend, a buy signal is generated. Conversely, when the RSI crosses above the overbought level, and the SuperTrend indicates a bearish trend, a sell signal is triggered.
- The combination of RSI with SuperTrend ensures that trades are only taken when there is a strong confluence of signals, reducing the chances of entering trades during weak or indecisive market phases.
3. **Volume Filtering:**
- The script calculates the average volume over a 20-period simple moving average. The volume filter ensures that buy and sell signals are only valid when the current volume exceeds a multiple of this average, which can be adjusted by the user. This feature helps filter out weak signals that might occur during low-volume periods, such as just before a major news event or during after-hours trading.
- The volume filter is particularly useful in markets where volume spikes are common, as it ensures that signals are only generated when there is significant market interest in the direction of the trend.
4. **Squeeze Momentum:**
- The Squeeze Momentum Indicator (SMI) adds a layer of market pressure analysis. The script calculates Bollinger Bands and Keltner Channels, detecting when the market is in a "squeeze" — a period of low volatility that typically precedes a significant price move.
- When the Bollinger Bands are inside the Keltner Channels, the market is in a squeeze (compression phase). This is often a precursor to a breakout or breakdown. The script colors the histogram bars black during this phase, indicating a potential for a strong move. Once the squeeze is released, the bars are colored according to the direction of the SuperTrend, signaling a potential entry point.
5. **Integration and Signal Generation:**
- The script brings together the SuperTrend, RSI, Volume, and Squeeze Momentum to generate highly accurate buy and sell signals. A buy signal is triggered when the SuperTrend is bullish, the RSI indicates oversold conditions, and the volume filter confirms strong market participation. Similarly, a sell signal is generated when the SuperTrend is bearish, the RSI indicates overbought conditions, and the volume filter is met.
- The combination of these elements ensures that the signals are robust, reducing the likelihood of entering trades during weak or indecisive market conditions.
### Practical Applications: How to Use the MultiTrend Squeeze System 📅
1. **Day Trading:**
- For day traders, this indicator provides quick and reliable signals that can be used to enter and exit trades multiple times within a day. The volume filter ensures that you are trading during the most liquid times of the day, increasing the chances of successful trades. The Squeeze Momentum aspect helps you catch breakouts or breakdowns, which are common in intraday trading.
2. **Swing Trading:**
- Swing traders can use the MultiTrend Squeeze System to identify longer-term trends. By adjusting the ATR length and factor, you can make the SuperTrend more sensitive to catch longer-term moves. The RSI and Squeeze Momentum aspects help you time your entries and exits, ensuring that you get in early on a trend and exit before it reverses.
3. **Scalping:**
- For scalpers, the quick signals provided by this system, especially in combination with the volume filter, make it easier to take small profits repeatedly. The histogram bars give you a clear visual cue of the market's momentum, making it easier to scalp effectively.
4. **Position Trading:**
- Even position traders can benefit from this indicator by using it to confirm long-term trends. By adjusting the settings to less sensitive parameters, you can ensure that you are only entering trades when a strong trend is confirmed. The Squeeze Momentum indicator will help you stay in the trade during periods of consolidation, waiting for the next big move.
### Conclusion: Why the MultiTrend Squeeze System is a Game-Changer 🚀
The MultiTrend Squeeze System is not just another trading indicator; it’s a comprehensive trading strategy encapsulated within a single script. By combining the power
of SuperTrend, RSI, Volume Filtering, and Squeeze Momentum, this indicator provides a robust and versatile tool that can be adapted to various trading styles and market conditions.
**Why is it Unique?**
- **Multi-Dimensional Analysis:** Unlike many other indicators that rely on a single data point or calculation, this script incorporates multiple layers of analysis, ensuring that signals are based on a confluence of factors, which increases their reliability.
- **Customizability:** The vast range of input settings allows traders to tailor the indicator to their specific needs, whether they are trading forex, stocks, cryptocurrencies, or commodities.
- **Visual Clarity:** The color-coded bars, labels, and signals make it easy to interpret the market conditions at a glance, reducing the time needed to make trading decisions.
Whether you are a novice trader or an experienced market participant, the MultiTrend Squeeze System offers a powerful toolset to enhance your trading strategy, reduce risk, and maximize your potential returns. With its combination of trend analysis, momentum detection, and volume filtering, this indicator is designed to help you trade with confidence and precision in any market condition.

CARNAC Trading Support and Resistance LevelsOverview
The "Carnac Trading Support and Resistance Levels" indicator is a powerful tool designed to help traders identify key support and resistance levels across multiple timeframes. This tool enhances trading strategies by visually marking significant price levels and providing configurable stop-loss and alert features.
Features
Support and Resistance Levels: Automatically calculates and plots support and resistance levels for the following timeframes:
5 minutes (5M)
10 minutes (10M)
15 minutes (15M)
30 minutes (30M)
1 hour (1H)
2 hours (2H)
4 hours (4H)
6 hours (6H)
12 hours (12H)
1 day (1D)
1 week (1W)
1 month (1M)
Configurable Stop-Loss (SL) Levels: Adds a stop-loss line below each support level and above each resistance level with customizable padding (as a percentage).
Visual Labels: Clearly labels support, resistance, and stop-loss levels with the corresponding prices and timeframes for easy identification.
Line Customization:
Support Levels: Green lines with varying thickness based on the timeframe.
Resistance Levels: Red lines with varying thickness based on the timeframe.
Stop-Loss Levels: Gray dotted lines for clear distinction.
Alerts: Alerts trigger when the price gets to a configurable percentage from the support or resistance levels, helping you stay informed about potential buying and selling opportunities.
Visibility Toggling: Easily toggle the visibility of support and resistance levels for each timeframe (default enabled for 2H, 4H, and 1D).
How to Use
Add the Indicator:
Navigate to the TradingView Pine Editor.
Paste the provided Pine Script code and click "Add to Chart."
Configure Inputs:
Lookback Periods: Adjust the lookback periods for each timeframe to suit your analysis needs.
Padding Percentage: Set the padding percentage for the stop-loss levels to define the distance below the support levels and above the resistance levels.
Visibility: Toggle the visibility of the support and resistance levels for each timeframe as needed (default enabled for 2H, 4H, and 1D).
Alert Trigger Distance: Set the alert trigger distance as a percentage to determine when the alerts should be triggered.
Interpret the Plotted Levels:
Green Lines: Indicate support levels for the respective timeframes.
Red Lines: Indicate resistance levels for the respective timeframes.
Gray Dotted Lines: Represent the stop-loss levels below each support level and above each resistance level, with the specified padding.
Labels: Provide clear indications of the price levels and their respective timeframes in white text for visibility.
Identifying Buying and Selling Opportunities:
Buying Opportunities:
Look for the price to approach or bounce off a support level (green line).
Confirm the potential for a reversal by checking if the price is nearing a key support level from multiple timeframes.
Use the stop-loss level (gray dotted line) to set your stop-loss order below the support level to minimize risk.
Selling Opportunities:
Look for the price to approach or get rejected at a resistance level (red line).
Confirm the potential for a reversal by checking if the price is nearing a key resistance level from multiple timeframes.
Use the stop-loss level (gray dotted line) to set your stop-loss order above the resistance level to minimize risk.
Alerts:
Alerts will notify you when the price gets within the specified percentage distance from each support or resistance level.
Use these alerts to stay informed about potential buying and selling opportunities.

FOMO Alert (Miu)This indicator won't plot anything to the chart.
Please follow steps below to set your alarms based on price range variation:
1) Add indicator to the chart
2) Go to settings
3) Choose timeframe which will be used to calculate bars
4) Choose how many bars which will be used to calculate max and min range
5) Choose max and min range variation (%) to trigger alerts
5) Choose up to 6 different symbols to get alert notification
6) Once all is set go back to the chart and click on 3 dots to set alert in this indicator, rename your alert and confirm
7) You can remove indicator after alert is set and it'll keep working as expected
What does this indicator do?
This indicator will generate alerts based on following conditions:
- If min and max prices reach the range (%) from amount of bars on timeframe set for any symbol checked it will trigger an alert.
- If next set of bars reaches higher range than before it will trigger an alert with new data
- If next set of bars doesn't reach higher range than before it will not trigger alerts, even if they are above the range set (this is to prevent the alert to keep triggering with high frequency)
Once condition is met it will send an alert with the following information:
- Symbol name (e.g: BTC, ETH, LTC)
- Range achieved (e.g: 3,03%)
- Current symbol price and current bar direction (e.g: 63,477.1 ▲)
This script will request lowest and highest prices through request.security() built-in function from all different symbols within the range set. It also requests symbols' price (close) and amount of digits (mintick) for each symbol to send alerts with correct value.
This script was developed with main purpose to send alerts when there are strong price movements and I decided to share with community so anyone can set different parameters for different purposes.
Feel free to give feedbacks on comments section below.
Enjoy!

NUPL - Net Unrealized Profit-Loss BTC Tops/Bottoms [Logue]Net Unrealized Profit Loss (NUPL) - The NUPL measures the profit state of the bitcoin network to determine if past transfers of BTC are currently in an unrealized profit or loss state.
Values above zero indicate that the network is in overall profit, while values below zero indicate the network is in overall loss. Highly positive NUPL values indicate overvaluation of the BTC network and relatively negative NUPL values indicate an undervaluation of the BTC network.
For tops: The default setting for tops is based on decreasing "strength" of BTC tops. A decreasing linear function (trigger = slope * time + intercept) was fit to past cycle tops for this indicator and is used as the default to signal macro tops. The user can change the slope and intercept of the line by changing the slope and/or intercept factor. The user also has the option to indicate tops based on a horizontal line via a settings selection. This horizontal line default value is 73. This indicator is triggered for a top when the NUPL is above the trigger value.
For bottoms: Bottoms are displayed based on a horizontal line with a default setting of -13. The indicator is triggered for a bottom when the NUPL is below the bottom trigger value.

LMACD - Logarithmic MACD Weekly BTC Index [Logue]Logarithmic Moving Average Convergence Divergence (LMACD) Weekly Indicator - The LMACD is a momentum indicator that measures the strength of a trend using 12-period and 26-period moving averages. The weekly LMACD for this indicator is calculated by determining the difference between the log (base 10) of the 12-week and 26-week exponential moving averages. Larger positive numbers indicate a larger positive momentum.
For tops: The default setting for tops is based on decreasing "strength" of BTC tops. A decreasing linear function (trigger = slope * time + intercept) was fit to past cycle tops for this indicator and is used as the default to signal macro tops. The user can change the slope and intercept of the line by changing the slope and/or intercept factor. The user also has the option to indicate tops based on a horizontal line via a settings selection. This line default value is 0.125. This indicator is triggered for a top when the LMACD is above the trigger value.
For bottoms: Bottoms are displayed based on a horizontal line with a default setting of -0.07. The indicator is triggered for a bottom when the LMACD is below the bottom trigger value.

Multi-Timeframe Recursive Zigzag [Trendoscope®]🎲 Welcome to the Advanced World of Zigzag Analysis
Embark on a journey through the most comprehensive and feature-rich Zigzag implementation you’ll ever encounter. Our Multi-Timeframe Recursive Zigzag Indicator is not just another tool; it's a groundbreaking advancement in technical analysis.
🎯 Key Features
Multi Time-Frame Support - One of the rare open-source Zigzag indicators with robust multi-timeframe capabilities, this feature sets our tool apart, enabling a broader and more dynamic market analysis.
Innovative Recursive Zigzag Algorithm - At its core is our unique Recursive Zigzag Algorithm, a pioneering development that powers multiple Zigzag levels, offering an intricate view of market movements. This proprietary algorithm is the backbone of our advanced pattern recognition indicators.
Sub-Waves and Micro-Waves Analysis - Dive deeper into market trends with our Sub-Waves and Micro-Waves feature. Sub-Waves reveal the interconnectedness of various Zigzag levels, while Micro-Waves offer insight into the fundamental waves at the base level.
Enhanced Indicator Tracking - Integrate and track your custom indicators or oscillators with the zigzag, capturing their values at each Zigzag level, complete with retracement ratios. This offers a comprehensive view of market dynamics.
Curved Zigzag Visualization - Experience a new way of visualizing market movements with our Curved Zigzag Display, employing Pine Script’s polyline feature for a more intuitive and visually appealing representation.
Built-in Customizable Alerts - Stay ahead with built-in alerts that can be customized via user input settings.
🎯 Practical Applications
Our Zigzag Indicator is designed with an understanding of its inherent nature - the last unconfirmed pivot that consistently repaints. This characteristic, while by design, directs its usage more towards pattern recognition rather than direct identification of market tops and bottoms. Here's how you can leverage the Zigzag Indicator:
Harmonic Patterns - Ideal for those familiar with harmonic patterns, this tool simplifies the manual spotting of complex XABCD, ABC, and ABCD patterns on charts.
Chart Patterns - Effortlessly identify patterns like Double/Triple Taps, Head and Shoulders, Inverse Head and Shoulders, and Cup and Handle patterns with enhanced clarity. Navigate through challenging patterns such as Triangles, Wedges, Flags, and Price Channels, where the Zigzag Indicator adds a layer of precision to your breakout strategy.
Elliott Wave Components - The indicator's detailed pivot highlighting aids in identifying key Elliott Wave components, enhancing your wave analysis and decision-making process.
🎲 Deep Dive into Indicator Features
Join us as we explore the intricate features of our indicator in more detail.
🎯 Multi-Timeframe Capability
Our indicator comes equipped with an input option for selecting the desired resolution. This unique feature allows users to view higher timeframe Zigzag patterns directly on their lower timeframe charts.
🎯 Recursive Multi Level Zigzag
Our advanced recursive approach creates multi-level Zigzags from lower-level data. For instance, the level 0 Zigzag forms the base, calculated from specified length and depth parameters, while level 1 Zigzag is derived using level 0 as its foundation, and so forth.
The indicator not only displays multiple Zigzag levels but also offers settings to emphasize specific levels for more detailed analysis.
🎯 Sub-Components and Micro-Components of Zigzag Wave
Sub-components within a Zigzag wave consist of the previous level's Zigzag pivots. Meanwhile, the micro-components are composed of the base level (Level 0) Zigzag pivots encapsulated within the wave.
🎯 Curved Zigzag
Experience a new perspective with our curved Zigzag display. This innovative feature utilizes the polyline curved option to automatically generate sinusoidal waves based on multiple points.
🎯 Indicator Tracking
Default indicators such as RSI, MFI, and OBV are included, alongside the ability to track one external indicator at each Zigzag pivot.
🎯 Customizable Alerts
Our indicator employs the `alert()` function for alert creation. While this means the absence of a customization text box in the alert settings, we've included a custom text area for users to create their own alert templates.
Template placeholders include:
{alertType} - type of alert. Either Confirmed Pivot Update or Last Pivot Update. Depends on the alert type selected in the inputs.
When Last Pivot Update type is selected, the alerts are triggered whenever there is a new Zigzag Pivot. This may also be a repaint of last unconfirmed pivot.
When Confirmed Pivot Update type is selected, the alerts are triggered only when a pivot becomes a confirmed pivot.
{level} - Zigzag level on which the alert is triggered.
{pivot} - Details of the last pivot or confirmed pivot including price, ratio, indicator values and ratios, subcomponent and micro-component pivots.
🎲 User Settings Overview
🎯 Zigzag and Generic Settings
This involves some generic zigzag calculation settings such as length, depth, and timeframe. And few display options such as theme, Highlight Level and Curved Zigzag. By default, zigzag calculation is done based on the latest real time bar. An option is provided to disable this and use only confirmed bars for the calculation.
Indicator Settings
Allows users to track one or more oscillators or volume indicators. Option to add any indicator via external input is provided.
🎯 Alert Settings
Has input fields required to select and customize alerts.

A_Taders_Edge_LIBRARYLibrary "A_Taders_Edge_LIBRARY"
RCI(_rciLength, _close, _interval, _outerMostRangeOfOscillator)
- You will see me using this a lot. DEFINITELY my favorite oscillator to utilize for SO many different things from timing entries/exits to determining trends.
Parameters:
_rciLength (int)
_close (float)
_interval (int)
_outerMostRangeOfOscillator (int)
Returns: - Outputs a single RCI value that will between (-)_outerMostRangeOfOscillator to (+)_outerMostRangeOfOscillator
InvalidTID(_close, _showInvalidAssets, _securityTickerid, _invalidArray)
- This is to add a table on the right of your chart that prints all the TickerID's that were either not formulated correctly in the scripts input or that is not a valid symbol and should be changed.
Parameters:
_close (float)
_showInvalidAssets (simple bool)
_securityTickerid (string)
_invalidArray (string )
Returns: - Does NOT return a value but rather the table with the invalid TickerID's from the scripts input that need to be changed.
LabelLocation(_firstLocation)
- This is ONLY for when you are wanting to print ALERT LABELS with the assets name for when an alert trigger occurs for that asset. There are a total of 40 assets that can be used in each copy of the script. You don't want labels from different assets printing on top of each other because you will not be able to read the asset name that the label is for. Ex. If you put your _firstLocation in the input settings as 1 and have 40 assets on this copy of the scanner then the first asset in the list is assigned to the location value 1 on the scale, and the 2nd in the list is assigned to location value 2...and so on. If your first location is set to 81 then the 1st asset is 81 and 2nd is 82 and so on.
Parameters:
_firstLocation (simple int)
Returns: - regardless of if you have the maximum amount of assets being screened (40 max), this export function will output 40 locations… So there needs to be 40 variables assigned to the tuple in this export function. What I mean by that is there needs to be 40 variables between the ' '. If you only have 20 assets in your scripts input settings, then only the first 20 variables within the ' ' Will be assigned to a value location and the other 20 will be assigned 'NA'.
SeparateTickerids(_string)
- You must form this single tickerID input string exactly as laid out in the water (a little gray circle at the end of the setting, that you hover your cursor over to read the details of). IF the string is formed correctly then it will break up. All of the tip rate is within the string into a total of 40 separate strings which will be all of the tickerIDs that the script is using in your MO scanner.
Parameters:
_string (simple string)
Returns: - this will output, 40 different security assets within the tuple output (ie. 40 variable within the ' ') regardless of if you were including 40 assets, to be screened in the MO Screener or not. if you have less than 40 assets, then once the variables are assigned to all of the tickerIDs, the rest of the variables will be assigned "NA".
TickeridForLabelsAndSecurity(_includeExchange, _ticker)
- this export function is used to output 2 tickerID strings. One is formulated to properly work in the request.security() function while the other is how it will appear on the asset name labels depending on how you form your assets string in the MO scanners input settings. Review the tooltip next to the setting, to learn how to form the string so that the asset name labels will appear how you want in the labels at the end of the line plots & the alert labels that would be triggered if the MO Scanner is set up to include Alert Trigger Labels.
Parameters:
_includeExchange (simple bool)
_ticker (simple string)
Returns: - this export function is used to output 2 tickerID strings. One is formulated to properly work in the request.security() function while the other is how it will appear on the asset name labels depending on how you form your assets string in the MO scanners input settings. Review the tooltip next to the setting, to learn how to form the string so that the asset name labels will appear how you want in the labels at the end of the line plots & the alert labels that would be triggered if the MO Scanner is set up to include Alert Trigger Labels.
PercentChange(_startingValue, _endingValue)
- this is a quick export function to calculate how much % change has occurred between the _startingValue and the _endingValue that you input into the export function.
Parameters:
_startingValue (float)
_endingValue (float)
Returns: - it will output a single percentage value between 0-100 with trailing numbers behind a decimal. If you want, only a certain amount of numbers behind the decimal, this export function needs to be put within a formatting function to do so. Explained in the MO Scanner INTRO VIDEO.
PrintedBarCount(_time, _barCntLength, _bcPmin)
- This export function will outfit the percentage of printed bars (that occurred within _barCntLength amount of time) out of the MAX amount of bars that potentially COULD HAVE been printed. Iexplanation in the MO Scanner INTRO VIDEO.
Parameters:
_time (int)
_barCntLength (int)
_bcPmin (int)
Returns: - Gives 2 outputs. The first is the total % of Printed Bars within the user set time period and second is true/false according to if the Printed BarCount % is above the _bcPmin threshold that you input into this export function.

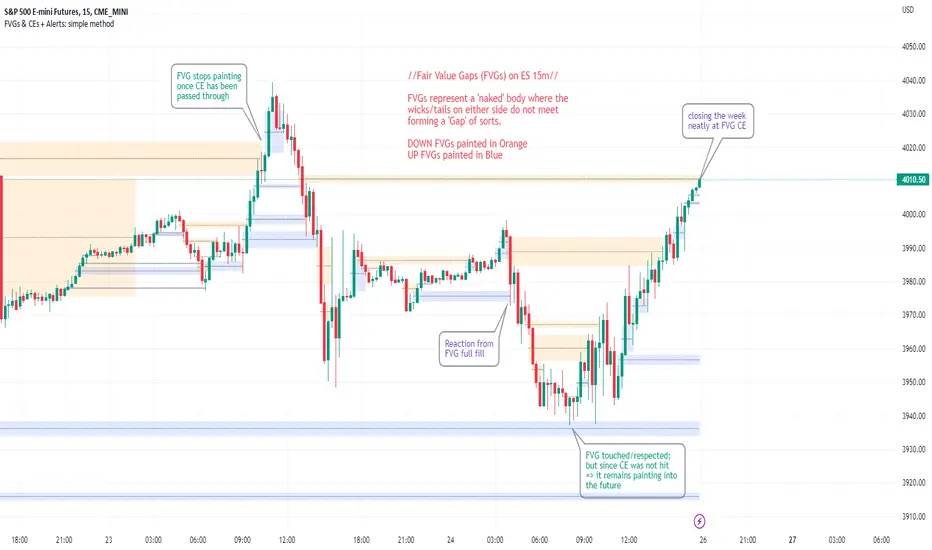
FVGs & CEs + Alerts: simple & efficient methodFair Value Gap indicator: Paints FVGs and their midlines (CEs). Stops painting when CE is hit, or when fully filled; user choice of threshold. This threshold is also used in the Alert conditions.
~~Plotted here on ES1! (CME), on the 15m timeframe~~
-A FVG represents a 'naked' body where the wicks/tails on either side do not meet. This can be seen as a type of 'gap', which price will have a tendency to want to re-fill (in part or in full).
-The midline (CE, or 'Consequent encroachment') of FVGs also tend to show price sensitivity.
-This indicator paints all FVGs until priced into, and should give an idea of which are more meaningful and which are best ignored (based on context: location, Time of day, market structure, etc).
-This is a simpler and more efficient method of painting Fair value gaps which auto-stop painting when price reaches them.
//Aims of Publishing:
-Education of ICT concepts of Fair Value Gaps and their midlines (CEs): To easily see via forward testing or backtesting, the sensitivity that price shows to these areas & levels.
-Demonstration of a much more efficient way of plotting FVGs which terminate at price, thanks to a modification of @Bjorgums's clever looping method referenced below.
//Settings:
-Toggle on/off upward and downward FVGs independently(blue and orange by default).
-Toggle on/off midline (CE).
-Standard color/line formatting options.
-Choose Threshold: CE of FVG or Full Fill of FVG: This will determine both the 'stop-painting' trigger and the 'Alert' trigger.
-Choose number of days lookback to control how many historical FVGs paint on chart.
//On alerts:
-Simple choice of 2 alerts:
~~One for price crossing into/above the nearest untouched 'premium' FVG above ( orange ). Trigger is user choice of CE or full fill.
~~Another for price crossing into/below the nearest untouched 'discount' FVG below (blue). Trigger is user choice of CE or full fill.
-Alerts set via the three dots in indicator status line.
//Cautionary notes:
-Do not use the alerts blindly to find trades. Wait until you have identified a good FVG above/below which you think price may show sensitivity to
-Usage on very low timeframes can cause unexpected results with alerts: due to new FVGs forming in realtime the Alert will always trigger at the most recent FVG above/ below having its threshold hit.
-Big thank you to @Bjorgum for his fantastic extendAndRemove method. Modified here for use with boxes and to integrate Alerts.
-Also Credit to ICT (inner circle trader) for the concepts used here: Fair value gaps and their Consequent Encroachment (CE).
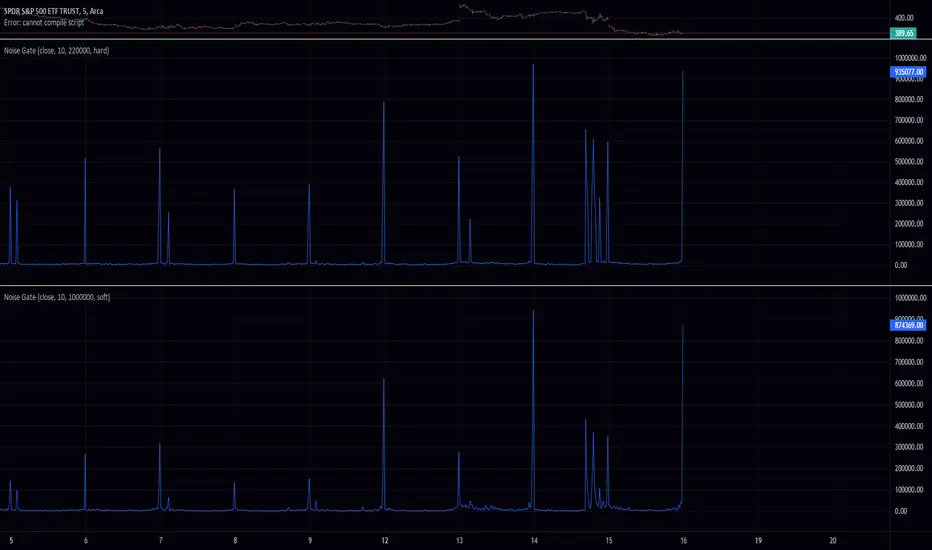
Noise GateThis Pine Script code defines an indicator called "Noise Gate" which filters out "noise" from a given signal. The indicator takes four input parameters: source, length, ratio, and level. The source parameter specifies the source data for the indicator (e.g., close prices), the length parameter specifies the length of a moving average, the ratio parameter specifies the attenuation ratio, and the level parameter specifies the threshold for attenuating the signal.
The core of the indicator is the noise_gate function, which takes three input parameters: signal, ratio, and level. The signal parameter represents the input signal that needs to be filtered. The ratio parameter specifies the amount by which the signal will be attenuated (reduced in amplitude) if it falls below the level parameter. The level parameter is a threshold that determines whether the signal will be attenuated or not.
The noise_gate function first calculates the absolute value of the signal using the math.abs() function. This is done because the filtering only applies to the magnitude of the signal, not its sign (positive or negative value).
The function then checks if the absolute value of the signal is above the level threshold using an if statement. If it is, the signal is returned as is. If the absolute value of the signal is below the level threshold, the function calculates a value called soft_knee_ratio using the formula 1 - (level - abs_signal) / level. This value represents the amount by which the signal will be attenuated. The signal is then reduced in amplitude by this soft_knee_ratio and the resulting value is returned as the output of the function.
The noise_gate function applies the transformation symmetrically to both positive and negative values of the signal parameter. This is because the transformation only depends on the absolute value of the signal, not its sign. The transformation first calculates the absolute value of the signal using the math.abs() function and then applies the filtering based on the magnitude of the signal. The sign of the signal is not taken into account in this process. As a result, the transformation is applied symmetrically to both positive and negative values of the signal.
The noise_gate function can be a valuable tool for anyone looking to filter out noise or unwanted variations from a signal. It is flexible and easy to use, and can be applied to a wide range of situations where signal noise reduction is needed. For example, it can be used to smooth out financial time series data or to remove background noise from an audio recording.
The noise_gate function in this code has been modified to include an additional input parameter called knee_type, which allows the user to specify whether to use a hard knee or a soft knee. A hard knee means that the compressor triggers simply at the threshold, whereas a soft knee means that the compressor triggers smoothly, gradually increasing the attenuation as the signal falls further below the threshold.
To use a hard knee, the user can set the knee_type parameter to "hard". To use a soft knee, the user can set the knee_type parameter to "soft". The default value for the knee_type parameter is "soft", so if the user does not specify a value for knee_type, the noise_gate function will use a soft knee by default.
The noise_gate function includes a check for the value of the knee_type parameter and applies the appropriate knee type. If the knee_type parameter is set to "hard", the function applies a hard knee by simply triggering at the threshold and dividing the input by the ratio if the signal falls below the threshold. If the knee_type parameter is set to "soft" (or if it is not specified and the default value is used), the function applies a soft knee by gradually increasing the attenuation of the signal as it falls further below the threshold.
The noise_gate function can be a valuable tool for anyone looking to filter out noise or unwanted variations from a signal. It is flexible and easy to use, and can be applied to a wide range of situations where signal noise reduction is needed. For example, it can be used to smooth out financial time series data or to remove background noise from an audio recording.
Zindarra Multi Alerts Pro (9 Levels) by RRBZindarra Multi Alerts Pro by RRB by RagingRocketBull 2018
Version 1.0
This indicator lets you configure multiple alert levels for an asset. Zindarra Multi Alerts Pro supports 9 custom alert levels.
You have to manually create an alert in Manage Alerts Panel and configure it to use with this indicator.
Free accounts are limited to only 1 alert slot and this indicator will take it (any existing alerts must be disabled/stopped).
Once the alert is configured, the indicator can be removed from chart to free a slot for another indicator, but you won't see the alert levels.
If you want 10 alert levels and don't need colors and Pro features - use Multi Alerts Simple version instead.
Features:
- 9 custom alert levels with labels
- 2 plot modes: plot and price line
- high/low or close level penetration modes
- show/hide levels/labels
- change color based on level position above/below price
- keep or auto disable triggered alerts
- trigger alerts only after a confirmed close
- swap level colors
Usage:
1. attach indicator to a chart
2. define alert levels in UI settings
3. in TradingView's Manage Alerts panel on the right:
- for free accounts: disable/stop all existing alerts, you are limited to 1 alert slot only. Otherwise you won't be able to save.
- create a new Alert:
- select 'Multi Alerts' indicator name in the Condition dropdown box, leave Level 1 and Multi Alerts Cross as default options
- select 'Once Per Bar' or 'Once Per Minute' instead of 'Only Once' to trigger the alert multiple times
5. click Save. Your 9 alerts are enabled now.
Change Settings:
1. change levels/settings in UI. Any changes will also reset already triggered level colors/visibility.
2. in Manage Alerts panel:
- open/edit the alert you created
- select new instance of 'Multi Alerts' indicator name in the Condition dropdown box (appears at the bottom)
- check the Condition dropdown again - a single instance should remain selected.
3. click Save. Your alert settings are updated.
Notes on using alerts:
- attaching this indicator to a chart and configuring alert levels will not automatically enable the alerts - you have to manually create/configure a new alert in the Alerts Panel
- removing this indicator from chart will not disable the alerts, you have to manually disable the alert you created in the Alerts Panel
- your alert in the Alerts Panel uses another instance (copy) of indicator/settings. Any changes won't affect the alert. You have to manually update the alert every time you change any settings in the indicator.
- recompiling and attaching your own version of indicator will require creating a new Alert (delete the old one).
- alerts are designed to work in realtime. In replay mode you will see triggered alert levels hiding/changing colors but there will be no system alert messages. It's best to test the indicator in realtime on M1 (1 min) chart
- you will only see 1 system alert per bar/60 sec when multiple alert levels are crossed with a single bar. However all of these levels will hide/change color in the indicator as expected.
- plot modes: price line - changes color of the whole level, style is not configurable; plot - changes color of a level's segment after each cross, configurable style
- you can only see the alert levels when the indicator is attached to chart, they are not shown by the system alert.
- For source=high/low a directional level penetration is used automatically (crossunder/low and crossover/high). For source=close a standard bidirectional cross is used. Colors always change above/below close.
1. uses plot*, cross*, alertcondition

NG [Wave Period Oscillator]The WPO is a short-term oscillator that measures the buying and selling period of price cycles over a certain time interval.
The leading oscillator indicates a rise in buying period when it moves above the zero line and a rise in selling period when it moves below the zero line.
Trading Tactics
Center line Crossover: a bullish center line crossover occurs when the WPO line moves above the zero level to turn positive.
A bearish center line crossover occurs when the WPO line moves below the zero level to turn negative.
When bulls are in control, the price rally begins and the average of the bull’s period T increases to drive the WPO line above the center line.
A buy signal is subsequently triggered.
When the bulls start to loose power, prices move sideways and the average period decreases. In this case, the WPO line may fl utter near the center line and cause false signals, whipsaws.
To avoid the whipsaws occurring on the center line, the following trading tactics are proposed:
Uptrend Tactic:
During an ideal uptrend, the WPO does not reach the lower boundary -2 and usually rebounds from a higher level than -2.
This means that the bulls have taken control earlier. Hence, a zero line crossover generates a buy signal. The WPO crosses the upper boundary at +2 then pulls back again below +2 to generate a sell signal.
Sideways Tactic:
During sideways, the WPO fluctuates between the lower and upper boundaries -2 and 2. This tactic is also used in an uptrend where corrections are strong enough to drive the WPO line below the lower boundary.
Downtrend Tactic:
During downtrends, the WPO fails to reach the upper boundary and oscillates between the 0 and -2 levels. The bears enter early indicating an obvious weakness in the market. Therefore, crossing the zero level generates a sell signal.
Exit at Weakness:
During uptrend reversals and downtrends, the WPO oscillates between the center line and the lower boundary -2. The bears are controlling the market and move in wide cycle periods while the bull’s strength is almost absent.
An exit signal is triggered once the WPO crosses -2. When prices decline, the WPO may cross its extreme lower boundary at -2.7. Therefore, a swift exit signal is triggered once the WPO crosses -2.
Re-Entry:
During uptrend, the WPO crosses down the upper boundary level at +2 to generate a sell signal. Yet, it does not reach the zero line and the oscillator moves back toward the upper boundary.
This case is considered as strength while a re-entry signal occurs at the +2 level crossover. The sell signal is generated when the WPO line crosses down the upper boundary.

XPloRR MA-Buy ATR-Trailing-Stop Long Term Strategy Beating B&HXPloRR MA-Buy ATR-MA-Trailing-Stop Strategy
Long term MA Trailing Stop strategy to beat Buy&Hold strategy
None of the strategies that I tested can beat the long term Buy&Hold strategy. That's the reason why I wrote this strategy.
Purpose: beat Buy&Hold strategy with around 10 trades. 100% capitalize sold trade into new trade.
My buy strategy is triggered by the EMA(blue) crossing over the SMA curve(orange).
My sell strategy is triggered by another EMA(lime) of the close value crossing the trailing stop(green) value.
The trailing stop value(green) is set to a multiple of the ATR(15) value.
ATR(15) is the SMA(15) value of the difference between high and low values.
Every stock has it's own "DNA", so first thing to do is find the right parameters to get the best strategy values voor EMA, SMA and Trailing Stop.
Then keep using these parameter for future buy/sell signals only for that particular stock.
Do the same for other stocks.
Here are the parameters:
Exponential MA: buy trigger when crossing over the SMA value (use values between 11-50)
Simple MA: buy trigger when EMA crosses over the SMA value (use values between 20 and 200)
Stop EMA: sell trigger when Stop EMA of close value crosses under the trailing stop value (use values between 8 and 16)
Trailing Stop #ATR: defines the trailing stop value as a multiple of the ATR(15) value
Example parameters for different stocks (Start capital: 1000, Order=100% of equity, Period 1/1/2005 to now):
BAR(Barco): EMA=11, SMA=82, StopEMA=12, Stop#ATR=9
Buy&HoldProfit: 45.82%, NetProfit: 294.7%, #Trades:8, %Profit:62.5%, ProfitFactor: 12.539
AAPL(Apple): EMA=12, SMA=45, StopEMA=12, Stop#ATR=6
Buy&HoldProfit: 2925.86%, NetProfit: 4035.92%, #Trades:10, %Profit:60%, ProfitFactor: 6.36
BEKB(Bekaert): EMA=12, SMA=42, StopEMA=12, Stop#ATR=7
Buy&HoldProfit: 81.11%, NetProfit: 521.37%, #Trades:10, %Profit:60%, ProfitFactor: 2.617
SOLB(Solvay): EMA=12, SMA=63, StopEMA=11, Stop#ATR=8
Buy&HoldProfit: 43.61%, NetProfit: 151.4%, #Trades:8, %Profit:75%, ProfitFactor: 3.794
PHIA(Philips): EMA=11, SMA=80, StopEMA=8, Stop#ATR=10
Buy&HoldProfit: 56.79%, NetProfit: 198.46%, #Trades:6, %Profit:83.33%, ProfitFactor: 23.07
I am very curious to see the parameters for your stocks and please make suggestions to improve this strategy.

Gunbot MACDgenOk this is just some strat based on MACD, checking for a few conditions until giving buy/sell signals to Gunbot via alerts.
It is generalized but if you want to go play with the values. I will continue to develop this further and am happy to receive feedback.
Notations are coming.
Usage notes:
-ONLY use this with TV_GAIN: 0.6 because on downtrends it is supposed to double up to pull down the average bought price!
-Use "buying condition" and "selling condition" for alerts, trigger on close and I suggest you use 3 min intervals but try what looks good to you
-Use this on pairs that are curvy and have atleast 0.6% gain between buy/sell triggers. This is also general advise when you want to take microprofits.
-Don't be confused with sell arrows, it will only trigger the bot sell on gain when you've set TV_GAIN

Options Scalper v2 - SPY/QQQHere's a comprehensive description of the Options Scalper v2 strategy:
---
## Options Scalper v2 - SPY/QQQ
### Overview
A multi-indicator confluence-based scalping strategy designed for trading SPY and QQQ options on short timeframes (1-5 minute charts). The strategy uses a scoring system to generate high-probability CALL and PUT signals by requiring alignment across multiple technical indicators before triggering entries.
---
### Core Logic
The strategy operates on a **scoring system (0-9 points)** where both bullish (CALL) and bearish (PUT) conditions are evaluated independently. A signal only fires when:
1. A recent EMA crossover occurred (within the last 3 bars)
2. The direction's score meets the minimum threshold (default: 4 points)
3. The signal's score is higher than the opposite direction
4. Enough bars have passed since the last signal (cooldown period)
5. Price action occurs during valid trading sessions
---
### Indicators Used
| Indicator | Purpose | CALL Condition | PUT Condition |
|-----------|---------|----------------|---------------|
| **9/21 EMA Cross** | Primary trigger | Fast EMA crosses above slow | Fast EMA crosses below slow |
| **200 EMA** | Trend filter | Price above 200 EMA | Price below 200 EMA |
| **RSI (14)** | Momentum filter | RSI between 45-65 | RSI between 35-55 |
| **VWAP** | Institutional level | Price above VWAP | Price below VWAP |
| **MACD (12,26,9)** | Momentum confirmation | MACD line > Signal line | MACD line < Signal line |
| **Stochastic (14,3)** | Overbought/Oversold | Oversold or K > D | Overbought or K < D |
| **Volume** | Participation confirmation | Spike on green candle | Spike on red candle |
| **Price Structure** | Breakout detection | Higher high formed | Lower low formed |
---
### Scoring Breakdown
**CALL Score (Max 9 points):**
- Recent EMA cross up: +2 pts
- EMA alignment (fast > slow): +1 pt
- RSI in bullish range: +1 pt
- Above VWAP: +1 pt
- MACD bullish: +1 pt
- Volume spike on green candle: +1 pt
- Stochastic setup: +1 pt
- Above 200 EMA: +1 pt
- Breaking higher high: +1 pt
**PUT Score (Max 9 points):**
- Recent EMA cross down: +2 pts
- EMA alignment (fast < slow): +1 pt
- RSI in bearish range: +1 pt
- Below VWAP: +1 pt
- MACD bearish: +1 pt
- Volume spike on red candle: +1 pt
- Stochastic setup: +1 pt
- Below 200 EMA: +1 pt
- Breaking lower low: +1 pt
---
### Risk Management
The strategy uses **ATR-based dynamic stops and targets**:
| Parameter | Default | Description |
|-----------|---------|-------------|
| Stop Loss | 1.5x ATR | Distance below entry for longs, above for shorts |
| Take Profit | 2.0x ATR | Creates a 1:1.33 risk-reward ratio |
Positions are also closed on:
- Opposite direction signal (flip trade)
- Take profit or stop loss hit
---
### Session Filtering
Trades are restricted to high-liquidity periods by default:
- **Morning Session:** 9:30 AM - 11:00 AM EST
- **Afternoon Session:** 2:30 PM - 3:55 PM EST
This avoids choppy midday price action and captures the highest volume periods.
---
### Input Parameters
| Parameter | Default | Description |
|-----------|---------|-------------|
| Fast EMA | 9 | Fast moving average period |
| Slow EMA | 21 | Slow moving average period |
| Trend EMA | 200 | Long-term trend filter |
| RSI Length | 14 | RSI calculation period |
| RSI Overbought | 65 | Upper RSI threshold |
| RSI Oversold | 35 | Lower RSI threshold |
| Volume Multiplier | 1.2x | Volume spike detection threshold |
| Min Signal Strength | 4 | Minimum score required to trigger |
| Crossover Lookback | 3 | Bars to consider crossover "recent" |
| Min Bars Between Signals | 5 | Cooldown period between signals |
---
### Visual Elements
**Chart Plots:**
- Green line: 9 EMA (fast)
- Red line: 21 EMA (slow)
- Gray line: 200 EMA (trend)
- Purple dots: VWAP
**Signal Markers:**
- Green triangle up + "CALL" label: Buy call signal
- Red triangle down + "PUT" label: Buy put signal
- Small circles: EMA crossover reference points
**Info Table (Top Right):**
- Real-time CALL and PUT scores
- RSI, MACD, Stochastic values
- VWAP and 200 EMA position
- Recent crossover status
- Current signal state
---
### Alerts
| Alert Name | Trigger |
|------------|---------|
| CALL Entry | Standard call signal fires |
| PUT Entry | Standard put signal fires |
| Strong CALL | Call signal with score ≥ 6 |
| Strong PUT | Put signal with score ≥ 6 |
---
### Recommended Usage
| Setting | 0DTE Scalping | Intraday Swings |
|---------|---------------|-----------------|
| Timeframe | 1-2 min | 5 min |
| Min Signal Strength | 5-6 | 4 |
| ATR Stop Mult | 1.0 | 1.5 |
| ATR TP Mult | 1.5 | 2.0 |
| Option Delta | 0.40-0.50 | 0.30-0.40 |
---
### Key Improvements Over v1
1. **Requires actual crossover** - Eliminates false signals from simple trend continuation
2. **Balanced scoring** - Both directions evaluated equally, highest score wins
3. **Signal cooldown** - Prevents overtrading with minimum bar spacing
4. **Multi-indicator confluence** - 8 factors must align for signal generation
5. **Volume-candle alignment** - Volume spikes only count when matching candle direction
---
### Disclaimer
This strategy is for educational purposes. Backtest thoroughly before live trading. Options trading involves significant risk of loss. Past performance does not guarantee future results.
