Trend Change DetectorThe trend change detector oscillator is a tool designed to help traders identify the current trend direction paired with the potential reversal zones.
The oscillator is made of multiple parts:
- The colored histogram, that displays the current long-term trend direction (long if above 0, short if below)
- The trend line, which shows the price in relation to the fair value of the current trend
- The reversal zones, which are the area that alarms the traders that the price might reverse soon after having touched them
The indicator can work with three different inputs. In the Source panel, you can choose between "Price", "Price and Volume" and "Ponderated Volume". The price input uses only the price, the price and volume use the average between the price and the ponderated volume, and the ponderated volume shows the indicator working with volume data, with formulas such as the On Balance Volume and the Accumulation-Distribution line.
This indicator can be used both for trend following technique, using the cross of the trend line with the 0-line as signals in conjunction with the bias given by the histogram, and for mean reversal technique thanks to the reversal zones that allow traders to identify potential tops and bottoms.
Cari skrip untuk "trend"

[tradinghook] - Renko Trend Reversal Strategy V2Title: Renko Trend Reversal Strategy
Short Title: - Renko TRS
> Special thanks to for manually calculating `renkoClose` and `renkoOpen` values in order to remove the infamous repaint issue
Description:
The Renko Trend Reversal Strategy ( - Renko TRS) is a powerful and original trading approach designed to identify trend reversals in financial markets using Renko charts. Renko charts differ from traditional time-based charts, as they focus solely on price movements and ignore time, resulting in a clearer representation of market trends. This strategy leverages Renko charts in conjunction with the Average True Range (ATR) to capture trend reversals with high precision and effectiveness.
Key Concepts:
Renko Charts: Renko charts are unique chart types that only plot price movements beyond a predefined brick size, ignoring time and noise. By doing so, they provide a more straightforward depiction of market trends, eliminating insignificant price fluctuations and making it easier to spot trend reversals.
Average True Range (ATR): The strategy utilizes the ATR indicator, which measures market volatility and provides valuable insights into potential price movements. By setting the brick size of the Renko chart based on the ATR, the strategy adapts to changing market conditions, ensuring optimal performance across various instruments and timeframes.
How it Works:
The Renko Trend Reversal Strategy is designed to identify trend reversal points and generate buy or sell signals based on the following principles:
Renko Brick Generation: The strategy calculates the ATR over a user-defined period (ATR Length) and utilizes this value to determine the size of Renko bricks. Larger ATR values result in bigger bricks, capturing higher market volatility, while smaller ATR values create smaller bricks for calmer market conditions.
Buy and Sell Signals: The strategy generates buy signals when the Renko chart's open price crosses below the close price, indicating a potential bullish trend reversal. Conversely, sell signals are generated when the open price crosses above the close price, suggesting a bearish trend reversal. These signals help traders identify potential entry points to capitalize on market movements.
Stop Loss and Take Profit Management: To manage risk and protect profits, the strategy incorporates dynamic stop-loss and take-profit levels. The stop-loss level is calculated as a percentage of the Renko open price, ensuring a fixed risk amount for each trade. Similarly, the take-profit level is set as a percentage of the Renko open price to secure potential gains.
How to Use:
Inputs: Before using the strategy, traders can customize several parameters to suit their trading preferences. These inputs include the ATR Length, Stop Loss Percentage, Take Profit Percentage, Start Date, and End Date. Adjusting these settings allows users to optimize the strategy for different market conditions and risk tolerances.
Chart Setup: Apply the - Renko TRS script to your desired financial instrument and timeframe on TradingView. The Renko chart will dynamically adjust its brick size based on the ATR Length parameter.
Buy and Sell Signals: The strategy will generate green "Buy" labels below bullish reversal points and red "Sell" labels above bearish reversal points on the Renko chart. These labels indicate potential entry points for long and short trades, respectively.
Risk Management: The strategy automatically calculates stop-loss and take-profit levels based on the user-defined percentages. Traders can ensure proper risk management by using these levels to protect their capital and secure profits.
Backtesting and Optimization: Before implementing the strategy live, traders are encouraged to backtest it on historical data to assess its performance across various market conditions. Adjust the input parameters through optimization to find the most suitable settings for specific instruments and timeframes.
Conclusion:
The - Renko Trend Reversal Strategy is a unique and versatile tool for traders looking to identify trend reversals with greater accuracy. By combining Renko charts and the Average True Range (ATR) indicator, this strategy adapts to market dynamics and provides clear entry and exit signals. Traders can harness the power of Renko charts while effectively managing risk through stop-loss and take-profit levels. Before using the strategy in live trading, backtesting and optimization will help traders fine-tune the parameters for optimal performance. Start exploring trend reversals with the - Renko TRS and take your trading to the next level.
(Note: This description is for illustrative purposes only and does not constitute financial advice. Traders are advised to thoroughly test the strategy and exercise sound risk management practices when trading in real markets.)

Trend Analyser by Abdul KhaderThis indicator is designed to provide buy and sell signals based on a combination of technical analysis methods. It uses the Relative Strength Index (RSI), Moving Average Convergence Divergence (MACD), and Exponential Moving Averages (EMA) to generate signals. It also calculates Stop Loss (SL) and Take Profit (TP) levels based on the Average True Range (ATR).
Components:
RSI: An oscillator that measures the speed and change of price movements. RSI is used to identify overbought and oversold conditions. In this indicator, an RSI below 30 is considered oversold and an RSI above 70 is considered overbought.
MACD: A trend-following momentum indicator that shows the relationship between two moving averages of a security’s price. The MACD triggers technical signals when it crosses above (to buy) or below (to sell) its signal line.
EMA: These moving averages give more weight to recent prices and are used to identify short-term price trends. A crossover of a shorter period EMA (9 periods in this case) above a longer period EMA (21 periods in this case) generates a buy signal. Conversely, a crossover of the shorter EMA below the longer EMA generates a sell signal.
ATR: This is a market volatility indicator. The ATR is used to calculate Stop Loss and Take Profit levels. These levels are set at a distance from the entry price, equal to a certain multiplier (1.5 in this case) of the ATR.
How to Use:
Buy Signal: A green triangle below the price bar indicates a buy signal. This is generated when the following conditions are met:
The short-term EMA crosses above the long-term EMA
The RSI is below 30 (oversold condition)
The MACD line crosses above the signal line and is above zero
Sell Signal: A red triangle above the price bar indicates a sell signal. This is generated when the following conditions are met:
The short-term EMA crosses below the long-term EMA
The RSI is above 70 (overbought condition)
The MACD line crosses below the signal line and is below zero
Stop Loss and Take Profit: These levels are indicated by dashed lines. The stop loss for a long position is set below the entry price, while the take profit is set above. For a short position, the stop loss is set above the entry price and the take profit is set below.
Important Notes:
This indicator is designed for intraday trading and may not be suitable for longer-term trades.
Always use this indicator in conjunction with other aspects of technical and fundamental analysis. No indicator can provide accurate signals 100% of the time.
Always backtest this indicator with historical data before using it in live trading.
Risk management is crucial in trading. Never risk more than a small percentage of your trading capital on a single trade.
Trend FollowingMoving Average Period:** This is the period of the moving average that will be used to identify the trend. A good starting point is 10 days.
* **Candlestick Patterns:** The candlestick patterns that will be used to identify potential reversals in the trend. Some of the most common candlestick patterns include the bullish engulfing pattern, the bearish engulfing pattern, the hammer pattern, and the inverted hammer pattern.
* **Support and Resistance Levels:** The support and resistance levels that will be used to manage risk. These levels can be identified using a variety of technical indicators, such as the moving average, the Bollinger bands, and the Fibonacci retracement levels.
Here is how the strategy will work:
1. The moving average will be used to identify the trend. When the price is above the moving average, it is considered to be in an uptrend. When the price is below the moving average, it is considered to be in a downtrend.
2. Candlestick patterns will be used to identify potential reversals in the trend. If a bullish candlestick pattern appears in an uptrend, it could be a sign that the trend is about to continue. If a bearish candlestick pattern appears in a downtrend, it could be a sign that the trend is about to reverse.

Trend Channels With Liquidity Breaks [ChartPrime]Trend Channels
This simple trading indicator is designed to quickly identify and visualize support and resistance channels in any market. The primary purpose of the Trend Channels with Liquidity Breaks indicator is to recognize and visualize the dominant trend in a more intuitive and user-friendly manner.
Main Features
Automatically identifies and plots channels based on pivot highs and lows
Option to extend the channel lines
Display breaks of the channels where liquidity is deemed high
Inclusion of volume data within the channel bands (optional)
Market-friendly and customizable colors and settings for easy visual identification
Settings
Length: Adjust the length and lookback of the channels
Show Last Channel: Only shows the last channel
Volume BG: Shade the zones according to the volume detected
How to Interpret
Trend Channels with Liquidity Breaks indicator uses a combination of pivot highs and pivot lows to create support and resistance zones, helping traders to identify potential breakouts, reversals or continuations of a trend.
These support and resistance zones are visualized as upper and lower channel lines, with a dashed center line representing the midpoint of the channel. The indicator also allows you to see the volume data within the channel bands if you choose to enable this functionality. High volume zones can potentially signal strong buying or selling pressure, which may lead to potential breakouts or trend confirmations.
To make the channels more market-friendly and visually appealing, Trend Channels indicator also offers customizable colors for upper and lower lines, as well as the possibility to extend the line lengths for further analysis.
The indicator displays breaks of key levels in the market with higher volume.

Prevailing Trend IndicatorOVERVIEW
The Prevailing Trend indicator is a technical indicator that gauges whether the price is currently trending up or down. The purpose of this indicator is to call and/or filter with-trend signals.
CONCEPTS
This indicator assists traders in identifying high-probability trend entries. The upper line (blue line on the indicator) is calculated by taking the average range (high-low) of all bullish candles. The lower line (red line on the indicator) is calculated by taking the average range of all bearish candles. When these two lines intersect and cross each other, a buy and sell signal is generated. For example, if the blue line crosses over the red line, this indicates that the average size of all bullish bars are larger than the average size of all bearish bars. This is a good sign that an uptrend might occur. Vice versa for downtrends.
HOW DO I READ THIS INDICATOR
As an entry indicator:
When the blue line crosses over the red line, go long.
When the red line crosses over the blue line, go short.
As a signal filter:
If the blue line is above the red line, only take long trades.
If the red line is above the blue line, only take short trades.

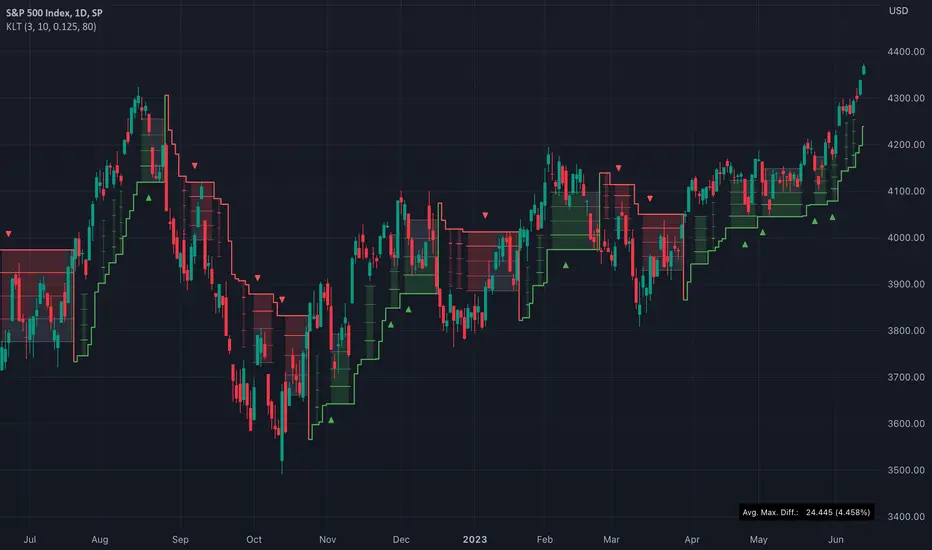
TASC 2023.07 Keeping With The Larger Trend█ OVERVIEW
TASC's July 2023 edition of Traders' Tips features an article by Barbara Star titled "Stay On Track With The Supertrend Indicator". The article explores how the supertrend indicator , whether used as a standalone tool or in conjunction with other indicators, can assist traders in aligning with the larger trend. Drawing inspiration from the article, this script enhances the supertrend indicator with additional visual and analytical features, making it easier to analyze the readings and make informed trading decisions.
█ CONCEPTS
Over the past few years, the supertrend indicator has gained significant popularity among traders. Unlike moving averages, it incorporates both price and volatility information, enabling traders to navigate upward or downward trends despite occasional price disruptions.
When using the supertrend indicator, a trader may consider entering a long position when the price surpasses the supertrend line or retraces to it after the initial crossover. Similarly, for short positions, a trader could enter when the price drops below the supertrend line or retests it. Exiting these positions can be triggered by the opposite scenario, such as a price drop below the supertrend line for long positions or a price rise above the supertrend line for short positions. To assist in monitoring the distance between the price and the indicator line, this script introduces the following display features:
Breach levels, representing fractions of the most recent maximum distance.
On-chart signals indicating crossings of the highest and lowest breach levels.
An infobox displaying the average value of the maximum distance.
█ CALCULATIONS
For calculating the supertrend line, this script uses the built-in function ta.supertrend() . Additionally, the script showcases the use of state-of-the-art PineScript® functionality, including methods and tables .
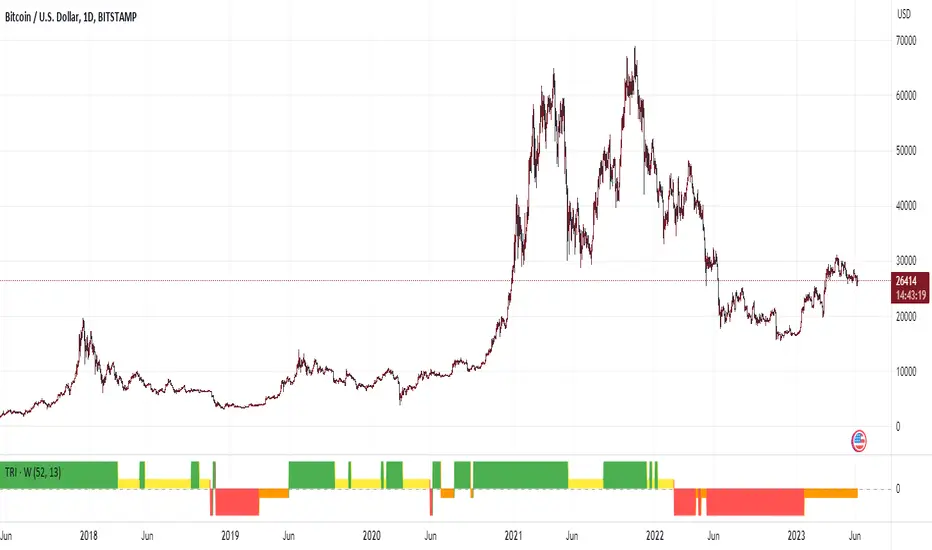
Trend Reversal Indicator (Bull/Bear)Simple indicator utilising time series momentum to identify secular/cyclical trends in asset classes. Default setting is weekly timeframe - yearly/quarterly. The indicator helps define when in bull/bear market, and corrections/rebounds within larger trends.
Trend Angle Candle ColorIntroduction:
As a trader, understanding the trend of the market is crucial for making informed decisions. One way to gain insight into the market trend is by using technical indicators, which are mathematical calculations that provide traders with valuable information about price action. In this post, we will explore a unique indicator called the "Trend Angle Candle Color" that not only identifies the trend but also visualizes it using color-coded candlesticks. We'll dive into the script, discuss its key components, and explain how you can benefit from using it in your trading strategy.
Script Overview:
The Trend Angle Candle Color Indicator is written in the Pine Script language for the TradingView platform. The indicator utilizes a combination of Exponential Moving Average (EMA), Average True Range (ATR), and Epanechnikov Kernel function to calculate the trend angle, which is then represented by color-coded candlesticks. The script offers several customizable inputs, such as the length of the lookback period, the scale (sensitivity), and the smoothing factor.
Key Components of the Script:
Inputs:
Length: Determines the lookback period for calculating the trend.
Scale: Adjusts the sensitivity of the indicator.
Smoothing: Controls the degree of smoothing applied to the angle calculation.
Smoothing Factor: Adjusts the weight of the Epanechnikov Kernel function.
Functions:
grad(src): A function that takes an input value and returns a corresponding color from a predefined gradient.
ema(source): An Exponential Moving Average function that smoothens the price data.
atan2(y, x) and degrees(float source): Functions that convert the slope into an angle in radians and then into degrees.
epanechnikov_kernel(_src, _size, _h, _r): A function that applies the Epanechnikov Kernel smoothing method to the angle data.
Calculations:
ATR: Calculates the Average True Range using the EMA function.
Slope: Determines the slope of the price change over the specified lookback period.
Angle_rad: Converts the slope into an angle in radians.
Degrees: Applies the Epanechnikov Kernel smoothing function to the angle data and scales it to a range between 0 to 100.
Visualization:
Colour: Assigns a color to each candlestick based on the calculated degree value using the grad() function.
Barcolor(colour) and plotcandle(): Functions that display the color-coded candlesticks on the chart.
Benefits of Using the Trend Angle Candle Color Indicator:
Easy Visualization: The color-coded candlesticks provide a simple and intuitive way to understand the market trend direction and strength at a glance.
Customizable Parameters: The customizable inputs allow traders to fine-tune the indicator to their preferred settings, suiting their trading style and strategy.
Versatility: The Trend Angle Candle Color Indicator can be used across various timeframes and financial instruments, making it a valuable addition to any trader's toolkit.
Conclusion:
The Trend Angle Candle Color Indicator is a powerful tool that can enhance your trading strategy by providing a visual representation of the market trend. The unique combination of EMA, ATR, and Epanechnikov Kernel smoothing helps create a more accurate and easy-to-understand trend angle calculation. By incorporating this indicator into your trading analysis, you can gain better insight into market dynamics and make more informed trading decisions.

Angle-based Trend IndicatorI couldn't find this anywhere else, at least not in the simple way I wanted it.
1. choose a source
2. choose a look-back period
3. choose an angle
The indicator will show you the degree of the trend of the look-back period, and color the line according to bearish or bullish. Also, this is my first script, please be kind.

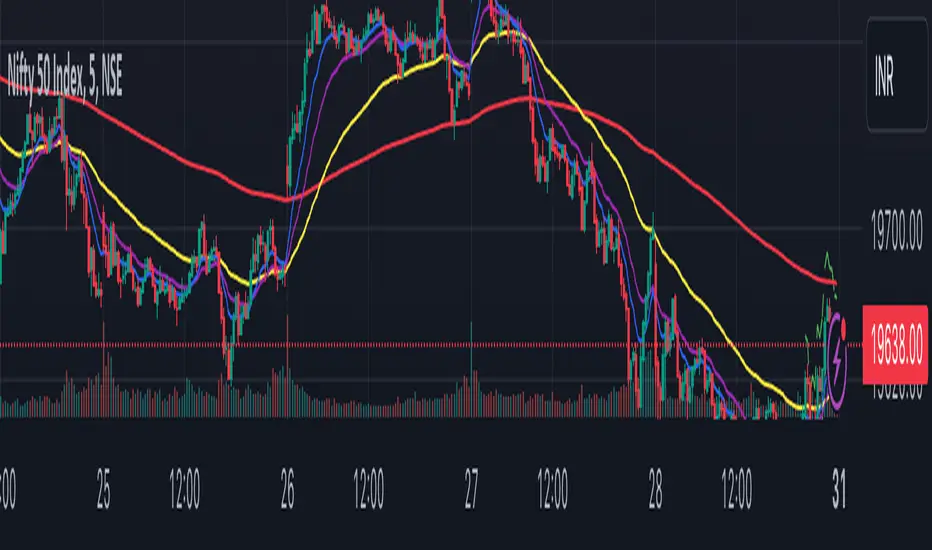
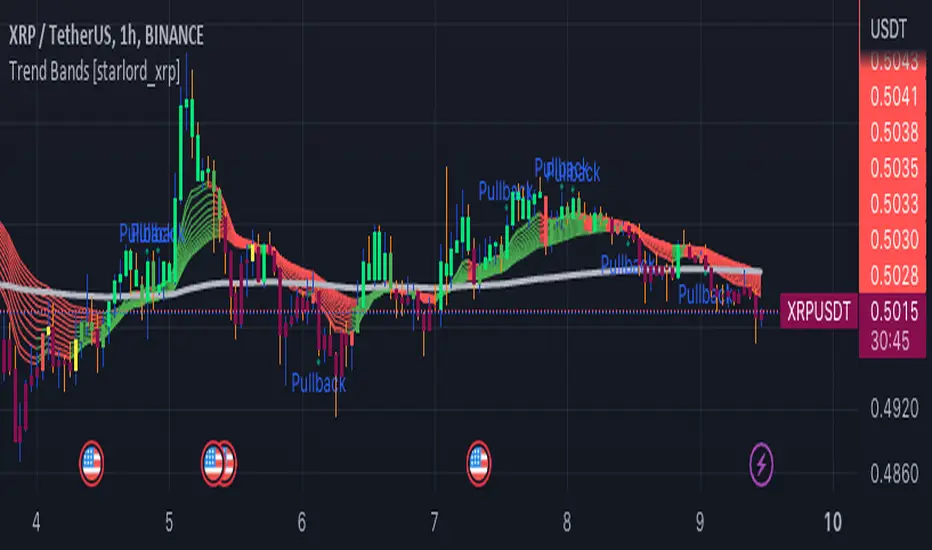
Trend Bands [starlord_xrp]This indicator uses multiple trendlines to determine the overall trend and trend changes. It also highlights areas of potential pullbacks to entry.
Trend IndicatorThis indicator has different features:
1. Ichimoku = this indicator can plot Ichimoku calculated both in the common formula and with the volume average, you can choose the calculator method for each line.
2. Channel and Bands = this mode allows the user to choose from channel and band, "channel" shows the Keltner channel, and "band" shows the Bollinger bands. Both the indicators are calculated including the volume in the formula of the average midpoint.
3. Color candle = this function allows the user to see two different colors of candles on the chart, the positive color occurs when both the long-term average and the short team average of price calculated using the volume is above the two averages calculated without the volume. This function is great to analyze the volume pressure, useful to identify trend continuation and exhaustion.
4. Extreme reversal zones = this is a version of the Keltner channels calculated over a high number of candles and with high deviation, to identify the potential zones of reversal.
Note that in the "Ichimoku" indicator, the backline is the T.R.A.M.A. indicator, created and published open source by Lux Algo, which I thank for the script.

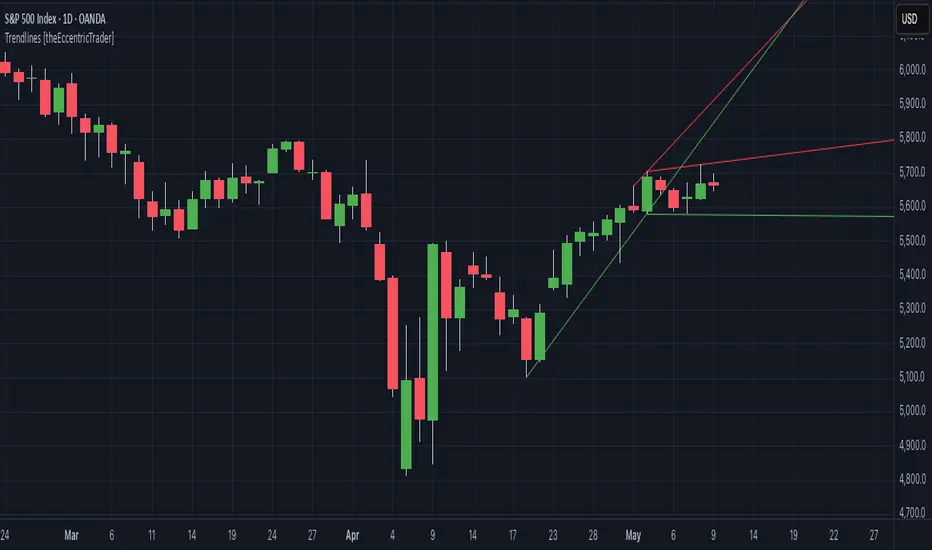
Trendlines HTF [theEccentricTrader]█ OVERVIEW
This indicator automatically draws dynamic higher timeframe support and resistance lines from preceding peak to current peak and from preceding trough to current trough. In the example above I have applied the indicator three times; one for the 1D trendlines (red), one for the 4H trendlines (orange) and one for the 2H trendlines (green).
█ CONCEPTS
Green and Red Candles
• A green candle is one that closes with a high price equal to or above the price it opened.
• A red candle is one that closes with a low price that is lower than the price it opened.
Swing Highs and Swing Lows
• A swing high is a green candle or series of consecutive green candles followed by a single red candle to complete the swing and form the peak.
• A swing low is a red candle or series of consecutive red candles followed by a single green candle to complete the swing and form the trough.
Peak and Trough Prices (Basic)
• The peak price of a complete swing high is the high price of either the red candle that completes the swing high or the high price of the preceding green candle, depending on which is higher.
• The trough price of a complete swing low is the low price of either the green candle that completes the swing low or the low price of the preceding red candle, depending on which is lower.
Historic Peaks and Troughs
The current, or most recent, peak and trough occurrences are referred to as occurrence zero. Previous peak and trough occurrences are referred to as historic and ordered numerically from right to left, with the most recent historic peak and trough occurrences being occurrence one.
Support and Resistance
• Support refers to a price level where the demand for an asset is strong enough to prevent the price from falling further.
• Resistance refers to a price level where the supply of an asset is strong enough to prevent the price from rising further.
Support and resistance levels are important because they can help traders identify where the price of an asset might pause or reverse its direction, offering potential entry and exit points. For example, a trader might look to buy an asset when it approaches a support level, with the expectation that the price will bounce back up. Alternatively, a trader might look to sell an asset when it approaches a resistance level, with the expectation that the price will drop back down.
It's important to note that support and resistance levels are not always relevant, and the price of an asset can also break through these levels and continue moving in the same direction.
Trendlines
Trendlines are straight lines that are drawn between two or more points on a price chart. These lines are used as dynamic support and resistance levels for making strategic decisions and predictions about future price movements. For example traders will look for price movements along, and reactions to, trendlines in the form of rejections or breakouts/downs.
█ FEATURES
Inputs
• HTF Resolution
• Resistance Line Color
• Support Line Color
█ LIMITATIONS
All green and red candle calculations are based on differences between open and close prices, as such I have made no attempt to account for green candles that gap lower and close below the close price of the preceding candle, or red candles that gap higher and close above the close price of the preceding candle. This may cause some unexpected behaviour on some markets and timeframes. I can only recommend using 24-hour markets, if and where possible, as there are far fewer gaps and, generally, more data to work with.
Similarly, if the current timeframe is not a factor of the higher timeframe there will be occasions when the left hand offset is out by a couple of bars. This is because the calculations are ultimately based on how many lower timeframe bars there are inside a sequence of higher timeframe bars. The lines will also behave unexpectedly if the higher timeframe resolution is lower than the current timeframe, but that should be expected.
If the lines do not draw or you see a study error saying that the script references too many candles in history, this is most likely because the higher timeframe anchor point is not present on the current timeframe. This problem usually occurs when referencing a higher timeframe, such as the 1-month, from a much lower timeframe, such as the 1-minute. How far you can lookback for higher timeframe anchor points on the current timeframe will also be limited by your Trading View subscription plan. Premium users get 20,000 candles worth of data, pro+ and pro users get 10,000, and basic users get 5,000.

Trendlines [theEccentricTrader]█ OVERVIEW
This indicator automatically draws dynamic support and resistance lines from preceding peak to current peak and from preceding trough to current trough.
█ CONCEPTS
Green and Red Candles
• A green candle is one that closes with a high price equal to or above the price it opened.
• A red candle is one that closes with a low price that is lower than the price it opened.
Swing Highs and Swing Lows
• A swing high is a green candle or series of consecutive green candles followed by a single red candle to complete the swing and form the peak.
• A swing low is a red candle or series of consecutive red candles followed by a single green candle to complete the swing and form the trough.
Peak and Trough Prices (Basic)
• The peak price of a complete swing high is the high price of either the red candle that completes the swing high or the high price of the preceding green candle, depending on which is higher.
• The trough price of a complete swing low is the low price of either the green candle that completes the swing low or the low price of the preceding red candle, depending on which is lower.
Historic Peaks and Troughs
The current, or most recent, peak and trough occurrences are referred to as occurrence zero. Previous peak and trough occurrences are referred to as historic and ordered numerically from right to left, with the most recent historic peak and trough occurrences being occurrence one.
Support and Resistance
• Support refers to a price level where the demand for an asset is strong enough to prevent the price from falling further.
• Resistance refers to a price level where the supply of an asset is strong enough to prevent the price from rising further.
Support and resistance levels are important because they can help traders identify where the price of an asset might pause or reverse its direction, offering potential entry and exit points. For example, a trader might look to buy an asset when it approaches a support level, with the expectation that the price will bounce back up. Alternatively, a trader might look to sell an asset when it approaches a resistance level, with the expectation that the price will drop back down.
It's important to note that support and resistance levels are not always relevant, and the price of an asset can also break through these levels and continue moving in the same direction.
Trendlines
Trendlines are straight lines that are drawn between two or more points on a price chart. These lines are used as dynamic support and resistance levels for making strategic decisions and predictions about future price movements. For example traders will look for price movements along, and reactions to, trendlines in the form of rejections or breakouts/downs.
█ FEATURES
Inputs
• Resistance Line Color
• Support Line Color
█ LIMITATIONS
All green and red candle calculations are based on differences between open and close prices, as such I have made no attempt to account for green candles that gap lower and close below the close price of the preceding candle, or red candles that gap higher and close above the close price of the preceding candle. This may cause some unexpected behaviour on some markets and timeframes. I can only recommend using 24-hour markets, if and where possible, as there are far fewer gaps and, generally, more data to work with.
Extended Price Volume Trend Strategy : EducationalThe Extended Price Volume Trend (EPVT) is a technical indicator that is used to identify potential trend changes and measure the strength of a trend. In this strategy, we combine the EPVT with other indicators to create a trading system that aims to capture trend reversals and momentum shifts.
The EPVT indicator is calculated by taking the cumulative volume and multiplying it by the percentage change in price. We then find the highest and lowest values of this indicator over a certain period of time to determine the baseline. The difference between the EPVT and the baseline is then plotted on a chart to create the EPVT line.
To use this indicator for trading, we look for crossovers of the EPVT line with zero. When the EPVT crosses above zero, it indicates that buying pressure is increasing, and we may consider taking a long position. Conversely, when the EPVT crosses below zero, it indicates that selling pressure is increasing, and we may consider taking a short position.
To further refine our trading signals, we use three take-profit levels, which we set as a percentage of the current EPVT value. We also use a simple moving average to provide additional confirmation of trend changes.
In summary, the EPVT trading strategy is a technical analysis-based approach to trading that aims to identify potential trend reversals and momentum shifts. By combining the EPVT indicator with other technical tools, we can create a comprehensive trading system that provides clear entry and exit signals for both long and short positions. Please note that this strategy is for educational purposes only and should not be taken as financial advice.

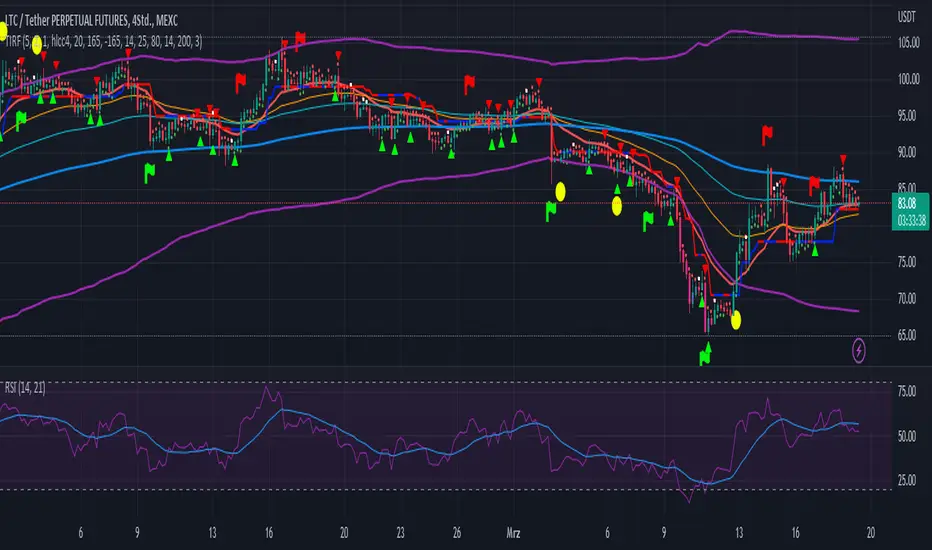
Trend Indicator with RSI and Fibbonacci Band 0.702 crossingsToday we have a new Indicator set, which I created using inspiration from the Trend Magic Indicator from KivancOzbilgic and adding several new aspects to it and a slightly modified calculation of the trend indicator itself.
You can change the inputs by changing the pre set values in the settings, but I found the current settings quite accurate. Feel free to experiment to fine tune the indicators.
Here are the details of the script:
Trend indicated within candles and as a line
- bullish and bearish trends are now also indicated within the candle based on the CCI calculation.
- Bullish is indicated by a green circle below the candle or as one may call it a "dot"
- bearish trend is indicated by a red circle above the candle
Entry Signal based on RSI crossing its EMA
- my motivation was to have a clearer entry signal besides highlighting a trend, which can not really be used to identify a good entry but to give confidence or when loosing trend to give an exit signal.
- after studiying the RSI and how it works together with its EMA it looks quite interesting as an entry or exit signal. But be cautios if the EMA and RSI values are moving in a narrow area we get a lot of crosses and therefore signals which should rather be ignored rather to be act on. So the the range where the cross happens is also quite important. But this aspect is not yet reflected as a rule/ logic.
But I am thinking of adding something.. or alternativly best to switch to another timeframe to get some better data
RSI overbought and oversold as Diamonds
- I also added key indications of oversold or overbought as Blue and Pink diamonds, can be considered as additional information to maybe identify a short term top or bottom.. but its not very accurate.
Entry signal based on crossing Fibbonachi Band 0.702
- So far the 0.702 seems to be quite an interesting retracement level which seems to be met a lot of times
- based on the assumption the price will evantually hit the 0.702 either direction I wanted to get a signal when this happens
- BUT! a big but, unfortunalty the Fibbonachi bands tend to bloat up in case of high volatility so it is not easy to find the crossing on higher timeframes
Here are the standard value which I found quite accurate for the assets I use this indicator set:
CCI Period = 5
ATR Multiplier = 1
ATR Period = 1
Source = High Low Close (hlc3 average value of the candle
Here the inputs used for the RSI Crossing signal (here you should play around a little to see which entry would have been best..)
RSI Length = 14
RSI Oversold = 25 (to be used for the "golden" entry signal based on the FBB crossing)
RSI Overbought = 80 (to be used for the "golden" entry signal based on the FBB crossing)
RSI Moving Average Length
In future versions I will add options to activate or deactive some of the plotting and espacially this golden dot when the fibbonachi band is being crossed needs some fine tuning..
And lets see if there is a way to fix the bloating of those bands..
Momentum Trend Fusion (MTF)The Momentum Trend Fusion (MTF) is a composite indicator that combines the Awesome Oscillator and the Relative Strength Index to provide a unique perspective on market momentum and trend strength. The MTF is calculated by first running the Relative Strength Index (RSI) on the Awesome Oscillator (AO) and then applying an Exponential Moving Average (EMA) on the RSI value. The MTF is designed to help traders detect market phases and confirm trend direction by analyzing the cross of the EMA and RSI, as well as divergences between the AO and price. The MTF can be customized by the user by providing the lengths of the RSI and EMA calculations, making it an ideal tool for traders with different time frames and risk tolerances.

[@btc_charlie] Trader XO Macro Trend ScannerWhat is this script?
This script has two main functions focusing on EMAs (Exponential Moving Average) and Stochastic RSI.
EMAs
EMAs are typically used to give a view of bullish / bearish momentum. When the shorter EMA (calculated off more recent price action) crosses, or is above, the slower moving EMA (calculated off a longer period of price action), it suggests that the market is in an uptrend. This can be an indication to either go long on said asset, or that it is more preferable to take long setups over short setups. Invalidation on long setups is usually found via price action (e.g. previous lows) or simply waiting for an EMA cross in the opposite direction (i.e. shorter EMA crosses under longer term EMA).
This is not a perfect system for trade entry or exit, but it does give a good indication of market trends. The settings for the EMAs can be changed based on user inputs, and by default the candles are coloured based on the crosses to make it more visual. The default settings are based on “Trader XO’s” settings who is an exceptional swing trader.
RSI
Stochastic RSI is a separate indicator that has been added to this script. RSI measures Relative Strength (RSI = Relative Strength Index). When RSI is <20 it is considered oversold, and when >80 it is overbought. These conditions suggests that momentum is very strong in the direction of the trend.
If there is a divergence between the price (e.g. price is creating higher highs, and stoch RSI is creating lower highs) it suggests the strength of the trend is weakening. Whilst this script does not highlight divergences, what it does highlight is when the shorter term RSI (K) crosses over D (the average of last 3 periods). This can give an indication that the trend is losing strength.
Combination
The EMAs indicate when trend shifts (bullish or bearish).
The RSI indicates when the trend is losing momentum.
The combination of the two can be used to suggest when to prefer a directional bias, and subsequently shift in anticipation of a trend reversal.
Note that no signal is 100% accurate and an interpretation of market conditions and price action will need to be overlayed to
Why is it different to others?
I have not found other scripts that are available in this way visually including alerts when Stoch RSI crosses over/under the extremes; or the mid points.
Whilst these indicators are default, the combination of them and how they are presented is not and makes use of the TradingView colouring functionalities.
What are the features?
Customise the variables (averages) used in the script.
Display as one EMA or two EMAs (the crossing ones).
Alerts on EMA crosses.
Alerts on Stoch RSI crosses - slow/fast, upper, lower areas.
- Currently set on the chart to show alerts when Stoch RSI is above 80, then falls below 80 (and colours it red).
Customisable colours.
What are the best conditions for this?
It is designed for high timeframe charts and analysis in crypto, since crypto tends to trend.
It can however be used for lower timeframes.
Disclaimer/Notes:
I have noticed several videos appearing suggesting that this is a "100% win rate indicator" .
NO indicator has 100% win rate.
An indicator is an *indicator* that is all.
Please use responsibly and let me know if there are any mods or updates you would like to see.

Trend/Retracement - ZigZag - New wayZigZag for Trend and Retracements - New way
It's another way to plot ZigZag based on lookback period for trend and % of trend lookback period to plot retracements.
█ OVERVIEW
Plot ZigZag, Trend lines, Retracements, Support levels, Resistance levels
█ Objective:
Draw ZigZag lines along with unbroken support and resistance levels. ZigZag lines are drawn for main trend and the retracements.
Main Trend – This is calculated based on lookback period.
Retracements – Retracements are calculated as 25% of main trend.
Support and Resistance line: The indicator draws 2 types of support and resistance lines
1. Un-broken – Once formed (plotted), these are the support and resistance which are not yet broken
2. Tested – One can also choose to see support and resistance lines which are tested but not broken. Tested support/resistance are those levels which are touched by high/low price but close price has not crossed the level.
█ How main trend point is calculated:
E.g.
Chart timeframe = 15m
Lookback period = 250
Retracement = 25% of main trend ( 25% of 250 = 62 )
A price point on a chart is considered as trend point if distance between current price and previous highest price is 250 candles
A price point is considered as a retracement if distance between current price and previous highest price is 62 candles. Please note retracements are calculated only after finding a main trend point.
█ Input parameters:
Zigzag Parameters
Use predefined Lookback – If checked pre-defined timeframe-based lookback parameters are used.
Trend lookback candles – If ‘Use predefined Lookback’ is unchecked then this value is used as lookback period.
Retracement % of look back candles– If ‘Use predefined Lookback’ is unchecked then this value is used for calculating retracement lookback period
Mark retracements – If unchecked only main trend lines are plotted
Plot support/resistance – To plot support/resistance levels
Show support/resistance tested lines – If checked tested support/resistance liens are shown on the chart
█ TF based Lookback period config (Defaults are set as specified below, One can change these defaults to use different lookback periods)
The defaults set here are used based on the chart timeframe. e.g. if chart timeframe is changed from say 15m to 60m then 60m chart defaults (i.e. trend lookback = 90) are used to plot the trend and the retracements. At the bottom-right of the chart, parameters used for plotting are displayed all the time.
Timeframe in minute – Default = 5m
Trend lookback candles – Default = 375 (~ 5 days of data)
Timeframe in minute – Default = 15m
Trend lookback candles – Default = 250 (~10 days of data)
Timeframe in minute – Default = 60m
Trend lookback candles = Default = 90 (~ 15 days of data)
Trend lookback candles for timeframe 'D' – Default = 30 (~1 month data)
Trend lookback candles for timeframe 'W' – Default = 21 (~6 months data)
Trend lookback candles for timeframe 'M' – Default = 12 (~1year data)
Retracement % of look back candles – Default = 25%
█ When and where one can use this indicator (Refer to chart examples)
To view support and resistance based on lookback period
To view ZigZag lines
One can use it to find chart patterns easily
Trend and retracement lines can help in drawing Elliott waves.
█ Chart examples:
1. Chart patterns can be easily identified - One can disable the candle charts which will help to identify and draw chart patterns easily
2. Trend and retracement lines can also help is analyzing charts (e.g. Elliott Waves can be marked based on trend lines)
3. Tested but not broken support and resistance lines can be viewed
4. You can select 'NOT' to plot tested support and resistance lines
5. Uncheck the Mark retracements to plot main trend lines (Retracements are not marked)

Trend SuggestionsThis brings together a number of variables to produce trend predictions that could be utilized as decision-making tools.
Uses the aforementioned price and volume derivatives
- A moving average and three weighted moving averages (WMA1, WMA2, WMA3)
- Super Trend Line (ST)
- Opening Range Breakout on Five Minutes, Resistance Bands Pocket pivots, support, and price volume
he Direction is determined by the High and Low Bands of WMAs and the Supertrend Line, which are used to determine the Upper and Lower Lines around the Price. When the price passes below the lower boundary of the band, a downtrend is said to have begun.
Similarly, for an uptrend, this continues until the price passes over the upper edge of the band. Teal for an uptrend and fuchsia for a downturn area shared by the band to identify the trend.
The first five minutes of the breakout lines have a tiny buffer augmentation of 11% applied to them.
Based on what has been observed, support and resistance zones have been somewhat changed from the figures that are often utilized (might work other markets as well)
The markings that may be seen are as follows:
- Blue Triangle indicates a pocket pivot with an upward bias;
- Maroon Triangle indicates a pocket pivot with a downward bias;
- Teal colored Diamonds indicate price upthrusts and potential trend confirmation locations, depending on success or failure.
- Similar backdrop color changes that look as vertical shading are also used to identify them.
- Fuchsia-colored diamonds indicate price declines and a potential trend, depending on whether it persists or fails.
- Dark green and maroon square boxes indicate potential price reversals in the support and resistance bands, respectively.
It goes without saying that this work is derived from numerous other open-source community initiatives.
Feel free to adjust anything you'd like, and we appreciate any feedback.

Coral Trend Pullback Strategy (TradeIQ)Description:
Strategy is taken from the TradeIQ YouTube video called "I Finally Found 80% Win Rate Trading Strategy For Crypto".
Check out the full video for further details/clarification on strategy entry/exit conditions.
The default settings are exactly as TradeIQ described in his video.
However I found some better results by some tweaking settings, increasing R:R ratio and by turning off confirmation indicators.
This would suggest that perhaps the current confirmation indicators are not the best options. I'm happy to try add some other optional confirmation indicators if they look to be more effective.
Recommended timeframe: 1H
Strategy incorporates the following features:
Risk management:
Configurable X% loss per stop loss
Configurable R:R ratio
Trade entry:
Based on strategy conditions below
Trade exit:
Based on strategy conditions below
Backtesting:
Configurable backtesting range by date
Trade drawings:
Each entry condition indicator can be turned on and off
TP/SL boxes drawn for all trades. Can be turned on and off
Trade exit information labels. Can be turned on and off
NOTE: Trade drawings will only be applicable when using overlay strategies
Alerting:
Alerts on LONG and SHORT trade entries
Debugging:
Includes section with useful debugging techniques
Strategy conditions
Trade entry:
LONG
C1: Coral Trend is bullish
C2: At least 1 candle where low is above Coral Trend since last cross above Coral Trend
C3: Pullback happens and price closes below Coral Trend
C4: Coral Trend colour remains bullish for duration of pullback
C5: After valid pullback, price then closes above Coral Trend
C6: Optional confirmation indicators (choose either C6.1 or C6.2 or NONE):
C6.1: ADX and DI (Single indicator)
C6.1.1: Green line is above red line
C6.1.2: Blue line > 20
C6.1.3: Blue trending up over last 1 candle
C6.2: Absolute Strengeh Histogram + HawkEye Volume Indicator (Two indicators combined)
C6.2.1: Absolute Strengeh Histogram colour is blue
C6.2.2: HawkEye Volume Indicator colour is green
SHORT
C1: Coral Trend is bearish
C2: At least 1 candle where high is below Coral Trend since last cross below Coral Trend
C3: Pullback happens and price closes above Coral Trend
C4: Coral Trend colour remains bearish for duration of pullback
C5: After valid pullback, price then closes below Coral Trend
C6: Optional confirmation indicators (choose either C6.1 or C6.2 or NONE):
C6.1: ADX and DI (Single indicator)
C6.1.1: Red line is above green line
C6.1.2: Blue line > 20
C6.1.3: Blue trending up over last 1 candle
C6.2: Absolute Strengeh Histogram + HawkEye Volume Indicator (Two indicators combined)
C6.2.1: Absolute Strengeh Histogram colour is red
C6.2.2: HawkEye Volume Indicator colour is red
NOTE: All the optional confirmation indicators cannot be overlayed with Coral Trend so feel free to add each separately to the chart for visual purposes
Trade exit:
Stop Loss: Calculated by recent swing low over previous X candles (configurable with "Local High/Low Lookback")
Take Profit: Calculated from R:R multiplier * Stop Loss size
Credits
Strategy origin: TradeIQ's YouTube video called "I Finally Found 80% Win Rate Trading Strategy For Crypto"
It combines the following indicators for trade entry conditions:
Coral Trend Indicator by @LazyBear (Main indicator)
Absolute Strength Histogram | jh by @jiehonglim (Optional confirmation indicator)
Indicator: HawkEye Volume Indicator by @LazyBear (Optional confirmation indicator)
ADX and DI by @BeikabuOyaji (Optional confirmation indicator)

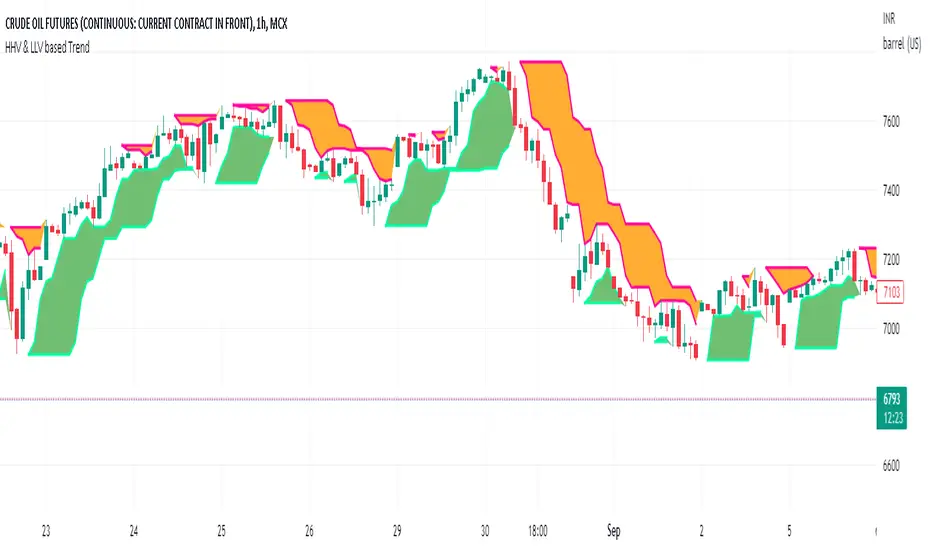
HHV & LLV based TrendHHV and LLV gives good information about the trend.
A trend will be visible when its seen with fast and slow line cross
UP trend: HHV_fastline = HHV Slowline and LLVfastline crossover LLVSlowline
DOWN trend: HHV_fastline crossunder HHV Slowline and LLVfastline !=LLVSlowline
Attempted to plot the same with multiple options to choose fastline length, slowline length, Multi time frame.
tvbot Trend Following with Mean Reversion algoDefault settings are for the ETHUSDT 5 min Binance Chart regular candles.
Back test Default settings are 10,000 usd to start, Commission 0.075%, capital deployment per position is 10%, slippage value of 1.
This algo uses the EMA to set the trend line . You are also able to turn the trend line into a range instead of just a static line. The algo uses the VWMA to set the base entry parameters. When a candle closes above or below the VWMA it will record that price and then wait for the VWMA to meet the candle close price. When that happens the Base entry condition is met. (it causes the vwma to create a hook like structure. essentially tell you that the momentum has changed directions.)
The algo will always check to see if the trend line has either breached or has been tested and held. If this condition has been met it will then go to the base entry condition to check to see if the momentum has changed.
There is a mean reversion component in this algo as well. When the price has moved away from the mean(set by user) by a certain amount the algo will start to look for a top or bottom. Once that condition has been met it will then use the base entry condition to look for a change in momentum, but the mean reversion base entry condition uses the HMA to check for a change in momentum.
This algo effectively looks like a hamburger. Mean reversion being the tops and bottoms(bun) and the trend following(beef patty)
