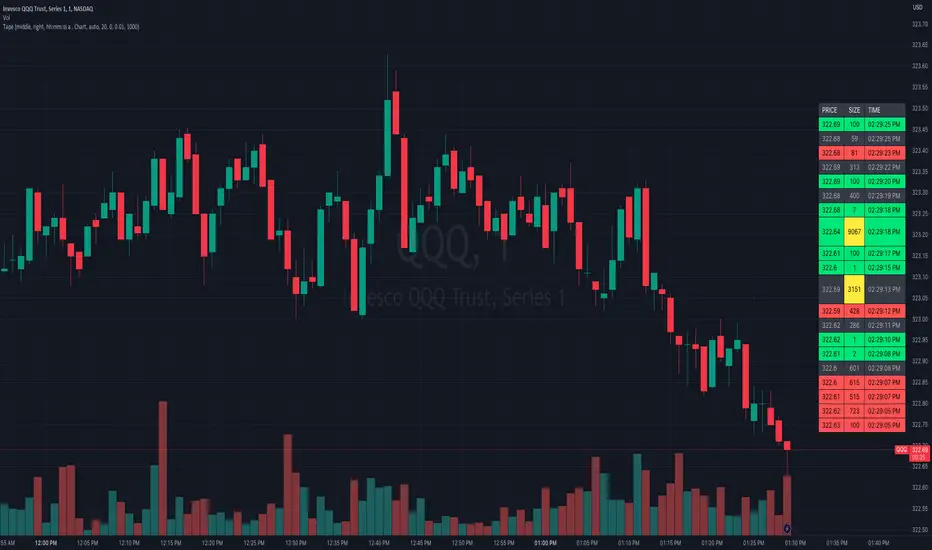
Tape (Time and Sales)OVERVIEW
This indicator is a synthesized "Tape" (aka. Time and Sales) from real time market data. It's specifically designed to be performant, expediting trading insights and decisions.
The table contains color-coded price action, volume size, and a timestamp data for each chart update. Because chart updates are independent of exchange orders, 1 chart update may combine more than 1 exchange and/or order. Even so, you're able to see very small and fast order flow changes, made possible by measuring real time volume differentials, and correlating them with price action.
Real time volume differentials are required for this indicator to be most useful. This is not ideal for historical analysis or TradingViews Replay feature.
INPUTS
You can can configure:
Table Position and Text Size
The Timestamp (visibility, format, timezone)
The number of lines to print
Volume Parameters (minimum size, large sizes, decimal precision)
Highlighting and Enlarging large sized prints
All the colors
DEV NOTES
This script illustrates:
The complimentary nature of loops and arrays
A method for iterative table management
Cari skrip untuk "tradingview+筹码结构"
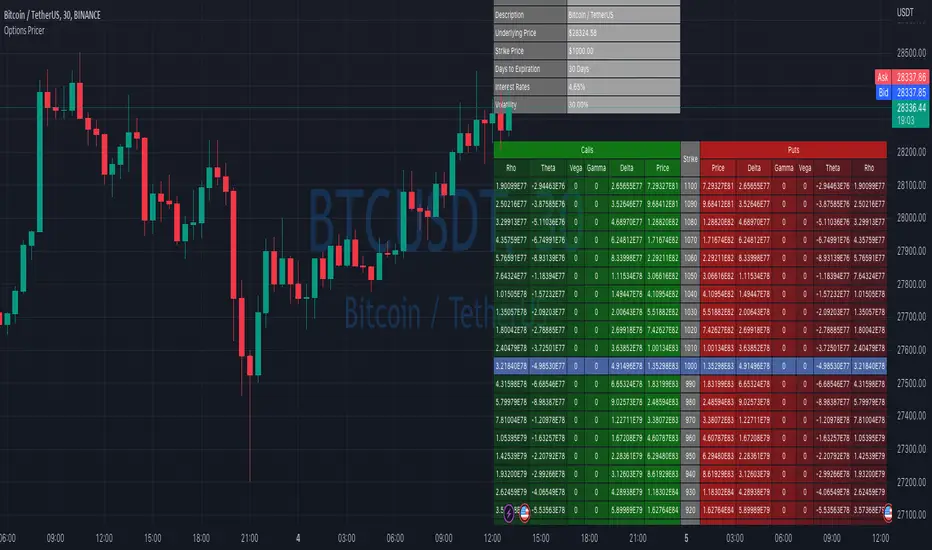
Options Price CalculatorIn the team, we continue to explore and expand the boundaries of TradingView.
For now, there is not much an options trader can do with options in TradingView.
We wanted to change that and created a simple option pricer.
You can set up in parameters a set of strikes, implied volatility, and days to expiry.
The indicators will take a risk-free rate from US01Y and the underlying price from your current chart.
It will compute prices and greeks for both put and call options.
Thanks to @MUQWISHI for helping code it.
Disclaimer
Please remember that past performance may not indicate future results.
Due to various factors, including changing market conditions, the strategy may no longer perform as well as in historical backtesting.
This post and the script don’t provide any financial advice.
MTF CCI + Realtime DivergencesMulti-timeframe Commodity Channel Index (CCI) + Realtime Divergences + Alerts
This version of the CCI includes the following features:
- Optional 2x sets of triple-timeframe overbought and oversold signals with fully configurable timeframes and overbought and oversold thresholds, can indicate where 3 selected timeframes are all overbought or all oversold at the same time, with alert option.
- Optional divergence lines drawn directly onto the oscillator in realtime, with alert options.
- Configurable pivot periods to fine tune the divergences drawn in order to suit different trading styles and timeframes, including the ability to enable automatic adjustment of pivot period per chart timeframe.
- Alternate timeframe feature allows you to configure the oscillator to use data from a different timeframe than the chart it is loaded on.
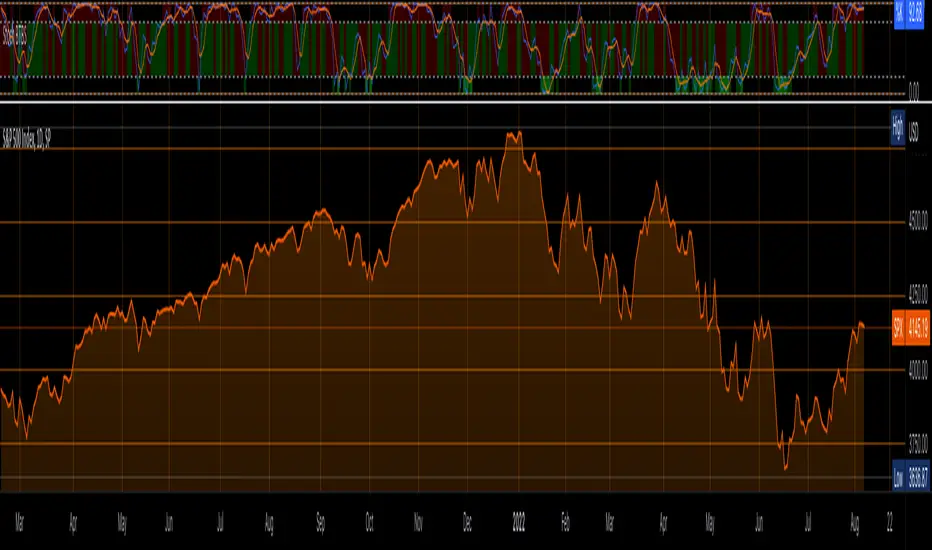
- 'Hide oscillator' feature allows traders to hide the oscillator itself, leaving only the background colours indicating the overbought and oversold periods and/or MTF overbought and oversold confluences, as seen in the chart image.
- Also includes standard configurable CCI options, including CCI length and source type. Defaults set to length 20, and hlc3 source type.
- Optional Flip oscillator feature, allows users to flip the oscillator upside down, for use with Tradingviews 'Flip chart' feature (Alt+i), for the purpose of manually spotting divergences, where the trader has a strong natural bias in one direction, so that they can flip both the chart and the oscillator.
- Optional 'Fade oscillator' feature, which will fade out all but the most recent period, reducing visual noise on the chart.
While this version of the CCI has the ability to draw divergences in realtime along with related alerts so you can be notified as divergences occur without spending all day watching the charts, the main purpose of this indicator was to provide the triple-timeframe overbought and oversold confluence signals, in an attempt to add more confluence, weight and reliability to the single timeframe overbought and oversold states, commonly used for trade entry confluence. It's primary purpose is intended for scalping reversal trades on lower timeframes, typically between 1-15 minutes, which can be used in conjunction with the regular divergences the indicator can highlight. The triple timeframe overbought can often indicate near term reversals to the downside, with the triple timeframe oversold often indicating neartime reversals to the upside. The default timeframes for this confluence are set to check the 1m, 5m and 15m timeframes together, ideal for scalping the < 15 minute charts. The default settings for the MTF #1 timeframes (1m, 5m and 15m) are best used on a <5 minute chart.
Its design and use case is based upon the original MTF Stoch RSI + Realtime Divergences found here .
Commodity Channel Index (CCI)
Investopedia has described the popular oscillator as follows:
“The Commodity Channel Index (CCI) is a momentum-based oscillator used to help determine when an investment vehicle is reaching a condition of being overbought or oversold.
Developed by Donald Lambert, this technical indicator assesses price trend direction and strength, allowing traders to determine if they want to enter or exit a trade, refrain from taking a trade, or add to an existing position. In this way, the indicator can be used to provide trade signals when it acts in a certain way.”
You can read more about the CCI, its use cases and calculations here .
How do traders use overbought and oversold levels in their trading?
The oversold level, that is traditionally when the CCI is above the 100 level is typically interpreted as being 'overbought', and below the -100 level is typically considered 'oversold'. Traders will often use the CCI at an overbought level as a confluence for entry into a short position, and the CCI at an oversold level as a confluence for an entry into a long position. These levels do not mean that price will necessarily reverse at those levels in a reliable way, however. This is why this version of the CCI employs the triple timeframe overbought and oversold confluence, in an attempt to add a more confluence and reliability to this usage of the CCI. While traditionally, the overbought and oversold levels are below -100 for oversold, and above 100 for overbought, he default threshold settings of this indicator have been increased to provide fewer, stronger signals, especially suited to the low timeframes and highly volatile assets.
What are divergences?
Divergence is when the price of an asset is moving in the opposite direction of a technical indicator, such as an oscillator, or is moving contrary to other data. Divergence warns that the current price trend may be weakening, and in some cases may lead to the price changing direction.
There are 4 main types of divergence, which are split into 2 categories;
regular divergences and hidden divergences. Regular divergences indicate possible trend reversals, and hidden divergences indicate possible trend continuation.
Regular bullish divergence: An indication of a potential trend reversal, from the current downtrend, to an uptrend.
Regular bearish divergence: An indication of a potential trend reversal, from the current uptrend, to a downtrend.
Hidden bullish divergence: An indication of a potential uptrend continuation.
Hidden bearish divergence: An indication of a potential downtrend continuation.
How do traders use divergences in their trading?
A divergence is considered a leading indicator in technical analysis , meaning it has the ability to indicate a potential price move in the short term future.
Hidden bullish and hidden bearish divergences, which indicate a potential continuation of the current trend are sometimes considered a good place for traders to begin, since trend continuation occurs more frequently than reversals, or trend changes.
When trading regular bullish divergences and regular bearish divergences, which are indications of a trend reversal, the probability of it doing so may increase when these occur at a strong support or resistance level . A common mistake new traders make is to get into a regular divergence trade too early, assuming it will immediately reverse, but these can continue to form for some time before the trend eventually changes, by using forms of support or resistance as an added confluence, such as when price reaches a moving average, the success rate when trading these patterns may increase.
Typically, traders will manually draw lines across the swing highs and swing lows of both the price chart and the oscillator to see whether they appear to present a divergence, this indicator will draw them for you, quickly and clearly, and can notify you when they occur.
Setting alerts.
With this indicator you can set alerts to notify you when any/all of the above types of divergences occur, on any chart timeframe you choose, and also when the triple timeframe overbought and oversold confluences occur.
Configurable pivot period.
You can adjust the default pivot period values to suit your prefered trading style and timeframe. If you like to trade a shorter time frame, lowering the default lookback values will make the divergences drawn more sensitive to short term price action. By default, this indicator has enabled the automatic adjustment of the pivot periods for 4 configurable timeframes, in a bid to optimise the divergences drawn when the indicator is loaded onto any of the 4 timeframes. These timeframes and the auto adjusted pivot periods on each of them can also be reconfigured within the settings menu.
Disclaimer: This script includes code adapted from the Divergence for Many Indicators v4 by LonesomeTheBlue . With special thanks.

Crypto Map Dashboard v1.0🔰Overview
Charts are an essential part of working with data, as they are a way to condense large amounts of data into an easy to understand format. Visualizations of data can bring out insights to someone looking at the data for the first time, as well as convey findings to others who won’t see the raw data. There are countless chart types out there, each with different use cases. Often, the most difficult part of creating a data visualization is figuring out which chart type is best for the task at hand.
What are the types of metrics, features, or other variables that you plan on plotting? Although it depended on some multiple factors!
But my choices of the chart type for this Crypto datas was Pie chart or Donut char for crypto dominances ,and Colum (Bar) chart for Total MarketCaps .
The audiences that I plan on presenting this for them could be all tradingviewrs , especially crypto lovers ,or those who just aim to have an initial exploration for themselves ,like me!
so this indicator mostly could be an educational indicator script for pine coders !
We can use the " Crypto Map Dashboard " indicator to Get an quick overview of the crypto market and monitor where the smart money Flow changing by comparing the dominances and totals Caps .
In general, it consists of 4 parts:
✅1 =>> Table1 : If you like to see and compare and monitor the changes of dominances of (Bitcoin, Ethereum, Usdt , Usdc , etc.) and their market cap in different times you can see the table on The upper-right corner.
✅2 =>> Table2: Also, in the table lower-right corner, you can see the changes of the totals(Total, Total2 , Total3 and TotalDefi) in the same time periods.
✅3 =>> pie chart or donut chart: By viewing this , you understand better about Table1 Datas, that it depicts exactly how Dominance is distributed and specialized.
✅4 =>> column chart (bar chart) : And in the last you can clearly compare the total marketcaps and see how far they are from their ATHs.
You also can even notice the entry and exit of liquidity from the crypto market!
I must also mention that I am definitely still a beginner compared to more experienced pine coders, and there may be some bugs in my codes and calculations, but I am an open person and I welcome your comments ,Also Let me know if you have any questions.
Lots of Love to all tradingviewers and pineCoder ,Cheers!💚❤️💙

Stochastic by BTBSA little word before you are going to use it, this indicator is just a MODIFIED script.
The calculation part is NOT FROM ME , its still the original script by TradingView.
The Usage is still the same as you can take out of the info tab by TradingView.
The only difference is that the Color Changes red when:
1. %K is over 80 (Upper Band-High Band)=(OVERBOUGHT)
2. %D lays over %K (%D>%K)
Changes green when:
1.%K is under 20 (Lower Band-Low Band)=(OVERSOLD)
%K lays over %D (%K>%D)
Tell me what I can add or do better :)
Tag me if you use this in a public Analysis :)
MTF Stochastic ScannerThis Stochastic scanner can be use to identify overbought and oversold of 10 symbols over multiple timeframes
it will give you a quick overview which pair is more overbough or more oversold and also signals tops and bottoms in the AVG row
light red/green cell = weak bearish (Stoch = 30-20) / bullish (Stoch = 70-80)
medium red/green cell = bearish (Stoch = 20-10) / bullish (Stoch = 80-90)
dark red/green cell = strong bearish (Stoch <= 10) / bullish (Stoch >= 90)
gray cell = neutral (Stoch = 30-70)
Usage
If AVG (average of all 4 timeframes) falls below 20, the cell will get green, indicating a good time to enter long (buy)
If AVG (average of all 4 timeframes) rises above 80, the cell will get red, indicating a good time to enter short (sell)
Use the "MTF Stochastic Scanner" in combination with the " MTF RSI Scanner "
to find tops (RSI MTF avg >=70 AND Stochastic MTF avg >= 80)
or bottoms (RSI MTF avg <= 30 AND Stochastic MTF avg <= 20)
Here is how the two MTF scanners looked on Nov 08 2021 (ATH) »
and here how the MTF scanners looked on June 21 2022
use TradingViews Replay function to check how it would have worked in the past and when not.
As always… there NOT a single indicator that can show to the top & bottom 100% every single time. So use with caution, with other indicators and/or deeper understanding of technicals analysis ☝️☝️☝️
Settings
You can change the timeframes, symbols, Stochastic settings, overbought/oversold levels and colors to your liking
Drag the table onto the price chart, if you want to use it as an overlay.
NOTE:
Because of the 4x10 security requests, it can take up to 1 minute for changed settings to take effect! Please be patient 🙃
If you have any idea on how to optimise the code, please feel free to share 🙏
*** Inspired by "Binance CHOP Dashboard" from @Cazimiro and "RSI MTF Table" from @mobester16 ***

MTF RSI ScannerThis RSI scanner can be use to identify the relative strength of 10 symbols over multiple timeframes
it will give you a quick overview which pair is more bearish or more bullish and also signals tops and bottoms in the AVG row
light red/green cell = weak bearish (RSI = 45-35) / bullish (RSI = 55-65)
medium red/green cell = bearish (RSI = 35-25) / bullish (RSI = 65-75)
dark red/green cell = strong bearish (RSI <= 25) / bullish (RSI >= 75)
gray cell = neutral (RSI= 45-55)
Usage
If AVG (average of all 4 timeframes) falls below 30, the cell will get green, indicating a good time to enter long (buy)
If AVG (average of all 4 timeframes) rises above 70, the cell will get red, indicating a good time to enter short (sell)
Use the "MTF RSI Scanner" in combination with the "MTF Stochastic Scanner"
to find tops (RSI MTF avg >=70 AND Stochastic MTF avg >= 80)
or bottoms (RSI MTF avg <= 30 AND Stochastic MTF avg <= 20)
Here is how the two MTF scanners looked on Nov 08 2021 (ATH) »
and here how the MTF scanners looked on June 21 2022
use TradingViews Replay function to check how it would have worked in the past and when not.
As always… there NOT a single indicator that can show to the top & bottom 100% every single time. So use with caution, with other indicators and/or deeper understanding of technicals analysis ☝️☝️☝️
Settings
You can change the timeframes, symbols, RSI settings, overbought/oversold levels and colors to your liking
Drag the table onto the price chart, if you want to use it as an overlay.
NOTE:
Because of the 4x10 security requests, it can take up to 1 minute for changed settings to take effect! Please be patient 🙃
If you have any idea on how to optimise the code, please feel free to share 🙏
*** Inspired by "Binance CHOP Dashboard" from @Cazimiro and "RSI MTF Table" from @mobester16 ***

Central Pivot Range 2xBased on a modified Hancock Pivot Range.
Displays the Central Pivot Range for 2 customisable Timeframes Along with Targets which are based on Classic Pivot Point Extensions.
The Pivot Point Extensions are Extended to the right of the price chart which helps eliminate unnecessary clutter
TF1 Displays Right Extensions R3 to S3 + the pivot point
TF2 Displays only Right Extensions R2 to S2
I would have liked to have provided more Right Extensions plus Labels however that would have exceeded Tradingviews memory limits, having said that R3 to S3 for both timeframes can still be displayed as historical levels
Central Pivot Range High Low and Mid Levels + the Targets work great as Support and Resistance and help with analysing the trend
A Thick Central Pivot Range generally indicates consolidation whereas a Thin Central Pivot Range generally indicates a trending market

RSI Overbought Oversold Divergence Strategy w/ Buy/Sell SignalsThis indicator is a copy of my RSI Overbought/Oversold Divergence Indicator with-Alerts
Only difference is that the alerts are disabled, instead it uses tradingviews strategy tester signals
If you want alerts just use the other indicator

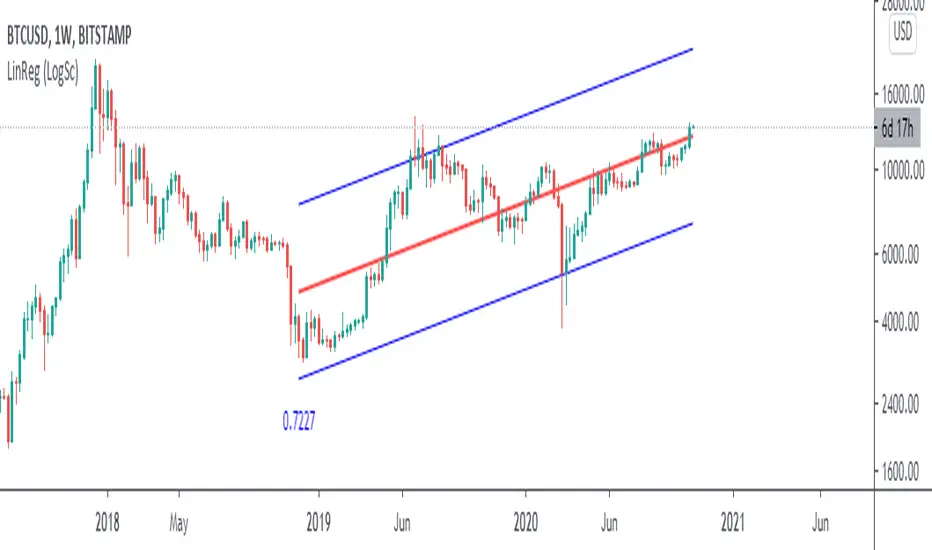
Exponential Regression Channel with novel volatilityThis code is a modified version of the built-in "linear regression" script of Tradingviews which can be plotted correctly on logarithmic charts
The log reg code of Forza was adjusted by altustro to generate an exponential regression (or a correct linear regression on the log scale, this is equivalent).
The standard deviation in the log scale is a better volatility measure which we call novola, and which defines the trend channel displayed in addition to the main indicator.
The exponential regression slope and channel also defines the typical holding time of the stock and the SL/TP boundaries, which are calculated and displayed at the last bar.
The display works both in log and regular scale. But only in the log scale it can be compared to the linear extension, which can also be plotted when activated in the properties.
The underlying exponential fit can not be displayed in regular scale as only lines can be plotted by TV. But with the related script Exponental Regression also the exponential regression can be exactly displayed using a workaround.

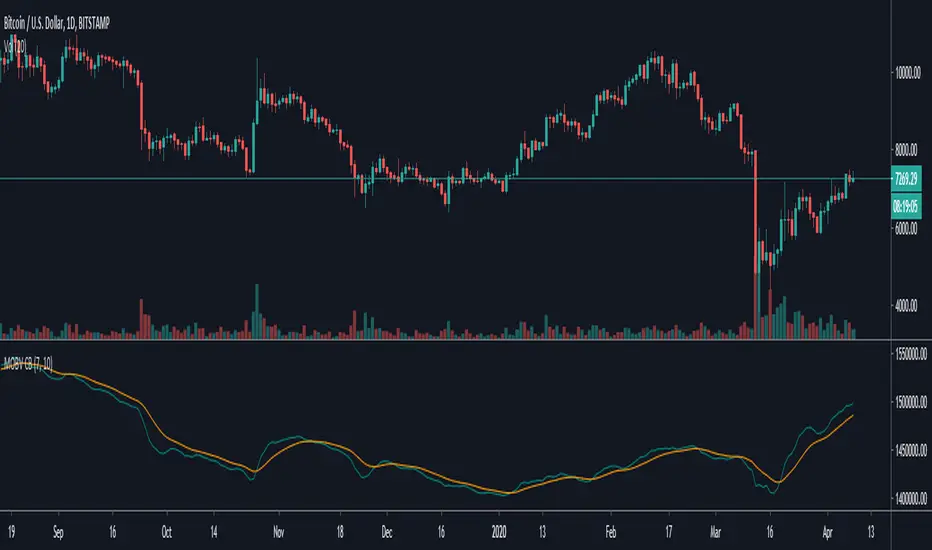
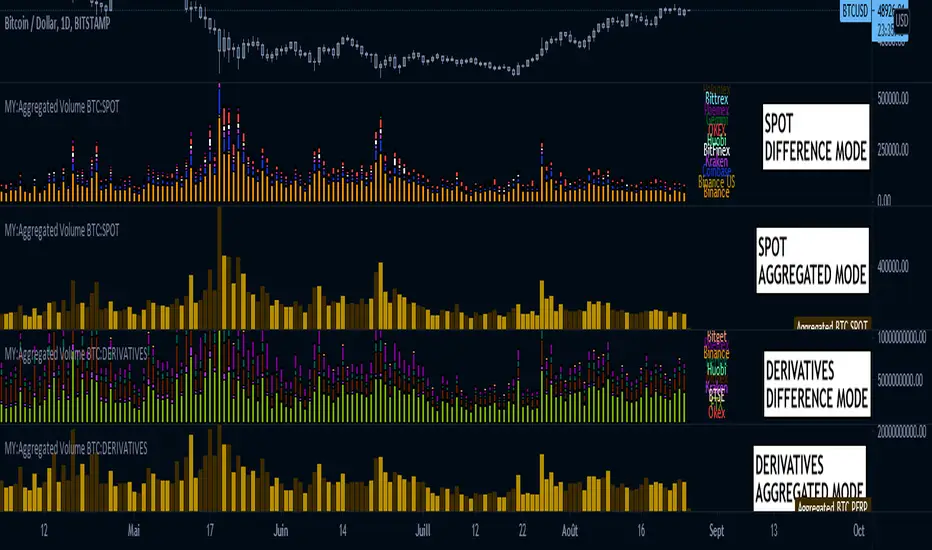
MY:Aggregated Volume BTC:DERIVATIVES█ MY Aggregated Volume BTC DERIVATIVES
This indicator shows a panel to display the Bitcoin Trading Volume of different exchanges. A lot of traders follow the default volume indicator provided by tradingview. This default indicator shows the volume for the current ticker (example BTCUSD:BITSTAMP), but each exchange has its own volume.
In a matter of visibility and accessibility, I've decided to aggregate the volume of almost all the Bitcoin exchanges (tickers) in tradingview.
This indicator helps identifying decreasing volume, where the volume comes from (spot or derivatives). A decreasing DERIVATIVES volume isn't a good sign as it shows a decrease in the buying pressure.
The panel has 1 main configuration : Display mode, showing Aggregated (all exchanges in one bar) or Difference (Stacked bar)
The other configuration Legend Item Gap and Legend X Gap is for when the difference mode is selected. It affects the position of the legend. Some might have smaller screens, bigger screens, viewport zoomed in etc.
Due to the number of exchanges, and pinescript limitations, I had to split the volume in 2 indicators, the SPOT volume, and the DERIVATIVES volume. The script in this page is specific to the DERIVATIVES volume. For the SPOT, please refer to my other available script.
Exchange list :
// OKEX:BTCUSDPERP
// OKEX:BTCUSDTPERP
// FTX:BTCPERP
// BTSE:BTCPFC
// KRAKEN:XBTUSDPERP
// BITMEX:XBTUSD
// HUOBI:BTCPERP
// DERIBIT:BTCPERP
// BINANCE:BTCPERP
// BINANCE:BTCUSDTPERP
// PHEMEX:BTCUSD
// BITGET:BTCUSDPERP
// BITGET:BTCUSDTPERP
MY:Aggregated Volume BTC:SPOT█ MY Aggregated Volume BTC SPOT
This indicator shows a panel to display the Bitcoin Trading Volume of different exchanges. A lot of traders follow the default volume indicator provided by tradingview. This default indicator shows the volume for the current ticker (example BTCUSD:BITSTAMP), but each exchange has its own volume.
In a matter of visibility and accessibility, I've decided to aggregate the volume of almost all the Bitcoin exchanges (tickers) in tradingview. Some have been commented out (Kucoin, FTX) due to high volume data which was hiding the other ones.
This indicator helps identifying decreasing volume, where the volume comes from (spot or derivatives). A decreasing SPOT volume isn't a good sign as it shows a decrease in the buying pressure.
The panel has 1 main configuration : Display mode, showing Aggregated (all exchanges in one bar) or Difference (Stacked bar)
The other configuration Legend Item Gap and Legend X Gap is for when the difference mode is selected. It affects the position of the legend. Some might have smaller screens, bigger screens, viewport zoomed in etc.
Due to the number of exchanges, and pinescript limitations, I had to split the volume in 2 indicators, the SPOT volume, and the DERIVATIVES volume. The script in this page is specific to the SPOT volume. For the DERIVATIVES, please refer to my other available script.
Exchange list :
// BINANCE:BTCUSD
// BINANCE:BTCUSDT
// BINANCE:BTCEUR
// COINBASE:BTCUSD
// COINBASE:BTCUSDT
// COINBASE:BTCEUR
// KRAKEN:XBTUSD
// KRAKEN:XBTUSDT
// KRAKEN:XBTEUR
// BITFINEX:BTCUSD
// BITFINEX:BTCEUR
// HUOBI:BTCUSDT
// HUOBI:BTCUSDC
// OKEX:BTCUSDT
// FTX:BTCUSD DISABLED FOR NOW, TO MUCH VOLUME
// FTX:BTCUSDT DISABLED FOR NOW, TO MUCH VOLUME
// KUCOIN:BTCUSDT DISABLED FOR NOW, TO MUCH VOLUME
// KUCOIN:BTCUSDC DISABLED FOR NOW, TO MUCH VOLUME
// GEMINI:BTCUSD
// GEMINI:BTCEUR
// PHEMEX:BTCUSDT
// BITTREX:BTCUSD
// BITTREX:BTCUSDT
// BITTREX:BTCEUR

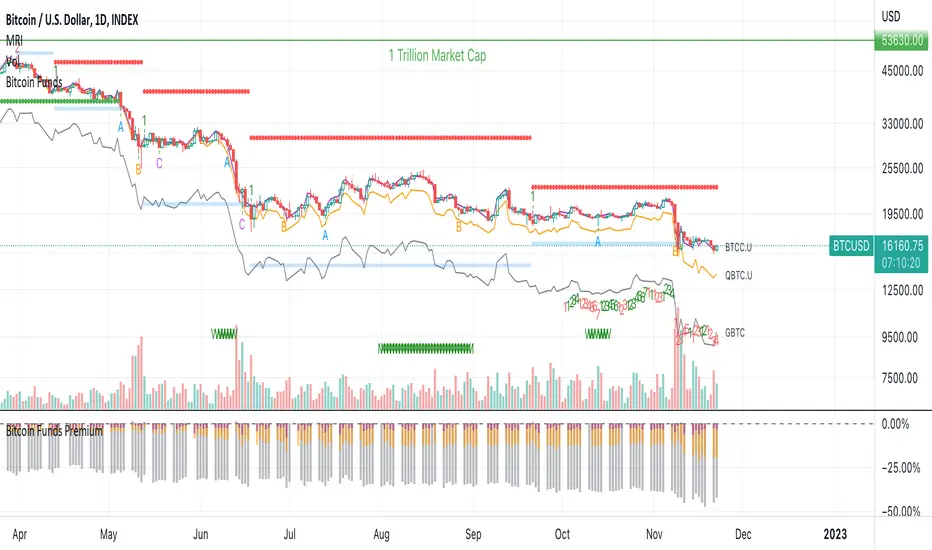
Bitcoin Funds OverlayOverlay the Net Asset Value per Unit (NAVPU) of 4 different Bitcoin Funds on your Bitcoin chart.
BTCC ETF
QBTC Fund
GBTC Trust
VBTC ETN
This indicator uses the metrics from the fund management websites to calculate the "Net Asset Value per Unit (NAVPU)" to display the true underlying value of the fund.
Note that the metrics can change and therefore the graph is not accurate for long past timeframes.
You can update the metrics for each fund in the settings dialogue.
The script will autodetect the currency pairs of your current graph and only display compatible funds:
BTC / USD will show BTCC.U, QBTC.U and GBTC
BTC / CAD will show BTCC and QBTC
BTC / EUR will show VBTC
The script should not show in other currency pairs so it will not mess up other charts you might switch to.
If you find bugs with this logic, please comment below so I can fix them.
Due to TradingViews "no-links in description" policy, you need to google each funds website yourself to find the current metrics. These search terms should help:
BTCC search "Purpose Bitcoin ETF"
QBTC search "3iq The Bitcoin Fund (QBTC)"
GBTC search "Grayscale® Bitcoin Trust"
VBTC search "VanEck Vectors Bitcoin ETN"
Risk Management: Position Size & Risk RewardHere is a Risk Management Indicator that calculates stop loss and position sizing based on the volatility of the stock. Most traders use a basic 1 or 2% Risk Rule, where they will not risk more than 1 or 2% of their capital on any one trade. I went further and applied four levels of risk: 0.25%, 0.50%, 1% and 2%. How you apply these different levels of risk is what makes this indicator extremely useful. Here are some common ways to apply this script:
• If the stock is extremely volatile and has a better than 50% chance of hitting the stop loss, then risk only 0.25% of your capital on that trade.
• If a stock has low volatility and has less than 20% change of hitting the stop loss, then risk 2% of your capital on that trade.
• Risking anywhere between 0.25% and 2% is purely based on your intuition and assessment of the market.
• If you are on a losing streak and you want to cut back on your position sizing, then lowering the Risk % can help you weather the storm.
• If you are on a winning streak and your entries are experiencing a higher level of success, then gradually increase the Risk % to reap bigger profits.
• If you want to trade outside the noise of the market or take on more noise/risk, you can adjust the ATR Factor.
• … and whatever else you can imagine using it to benefit your trading.
The position size is calculated using the Capital and Risk % fields, which is the percentage of your total trading capital (a.k.a net liquidity or Capital at Risk). If you instead want to calculate the position size based on a specific amount of money, then enter the amount in the Custom Risk Amt input box. Any amount greater than 0 in the Custom Risk Amt field will override the values in the Capital and Risk % fields.
The stop loss is calculated by using the ATR. The default setting is the 14 RMA, but you can change the length and smoothing of the true range moving average to your liking. Selecting a different length and smoothing affects the stop loss and position size, so choose these values very carefully.
The ATR Factor is a multiplier of the ATR. The ATR Factor can be used to adjust the stop loss and move it outside of the market noise. For the more volatile stock, increase the factor to lower the stop loss and reduce the chance of getting stopped out. For stocks with less volatility , you can lower the factor to raise the stop loss and increase position size. Adjusting the ATR Factor can also be useful when you want the stop loss to be at or below key levels of support.
The Market Session is the hours the market is open. The Market Session only affects the Opening Range Breakout (ORB) option, so it’s important to change these values if you’re trading the ORB and you’re outside of Eastern Standard Time or you’re trading in a foreign exchange.
The ORB is a bonus to the script. When enabled, the indicator will only appear in the first green candle of the day (09:30:00 or 09:30 AM EST or the start time specified in Market Session). When using the ORB, the stop loss is based on the spread of the first candle at the Open. The spread is the difference between the High and Low of the green candle. On 1-day or higher timeframes, the indicator will be the spread of the last (or current) candle.
The output of the indicator is a label overlaying the chart:
1. ATR (14 RMA x2) – This indicated that the stop loss is determined by the ATR. The x2 is the ATR Factor. If ORB is selected, then the first line will show SPREAD, instead of ATR.
2. Capital – This is your total capital or capital at risk.
3. Risk X% of Capital – The amount you’re risking on a % of the Capital. If a Custom Risk Amt is entered, then Risk Amount will be shown in place of Capital and Risk % of Capital.
4. Entry – The current price.
5. Stop Loss – The stop loss price.
6. -1R – The stop loss price and the amount that will be lost of the stop loss is hit.
7. – These are the target prices, or levels where you will want to take profit.
This script is primarily meant for people who are new to active trading and who are looking for a sound risk management strategy based on market volatility . This script can also be used by the more experienced trader who is using a similar system, but also wants to see it applied as an indicator on TradingView. I’m looking forward to maintaining this script and making it better in future revisions. If you want to include or change anything you believe will be a good change or feature, then please contact me in TradingView.

Theil–Sen EstimatorThe Theil-Sen estimator is a nonparametric statistics method for robustly fitting a regression line to sample points (1,2).
As stated in the Wikipedia article (3), the method is " the most popular nonparametric technique for estimating a linear trend " in the applied sciences due to its robustness to outliers and limited assumptions regarding measurement errors.
Relation with other Methods
The Theil-Sen estimator can be significantly more accurate than simple linear regression (least squares) for skewed and heteroskedastic data.
Method Description
The script computes all the slopes between pairs of points and takes the median as the estimate of the regression slope, m . Subsequently, the intercept, b , is determined from the sample points as the median of y(i) − m x(i) values. The regression line in the slope–intercept form, y = m x + b , is then plotted along with the calculated prediction interval (estimated by means of the root-mean-square error).
I have added two options for how to handle pairs of points:
Method == "All" to use the slopes of all pairs of points;
Method == "Random" to use the slopes of randomly generated pairs of points.
The random choice of the pairs of points is based on the Wichmann–Hill is a pseudorandom number generator.
The reason for introducing the "Random" method is that the calculation of the median involves sorting the array of slopes (the size of N*(N-1)/2, where N is the number of sample points). This is a computationally demanding procedure, which runs into the limit on the cycle computation time (200 ms) set in TradingView. Therefore, the "All" method works only with Length < 50.
Also note that the number of lookback points is limited by by the maximum array size allowed in TradingView.
Literature
1. Sen, P. K. (1968) "Estimates of the regression coefficient based on Kendall's tau." JASA, 1379-1389.
2. Theil, H. (1950) "A rank-invariant method of linear and polynomial regression analysis." Reprinted in 1992 in Henri Theil’s contributions to economics and econometrics, Springer, 345-381.
3. en.wikipedia.org

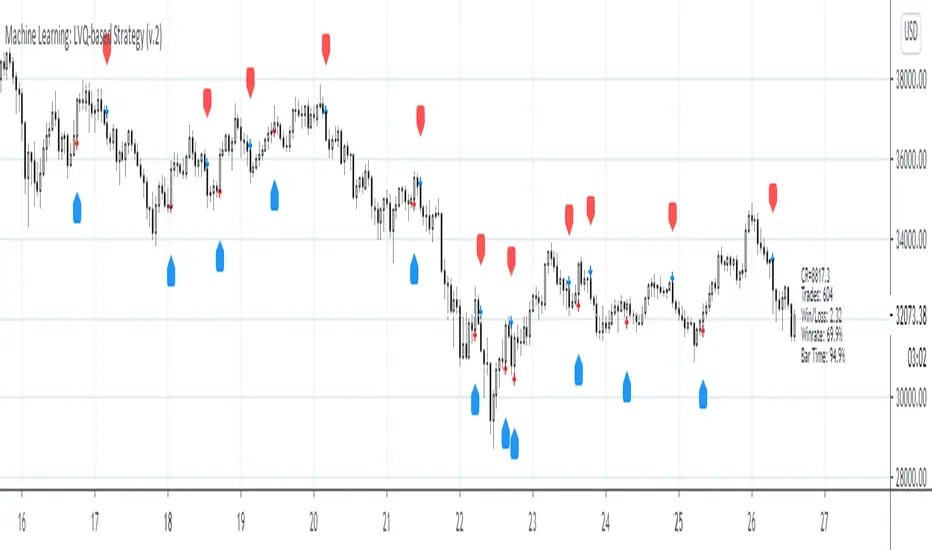
Machine Learning: LVQ-based StrategyLVQ-based Strategy (FX and Crypto)
Description:
Learning Vector Quantization (LVQ) can be understood as a special case of an artificial neural network, more precisely, it applies a winner-take-all learning-based approach. It is based on prototype supervised learning classification task and trains its weights through a competitive learning algorithm.
Algorithm:
Initialize weights
Train for 1 to N number of epochs
- Select a training example
- Compute the winning vector
- Update the winning vector
Classify test sample
The LVQ algorithm offers a framework to test various indicators easily to see if they have got any *predictive value*. One can easily add cog, wpr and others.
Note: TradingViews's playback feature helps to see this strategy in action. The algo is tested with BTCUSD/1Hour.
Warning: This is a preliminary version! Signals ARE repainting.
***Warning***: Signals LARGELY depend on hyperparams (lrate and epochs).
Style tags: Trend Following, Trend Analysis
Asset class: Equities, Futures, ETFs, Currencies and Commodities
Dataset: FX Minutes/Hours+++/Days
Machine Learning: Logistic RegressionMulti-timeframe Strategy based on Logistic Regression algorithm
Description:
This strategy uses a classic machine learning algorithm that came from statistics - Logistic Regression (LR).
The first and most important thing about logistic regression is that it is not a 'Regression' but a 'Classification' algorithm. The name itself is somewhat misleading. Regression gives a continuous numeric output but most of the time we need the output in classes (i.e. categorical, discrete). For example, we want to classify emails into “spam” or 'not spam', classify treatment into “success” or 'failure', classify statement into “right” or 'wrong', classify election data into 'fraudulent vote' or 'non-fraudulent vote', classify market move into 'long' or 'short' and so on. These are the examples of logistic regression having a binary output (also called dichotomous).
You can also think of logistic regression as a special case of linear regression when the outcome variable is categorical, where we are using log of odds as dependent variable. In simple words, it predicts the probability of occurrence of an event by fitting data to a logit function.
Basically, the theory behind Logistic Regression is very similar to the one from Linear Regression, where we seek to draw a best-fitting line over data points, but in Logistic Regression, we don’t directly fit a straight line to our data like in linear regression. Instead, we fit a S shaped curve, called Sigmoid, to our observations, that best SEPARATES data points. Technically speaking, the main goal of building the model is to find the parameters (weights) using gradient descent.
In this script the LR algorithm is retrained on each new bar trying to classify it into one of the two categories. This is done via the logistic_regression function by updating the weights w in the loop that continues for iterations number of times. In the end the weights are passed through the sigmoid function, yielding a prediction.
Mind that some assets require to modify the script's input parameters. For instance, when used with BTCUSD and USDJPY, the 'Normalization Lookback' parameter should be set down to 4 (2,...,5..), and optionally the 'Use Price Data for Signal Generation?' parameter should be checked. The defaults were tested with EURUSD.
Note: TradingViews's playback feature helps to see this strategy in action.
Warning: Signals ARE repainting.
Style tags: Trend Following, Trend Analysis
Asset class: Equities, Futures, ETFs, Currencies and Commodities
Dataset: FX Minutes/Hours/Days

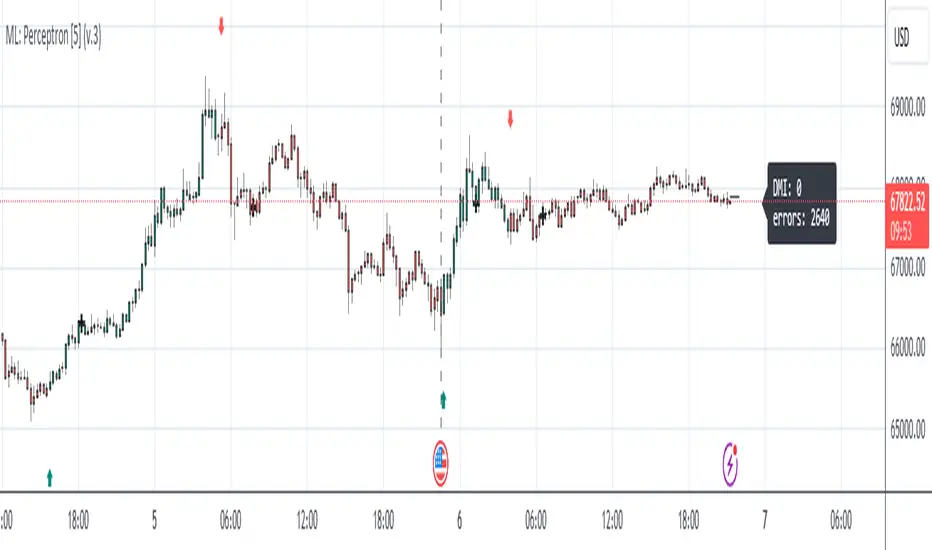
Machine Learning: Perceptron-based strategyPerceptron-based strategy
Description:
The Learning Perceptron is the simplest possible artificial neural network (ANN), consisting of just a single neuron and capable of learning a certain class of binary classification problems. The idea behind ANNs is that by selecting good values for the weight parameters (and the bias), the ANN can model the relationships between the inputs and some target.
Generally, ANN neurons receive a number of inputs, weight each of those inputs, sum the weights, and then transform that sum using a special function called an activation function. The output of that activation function is then either used as the prediction (in a single neuron model) or is combined with the outputs of other neurons for further use in more complex models.
The purpose of the activation function is to take the input signal (that’s the weighted sum of the inputs and the bias) and turn it into an output signal. Think of this activation function as firing (activating) the neuron when it returns 1, and doing nothing when it returns 0. This sort of computation is accomplished with a function called step function: f(z) = {1 if z > 0 else 0}. This function then transforms any weighted sum of the inputs and converts it into a binary output (either 1 or 0). The trick to making this useful is finding (learning) a set of weights that lead to good predictions using this activation function.
Training our perceptron is simply a matter of initializing the weights to zero (or random value) and then implementing the perceptron learning rule, which just updates the weights based on the error of each observation with the current weights. This has the effect of moving the classifier’s decision boundary in the direction that would have helped it classify the last observation correctly. This is achieved via a for loop which iterates over each observation, making a prediction of each observation, calculating the error of that prediction and then updating the weights accordingly. In this way, weights are gradually updated until they converge. Each sweep through the training data is called an epoch.
In this script the perceptron is retrained on each new bar trying to classify this bar by drawing the moving average curve above or below the bar.
This script was tested with BTCUSD, USDJPY, and EURUSD.
Note: TradingViews's playback feature helps to see this strategy in action.
Warning: Signals ARE repainting.
Style tags: Trend Following, Trend Analysis
Asset class: Equities, Futures, ETFs, Currencies and Commodities
Dataset: FX Minutes/Hours+/Days
Machine Learning: kNN-based StrategykNN-based Strategy (FX and Crypto)
Description:
This strategy uses a classic machine learning algorithm - k Nearest Neighbours (kNN) - to let you find a prediction for the next (tomorrow's, next month's, etc.) market move. Being an unsupervised machine learning algorithm, kNN is one of the most simple learning algorithms.
To do a prediction of the next market move, the kNN algorithm uses the historic data, collected in 3 arrays - feature1, feature2 and directions, - and finds the k-nearest
neighbours of the current indicator(s) values.
The two dimensional kNN algorithm just has a look on what has happened in the past when the two indicators had a similar level. It then looks at the k nearest neighbours,
sees their state and thus classifies the current point.
The kNN algorithm offers a framework to test all kinds of indicators easily to see if they have got any *predictive value*. One can easily add cog, wpr and others.
Note: TradingViews's playback feature helps to see this strategy in action.
Warning: Signals ARE repainting.
Style tags: Trend Following, Trend Analysis
Asset class: Equities, Futures, ETFs, Currencies and Commodities
Dataset: FX Minutes/Hours+++/Days
Zignaly TutorialThis strategy serves as a beginner's guide to connect TradingView signals to Zignaly Crypto Trading Platform.
It was originally tested at BTCUSDT pair and 1D timeframe.
Before using this documentation it's recommended that you:
Use default TradingView strategy script or another script and setup its associated alert manually. Just make the alert pop-up in the screen.
Create a 'Copy-Trader provider' (or Signal Provider) in Zignaly and send signals to it either thanks to your browser or with some basic programming.
SETTINGS
__ SETTINGS - Capital
(CAPITAL) Capital quote invested per order in USDT units {100.0}. This setting is only used when '(ZIG) Provider type' is set to 'Signal Provider'.
(CAPITAL) Capital percentage invested per order (%) {25.0}. This setting is only used when '(ZIG) Provider type' is set to 'Copy Trader Provider'.
__ SETTINGS - Misc
(ZIG) Enable Alert message {True}: Whether to enable alert message or not.
(DEBUG) Enable debug on order comments {True}: Whether to show alerts on order comments or not.
Number of decimal digits for Prices {2}.
(DECIMAL) Maximum number of decimal for contracts {3}.
__ SETTINGS - Zignaly
(ZIG) Integration type {TradingView only}: Hybrid : Both TradingView and Zignaly handle take profit, trailing stops and stop losses. Useful if you are scared about TradingView not firing an alert. It might arise problems if TradingView and Zignaly get out of sync. TradingView only : TradingView sends entry and exit orders to Zignaly so that Zignaly only buys or sells. Zignaly won't handle stop loss or other settings on its own.
(ZIG) Zignaly Alert Type {WebHook}: 'Email' or 'WebHook'.
(ZIG) Provider type {Copy Trader Provider}: 'Copy Trader Provider' or 'Signal Provider'. 'Copy Trader Provider' sends a percentage to manage. 'Signal Provider' sends a quote to manage.
(ZIG) Exchange: 'Binance' or 'Kucoin'.
(ZIG) Exchange Type {Spot}: 'Spot' or 'Futures'.
(ZIG) Leverage {1}. Set it to '1' when '(ZIG) Exchange Type' is set to 'Spot'.
__ SETTINGS - Strategy
(STRAT) Strategy Type: 'Long and Short', 'Long Only' or 'Short Only'.
(STOPTAKE) Take Profit? {false}: Whether to enable Take Profit.
(STOPTAKE) Stop Loss? {True}: Whether to enable Stop Loss.
(TRAILING) Enable Trailing Take Profit (%) {True}: Whether to enable Trailing Take Profit.
(STOPTAKE) Take Profit % {3.0}: Take profit percentage. This setting is only used when '(STOPTAKE) Take Profit?' setting is set to true.
(STOPTAKE) Stop Loss % {2.0}: Stop loss percentage. This setting is only used when '(STOPTAKE) Stop Loss?' setting is set to true.
(TRAILING) Trailing Take Profit Trigger (%) {2.5}: Trailing Stop Trigger Percentage. This setting is only used when '(TRAILING) Enable Trailing Take Profit (%)' setting is set to true.
(TRAILING) Trailing Take Profit as a percentage of Trailing Take Profit Trigger (%) {25.0}: Trailing Stop Distance Percentage. This setting is only used when '(TRAILING) Enable Trailing Take Profit (%)' setting is set to true.
(RECENT) Number of minutes to wait to open a new order after the previous one has been opened {6}.
DEFAULT SETTINGS
By default this strategy has been setup with these beginner settings:
'(ZIG) Integration type' : TradingView only
'(ZIG) Provider type' : 'Copy Trader Provider'
'(ZIG) Exchange' : 'Binance'
'(ZIG) Exchange Type' : 'Spot'
'(STRAT) Strategy Type' : 'Long Only'
'(ZIG) Leverage' : '1' (Or no leverage)
but you can change those settings if needed.
FIRST STEP
For both future of spot markets you should make sure to change '(ZIG) Zignaly Alert Type' to match either WebHook or Email. If you have a non paid account in TradingView as in October 2020 you would have to use Email which it's free to use.
RECOMMENDED SETTINGS
__ RECOMMENDED SETTINGS - Spot markets
'(ZIG) Exchange Type' setting should be set to 'Spot'
'(STRAT) Strategy Type' setting should be set to 'Long Only'
'(ZIG) Leverage' setting should be set to '1'
__ RECOMMENDED SETTINGS - Future markets
'(ZIG) Exchange Type' setting should be set to 'Futures'
'(STRAT) Strategy Type' setting should be set to 'Long and Short'
'(ZIG) Leverage' setting might be changed if desired.
__ RECOMMENDED SETTINGS - Signal Providers
'(ZIG) Provider type' setting should be set to 'Signal Provider'
'(CAPITAL) Capital quote invested per order in USDT units' setting might be changed if desired.
__ RECOMMENDED SETTINGS - Copy Trader Providers
'(ZIG) Provider type' setting should be set to 'Copy Trader Provider'
'(CAPITAL) Capital percentage invested per order (%)' setting might be changed if desired.
Strategy Properties setting: 'Initial Capital' might be changed if desired.
INTEGRATION TYPE EXPLANATION
'Hybrid': Both TradingView and Zignaly handle take profit, trailing stops and stop losses. Useful if you are scared about TradingView not firing an alert. It might arise problems if TradingView and Zignaly get out of sync.
'TradingView only': TradingView sends entry and exit orders to Zignaly so that Zignaly only buys or sells. Zignaly won't handle stop loss or other settings on its own.
HOW TO USE THIS STRATEGY
Beginner: Copy and paste the strategy and change it to your needs. Turn off '(DEBUG) Enable debug on order comments' setting.
Medium: Reuse functions and inputs from this strategy into your own as if it was a library.
Advanced: Check Strategy Tester. List of trades. Copy and paste the different suggested 'alert_message' variable contents to your script.
Expert: I needed a way to pass data from TradingView script to the alert. Now I know it's the 'alert_message' variable. I can do this own my own.
ALERTS SETUP
This is the important piece of information that allows you to connect TradingView to Zignaly in a semi-automatic manner.
__ ALERTS SETUP - WebHook
Webhook URL: https : // zignaly . com / api / signals.php?key=MYSECRETKEY
Message: { {{strategy.order.alert_message}} , "key" : "MYSECRETKEY" }
__ ALERTS SETUP - Email
Setup a new Hotmail account
Add it as an 'SMS email' in TradingView Profile settings page.
Confirm your own the email address
Create a rule in your Hotmail account that 'Redirects' (not forwards) emails to 'signals @ zignaly . email' when (1): 'Subject' includes 'Alert', (2): 'Email body' contains string 'MYZIGNALYREDIRECTTRIGGER' and (3): 'From' contains 'noreply @ tradingview . com'.
In 'More Actions' check: Send Email-to-SMS
Message: ||{{strategy.order.alert_message}}||key=MYSECRETKEY||
MYZIGNALYREDIRECTTRIGGER
'(DEBUG) Enable debug on order comments' is turned on by default so that you can see in the Strategy Tester. List of Trades. The different orders alert_message that would have been sent to your alert. You might want to turn it off it some many letters in the screen is problem.
STRATEGY ADVICE
If you turn on 'Take Profit' then turn off 'Trailing Take Profit'.
ZIGNALY SIDE ADVICE
If you are a 'Signal Provider' make sure that 'Allow reusing the same signalId if there isn't any open position using it?' setting in the profile tab is set to true.
You can find your 'MYSECRETKEY' in your 'Copy Trader/Signal' provider Edit tab at 'Signal URL'.
ADDITIONAL ZIGNALY DOCUMENTATION
docs . zignaly . com / signals / how-to -- How to send signals to Zignaly
3 Ways to send signals to Zignaly
SIGNALS
FINAL REMARKS
This strategy tries to match the Pine Script Coding Conventions as best as possible.

Linear Regression (Log Scale)This code is a slightly modified version of Tradingviews' built-in "linear regression" script which can be correctly plotted on logarithmic charts.
EMA / Fibonacci / Bollinger Indicator for Market Sniper SuiteHello all,
this script was created to be used in conjunction with Market Sniper - Trading/Scalping Suite . It was put together to make instrument analysis faster and less convoluted.
It includes
9 Fibonacci Exponential moving averages + 2 Simple moving averages
Auto Fibonacci levels - Tradingviews Auto Fib Retracement - with some modifications
Bollinger Bands - To faster spot squeeze momentum

Modified version of On-Balance Volume [ChuckBanger]This is a smoothed version of the classic On-Balance Volume indicator. And I added a signal line with alerts that the user can set through TradingViews alert panel to indicate long or short play. I also find that this indicator is good to do divergences analysis on the asset you want to trade.