[blackcat] L2 Ehlers DFT-Adapted RSILevel: 2
Background
John F. Ehlers introuced his DFT-ADAPTED RELATIVE STRENGTH INDEX (RSI) in Jan, 2007.
Function
In "Fourier Transform For Traders" in Jan, 2007, John Ehlers presented an interesting technique of improving the resolution of spectral analysis that could be used to effectively measure market cycles. Better resolution is obtained by a surprisingly simple modification of the discrete Fourier transform. John Ehlers suggests using the discrete Fourier transform (DFT) to tune indicators. Here, I demonstrate this by building a DFT-adapted relative strength index (RSI) strategy.
Rather than display the RSI for a single cycle length across the entire chart, Ehlers DFT adaptive RSI value reflects the DFT-calculated dominant cycle length RSI. If the dominant cycle changes from 14 to 18 bars, the RSI length parameter changes accordingly. Computationally, this requires the strategy to continuously update values for all possible RSI cycle lengths via a "for" loop and array.
In details, a full-featured formula that implements a high-pass filter (HP) and a six-tap low-pass finite impulse response (FIR) filter on input, then does discrete Fourier transform calculations. I has taken liberty of adding extra parameters so the user can modify the analysis window length and the high-pass filter cutoff frequency in real time using the parameters window. Once the suite of possible RSI values is calculated, we use the DFT to select the relevant RSI for the current bar. The strategy then trades according to J. Welles Wilder's original rules for the RSI.
Key Signal
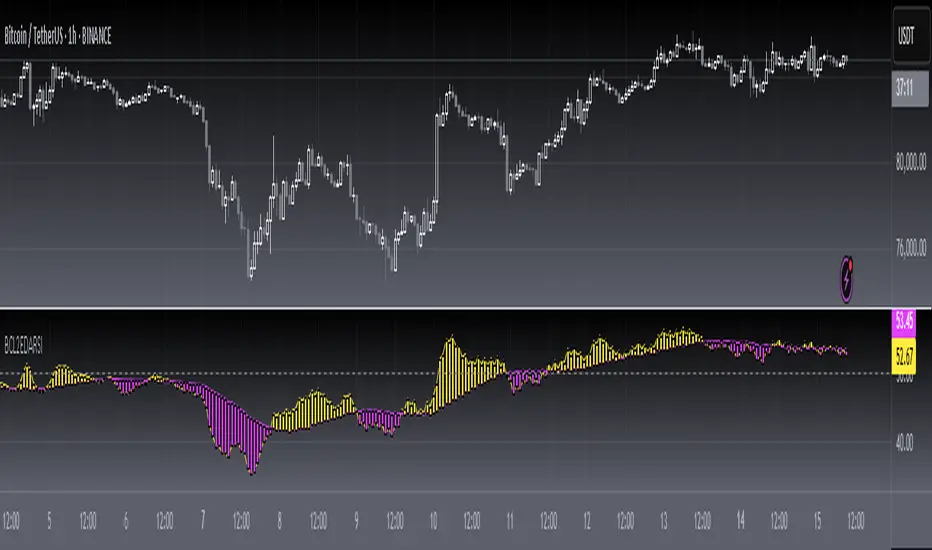
fastline--> DFT-ADAPTED RELATIVE STRENGTH INDEX (RSI) fast line
slowline--> DFT-ADAPTED RELATIVE STRENGTH INDEX (RSI) slow line
Pros and Cons
100% John F. Ehlers definition translation, even variable names are the same. This help readers who would like to use pine to read his book.
Remarks
The 71th script for Blackcat1402 John F. Ehlers Week publication.
Based on original work of Ehlers, I added ALMA smoothing on DFT-adapted relative strength index (RSI) so that clearer trend can be observed.
Readme
In real life, I am a prolific inventor. I have successfully applied for more than 60 international and regional patents in the past 12 years. But in the past two years or so, I have tried to transfer my creativity to the development of trading strategies. Tradingview is the ideal platform for me. I am selecting and contributing some of the hundreds of scripts to publish in Tradingview community. Welcome everyone to interact with me to discuss these interesting pine scripts.
The scripts posted are categorized into 5 levels according to my efforts or manhours put into these works.
Level 1 : interesting script snippets or distinctive improvement from classic indicators or strategy. Level 1 scripts can usually appear in more complex indicators as a function module or element.
Level 2 : composite indicator/strategy. By selecting or combining several independent or dependent functions or sub indicators in proper way, the composite script exhibits a resonance phenomenon which can filter out noise or fake trading signal to enhance trading confidence level.
Level 3 : comprehensive indicator/strategy. They are simple trading systems based on my strategies. They are commonly containing several or all of entry signal, close signal, stop loss, take profit, re-entry, risk management, and position sizing techniques. Even some interesting fundamental and mass psychological aspects are incorporated.
Level 4 : script snippets or functions that do not disclose source code. Interesting element that can reveal market laws and work as raw material for indicators and strategies. If you find Level 1~2 scripts are helpful, Level 4 is a private version that took me far more efforts to develop.
Level 5 : indicator/strategy that do not disclose source code. private version of Level 3 script with my accumulated script processing skills or a large number of custom functions. I had a private function library built in past two years. Level 5 scripts use many of them to achieve private trading strategy.
Cari skrip untuk "the strat"
[blackcat] L2 Ehlers Instantaneous Trendline Trading StrategyLevel: 2
Background
John F. Ehlers introuced Instantaneous Trendline Trading Strategy in his "Cybernetic Analysis for Stocks and Futures" chapter 3 on 2004.
Function
With the crossover strategy that Dr. Ehlers has developed it is possible to be on the wrong side of the trade for a substantial period from time to time. For this reason, Dr. Ehlers has added a rule that if the price goes against your position by more than some percentage, the strategy will correct itself and automatically reverse to the opposite position. The percentage is supplied as the input variable RevPct. RevPct is an optimizable parameter, but I find that the default
value of 1.5 percent (RevPct = 1.015) is a relatively robust number.
Key Signal
Trigger ---> Instantaneous Trendline fast line
ITrend ---> Instantaneous Trendline slow line
LimitBuy ---> limit buy price level which is triggered by gold cross
LimitSell ---> limit buy price level wich is triggered by dead cross
Pros and Cons
100% John F. Ehlers definition translation of original work, even variable names are the same. This help readers who would like to use pine to read his book. If you had read his works, then you will be quite familiar with my code style.
Remarks
The 23th script for Blackcat1402 John F. Ehlers Week publication.
Readme
In real life, I am a prolific inventor. I have successfully applied for more than 60 international and regional patents in the past 12 years. But in the past two years or so, I have tried to transfer my creativity to the development of trading strategies. Tradingview is the ideal platform for me. I am selecting and contributing some of the hundreds of scripts to publish in Tradingview community. Welcome everyone to interact with me to discuss these interesting pine scripts.
The scripts posted are categorized into 5 levels according to my efforts or manhours put into these works.
Level 1 : interesting script snippets or distinctive improvement from classic indicators or strategy. Level 1 scripts can usually appear in more complex indicators as a function module or element.
Level 2 : composite indicator/strategy. By selecting or combining several independent or dependent functions or sub indicators in proper way, the composite script exhibits a resonance phenomenon which can filter out noise or fake trading signal to enhance trading confidence level.
Level 3 : comprehensive indicator/strategy. They are simple trading systems based on my strategies. They are commonly containing several or all of entry signal, close signal, stop loss, take profit, re-entry, risk management, and position sizing techniques. Even some interesting fundamental and mass psychological aspects are incorporated.
Level 4 : script snippets or functions that do not disclose source code. Interesting element that can reveal market laws and work as raw material for indicators and strategies. If you find Level 1~2 scripts are helpful, Level 4 is a private version that took me far more efforts to develop.
Level 5 : indicator/strategy that do not disclose source code. private version of Level 3 script with my accumulated script processing skills or a large number of custom functions. I had a private function library built in past two years. Level 5 scripts use many of them to achieve private trading strategy.
[blackcat] L2 Ehlers ITrendline Trigger Trend-Following SystemLevel: 2
Background
John F. Ehlers introuced the Instantaneous Trendline and the Trigger of the trend-following system in his "Cybernetic Analysis for Stocks and Futures" chapter 3 on 2004.
Function
The process for creating a trendfollowing trading system from the indicators is simple. One unique aspect of the code is that the ITrend is forced to be a finite impulse response (FIR)-smoothed version of price for the first seven bars of the calculation.
This initialization is included to cause the ITrend to converge more rapidly to its correct value from the beginning transient. The strategy enters a long position when the trigger crosses over the Instantaneous Trendline and enters a short position when the trigger crosses under the Instantaneous Trendline. However, an effective trading system is more than following a simple set of indicators.
First, experience has shown that greater profits result from using limit orders rather than market orders or stop orders. Market orders are selfexplanatory. Stop orders mean the market must be going in the direction of the trade before the order is filled. For example, for long-position trades, the stop order must be placed above the current price. Thus, the price must increase from its current level before you get stopped into the long-position trade. This means you necessarily give up some of the profits you would otherwise have gotten if you had entered on a market order at the instant of your signal. You can lose additional profits from stop orders due to slippage.
Key Signal
Trigger ---> trend-following system fast line
ITrend ---> trend-following system slow line
Pros and Cons
100% John F. Ehlers definition translation of original work, even variable names are the same. This help readers who would like to use pine to read his book. If you had read his works, then you will be quite familiar with my code style.
Remarks
The 22th script for Blackcat1402 John F. Ehlers Week publication.
Readme
In real life, I am a prolific inventor. I have successfully applied for more than 60 international and regional patents in the past 12 years. But in the past two years or so, I have tried to transfer my creativity to the development of trading strategies. Tradingview is the ideal platform for me. I am selecting and contributing some of the hundreds of scripts to publish in Tradingview community. Welcome everyone to interact with me to discuss these interesting pine scripts.
The scripts posted are categorized into 5 levels according to my efforts or manhours put into these works.
Level 1 : interesting script snippets or distinctive improvement from classic indicators or strategy. Level 1 scripts can usually appear in more complex indicators as a function module or element.
Level 2 : composite indicator/strategy. By selecting or combining several independent or dependent functions or sub indicators in proper way, the composite script exhibits a resonance phenomenon which can filter out noise or fake trading signal to enhance trading confidence level.
Level 3 : comprehensive indicator/strategy. They are simple trading systems based on my strategies. They are commonly containing several or all of entry signal, close signal, stop loss, take profit, re-entry, risk management, and position sizing techniques. Even some interesting fundamental and mass psychological aspects are incorporated.
Level 4 : script snippets or functions that do not disclose source code. Interesting element that can reveal market laws and work as raw material for indicators and strategies. If you find Level 1~2 scripts are helpful, Level 4 is a private version that took me far more efforts to develop.
Level 5 : indicator/strategy that do not disclose source code. private version of Level 3 script with my accumulated script processing skills or a large number of custom functions. I had a private function library built in past two years. Level 5 scripts use many of them to achieve private trading strategy.

Combo Strategy 123 Reversal & EMA & MA Crossover This is combo strategies for get a cumulative signal.
First strategy
This System was created from the Book "How I Tripled My Money In The
Futures Market" by Ulf Jensen, Page 183. This is reverse type of strategies.
The strategy buys at market, if close price is higher than the previous close
during 2 days and the meaning of 9-days Stochastic Slow Oscillator is lower than 50.
The strategy sells at market, if close price is lower than the previous close price
during 2 days and the meaning of 9-days Stochastic Fast Oscillator is higher than 50.
Second strategy
The Moving Average Crossover trading strategy is possibly the most popular
trading strategy in the world of trading. First of them were written in the
middle of XX century, when commodities trading strategies became popular.
This strategy is a good example of so-called traditional strategies.
Traditional strategies are always long or short. That means they are never
out of the market. The concept of having a strategy that is always long or
short may be scary, particularly in today’s market where you don’t know what
is going to happen as far as risk on any one market. But a lot of traders
believe that the concept is still valid, especially for those of traders who
do their own research or their own discretionary trading.
This version uses crossover of moving average and its exponential moving average.
WARNING:
- For purpose educate only
- This script to change bars colors.

[FN] Session Range & Date Range For BacktestingThis has been done before in different ways, however, my goal is to publish a single, simplified copy/paste version of the idea so you can quickly and easily incorporate it into your strategy backtesting.
You can designate weekdays, weekdays + weekends for 24/7 markets, and also session range.
So, you trade bitcoin? It works. CME futures? It works. You are a discretionary trader so the only signals that matter are the ones that happen when you're awake? It works. Copy and paste.
The goal is that its that easy. You'll have to let me know if it is. glhf everyone.
If I'm not mistaken, you should be able to copy/paste this directly into your strategy script (Paste it in before your entry declarations). Just leave out the last 2 lines where the bgcolor() is declared... unless you want the background color lit up, that's up to you. It's just for demonstration purposes in this script.
After you've pasted it in, then in your strategy.entry() function you are adding: to the strategy.entry() function.
e.g:
strategy.entry("Long", strategy.long, qty=1, when = ENTRY_SIGNAL and signal_backtest())
Shoutouts to @zenandtheartoftrading and @allanster for providing the basis of this code that I put together here. We stand on the shoulders of giants.

Trend Angle Convergence Divergence by Kripto MuhtarFor English, please scroll down.
TR: Bu osilatör trend açısının üssel hareketli ortalamasını kısa ve uzun olmak üzere iki periyotta hesaplar. Bu osilatörü eşsiz yapan şey ise sadece trend açısını kullanmasıdır. Böylelikle eğer trend açısının hareketli ortalamaları sıfır hattının üstünde ise trendin yükselişte olduğu, tersine düşüşte olduğu görülür. Ters Fischer Dönüşümü de kullanıcı tercihine göre açılabilir. Böylelikle osilatör -1 ve 1 arasında değer alır. Böylelikle osilatör aşırı alım ve satım bölgelerini, aşırı sapma olarak gösterir. Tüm çizim seçenekleri de kişiselleştirilebilir. Sinyaller diğer osilatörlere göre daha hızlı ve uyumsuzluklar da dip ve tepede tespit edilebilir. Son olarak göreceli trend hızı, hareketli ortalamaların davranışlarıyla tespit edilebilir.
Bu osilatörü kullanırken uygulanacak stratejiler ise:
Hızlı üssel hareketli ortalama FEMA, yavaş hareketli ortamala SEMA'yı yukarı keserken longla. Kesişimin sıfır hattının üstünde veya altında olmasına göre risk değişir. En güvenli işlem sıfır hattının üstünde gerçekleştirilendir.
FEMA, SEMA'yı aşağı keserken longu kapat.
Hızlı üssel hareketli ortalama FEMA, yavaş hareketli ortamala SEMA'yı aşağı keserken şortla. Kesişimin sıfır hattının üstünde veya altında olmasına göre risk değişir. En güvenli işlem sıfır hattının üstünde gerçekleştirilendir.
FEMA, SEMA'yı yukarı keserken şortu kapat.
SEMA sıfır hattını yukarı kesince longla ve tekrar aşağı kesene kadar tut.
SEMA sıfır hattını aşağı kesince şortla ve tekrar yukarı kesene kadar tut.
Bu stratejilere göre de histogram renkleri değişmektedir.
----------------------------------------------------------------------------------------------------------------------------
EN: This oscillator indicates the trend angle with fast and slow exponential moving averages' cross overs. What makes this oscillator unique is that a pure trend angle is used to show up convergences and divergences of price movement. Thus, when the moving averages of the trend angle are above the zero line shows the trend is rising and, below shows, the trend is falling. Also Inverse Fischer Transformed model is optional on settings which scales the oscillator between -1,1. with fully customizable drawing preferences. The signals are very fast and divergences can be spotted on top or bottom. Finally, speed of the trend can be obtained by the FEMA/EMA directions.
Strategies to use this oscillator is:
Long when the FEMA ( FEMA ) is above the ( SEMA ) The risk depends on whether the crossover is over or below the zero line. The safest time for a long trade is when the SEMA is above the zero line.
Close long when the FEMA crosses SEMA downward.
Short when the SEMA is below the FEMA . The risk depends on whether the crossover is over or below the zero line. The safest time for short trade is when the SEMA is below the zero line.
Close short when Fast EMA crosses Slow EMA upward.
Long when the SEMA is above the zero line and hold until SEMA crosses zero-line downward.
Short when the SEMA is below the zero line and hold until SEMA crosses zero-line upward.
Histogram colors are changed with FEMA , SEMA positions and their positions concerning zero line as explained in the strategies above.

CS Trading Bot Study - Crypto EditionWhat is this Study about?
The CS Trading Bot Study is for getting Open Long (Buy) and Close Long signals (Sell) that you can use to get alerts in various ways (Webhooks, Emails, etc).
The Study is very profitable for a vast amount of Crypto assets and the algorithm behind is not overfitted.
How to use it?
Make sure to start your research and find your favorite Crypto assets using the corresponding strategy:
The research process is very important as you can see beforehand how well the alerts for this Study would perform.
Make sure to read the Strategy's description, as well!
After you found your Crypto assets of interest using the corresponding Strategy...
Open a new chart for each asset and add the Study from your favorite indicators.
Click on the alert symbol on your chart and from "Condition" choose the "CS Bot" Strategy.
Then below choose "CS Bot Buy Alert" and "CS Bot Sell Alert" (each separate alerts).
Under "options" check "Once per bar" (very important) .
Pick your desired way of getting the alerts (app, popup, email, webhook).
The webhooks for setting alerts are very interesting as you can forward your signals to your own trading bot or simply wait until my trading bot is available (currently in development)
Since I develop myself, rest assured it will be available soon. Look out for comments below as soon as it is available!
How to access?
If you are interested to get access to the complete package, please don't hesitate to send me a private message for a quote.
The amount of concurrent users using the package (=licenses) is limited to max. 500 a month (more we cannot manually handle has Tradingview has no automation for this yet).
Access to the bot package is based on a monthly basis. If you get access, you will asked in person at the end of the month if you want to continue or not.
The monthly fee depends on the demand, but for as long as you continue using the package your initial price stays the same!

MultiPrem+Detailed Description of MultiPrem+
MultiPrem+ is a versatile TradingView Pine Script indicator designed to enhance the analysis of multi-leg option strategies by calculating and visualizing the combined premium of various predefined option setups. It allows users to select from a comprehensive list of popular option strategies, such as Short Straddle, Iron Condor, Butterfly Call, and more, and dynamically computes the net premium, Greeks (Delta and Theta), volume, and other key metrics for the selected strategy. The indicator overlays these calculations on the chart, providing real-time insights into the potential profitability and risk of the strategy based on the underlying asset's price movement.
The core functionality revolves around fetching data for up to four option legs (e.g., calls and puts at different strikes) using TradingView's `request.security` function. It supports indices like NIFTY, BANKNIFTY, and SENSEX, with customizable ATM strike levels, strike width multipliers, and expiry dates. The script calculates the combined premium by summing the premiums of each leg, adjusted for position direction (long or short), and displays the results in a compact table on the chart. It also includes technical indicator overlays (e.g., SMA, RSI, MACD) to contextualize the strategy within market trends, and generates alerts with strategy metrics for automated notifications.
The indicator is particularly suited for option traders who want to monitor strategy performance without manual calculations, offering a blend of quantitative metrics and visual feedback. It operates on any timeframe but is optimized for intraday or short-term trading, where option premiums fluctuate rapidly.
### Unique Features
MultiPrem+ stands out from standard option analysis tools on TradingView due to several innovative features:
1. **Dynamic Multi-Leg Strategy Support**: Unlike basic option chain indicators that focus on single legs or simple spreads, MultiPrem+ supports a wide range of advanced multi-leg strategies (e.g., Iron Condor Wide, Reverse Iron Condor, Butterfly Call/Put). It automatically configures strike prices, directions, and approximate Greeks based on the selected strategy, saving time and reducing errors in setup.
2. **Combined Premium Visualization**: The indicator plots the net premium as a line on the chart, colored based on whether it's a credit or debit strategy and its relation to a selected technical indicator (e.g., green if below SMA for potential buys). This unique visualization helps traders see how the strategy's value evolves over time, providing an at-a-glance view of profitability.
3. **Integrated Greeks Calculation**: It computes net Delta (directional risk) and net Theta (time decay) for the entire strategy, factoring in leg directions. For credit strategies like Short Straddle, Theta is positive to reflect time decay benefits, a nuance not commonly found in free indicators.
4. **Strategy Suggestion Engine**: Based on RSI and net Theta, it suggests alternative strategies (e.g., "Bear Put Spread" if RSI is overbought). This AI-like recommendation system is unique, helping novices or busy traders pivot quickly to more suitable setups.
5. **Customizable Alerts**: The script generates JSON-formatted alerts with key metrics (premium, net Delta, net Theta, etc.), which can be integrated with TradingView's alert system or external tools for automated trading signals.
6. **Compact Table Display**: A dynamic table shows leg-specific details (Type, Strike, Position, Premium, Qty, Delta, Theta, Volume) without cluttering the chart. It's positionable and sized for usability.
### How a User Can Gain Valuable Analysis from It
MultiPrem+ empowers users to conduct sophisticated option strategy analysis, offering insights that can improve decision-making and risk management. Here's how users can leverage it for valuable outcomes:
1. **Strategy Evaluation and Selection**: Traders can quickly test different strategies by changing the selection and ATM strike. For instance, in a sideways market, selecting "Short Straddle" shows the net credit and positive Theta, highlighting potential profits from time decay. The suggestion engine further aids by recommending alternatives if current conditions (e.g., high RSI) suggest a mismatch, helping users optimize for market volatility or direction.
2. **Risk Assessment with Greeks**: Net Delta indicates directional bias (e.g., near zero for delta-neutral strategies like Iron Condor), allowing users to hedge against price moves. Net Theta quantifies daily time decay, crucial for theta-positive strategies—users can analyze how much profit they might gain per day if the underlying asset stays range-bound. This is especially valuable for income-focused traders.
3. **Premium and Volume Monitoring**: By plotting combined premium, users can track strategy value in real-time, identifying entry/exit points when premium crosses a moving average (e.g., buy when below EMA). Volume data per leg helps gauge liquidity, avoiding low-volume options that could lead to poor fills.
4. **Integration with Technical Indicators**: Overlaying strategies on RSI or MACD enables hybrid analysis. For example, a user might enter a Bull Call Spread when RSI is oversold, using the indicator's plot to visualize potential premium gains alongside RSI crossovers.
5. **Alert-Driven Trading**: Custom alerts notify users of premium changes or suggested strategy shifts, enabling hands-off monitoring. This is useful for busy traders, who can set notifications for when net Theta exceeds a threshold, signaling favorable decay conditions.
6. **Educational and Backtesting Tool**: Beginners can experiment with strategies to understand how strikes and widths affect outcomes. Advanced users can backtest by replaying historical data, analyzing how strategies performed in past markets.
Overall, MultiPrem+ transforms option trading from manual spreadsheet work into an interactive, visual experience, helping users spot opportunities, manage risks, and optimize returns with data-driven insights. For best results, combine it with external option pricing tools for precise Greeks, as the script uses approximate values.
Updated timestamp for alerts: `2025-09-06 13:50:00` (1:50 PM IST, September 06, 2025).

Strat Failed 2-Up/2-Down Scanner v2**Strat Failed 2-Up/2-Down Scanner**
The Strat Failed 2-Up/2-Down Scanner is designed for traders using The Strat methodology, developed by Rob Smith, to identify key reversal patterns in any market and timeframe. This indicator detects two specific candlestick patterns: Failed 2-Up (bearish) and Failed 2-Down (bullish), which signal potential reversals when a directional move fails to follow through.
**What It Does**
- **Failed 2-Up**: Identifies a bearish candle where the low and high are higher than the previous candle’s low and high, but the close is below the open, indicating a failed attempt to continue an uptrend. These are marked with a red candlestick, a red downward triangle above the bar, and a table entry.
- **Failed 2-Down**: Identifies a bullish candle where the high and low are lower than the previous candle’s high and low, but the close is above the open, signaling a failed downtrend. These are marked with a green candlestick, a green upward triangle below the bar, and a table entry.
- A table in the top-right corner displays the signal type ("Failed 2-Up" or "Failed 2-Down") and the ticker symbol for quick reference.
- Alerts are provided for both patterns, making the indicator compatible with TradingView’s screener for automated scanning.
**How It Works**
The indicator analyzes each candlestick’s high, low, and close relative to the previous candle:
- Failed 2-Up: `low > low `, `high > high `, `close < open`.
- Failed 2-Down: `high < high `, `low < low `, `close > open`.
When these conditions are met, the indicator applies visual markers (colored bars and triangles) and updates the signal table. Alert conditions trigger notifications for integration with TradingView’s alert system.
**How to Use**
1. Apply the indicator to any chart (stocks, forex, crypto, etc.) on any timeframe (e.g., 1-minute, hourly, daily).
2. Monitor the chart for red (Failed 2-Up) or green (Failed 2-Down) candlesticks with corresponding triangles.
3. Check the top-right table for the latest signal and ticker.
4. Set alerts by selecting “Failed 2-Up Detected” or “Failed 2-Down Detected” in TradingView’s alert menu to receive notifications (e.g., via email or app).
5. Use the signals to identify potential reversal setups in conjunction with other Strat-based analysis, such as swing levels or time-based strategies.
**Originality**
Unlike other Strat indicators that may focus on swing levels or complex candlestick combinations, this scanner specifically targets Failed 2-Up and Failed 2-Down patterns with clear, minimalist visualizations (bars, triangles, table) and robust alert functionality. Its simplicity makes it accessible for both novice and experienced traders using The Strat methodology.
**Ideal For**
Day traders, swing traders, and scalpers looking to capitalize on reversal signals in trending or ranging markets. The indicator is versatile for any asset class and timeframe, enhancing trade decision-making with The Strat’s pattern-based approach.

CycleTrend | QuantEdgeB📊 CycleTrend | QuantEdgeB
The CycleTrend strategy is a comprehensive trend-following system that integrates multiple advanced techniques, including on-chain data analysis, macroeconomic indicators, trend filters, and statistical smoothing functions.
This strategy dynamically adapts to market conditions by blending traditional technical analysis tools with modern quantitative finance approaches, making it a powerful hybrid model suitable for different market regimes.
🔗 The Core Framework of CycleTrend
🧩 1️⃣ Multi-Dimensional Market Analysis
CycleTrend incorporates four key dimensions of market structure, ensuring that it captures long-term, medium-term, and short-term trends while filtering out noise.
✔ On-Chain Data (MosaicMix) → Detects long-term trends using blockchain analytics.
✔ Macro & Risk Indicators (RiskMosaic) → Measures macroeconomic influences on market behavior.
✔ ChronoSync (Technical Trend-Following Signals) → Blends multiple trend-following indicators for directional bias.
✔ Sentival TF (Statistical Sentiment Analysis) → Uses Z-score-based mean-reversion indicators for overbought/oversold conditions.
📊 2️⃣ How These Components Work Together
Each component contributes a specific function to the strategy:
1. On-Chain Analysis (MosaicMix) → Market Strength
o Short-Term Holder MVRV → Measures unrealized profit/loss based on recent Bitcoin holders.
o Profit & Loss Ratio with MVRV Rate of Change (PLRoC) → Filters out weak market conditions using profit/loss trend dynamics.
o Final On-Chain Signal → Determines if on-chain data suggests a bullish or bearish phase.
2. RiskMosaic (Macroeconomic & Risk Model) → Risk-Regime Detection
o Tracks 10 key economic variables like RSI, China Equity Index, PMI, BTC supply trends, and silver ratio.
o Uses Z-score normalization to measure relative trends across macro indicators.
o Identifies shifts in macroeconomic risk sentiment and aligns CycleTrend to major economic cycles.
3. ChronoSync (Technical Trend Model) → Precise Trade Execution
o VIDYA ATR Gaussian Filter → Detects long-term trend momentum with adaptive smoothing.
o KIJUN ATR & Dual SD Kijun → Captures structural price movements while filtering short-term volatility.
o VIDYA Loop Function → Iteratively tracks trend momentum over an extended period.
o PRC-ALMA Adaptive Bands & Bollinger Bands % SD → Adapts trend signals based on mean-reverting conditions.
o Final ChronoSync Score → Aggregates all trend-following components to generate high-probability directional bias.
4. Sentival TF (Mean-Reversion & Momentum Filter) → Smart Entry/Exit Signals
o MVRV Z-Score → Measures how overbought/oversold Bitcoin is relative to historical valuations.
o SOPR, BB%, RSI, RoC, and NUPL Indicators → Filters out low-confidence trade setups by adding statistical validation.
o Final Sentival Signal → A quantitative assessment of whether a trade setup has a statistical edge.
🛠️ 3️⃣ CycleTrend Signal Generation
Once all four components (On-Chain, Macro, ChronoSync, and Sentival) produce signals, they are blended into a final CycleTrend score (TPI):
TPI=On-Chain RiskMosaic + Sentival-Chrono Trend BiasTPI = \text{On-Chain RiskMosaic + Sentival-Chrono Trend Bias}
The strategy then applies threshold-based decision rules:
✔ Go Long (BUY) → If TPI>LuTPI > Lu (Long Threshold)
✔ Go Short (SELL) → If TPI
TrendGradient [By TraderMan]TrendGradient Indicator: What It Does, How It Works, and How to Use It 📊✨
The **TrendGradient ** indicator is a Pine Script tool designed for the TradingView platform, assisting traders in trend analysis, generating buy/sell signals, and determining target price (TP) and stop-loss (SL) levels. In this guide, I’ll explain in detail what the indicator does, how it operates, how to use it, and strategies for opening positions. Get ready to dive into this colorful and powerful tool! 🚀
🌟 **What Is TrendGradient and What Does It Do?**
TrendGradient is an indicator that analyzes price movements to identify trend direction and strength while generating actionable buy and sell signals. Here are its core functions:
1. **Trend Tracking**: Uses 38-period and 62-period Exponential Moving Averages (EMAs) to determine the trend direction (bullish or bearish).
2. **Buy/Sell Signals**: Generates signals based on EMA crossovers and crossunders.
3. **Target and Stop Levels**: Calculates entry, take-profit (TP1, TP2, TP3), and stop-loss (SL) levels using the Average True Range (ATR).
4. **Volatility and Trend Analysis**: Visualizes volatility levels (low, medium, high) and trend strength (strong/weak) via ATR and EMA.
5. **Visual Clarity**: Provides a user-friendly interface with colored lines, labels, tables, and shapes.
This indicator is ideal for trend-following traders and can be used for both short-term (scalping/day trading) and long-term strategies. 📈
---
### 🛠️ **How Does TrendGradient Work?**
Let’s break down the indicator’s mechanics step by step:
#### 1. **EMA-Based Trend Analysis** 📉
- **EMA 38 and EMA 62**: The indicator uses 38-period and 62-period Exponential Moving Averages to smooth price data and identify trend direction.
- **EMA 38 > EMA 62**: Bullish trend (uptrend) 📈
- **EMA 38 < EMA 62**: Bearish trend (downtrend) 📉
- EMA crossovers trigger buy/sell signals:
- **Crossover (EMA 38 crosses above EMA 62)**: Buy signal (BUY).
- **Crossunder (EMA 38 crosses below EMA 62)**: Sell signal (SELL).
- The EMAs focus on the last 20 days of data to display recent trends only.
#### 2. **ATR-Based Levels** ⚖️
- **ATR (Average True Range)**: Measures price volatility and is used to calculate entry, TP, and SL levels.
- **Entry Price**: For buys, the closing price plus an ATR multiplier; for sells, the closing price minus an ATR multiplier.
- **Take-Profit Levels (TP1, TP2, TP3)**: Calculated by adding/subtracting ATR multiples (default: 2.0, 4.0, 6.0) to/from the entry price.
- **Stop-Loss (SL)**: Set at a distance from the entry price using an ATR multiplier (default: 2.0 + additional SL).
- These levels are visualized on the chart with colored lines (yellow: entry, green: TP1, teal: TP2, blue: TP3, red: SL) and labels.
#### 3. **Signal and Status Visualization** 🖼️
- **Lines and Labels**: Buy/sell signals are marked with green "BUY" and red "SELL" labels on the chart.
- **Table**: A table in the top-right corner summarizes signal status, entry/TP/SL levels, trend strength, volatility, and trend direction.
- **Color Coding**:
- Green: Bullish trend, buy signal, or TP achievements.
- Red: Bearish trend, sell signal, or SL triggered.
- Yellow, teal, blue: Entry and TP levels.
- **Bar Coloring**: Bars are colored green (bullish) or red (bearish) based on EMA alignment.
#### 4. **TP/SL Monitoring** ✅❌
- The indicator checks if the price hits TP or SL levels and displays labels like "✔️ TP Achieved" or "❌ SL Stopped Out."
- When a TP or SL is hit, the position status updates (e.g., "In Progress ⏳", "Successful ✅", or "Failed ❌").
#### 5. **Volatility and Trend Strength** 📊
- **Volatility (ATR)**: Classified as "Low" (red), "Medium" (orange), or "High" (green) based on the ATR’s position within its 50-bar range.
- **Trend Strength**: If EMA 38 > EMA 62, the trend is "Strong" (green); otherwise, it’s "Weak" (red).
---
### 📋 **How to Use TrendGradient?**
Follow these steps to effectively use TrendGradient:
#### 1. **Add the Indicator to TradingView** 🖥️
- In TradingView, search for "TrendGradient " in the **Indicators** menu and add it to your chart.
- Use default settings or customize parameters like ATR period, multipliers, and display duration (default: 20 days) in the **Settings** menu.
#### 2. **Identify Signals** 🔍
- **Buy Signal (BUY)**: Appears when a green "BUY" label is displayed and EMA 38 crosses above EMA 62.
- **Sell Signal (SELL)**: Appears when a red "SELL" label is displayed and EMA 38 crosses below EMA 62.
- Check the top-right table for signal status ("BUY", "SELL", or "-") and position levels (Entry, TP1, TP2, TP3, SL).
#### 3. **Opening a Position** 🚪
- **Long Position (Buy)**:
1. When a "BUY" signal appears, check the entry price (yellow line).
2. Open a position at or near the entry price.
3. Set TP1, TP2, TP3 (green, teal, blue lines) and SL (red line) as targets/stops.
- **Short Position (Sell)**:
1. When a "SELL" signal appears, check the entry price.
2. Open a position at or near the entry price.
3. Use TP and SL levels as targets/stops.
- **Note**: ATR-based levels adjust dynamically to market volatility, ensuring adaptability.
#### 4. **Position Management** 🛡️
- **Take-Profit (TP)**: Realize profits when the price hits TP1, TP2, or TP3. For example, close part of the position at TP1 and hold the rest for TP2/TP3.
- **Stop-Loss (SL)**: Close the position if the price hits the SL level ("❌ SL Stopped Out" appears).
- **Partial Closes**: Use multiple TP levels to scale out of positions incrementally.
#### 5. **Trend and Volatility Analysis** 📊
- **Trend Direction and Strength**: The table shows whether the trend is "Up" or "Down" and its strength ("Strong" or "Weak"). Strong trends may warrant more aggressive positions.
- **Volatility**: ATR-based volatility indicators help gauge market conditions. High volatility (green) suggests larger price moves, while low volatility (red) indicates calmer markets.
#### 6. **Risk Management** ⚠️
- Always use the SL level and assess the risk/reward ratio (e.g., 2:1 for TP1, 4:1 for TP2).
- In low volatility (red), consider smaller positions; in high volatility (green), expect larger moves.
---
### 🛠️ **Example Position Opening Scenario**
**Scenario: Long Position**
- **Situation**: EMA 38 crosses above EMA 62, and a green "BUY" label appears.
- **Entry Price**: 100 (yellow line).
- **TP Levels**: TP1: 104, TP2: 108, TP3: 112.
- **SL Level**: 96.
- **Strategy**:
1. Open a long position at 100.
2. Close 50% of the position at TP1 (104), hold the rest for TP2 (108) or TP3 (112).
3. Exit fully if the price hits SL (96).
- **Table Status**: "Signal: BUY", "Position Status: In Progress ⏳", "Trend Strength: Strong", "Volatility: High".
**Scenario: Short Position**
- **Situation**: EMA 38 crosses below EMA 62, and a red "SELL" label appears.
- **Entry Price**: 100.
- **TP Levels**: TP1: 96, TP2: 92, TP3: 88.
- **SL Level**: 104.
- **Strategy**: Manage the position similarly, scaling out at TP levels.
---
### 💡 **Tips and Suggestions**
1. **Timeframe**: The indicator works across timeframes (1H, 4H, daily). Short-term traders can use 1H-4H, while long-term traders may prefer daily charts.
2. **Combine with Other Indicators**: Use RSI, MACD, or support/resistance levels to confirm signals.
3. **Backtesting**: Test the strategy on historical data to evaluate performance.
4. **Customization**: Adjust ATR multipliers or EMA periods to suit your market or strategy.
5. **Discipline**: Stick to signals and avoid emotional decisions.
---
### 🎨 **Visual Features**
- **Colored Lines and Labels**: Entry, TP, and SL levels are displayed with colored lines (yellow, green, teal, blue, red) for clarity.
- **Table**: The top-right table summarizes all key information (signal, levels, trend, volatility).
- **Bar Coloring**: Green bars for bullish trends and red bars for bearish trends make trend direction easy to spot.
- **Emojis**: Position status is enhanced with emojis like ⏳ (in progress), ✅ (successful), and ❌ (failed) for visual appeal.
---
### ⚠️ **Warnings and Limitations**
- **Market Conditions**: The indicator performs best in trending markets; it may produce false signals in ranging markets.
- **Risk Management**: Always use proper risk/reward ratios and risk only a small portion of your capital.
- **Lag**: EMAs are lagging indicators, so signals may be delayed in fast-moving markets.
- **Customization Needs**: Default settings may not suit all markets; test and optimize as needed.
---
### 🌟 **Conclusion**
TrendGradient is a user-friendly, visually appealing indicator for trend tracking and automated level calculation. It generates signals via EMA crossovers, calculates dynamic TP/SL levels with ATR, and presents all information clearly through tables, lines, and labels. By using this tool with discipline, you can make more informed and successful trading decisions! 🚀
If you have further questions or need help customizing the indicator, feel free to ask! 💬 Good luck and happy trading! 🍀

Momentum RS | QuantumResearch🚀 Momentum RS | QuantumResearch
Momentum RS is a relative strength-based momentum rotation system developed by QuantumResearch. Unlike traditional relative strength tools that rely on static ratio comparisons (e.g., ETH/BTC), this script focuses on trend confirmation and momentum acceleration to dynamically rotate into the strongest trending asset across a customizable basket.
🔍 Key Highlights
✅ Trend-Validated Momentum Scoring:
Each asset is scored using trend following indicator. Only assets in a confirmed uptrend are eligible for rotation. No blind allocation into a pumping asset without trend validation.
🔄 Dynamic Asset Rotation:
The system selects the asset with the highest momentum among those currently in a bullish TPI state, switching only when a new asset becomes dominant.
💹 Backtestable Strategy:
Includes full equity curve tracking, swap count, and customizable fees. Automatically calculates:
Sharpe Ratio
Sortino Ratio
Omega Ratio
Max Drawdown
Net Profit vs HODL
📈 Momentum Visualization:
Each selected asset’s momentum score is displayed in a custom performance table, along with current trend signal (LONG or CASH) and overall strategy metrics.
⚙️ How It Works
Select up to 4 assets (e.g., BTC, ETH, SOL, SUI).
For each, the script computes:
Trend State via trend following indicator (1 = Bullish, -1 = Bearish)
Momentum Score to asses the winner
The strategy allocates 100% exposure to the asset with the highest momentum among those in an uptrend.
If no asset is trending, the strategy holds CASH.
📊 What Makes This Unique?
Most “relative strength” indicators compare the price ratio between two assets over time. This often leads to late rotations.
This tool is different:
It uses momentum and trend detection, not simple ratio analysis.
It’s designed to avoid false breakouts by requiring trend confirmation before rotating.
Ideal for rotational trading, momentum investing, and trend-following systems.
🧠 Best Use Cases
Rotational Crypto Strategies (BTC vs ETH vs SOL vs SUI)
Smart Trend Allocation with drawdown awareness
Backtest-ready edge validation vs HODL strategies
Low-frequency rebalancing with high signal quality
🛑 Disclaimer
This indicator is for educational purposes only. It does not constitute financial advice. Past performance does not guarantee future returns. Always use proper risk management.

SHYY-TFC-Horizontal V2SHYY-TFC-Horizontal V2 – Multi-Timeframe Clarity for The Strat Traders
SHYY-TFC-Horizontal V2 is a powerful, clean, and efficient overlay designed for serious traders who use Rob Smith’s The Strat.
This real-time table gives you instant visual insight across all key timeframes – from 5 minutes to monthly – with:
Candle direction (bullish, bearish, neutral)
Strat bar type (1, 2U, 2D, 3)
Live countdown to bar close
Compact horizontal layout that saves space and enhances clarity
Fully customizable table position to fit any chart setup
Built with no lookahead bias, this version meets TradingView’s script publishing standards and is optimized for actionable, real-time decisions.
Ideal for:
Scalpers who need fast confirmation
Swing traders aligning entries with time frame continuity
Price action traders following The Strat methodology
Trade with confidence. See the full picture. React faster.
SHYY-TFC-Horizontal V2 – built to make you faster, sharper, and more in control.

Volume Momentum [BackQuant]Volume Momentum
The Volume Momentum indicator is designed to help traders identify shifts in market momentum based on volume data. By analyzing the relative volume momentum, this indicator provides insights into whether the market is gaining strength (uptrend) or losing momentum (downtrend). The strategy uses a combination of percentile-based volume normalization, weighted moving averages (WMA), and exponential moving averages (EMA) to assess volume trends.
The system focuses on the relationship between price and volume, utilizing normalized volume data to highlight key market changes. This approach allows traders to focus on volume-driven price movements, helping them to capture momentum shifts early.
Key Features
1. Volume Normalization and Percentile Calculation:
The signed volume (positive when the close is higher than the open, negative when the close is lower) is normalized against the rolling average volume. This normalized volume is then subjected to a percentile interpolation, allowing for a robust statistical measure of how the current volume compares to historical data. The percentile level is customizable, with 50 representing the median.
2. Weighted and Smoothed Moving Averages for Trend Detection:
The normalized volume is smoothed using weighted moving averages (WMA) and exponential moving averages (EMA). These smoothing techniques help eliminate noise, providing a clearer view of the underlying momentum. The WMA filters out short-term fluctuations, while the EMA ensures that the most recent data points have a higher weight, making the system more responsive to current market conditions.
3. Trend Reversal Detection:
The indicator detects momentum shifts by evaluating whether the volume momentum crosses above or below zero. A positive volume momentum indicates a potential uptrend, while a negative momentum suggests a possible downtrend. These trend reversals are identified through crossover and crossunder conditions, triggering alerts when significant changes occur.
4. Dynamic Trend Background and Bar Coloring:
The script offers customizable background coloring based on the trend direction. When volume momentum is positive, the background is colored green, indicating a bullish trend. When volume momentum is negative, the background is colored red, signaling a bearish trend. Additionally, the bars themselves can be colored based on the trend, further helping traders quickly visualize market momentum.
5. Alerts for Momentum Shifts:
The system provides real-time alerts for traders to monitor when volume momentum crosses a critical threshold (zero), signaling a trend reversal. The alerts notify traders when the market momentum turns bullish or bearish, assisting them in making timely decisions.
6. Customizable Parameters for Flexible Usage:
Users can fine-tune the behavior of the indicator by adjusting various parameters:
Volume Rolling Mean: The period used to calculate the average volume for normalization.
Percentile Interpolation Length: Defines the range over which the percentile is calculated.
Percentile Level: Determines the percentile threshold (e.g., 50 for the median).
WMA and Smoothing Periods: Control the smoothing and response time of the indicator.
7. Trend Background Visualization and Trend-Based Bar Coloring:
The background fill is shaded according to whether the volume momentum is positive or negative, providing a visual cue to indicate market strength. Additionally, bars can be color-coded to highlight the trend, making it easier to see the trend’s direction without needing to analyze numerical data manually.
8. Note on Mean-Reversion Strategy:
If you take the inverse of the signals, this indicator can be adapted for a mean-reversion strategy. Instead of following the trend, the strategy would involve buying assets that are underperforming and selling assets that are overperforming, based on volume momentum. However, it’s important to note that this approach may not work effectively on highly correlated assets, as their price movements may be too similar, reducing the effectiveness of the mean-reversion strategy.
Final Thoughts
The Volume Momentum indicator offers a comprehensive approach to analyzing volume-based momentum shifts in the market. By using volume normalization, percentile interpolation, and smoothed moving averages, this system helps identify the strength and direction of market trends. Whether used for trend-following or adapted for mean-reversion, this tool provides traders with actionable insights into the market’s volume-driven movements, improving decision-making and portfolio management.

Cross-Sectional Altcoin Portfolio [BackQuant]Cross-Sectional Altcoin Portfolio
Introducing BackQuant's Cross-Sectional Altcoin Portfolio, a sophisticated trading system designed to dynamically rotate among a selection of major altcoins. This portfolio strategy compares multiple assets based on real-time performance metrics, such as momentum and trend strength, to select the strongest-performing coins. It uses a combination of adaptive scoring and regime filters to ensure the portfolio is aligned with favorable market conditions, minimizing exposure during unfavorable trends.
This system offers a comprehensive solution for crypto traders who want to optimize portfolio allocation based on cross-asset performance, while also accounting for market regimes. It allows traders to compare multiple altcoins dynamically and allocate capital to the top performers, ensuring the portfolio is always positioned in the most promising assets.
Key Features
1. Dynamic Asset Rotation:
The portfolio constantly evaluates the relative strength of 10 major altcoins: SOLUSD, RUNEUSD, ORDIUSD, DOGEUSDT, ETHUSD, ENAUSDT, RAYUSDT, PENDLEUSD, UNIUSD, and KASUSDT.
Using a ratio matrix, the system selects the strongest asset based on momentum and trend performance, dynamically adjusting the allocation as market conditions change.
2. Long-Only Portfolio with Cash Reserve:
The portfolio only takes long positions or remains in cash. The system does not enter short positions, reducing the risk of exposure during market downturns.
A powerful regime filter ensures the system is inactive during periods of market weakness, defined by the Universal Trend Performance Indicator (TPI) and other market data.
3. Equity Tracking:
The script provides real-time visualizations of portfolio equity compared to buy-and-hold strategies.
Users can compare the performance of the portfolio against holding individual assets (e.g., BTC, ETH) and see the benefits of the dynamic allocation.
4. Performance Metrics:
The system provides key performance metrics such as:
Sharpe Ratio: Measures risk-adjusted returns.
Sortino Ratio: Focuses on downside risk.
Omega Ratio: Evaluates returns relative to risk.
Maximum Drawdown: The maximum observed loss from a peak to a trough.
These metrics allow traders to assess the effectiveness of the strategy versus simply holding the assets.
5. Regime Filter:
The system incorporates a regime filter that evaluates the overall market trend using the TPI and other indicators. If the market is in a downtrend, the system exits positions and moves to cash, avoiding exposure to negative market conditions.
Users can customize the thresholds for the long and short trends to fit their risk tolerance.
6. Customizable Parameters:
Traders can adjust key parameters, such as the backtest start date, starting capital, leverage multiplier, and visualization options, including equity plot colors and line widths.
The system supports different levels of customizations for traders to optimize their strategies.
7. Equity and Buy-and-Hold Comparisons:
This script enables traders to see the side-by-side comparison of the portfolio’s equity curve and the equity curve of a buy-and-hold strategy for each asset.
The comparison allows users to evaluate the performance of the dynamic strategy versus holding the altcoins in isolation.
8. Forward Test (Out-of-Sample Testing):
The system includes a note that the portfolio provides out-of-sample forward tests, ensuring the robustness of the strategy. This is crucial for assessing the portfolio's performance beyond historical backtesting and validating its ability to adapt to future market conditions.
9. Visual Feedback:
The system offers detailed visual feedback on the current asset allocation and performance. Candles are painted according to the trend of the selected assets, and key metrics are displayed in real-time, including the momentum scores for each asset.
10. Alerts and Notifications:
Real-time alerts notify traders when the system changes asset allocations or moves to cash, ensuring they stay informed about portfolio adjustments.
Visual labels on the chart provide instant feedback on which asset is currently leading the portfolio allocation.
How the Rotation Works
The portfolio evaluates 10 different assets and calculates a momentum score for each based on their price action. This score is processed through a ratio matrix, which compares the relative performance of each asset.
Based on the rankings, the portfolio allocates capital to the top performers, ensuring it rotates between the strongest assets while minimizing exposure to underperforming assets.
If no asset shows strong performance, the system defaults to cash to preserve capital.
Final Thoughts
BackQuant’s Cross-Sectional Altcoin Portfolio provides a dynamic and systematic approach to altcoin portfolio management. By employing real-time performance metrics, adaptive scoring, and regime filters, this strategy aims to optimize returns while minimizing exposure to market downturns. The inclusion of out-of-sample forward tests ensures that the system remains robust in live market conditions, making it an ideal tool for crypto traders seeking to enhance their portfolio's performance with a data-driven, momentum-based approach.

Performance Metrics With Bracketed Rebalacing [BackQuant]Performance Metrics With Bracketed Rebalancing
The Performance Metrics With Bracketed Rebalancing script offers a robust method for assessing portfolio performance, integrating advanced portfolio metrics with different rebalancing strategies. With a focus on adaptability, the script allows traders to monitor and adjust portfolio weights, equity, and other key financial metrics dynamically. This script provides a versatile approach for evaluating different trading strategies, considering factors like risk-adjusted returns, volatility, and the impact of portfolio rebalancing.
Please take the time to read the following:
Key Features and Benefits of Portfolio Methods
Bracketed Rebalancing:
Bracketed Rebalancing is an advanced strategy designed to trigger portfolio adjustments when an asset's weight surpasses a predefined threshold. This approach minimizes overexposure to any single asset while maintaining flexibility in response to market changes. The strategy is particularly beneficial for mitigating risks that arise from significant asset weight fluctuations. The following image illustrates how this method reacts when asset weights cross the threshold:
Daily Rebalancing:
Unlike the bracketed method, Daily Rebalancing adjusts portfolio weights every trading day, ensuring consistent asset allocation. This method aims for a more even distribution of portfolio weights, making it a suitable option for traders who prefer less sensitivity to individual asset volatility. Here's an example of Daily Rebalancing in action:
No Rebalancing:
For traders who prefer a passive approach, the "No Rebalancing" option allows the portfolio to remain static, without any adjustments to asset weights. This method may appeal to long-term investors or those who believe in the inherent stability of their selected assets. Here’s how the portfolio looks when no rebalancing is applied:
Portfolio Weights Visualization:
One of the standout features of this script is the visual representation of portfolio weights. With adjustable settings, users can track the current allocation of assets in real-time, making it easier to analyze shifts and trends. The following image shows the real-time weight distribution across three assets:
Rolling Drawdown Plot:
Managing drawdown risk is a critical aspect of portfolio management. The Rolling Drawdown Plot visually tracks the drawdown over time, helping traders monitor the risk exposure and performance relative to the peak equity levels. This feature is essential for assessing the portfolio's resilience during market downturns:
Daily Portfolio Returns:
Tracking daily returns is crucial for evaluating the short-term performance of the portfolio. The script allows users to plot daily portfolio returns to gain insights into daily profit or loss, helping traders stay updated on their portfolio’s progress:
Performance Metrics
Net Profit (%):
This metric represents the total return on investment as a percentage of the initial capital. A positive net profit indicates that the portfolio has gained value over the evaluation period, while a negative value suggests a loss. It's a fundamental indicator of overall portfolio performance.
Maximum Drawdown (Max DD):
Maximum Drawdown measures the largest peak-to-trough decline in portfolio value during a specified period. It quantifies the most significant loss an investor would have experienced if they had invested at the highest point and sold at the lowest point within the timeframe. A smaller Max DD indicates better risk management and less exposure to significant losses.
Annual Mean Returns (% p/y):
This metric calculates the average annual return of the portfolio over the evaluation period. It provides insight into the portfolio's ability to generate returns on an annual basis, aiding in performance comparison with other investment opportunities.
Annual Standard Deviation of Returns (% p/y):
This measure indicates the volatility of the portfolio's returns on an annual basis. A higher standard deviation signifies greater variability in returns, implying higher risk, while a lower value suggests more stable returns.
Variance:
Variance is the square of the standard deviation and provides a measure of the dispersion of returns. It helps in understanding the degree of risk associated with the portfolio's returns.
Sortino Ratio:
The Sortino Ratio is a variation of the Sharpe Ratio that only considers downside risk, focusing on negative volatility. It is calculated as the difference between the portfolio's return and the minimum acceptable return (MAR), divided by the downside deviation. A higher Sortino Ratio indicates better risk-adjusted performance, emphasizing the importance of avoiding negative returns.
Sharpe Ratio:
The Sharpe Ratio measures the portfolio's excess return per unit of total risk, as represented by standard deviation. It is calculated by subtracting the risk-free rate from the portfolio's return and dividing by the standard deviation of the portfolio's excess return. A higher Sharpe Ratio indicates more favorable risk-adjusted returns.
Omega Ratio:
The Omega Ratio evaluates the probability of achieving returns above a certain threshold relative to the probability of experiencing returns below that threshold. It is calculated by dividing the cumulative probability of positive returns by the cumulative probability of negative returns. An Omega Ratio greater than 1 indicates a higher likelihood of achieving favorable returns.
Gain-to-Pain Ratio:
The Gain-to-Pain Ratio measures the return per unit of risk, focusing on the magnitude of gains relative to the severity of losses. It is calculated by dividing the total gains by the total losses experienced during the evaluation period. A higher ratio suggests a more favorable balance between reward and risk.
www.linkedin.com
Compound Annual Growth Rate (CAGR) (% p/y):
CAGR represents the mean annual growth rate of the portfolio over a specified period, assuming the investment has been compounding over that time. It provides a smoothed annual rate of growth, eliminating the effects of volatility and offering a clearer picture of long-term performance.
Portfolio Alpha (% p/y):
Portfolio Alpha measures the portfolio's performance relative to a benchmark index, adjusting for risk. It is calculated using the Capital Asset Pricing Model (CAPM) and represents the excess return of the portfolio over the expected return based on its beta and the benchmark's performance. A positive alpha indicates outperformance, while a negative alpha suggests underperformance.
Portfolio Beta:
Portfolio Beta assesses the portfolio's sensitivity to market movements, indicating its exposure to systematic risk. A beta greater than 1 suggests the portfolio is more volatile than the market, while a beta less than 1 indicates lower volatility. Beta is used to understand the portfolio's potential for gains or losses in relation to market fluctuations.
Skewness of Returns:
Skewness measures the asymmetry of the return distribution. A positive skew indicates a distribution with a long right tail, suggesting more frequent small losses and fewer large gains. A negative skew indicates a long left tail, implying more frequent small gains and fewer large losses. Understanding skewness helps in assessing the likelihood of extreme outcomes.
Value at Risk (VaR) 95th Percentile:
VaR at the 95th percentile estimates the maximum potential loss over a specified period, given a 95% confidence level. It provides a threshold value such that there is a 95% probability that the portfolio will not experience a loss greater than this amount.
Conditional Value at Risk (CVaR):
CVaR, also known as Expected Shortfall, measures the average loss exceeding the VaR threshold. It provides insight into the tail risk of the portfolio, indicating the expected loss in the worst-case scenarios beyond the VaR level.
These metrics collectively offer a comprehensive view of the portfolio's performance, risk exposure, and efficiency. By analyzing these indicators, investors can make informed decisions, balancing potential returns with acceptable levels of risk.
Conclusion
The Performance Metrics With Bracketed Rebalancing script provides a comprehensive framework for evaluating and optimizing portfolio performance. By integrating advanced metrics, adaptive rebalancing strategies, and visual analytics, it empowers traders to make informed decisions in managing their investment portfolios. However, it's crucial to consider the implications of rebalancing strategies, as academic research indicates that predictable rebalancing can lead to market impact costs. Therefore, adopting flexible and less predictable rebalancing approaches may enhance portfolio performance and reduce associated costs.

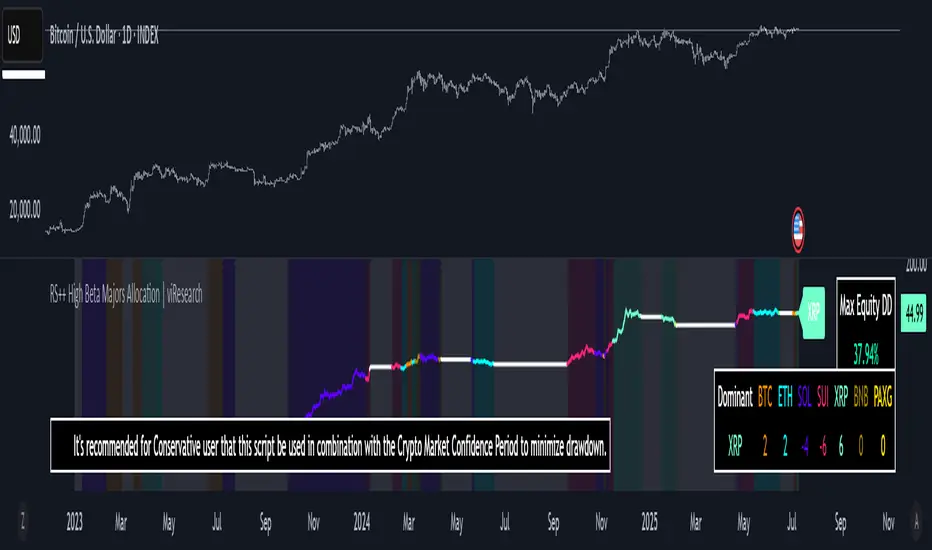
RS++ High Beta Majors Allocation | viResearchRS++ High Beta Majors Allocation | viResearch
Conceptual Foundation and Innovation
The "RS++ High Beta Majors Allocation" is a next-generation portfolio rotation algorithm designed to capture alpha from high-volatility (high-beta) crypto assets. Building on the RS+ framework, this strategy expands the asset pool beyond BTC, ETH, and SOL to include newer and more volatile contenders like SUI and XRP. The goal is to rotate dynamically among these five majors—allocating to the strongest trending asset while minimizing exposure during broad-market weakness.
The strategy introduces enhanced comparative scoring using a multi-layered relative strength matrix that accounts for cross-asset momentum in real-time. Combined with a regime-based trend filter, it adapts not only to market leadership but also to prevailing risk conditions, significantly improving capital efficiency over traditional buy-and-hold strategies.
Technical Composition and Calculation
At the heart of the RS++ model lies a sophisticated five-asset ratio matrix. Each asset is evaluated against the others using relative price ratios, and each pair is scored through a hybrid strength model based on universal trend filters and statistical thresholds.
Expanded Universe: The script evaluates BTC, ETH, SOL, SUI, and XRP—each chosen for their liquidity and volatility profile, enhancing the potential for outperformance.
Relative Strength Matrix: A 5x5 matrix compares all assets against one another to determine momentum dominance. The asset with the highest cumulative score is considered the dominant major.
Trend Regime Filter: Before allocation, both the market regime (via BTC or a custom source) and the individual asset must pass trend confirmation to qualify for inclusion, reducing whipsaw exposure.
Equity Tracking: A real-time system equity line tracks portfolio performance from a custom user-defined start date.
Drawdown Measurement: Maximum drawdown is computed in real-time to assess risk exposure.
Performance Metrics
The script measures key quantitative metrics to evaluate performance robustness:
Max Drawdown: Assesses capital risk and largest equity dip from peak to trough.
Sharpe/Sortino/Omega Ratios (optional in previous versions): Can be adapted for future inclusion.
ROC-Based Returns: Allocation logic and equity growth are tied to ROC (rate of change), making it highly responsive to price action.
User Interface and Features
This version introduces user-centric customization and quality-of-life improvements:
Asset Toggle via Tickers: Simply switch any ticker to "USDT" to exclude it from the rotation universe.
Equity Chart Overlay: Real-time equity plotted with color-coded trend backgrounds for easy interpretation of active holdings.
Dominant Asset Panel: A dashboard displays the currently allocated asset and scores of all assets for comparative insights.
Usage Recommendation: The script includes an embedded suggestion to pair this strategy with the Crypto Market Confidence Period indicator for even better macro-filtering.
Timeframe Guardrail: A soft enforcement feature suggests usage on the 1D timeframe for optimal accuracy.
Practical Applications
This strategy is ideal for traders who prefer a tactical, risk-managed approach to high-beta crypto portfolios. Use cases include:
Active Rotation Management: Switches capital between the strongest trending assets to capture momentum across cycles.
Macro Regime Sensitivity: The trend filter avoids allocation during weak macro trends, moving to cash and preserving equity.
High-Volatility Environments: Particularly effective in bull phases or during sector rotations where traditional assets underperform.
Strategic Value and Advantages
The RS++ script blends alpha-generation with institutional-level risk filtering, making it a powerful tool for active portfolio managers. The expanded universe allows for exposure to emerging market leaders while the scoring and filtering mechanism ensures trades are made with precision. Real-time equity visualization and intuitive alerts help traders stay aligned with system output without constant screen-watching.
Summary and Usage Tips
The "RS++ High Beta Majors Allocation" script offers a versatile and powerful method for crypto portfolio allocation with an emphasis on dynamic strength, risk control, and adaptability. Traders are encouraged to:
Use the recommended 1D timeframe for stability.
Pair the strategy with macro filters like the Crypto Market Confidence Period.
As always, backtest thoroughly and remember that no model guarantees future performance. Use this tool as part of a broader risk-managed trading framework.
LBM - Advanced StrategiesGeneral Operation
This indicator combines 5 configurable moving averages with up to 5 customizable trading strategies. The moving averages are plotted on the chart and the strategies generate buy and sell signals based on user-defined conditions.
Buy Strategy Configuration (and Automatic Inverse Sell)
For each strategy (1 to 5), you can configure:
Enable/Disable : Activates or deactivates the strategy
Source A : Selects the first element for comparison (can be one of the MAs, High, Low, Close or Open)
Operator : Chooses the comparison condition (>; >=; =; <=; <; Crossover; Crossunder)
Source B: Selects the second element for comparison
Connector : Defines how the strategy connects with previous ones (AND, OR, etc.)
Important about sells: Sell conditions are automatically the opposite of buy conditions. For example:
If buy is triggered when MA1 > MA2, sell will be when MA1 < MA2
If buy uses a "Crossover", sell will use a "Crossunder" (and vice versa)
Practical Example
If you configure:
Strategy 1: Source A = Close, Operator = ">", Source B = MA1
This means:
BUY signal when closing price is ABOVE MA1
SELL signal when closing price is BELOW MA1 (automatic opposite)
Visualization
Green downward triangles indicate buy signals
Red upward triangles indicate sell signals
Moving averages are plotted with different colors for easy identification
The indicator allows combining multiple strategies with complex conditional logic (AND/OR) to create customized trading systems.

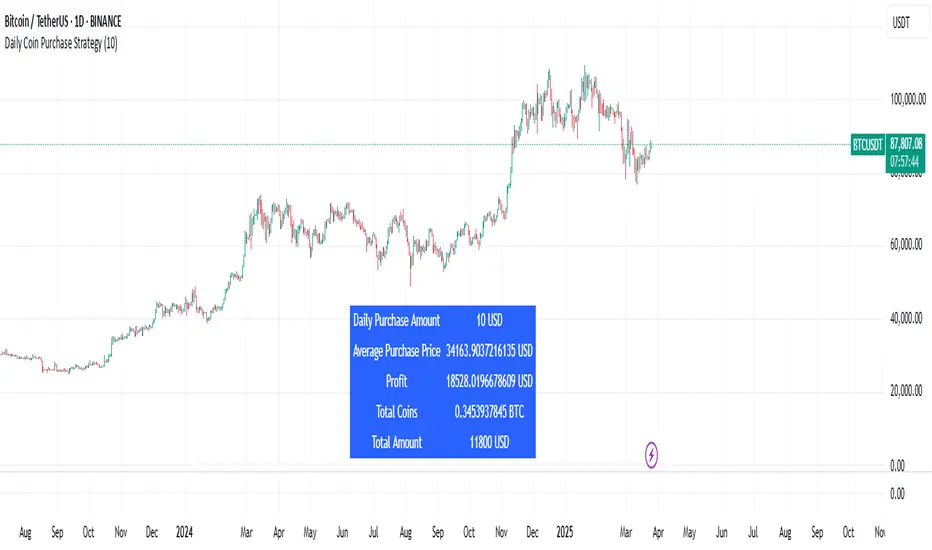
Daily Coin Purchase StrategyThis indicator helps investors track the profitability of their Dollar-Cost Averaging (DCA) strategy when buying crypto assets periodically over time. Users can customize the start date, purchase amount per cycle, and the frequency of purchases based on different timeframes (e.g., 15m, 1H, 4H, 1D).
Features:
✅ Flexible Configuration: Allows users to set the start date, purchase amount per cycle, and select the desired timeframe (15m, 1H, 4H, 1D, etc.).
✅ Automated Profit Calculation: Displays total investment, total coins accumulated, average cost per coin, and profit based on the current market price.
✅ Supports Multiple Timeframes: Users can choose to buy at intervals based on 15m, 1H, 4H, or 1D candlesticks.
✅ Helps Plan Investment Capital: Calculates the total capital needed to follow a DCA strategy over a given period, allowing for better financial planning.
✅ Visualizes Investment Profitability: Provides clear insights into the accumulation process and the overall performance of the strategy.
✅ Intuitive Charts: Displays the accumulation process and investment performance over time.
How to Use:
Set the start date for purchases.
Enter the desired amount to invest per cycle.
Select the timeframe for purchases (15m, 1H, 4H, 1D, etc.).
The indicator will automatically calculate the number of coins accumulated, the average cost per coin, and the overall profit.
🔹 Use Cases:
Monitor the effectiveness of the DCA strategy over time.
Compare profitability across different purchase intervals.
Optimize long-term asset accumulation strategies.
Plan financial resources effectively for long-term investment strategies.
This version keeps all the key details while ensuring clarity and accuracy. Let me know if you need any modifications! 🚀
SMA Strategy Builder: Create & Prove Profitability📄 Pine Script Strategy Description (For Publishing on TradingView)
🎯 Strategy Title:
SMA Strategy Builder: Create & Prove Profitability
✨ Description:
This tool is designed for traders who want to build, customize, and prove their own SMA-based trading strategies. The strategy tracks capital growth in real-time, providing clear evidence of profitability after each trade. Users can adjust key parameters such as SMA period, take profit levels, and initial capital, making it a flexible solution for backtesting and strategy validation.
🔍 Key Features:
✅ SMA-Based Logic:
Core trading logic revolves around the Simple Moving Average (SMA).
SMA period is fully adjustable to suit various trading styles.
🎯 Customizable Take Profit (TP):
User-defined TP percentages per position.
TP line displayed as a Step Line with Breaks for clear segmentation.
Visual 🎯TP label for quick identification of profit targets.
💵 Capital Tracking (Proof of Profitability):
Initial capital is user-defined.
Capital balance updates after each closed trade.
Shows both absolute profit/loss and percentage changes for every position.
Darker green profit labels for better readability and dark red for losses.
📈 Capital Curve (Performance Visualization):
Capital growth curve available (hidden by default, can be enabled via settings).
📏 Dynamic Label Positioning:
Label positions adjust dynamically based on the price range.
Ensures consistent visibility across low and high-priced assets.
⚡ How It Works:
Long Entry:
Triggered when the price crosses above the SMA.
TP level is calculated as a user-defined percentage above the entry price.
Short Entry:
Triggered when the price crosses below the SMA.
TP level is calculated as a user-defined percentage below the entry price.
TP Execution:
Positions close immediately once the TP level is reached (no candle close confirmation needed).
🔔 Alerts:
🟩 Long Signal Alert: When the price crosses above the SMA.
🟥 Short Signal Alert: When the price crosses below the SMA.
🎯 TP Alert: When the TP target is reached.
⚙️ Customization Options:
📅 SMA Period: Choose the moving average period that best fits your strategy.
🎯 Take Profit (%): Adjust TP percentages for flexible risk management.
💵 Initial Capital: Set the starting capital for realistic backtesting.
📈 Capital Curve Toggle: Enable or disable the capital curve to track overall performance.
🌟 Why Use This Tool?
🔧 Flexible Strategy Creation: Adjust core parameters and create tailored SMA-based strategies.
📈 Performance Proof: Capital tracking acts as real proof of profitability after each trade.
🎯 Immediate TP Execution: No waiting for candle closures; profits lock in as soon as targets are hit.
💹 Comprehensive Performance Insights: Percentage-based and absolute capital tracking with dynamic visualization.
🏦 Clean Visual Indicators: Strategy insights made clear with dynamic labeling and adjustable visuals.
⚠️ Disclaimer:
This script is provided for educational and informational purposes only. Trading financial instruments carries risk, and past performance does not guarantee future results. Always perform your own due diligence before making any trading decisions.

Bollinger Bands Reversal Strategy Analyzer█ OVERVIEW
The Bollinger Bands Reversal Overlay is a versatile trading tool designed to help traders identify potential reversal opportunities using Bollinger Bands. It provides visual signals, performance metrics, and a detailed table to analyze the effectiveness of reversal-based strategies over a user-defined lookback period.
█ KEY FEATURES
Bollinger Bands Calculation
The indicator calculates the standard Bollinger Bands, consisting of:
A middle band (basis) as the Simple Moving Average (SMA) of the closing price.
An upper band as the basis plus a multiple of the standard deviation.
A lower band as the basis minus a multiple of the standard deviation.
Users can customize the length of the Bollinger Bands and the multiplier for the standard deviation.
Reversal Signals
The indicator identifies potential reversal signals based on the interaction between the price and the Bollinger Bands.
Two entry strategies are available:
Revert Cross: Waits for the price to close back above the lower band (for longs) or below the upper band (for shorts) after crossing it.
Cross Threshold: Triggers a signal as soon as the price crosses the lower band (for longs) or the upper band (for shorts).
Trade Direction
Users can select a trade bias:
Long: Focuses on bullish reversal signals.
Short: Focuses on bearish reversal signals.
Performance Metrics
The indicator calculates and displays the performance of trades over a user-defined lookback period ( barLookback ).
Metrics include:
Win Rate: The percentage of trades that were profitable.
Mean Return: The average return across all trades.
Median Return: The median return across all trades.
These metrics are calculated for each bar in the lookback period, providing insights into the strategy's performance over time.
Visual Signals
The indicator plots buy and sell signals on the chart:
Buy Signals: Displayed as green triangles below the price bars.
Sell Signals: Displayed as red triangles above the price bars.
Performance Table
A customizable table is displayed on the chart, showing the performance metrics for each bar in the lookback period.
The table includes:
Win Rate: Highlighted with gradient colors (green for high win rates, red for low win rates).
Mean Return: Colored based on profitability (green for positive returns, red for negative returns).
Median Return: Colored similarly to the mean return.
Time Filtering
Users can define a specific time window for the indicator to analyze trades, ensuring that performance metrics are calculated only for the desired period.
Customizable Display
The table's font size can be adjusted to suit the user's preference, with options for "Auto," "Small," "Normal," and "Large."
█ PURPOSE
The Bollinger Bands Reversal Overlay is designed to:
Help traders identify high-probability reversal opportunities using Bollinger Bands.
Provide actionable insights into the performance of reversal-based strategies.
Enable users to backtest and optimize their trading strategies by analyzing historical performance metrics.
█ IDEAL USERS
Swing Traders: Looking for reversal opportunities within a trend.
Mean Reversion Traders: Interested in trading price reversals to the mean.
Strategy Developers: Seeking to backtest and refine Bollinger Bands-based strategies.
Performance Analysts: Wanting to evaluate the effectiveness of reversal signals over time.

Bullrun Profit Maximizer [QuantraSystems]Bullrun Profit Maximizer
Quantra Systems guarantees that the information created and published within this document and on the Tradingview platform is fully compliant with applicable regulations, does not constitute investment advice, and is not exclusively intended for qualified investors.
Important Note!
The system equity curve presented here has been generated as part of the process of testing and verifying the methodology behind this script.
Crucially, it was developed after the system was conceptualized, designed, and created, which helps to mitigate the risk of overfitting to historical data. In other words, the system was built for robustness, not for simply optimizing past performance.
This ensures that the system is less likely to degrade in performance over time, compared to hyper optimized systems that are tailored to past data. No tweaks or optimizations were made to this system post backtest.
Even More Important Note!!
The nature of markets is that they change quickly and unpredictably. Past performance does not guarantee future results - this is a fundamental rule in trading and investing.
While this system is designed with broad, flexible conditions to adapt quickly to a range of market environments, it is essential to understand that no assumptions should be made about future returns based on historical data. Markets are inherently uncertain, and this system - like all trading systems - cannot predict future outcomes.
Introduction
The "Adaptive Pairwise Momentum System" is not a prototype to the Bullrun Profit Maximizer (BPM) . The Bullrun Profit Maximizer is a fully re-engineered, higher frequency momentum system.
The Bullrun Profit Maximizer (BPM) uses a completely different filter logic and refines momentum calculations, specifically to support higher frequency trading on Crypto's Blue Chip assets. It correctly calculates fees and slippage by compounding them against System Profit before plotting the equity curve.
Unlike prior systems, this script utilizes a completely new filter logic and refined momentum calculation, specifically built to support higher frequency trading on blue-chip assets, while minimizing the impact of fees and slippage.
While the APMS focuses on Macro Trend Alignment, the BPM instead applies an equity curve based filter, allowing for targeted precision on the current asset’s trend without relying on broader market conditions. This approach delivers more responsive and asset specific signals, enhancing agility in today’s fast paced crypto markets.
The BPM dynamically optimizes capital allocation across up to four high performing assets, ensuring that the portfolio adapts swiftly to changing market conditions. The system logic consists of sophisticated quantitative methods, rapid momentum analysis and alpha cyclicality/seasonality optimizations. The overarching goal is to ensure that the portfolio is always invested in the highest performing asset based on dynamic market conditions, while at the same time managing risk through rapid asset filters and internal mechanisms like alpha cyclicality, volatility and beta analysis.
In addition to these core functionalities, the BPM comes with the typical Quantra Systems UI design, structured to reduce data clutter and provide users with only the most essential, impactful information. The BPM UI format delivers clear and easy to read signals. It enables rapid decision making in a high frequency environment without compromising on depth or accuracy.
Bespoke Logic Filtering with Equity Curve Precision
The BPM script utilizes a completely new methodology and focuses on intraday rotations of blue-chip crypto assets, while previously built systems were designed with a longer term focus in mind.
In response to the need for more precise signal generation, the BPM replaces the previous macro trend filter with a new, highly specific equity curve activation filter. This unique logic filter is driven solely by the performance trends of the asset currently held by the system. By analyzing the equity curve directly, this system can make more targeted, timely allocations based on asset specific momentum, allowing for quick adjustments that are more relevant to the held asset rather than general market conditions.
The benefits of this new, unique approach are twofold: first, it avoids premature allocation shifts based on broader macro movements, and second, it enables the system to adapt dynamically to the performance of each asset individually. This asset specific filtering allows traders to capitalize on localized strength within individual blue-chip cryptoassets without being affected by lags in the overall market trend.
High Frequency Momentum Calculation for Enhanced Flexibility
The BPM incorporates a newly designed momentum calculation that increases its suitability across lower timeframes. This new momentum indicator captures and processes more data points within a shorter window than ever before, rather than extending bar intervals and potentially losing high frequency detail. This creates a smooth, data rich featureset that is especially suited for blue-chip assets, where liquidity reduces slippage and fees, making higher frequency trading viable.
By retaining more data, this system captures subtle shifts in momentum more effectively than traditional approaches, offering higher resolution insights. These modifications result in a system capable of generating highly responsive signals on faster timeframes, empowering traders to act quickly in volatile markets.
User Interface and Enhanced Readability
The BPM also features a reimagined, streamlined user interface, making it easier than ever to monitor essential signals at a glance. The new layout minimizes extraneous data points in the tables, leaving only the most actionable information for traders. This cleaner presentation is purpose built to help traders identify the strongest asset in real time, with clear, color coded signals to facilitate swift decision making in fast moving markets.
Equity Stats Table : Designed for clarity, the stats table focuses on the current allocation’s performance metrics, emphasizing the most critical metrics without unnecessary clutter.
Color Coded Highlights : The interface includes the option to highlight both the current top performing asset, and historical allocations - with indicators of momentum shifts and performance metrics readily accessible.
Clear Signals : Visual cues are presented in an enhanced way to improve readability, including simplified line coloring, and improve visualization of the outperforming assets in the allocation table.
Dynamic Asset Reallocation
The BPM dynamically allocates capital to the strongest performing asset in a selected pool. This system incorporates a re-engineered, pairwise momentum measurement designed to operate at higher frequencies. The system evaluates each asset against others in real time, ensuring only the highest momentum asset receives allocation. This approach keeps the portfolio positioned for maximum efficiency, with an updated weighting logic that favors assets showing both strength and sustainability.
Position Changes and Slippage Calculation
Position changes are optimized for faster reallocation, with realistic slippage and fee calculations factored into each trade. The system’s structure minimizes the impact of these costs on blue-chip assets, allowing for more active management on short timeframes without incurring significant drag on performance.
A Special Note on Fees + Slippage
In the image above, the system has been applied to four different timeframes - 12h, 8h, 4h and 1h - using identical settings and a selected slippage and fees amount of 0.2%. In this stress test, we isolate the choppy downwards period from the previous Bitcoin all time high - set in March 2024, to the current date where Bitcoin is currently sitting at around the same level.
This illustrates an important concept: starting at the 12h, the system performed better as the timeframes decreased. In fact, only on the 4hr chart did the system equity curve make a new all time high alongside Bitcoin. It is worth noting that market phases that are “non-trending” are generally the least profitable periods to use a momentum/trend system - as most systems will get caught by false momentum and will “buy the top,” and then proceed to “sell the bottom.”
Lower timeframes typically offer more data points for the algorithm to compute over, and enable quicker entries and exits within a robust system, often reducing downside risk and compounding gains more effectively - in all market environments.
However, slippage, fees, and execution constraints are still limiting factors. Although blue-chip cryptocurrencies are more liquid and can be traded with lower fees compared to low cap assets, frequent trading on lower timeframes incurs cumulative slippage costs. With the BPM system set to a realistic slippage rate of 0.2% per trade, this example emphasizes how even lower fees impact performance as trade frequency increases.
Finding the optimal balance between timeframe and slippage impact requires careful consideration of factors such as portfolio size, liquidity of selected tokens, execution speed, and the fee rate of the exchange you execute trades on.
Number of Position Changes
Understanding the number of position changes in a strategy is critical to assessing its feasibility in real world trading. Frequent position changes can lead to increased costs due to slippage and fees. Monitoring the number of position changes provides insight into the system’s behavior - helping to evaluate how active the strategy is and whether it aligns with the trader's desired time input for position management.
Equity Curve and Performance Calculations
To provide a benchmark, the script also generates a Buy-and-Hold (or "HODL") equity curve that represents a 100% allocation to Bitcoin, the highest market cap cryptoasset. This allows users to easily compare the performance of the dynamic rotation system with that of a more traditional investment strategy.
The script tracks key performance metrics for both the dynamic portfolio and the HODL strategy, including:
Sharpe Ratio
The Sharpe Ratio is a key metric that evaluates a portfolio’s risk adjusted return by comparing its ‘excess’ return to its volatility. Traditionally, the Sharpe Ratio measures returns relative to a risk-free rate. However, in our system’s calculation, we omit the risk-free rate and instead measure returns above a benchmark of 0%. This adjustment provides a more universal comparison, especially in the context of highly volatile assets like cryptocurrencies, where a traditional risk-free benchmark, such as the usual 3-month T-bills, is often irrelevant or too distant from the realities of the crypto market.
By using 0% as the baseline, we focus purely on the strategy's ability to generate raw returns in the face of market risk, which makes it easier to compare performance across different strategies or asset classes. In an environment like cryptocurrency, where volatility can be extreme, the importance of relative return against a highly volatile backdrop outweighs comparisons to a risk-free rate that bears little resemblance to the risk profile of digital assets.
Sortino Ratio
The Sortino Ratio improves upon the Sharpe Ratio by specifically targeting downside risk and leaves the upside potential untouched. In contrast to the Sharpe Ratio (which penalizes both upside and downside volatility), the Sortino Ratio focuses only on negative return deviations. This makes it a more suitable metric for evaluating strategies like the Bullrun Profit Maximizer - that aim to minimize drawdowns without restricting upside capture. By measuring returns relative to a 0% baseline, the Sortino ratio provides a clearer assessment of how well the system generates gains while avoiding substantial losses in highly volatile markets like crypto.
Omega Ratio
The Omega Ratio is calculated as the ratio of gains to losses across all return thresholds, providing a more complete view of how the system balances upside and downside risk even compared to the Sortino Ratio. While it achieves a similar outcome to the Sortino Ratio by emphasizing the system's ability to capture gains while limiting losses, it is technically a mathematically superior method. However, we include both the Omega and Sortino ratios in our metric table, as the Sortino Ratio remains more widely recognized and commonly understood by traders and investors of all levels.
Usage Summary:
While the backtests in this description are generated as if a trader held a portfolio of just the strongest tokens, this was mainly designed as a method of logical verification and not a recommended investment strategy. In practice, this system can be used in multiple ways.
It can be used as above, or as a factor in forming part of a broader asset selection tool, or even a method of filtering tokens by strength in order to inform a day trader which tokens might be optimal to look at, for long-only trading setups on an intrabar timeframe.
Summary
The Bullrun Profit Maximizer is an advanced tool tailored for traders, offering the precision and agility required in today’s markets. With its asset specific equity curve filter, reworked momentum analysis, and streamlined user interface, this system is engineered to maximize gains and minimize risk during bullmarkets, with a strong focus on risk adjusted performance.
Its refined approach, focused on high resolution data processing and adaptive reallocation, makes it a powerful choice for traders looking to capture high quality trends on clue-chip assets, no matter the market’s pace.

FS Scorpion TailKey Features & Components:
1. Custom Date & Chart-Based Controls
The software allows users to define whether they want signals to start on a specific date (useSpecificDate) or base calculations on the visible chart’s range (useRelativeScreenSumLeft and useRelativeScreenSumRight).
Users can input the number of stocks to buy/sell per signal and decide whether to sell only for profit.
2. Technical Indicators Used
EMA (Exponential Moving Average): Users can define the length of the EMA and specify if buy/sell signals should occur when the EMA is rising or falling.
MACD (Moving Average Convergence Divergence): MACD crossovers, slopes of the MACD line, signal line, and histogram are used for generating buy/sell signals.
ATR (Average True Range): Signals are generated based on rising or falling ATR.
Aroon Indicator: Buy and sell signals are based on the behavior of the Aroon upper and lower lines.
RSI (Relative Strength Index): Tracks whether the RSI and its moving average are rising or falling to generate signals.
Bollinger Bands: Buy/sell signals depend on the basis, upper, and lower band behavior (rising or falling).
3. Signal Detection
The software creates arrays for each indicator to store conditions for buy/sell signals.
The allTrue() function checks whether all conditions for buy/sell signals are true, ensuring that only valid signals are plotted.
Signals are differentiated between buy-only, sell-only, and both buy and sell (dual signal).
4. Visual Indicators
Vertical Lines: When buy, sell, or dual signals are detected, vertical lines are drawn at the corresponding bar with configurable colors (green for buy, red for sell, silver for dual).
Buy/Sell Labels: Visual labels are plotted directly on the chart to denote buy or sell signals, allowing for clear interpretation of the strategy.
5. Cash Flow & Metrics Display
The software maintains an internal ledger of how many stocks are bought/sold, their prices, and whether a profit is being made.
A table is displayed at the bottom right of the chart, showing:
Initial investment
Current stocks owned
Last buy price
Market stake
Net profit
The table background turns green for profit and red for loss.
6. Dynamic Decision Making
Buy Condition: If a valid buy signal is generated, the software decrements the cash balance and adds stocks to the inventory.
Sell Condition: If the sell signal is valid (and meets the profit requirement), stocks are sold, and cash is incremented.
A fallback check ensures the sell logic prevents selling more stocks than are available and adjusts stock holding appropriately (e.g., sell half).
Customization and Usage
Indicator Adjustments: The user can choose which indicators to activate (e.g., EMA, MACD, RSI) via input controls. Each indicator has specific customizable parameters such as lengths, slopes, and conditions.
Signal Flexibility: The user can adjust conditions for buying and selling based on various technical indicators, which adds flexibility in implementing trading strategies. For example, users may require the RSI to be higher than its moving average or trigger sales only when MACD crosses under the signal line.
Profit Sensitivity: The software allows the option to sell only when a profit is assured by checking if the current price is higher than the last buy price.
Summary of Usage:
Indicator Selection: Enable or disable technical indicators like EMA, MACD, RSI, Aroon, ATR, and Bollinger Bands to fit your trading strategy.
Custom Date/Chart Settings: Choose whether to calculate based on specific time ranges or visible portions of the chart.
Dynamic Signal Plotting: Once buy or sell conditions are met, the software will visually plot signals on your chart, giving clear entry and exit points.
Investment Tracking: Real-time tracking of stock quantities, investments, and profit ensures a clear view of your trading performance.
Backtesting: Use this software for backtesting your strategy by analyzing how buy and sell signals would have performed historically based on the chosen indicators.
Conclusion
The FS Scorpion Tail software is a robust and flexible trading tool, allowing traders to develop custom strategies based on multiple well-known technical indicators. Its visual aid, coupled with real-time investment tracking, makes it valuable for systematic traders looking to automate or refine their trading approach.
