SuperTrend OscillatorVersion 3: Improved aesthetically, complete turnaround for the strategy with which to use this indicator.
Once again, thanks to BlindFreddy and ChrisMoody for the bits of code that were assembled into this indicator.
Make the chart yours using the share button for the indicator with barcolors functionality.
Changes from v2 and looking forward: Indicator now uses a 14 length SuperTrend with no ATR multiplier. This my preferred use and I'd be grateful to hear your case for a different length/multiplier. Removed the Bollinger Bands and retracement dots due to these being gimmicky and marginally useful. There may be a version 4 should a similar concept using a rate of change analysis turn out to be useful. I have also tried -in vain- to plot internal trend peaks as horizontal S/R levels. Please pm if you are willing to help in that respect.
Strategy: The indicator will display the trend as a red/green area. It measures the spread between the closing price and the SuperTrend line, much like a CCI (close and ma). When the area contracts warning bars of the opposite trend color will warn of a reversal. When this happens, these areas will either be defended, reviving the trend, or will break, causing a trend flip. SuperTrend is unique in that breaks are typically large candles, and that its levels, especially on Weekly, Daily, Hourly, Minute timeframes, these levels will be defended (think similar to a 200sma or a 21ema). The STO making new highs within (internal) a trend is an overextension sign.
CVX Example: This is not a full analysis of CVX's stock, just an example potential trades. On the posted chart I used a weekly and a daily STO.
Long 1:The weekly showed warnings and then flipped. The daily made a double bottom, showed warnings and then flipped the daily STO at trendline support.
Long 2:The weekly still shows an uptrend, the daily made a weak break to downtrend and reversed back upwards at trendline support, forming a double bottom. Note the conservative exit when the STO made an internal new high.
Long 3: looking forward on CVX stock, the current downtrend made a weak break and is showing sings of reversal (pin bar) at horizontal support. Go long on flip of the daily (conservative) or flip of the hourly (aggressive).
Cari skrip untuk "the strat"

CM Stochastic POP Method 2-Jake Bernstein_V1Yesterday Jake Bernstein authorized me to post his updated results with the Stochastic Pop Trading System he developed many years ago.
You can take a look at the Original System with Updated Settings at
This indicator is a different set of rules Jake mentioned in the PDF he allowed me to post.
To view the PDF use this link:
dl.dropboxusercontent.com
Today we’re releasing the version described in the PDF that uses the StochK values of 55, 50, and 45. The rules are discussed in the PDF but here is a simple breakdown:
Enter Long when StochK is below 50 and Crosses Above 55
Exit Long on Cross Below 55
Enter Short when StochK is Above 50 and crosses Below 45
Exit Short on Cross Above 45
Two Important Items to understand about this method:
To code the rules Precisely we need a function that will be available when Strategy Capabilities are released on TradingView.
There is one of Jakes Profit Maximizing Strategies that needs to be integrated with this code…which again we need the Strategy based Function that will be coming soon.
To Compare this system to the Stochastic Pop Method 1 System shown yesterday at I used the same Symbol and dates for you to compare…but remember to give this Method 2 System a Fair Look/Evaluation…we need the Soon To Be Released…TradingView Strategy Capabilities.
BackTesting Results Example: EUR-USD Daily Chart Since 01/01/2005
Strategy 1 – Stochastic Pop Method 2 System:
Go Long When Stochasticis below 50 and Crosses Above 55. Go Short When Stochastic is above 50 and Crosses Below 45. Exit Long/Short When Stochastic has a Reverse Cross of Entry Value.
Results:
Total Trades = 151
Profit = 40,758 Pips
Win% = 37.1%
Profit Factor = 1.26
Avg Trade = 270 Pips Profit
***Most Consecutive Wins = 4 ... Most Consecutive Losses = 7
Strategy 2:
Rules - Proprietary Optimization Jake Will Teach. Only Added 1 Additional Exit Rule.
Results:
Total Trades = 151
Profit = 60.305 Pips
Win% = 37.1%
Profit Factor = 1.38
Avg Trade = 399 Pips Profit
***Most Consecutive Wins = 4 ... Most Consecutive Losses = 7
Indicator Includes:
-Ability to Color Candles (CheckBox In Inputs Tab)
Green = Long Trade
Blue = No Trade
Red = Short Trade
Jake Bernstein will be a contributor on TradingView when Backtesting/Strategies are released. Jake is one of the Top Trading System Developers in the world with 45+ years experience and he is going to teach TradingView.com’s community how to create Trading Systems and how to Optimize the correct way.
Link To PDF:
dl.dropboxusercontent.com
Link to Original Version of Indicator with Updated Settings.

UCS_S_Steve Primo - Strategy #5 (FOREX Only)Here we have another Steve Primo Strategy ( #5)
This is a short term, trend continuation strategy, Recommend using this on 30 Mins + time frames.
I have added few things.
1. PET-D filter, to identify the trend along with the SMA 50. ----> Setup in line with PET-D (EMA,15) trend confirmation.
2. Option for Harami Candle identification (may not be Steve Primo Setup), There is no evidence on any of the videos listed below for Harami or other candlesticks pattern.
Future - Planned to add other candle patterns.
Videos from Youtube
1. www.youtube.com -
2. www.youtube.com - Hints disclosed on this video.
3. www.youtube.com - Claims this is his GO TO strategy for FOREX.
4. www.youtube.com - Complete Free Lesson.
Note - I did not buy this Strategy, I do not own in any way shape or form of this strategy as presented in the videos, The Strategy I am posting is my interpretation based on Steve Primo's videos listed above and few more on youtube.
Good Luck folks.

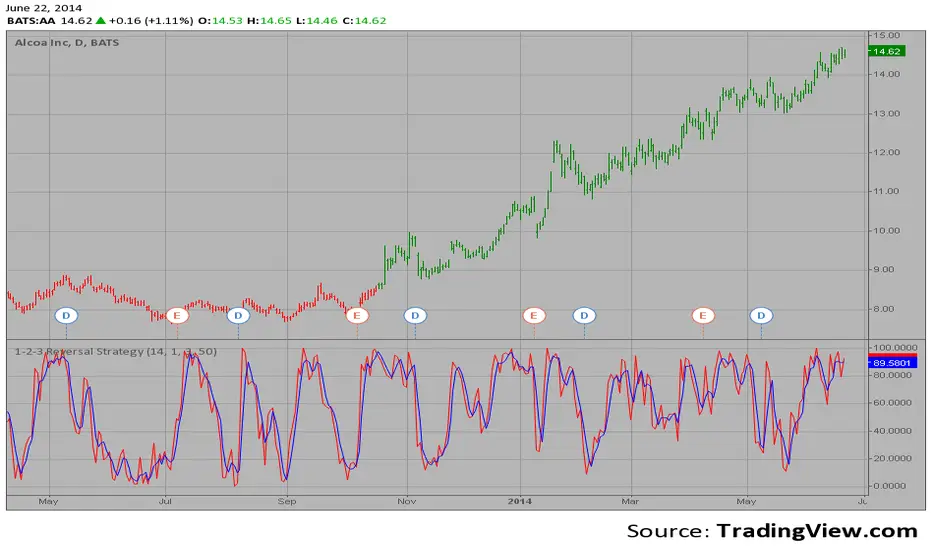
1-2-3 Reversal Strategy This System was created from the Book "How I Tripled My Money In The
Futures Market" by Ulf Jensen, Page 183. This is reverse type of strategies.
The strategy buys at market, if close price is higher than the previous close
during 2 days and the meaning of 9-days Stochastic Slow Oscillator is lower than 50.
The strategy sells at market, if close price is lower than the previous close price
during 2 days and the meaning of 9-days Stochastic Fast Oscillator is higher than 50.
RSI MA Cross + Divergence Signal (fixed)🔹 Core Logic
RSI + Moving Average
The script calculates a standard RSI (default 14).
It then overlays a moving average (SMA/EMA/WMA, default 9).
When RSI crosses above its MA → bullish momentum.
When RSI crosses below its MA → bearish momentum.
Divergence Filter
Signals are only valid if there’s confirmed divergence:
Bullish divergence: Price makes a lower low, RSI makes a higher low.
Bearish divergence: Price makes a higher high, RSI makes a lower high.
Overbought / Oversold Filter
Optional extra:
Bullish signals only valid if RSI ≤ 30 (oversold).
Bearish signals only valid if RSI ≥ 70 (overbought).
This ensures signals happen in “stretched” conditions.
Risk & Trade Management
Entries taken only when all conditions align.
Exits can be managed with ATR stops, partial take-profits, breakeven moves, and trailing stops (we coded these in the strategy version).
Cooldown, session filters, and daily loss guard to keep risk tight.
🔹 Strengths
✅ High selectivity: Combining RSI cross + divergence + OB/OS means signals are rare but higher quality.
✅ Great at catching reversals: Divergence highlights where price may be running out of steam.
✅ Risk management baked in: ATR stops + partial exits smooth out equity curve.
✅ Works across markets: ES, FX, crypto — anywhere RSI divergences are respected.
✅ Flexible: You can loosen/tighten filters depending on aggressiveness.
🔹 Weaknesses
❌ Lag from pivots: Divergence only confirms after a few bars → you enter late sometimes.
❌ Choppy in ranges: In sideways markets, RSI divergences appear often and whipsaw.
❌ Filters reduce signals: With all filters ON (divergence + OB/OS + trend + session), signals can be very rare — may under-trade.
❌ Not standalone: Needs higher-timeframe context (trend, liquidity pools) to avoid counter-trend entries.
🔹 Best Ways to Trade It
Use Higher Timeframe Bias
Run the strategy on 15m/1H, but only trade in direction of higher timeframe trend (e.g., 4H EMA).
Example: If daily is bullish → only take bullish divergences.
Pair With Structure
Look for signals at key zones: HTF support/resistance, VWAP, or FVGs.
Divergence + RSI cross inside an FVG is a strong entry trigger.
Adjust OB/OS for Volatility
For crypto/FX: use 35/65 instead of 30/70 (markets trend harder).
For ES/S&P: 30/70 works fine.
Risk Management Is King
Use partial exits: take profit at 1R, trail rest.
Size by % of equity (we coded this into the strategy).
Avoid News Spikes
Divergences break down around CPI, NFP, Fed announcements — stay flat.
🔹 When It Shines
Trending markets that make extended pushes → clean divergences.
Reversal zones (oversold → bullish bounce, overbought → bearish fade).
Swing trading (15m–4H) — less noise than 1m/5m scalping.
🔹 When to Avoid
Low volatility chop → lots of false divergences.
During high-impact news → RSI swings wildly.
In strong one-way trends without pullbacks — divergence keeps calling tops/bottoms too early.
✅ Summary:
This is a reversal-focused RSI divergence strategy with strict filters. It’s powerful when combined with higher-timeframe bias + structure confluence, but weak if traded blindly in choppy or news-driven conditions. Best to treat it as a precision entry trigger, not a full system — layer it on top of your FVG/ORB framework for maximum edge.

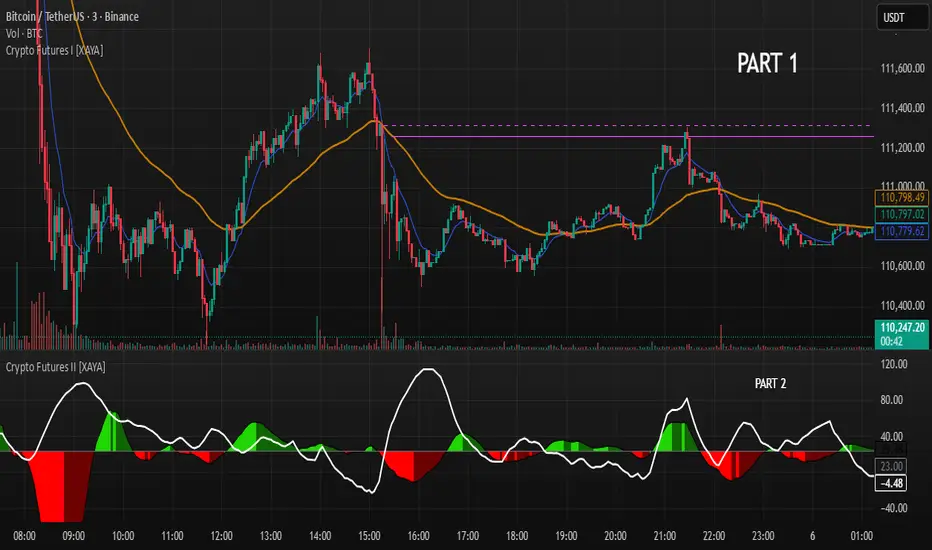
Crypto Futures I [XAYA]Crypto Futures Indicator, by XAYA.
PART 1.
Crypto Futures Indicator it's a full build-in strategy used to trade top 200 Crypto Tokens in any Time Frame from 1H to 1D.
The full strategy uses 5 separated indicators:
- Price Action
- 2 EMAS, 10 and 55
- Volume
- Squeeze Momentum
- ADX
PART 1 of Crypto Futures Indicator plots 2 EMAs (10 and 55) and an horizontal line at the cross of them, to use as areas of future interest. This cross lines that are named "Chris Cross" in honor to my mentor, come in 2 variations:
- Dashed line indicates a cross of EMAS in the present Time Frame.
- Solid line indicates a cross of EMAs in the Higher Time Frame above the present TF.
"Chris Cross" lines are hidden by default since are not needed to execute strategy, but they are good areas or Support and Resistence that can be use in confluence with the rest of the strategy as Buy or Sell points.
XAYA 2025

Crypto Futures I [XAYA]Crypto Futures Indicator, by XAYA.
PART 1.
Crypto Futures Indicator it's a full build-in strategy used to trade top 200 Crypto Tokens from, in any Time Frame from 1H to 1D. The full strategy uses 5 separated indicators:
- Price Action
- 2 EMAS, 10 and 55
- Volume
- Squeeze Momentum
- ADX
PART 1 of Crypto Futures Indicator plots 2 EMAs (10 and 55) and an horizontal line at the cross of them, to use as areas of future interest. This cross lines that are named "Chris Cross" in honor to my mentor, come in 2 variations:
- Dashed line indicates a cross of EMAS in the present Time Frame.
- Solid line indicates a cross of EMAs in the Higher Time Frame above the present TF.
"Chris Cross" lines are hidden by default since are not needed to execute strategy, but they are good areas or Support and Resistence that can be use in confluence with the rest of the strategy as Buy or Sell points.
XAYA 2025
Maize Lite MethodOrb method with a twist, uses 4 indicators in one. Its focus is the strat and emas to enter short term trades

Multi-Timeframe HTS Retest Strategy v6Multi-Timeframe HTS Retest Strategy v6 is a trend-following tool designed to detect high-probability retest entries aligned with higher timeframe direction. The indicator applies HTS bands (short & long) on both the current and higher timeframe (4x–8x multiplier) to confirm market bias.
A strong trend is validated when HTS bands separate on the higher timeframe. On the lower timeframe, the strategy tracks price behavior relative to the bands: after breaking outside, price must retest either the fast (blue) or slow (red) band, confirmed by a rejection candle. This generates precise BUY or SELL retest signals.
Features include flexible average methods (RMA, EMA, SMA, etc.), customizable cross detection (final cross, 4 crosses, or both), volume-based retest conditions, and clear visual signals (dots for trend start, triangles for retests). Alerts are integrated for automation.
This strategy is suitable for forex, crypto, indices, and stocks, supporting both scalping and swing trading.

NY Anchored VWAP and Auto SMANY Anchored VWAP and Auto SMA
This script is a versatile trading indicator for the TradingView platform that combines two powerful components: a New York-anchored Volume-Weighted Average Price (VWAP) and a dynamic Simple Moving Average (SMA). Designed for traders who utilize VWAP for intraday trend analysis, this tool provides a clear visual representation of average price and volatility-adjusted moving averages, generating automated alerts for key crossover signals.
Indicator Components
1. NY Anchored VWAP
The VWAP is a crucial tool that represents the average price of a security adjusted for volume. This version is "anchored" to the start of the New York trading session, resetting at the beginning of each new session. This provides a clean, session-specific anchor point to gauge market sentiment and trend. The VWAP line changes color to reflect its slope:
Green: When the VWAP is trending upwards, indicating a bullish bias.
Red: When the VWAP is trending downwards, indicating a bearish bias.
2. Auto SMA
The Auto SMA is a moving average with a unique twist: its lookback period is not fixed. Instead, it dynamically adjusts based on market volatility. The script measures volatility using the Average True Range (ATR) and a Z-Score calculation.
When volatility is expanding, the SMA's length shortens, making it more sensitive to recent price changes.
When volatility is contracting, the SMA's length lengthens, smoothing out the price action to filter out noise.
This adaptive approach allows the SMA to react appropriately to different market conditions.
Suggested Trading Strategy
This indicator is particularly effective when used on a one-minute chart for identifying high-probability trade entries. The core of the strategy is to trade the crossover between the VWAP and the Auto SMA, with confirmation from a candle close.
The strategy works best when the entry signal aligns with the overall bias of the higher timeframe market structure. For example, if the daily or 4-hour chart is in an uptrend, you would look for bullish signals on the one-minute chart.
Bullish Entry Signal: A potential entry is signaled when the VWAP crosses above the Auto SMA, and is confirmed when the one-minute candle closes above both the VWAP and the SMA. This indicates a potential continuation of the bullish momentum.
Bearish Entry Signal: A potential entry is signaled when the VWAP crosses below the Auto SMA, and is confirmed when the one-minute candle closes below both the VWAP and the SMA. This indicates a potential continuation of the bearish momentum.
The built-in alerts for these crossovers allow you to receive notifications without having to constantly monitor the charts, ensuring you don't miss a potential setup.

Martingale Strategy Simulator [BackQuant]Martingale Strategy Simulator
Purpose
This indicator lets you study how a martingale-style position sizing rule interacts with a simple long or short trading signal. It computes an equity curve from bar-to-bar returns, adapts position size after losing streaks, caps exposure at a user limit, and summarizes risk with portfolio metrics. An optional Monte Carlo module projects possible future equity paths from your realized daily returns.
What a martingale is
A martingale sizing rule increases stake after losses and resets after a win. In its classical form from gambling, you double the bet after each loss so that a single win recovers all prior losses plus one unit of profit. In markets there is no fixed “even-money” payout and returns are multiplicative, so an exact recovery guarantee does not exist. The core idea is unchanged:
Lose one leg → increase next position size
Lose again → increase again
Win → reset to the base size
The expectation of your strategy still depends on the signal’s edge. Sizing does not create positive expectancy on its own. A martingale raises variance and tail risk by concentrating more capital as a losing streak develops.
What it plots
Equity – simulated portfolio equity including compounding
Buy & Hold – equity from holding the chart symbol for context
Optional helpers – last trade outcome, current streak length, current allocation fraction
Optional diagnostics – daily portfolio return, rolling drawdown, metrics table
Optional Monte Carlo probability cone – p5, p16, p50, p84, p95 aggregate bands
Model assumptions
Bar-close execution with no slippage or commissions
Shorting allowed and frictionless
No margin interest, borrow fees, or position limits
No intrabar moves or gaps within a bar (returns are close-to-close)
Sizing applies to equity fraction only and is capped by your setting
All results are hypothetical and for education only.
How the simulator applies it
1) Directional signal
You pick a simple directional rule that produces +1 for long or −1 for short each bar. Options include 100 HMA slope, RSI above or below 50, EMA or SMA crosses, CCI and other oscillators, ATR move, BB basis, and more. The stance is evaluated bar by bar. When the stance flips, the current trade ends and the next one starts.
2) Sizing after losses and wins
Position size is a fraction of equity:
Initial allocation – the starting fraction, for example 0.15 means 15 percent of equity
Increase after loss – multiply the next allocation by your factor after a losing leg, for example 2.00 to double
Reset after win – return to the initial allocation
Max allocation cap – hard ceiling to prevent runaway growth
At a high level the size after k consecutive losses is
alloc(k) = min( cap , base × factor^k ) .
In practice the simulator changes size only when a leg ends and its PnL is known.
3) Equity update
Let r_t = close_t / close_{t-1} − 1 be the symbol’s bar return, d_{t−1} ∈ {+1, −1} the prior bar stance, and a_{t−1} the prior bar allocation fraction. The simulator compounds:
eq_t = eq_{t−1} × (1 + a_{t−1} × d_{t−1} × r_t) .
This is bar-based and avoids intrabar lookahead. Costs, slippage, and borrowing costs are not modeled.
Why traders experiment with martingale sizing
Mean-reversion contexts – if the signal often snaps back after a string of losses, adding size near the tail of a move can pull the average entry closer to the turn
Behavioral or microstructure edges – some rules have modest edge but frequent small whipsaws; size escalation may shorten time-to-recovery when the edge manifests
Exploration and stress testing – studying the relationship between streaks, caps, and drawdowns is instructive even if you do not deploy martingale sizing live
Why martingale is dangerous
Martingale concentrates capital when the strategy is performing worst. The main risks are structural, not cosmetic:
Loss streaks are inevitable – even with a 55 percent win rate you should expect multi-loss runs. The probability of at least one k-loss streak in N trades rises quickly with N.
Size explodes geometrically – with factor 2.0 and base 10 percent, the sequence is 10, 20, 40, 80, 100 (capped) after five losses. Without a strict cap, required size becomes infeasible.
No fixed payout – in gambling, one win at even odds resets PnL. In markets, there is no guaranteed bounce nor fixed profit multiple. Trends can extend and gaps can skip levels.
Correlation of losses – losses cluster in trends and in volatility bursts. A martingale tends to be largest just when volatility is highest.
Margin and liquidity constraints – leverage limits, margin calls, position limits, and widening spreads can force liquidation before a mean reversion occurs.
Fat tails and regime shifts – assumptions of independent, Gaussian returns can understate tail risk. Structural breaks can keep the signal wrong for much longer than expected.
The simulator exposes these dynamics in the equity curve, Max Drawdown, VaR and CVaR, and via Monte Carlo sketches of forward uncertainty.
Interpreting losing streaks with numbers
A rough intuition: if your per-trade win probability is p and loss probability is q=1−p , the chance of a specific run of k consecutive losses is q^k . Over many trades, the chance that at least one k-loss run occurs grows with the number of opportunities. As a sanity check:
If p=0.55 , then q=0.45 . A 6-loss run has probability q^6 ≈ 0.008 on any six-trade window. Across hundreds of trades, a 6 to 8-loss run is not rare.
If your size factor is 1.5 and your base is 10 percent, after 8 losses the requested size is 10% × 1.5^8 ≈ 25.6% . With factor 2.0 it would try to be 10% × 2^8 = 256% but your cap will stop it. The equity curve will still wear the compounded drawdown from the sequence that led to the cap.
This is why the cap setting is central. It does not remove tail risk, but it prevents the sizing rule from demanding impossible positions
Note: The p and q math is illustrative. In live data the win rate and distribution can drift over time, so real streaks can be longer or shorter than the simple q^k intuition suggests..
Using the simulator productively
Parameter studies
Start with conservative settings. Increase one element at a time and watch how the equity, Max Drawdown, and CVaR respond.
Initial allocation – lower base reduces volatility and drawdowns across the board
Increase factor – set modestly above 1.0 if you want the effect at all; doubling is aggressive
Max cap – the most important brake; many users keep it between 20 and 50 percent
Signal selection
Keep sizing fixed and rotate signals to see how streak patterns differ. Trend-following signals tend to produce long wrong-way streaks in choppy ranges. Mean-reversion signals do the opposite. Martingale sizing interacts very differently with each.
Diagnostics to watch
Use the built-in metrics to quantify risk:
Max Drawdown – worst peak-to-trough equity loss
Sharpe and Sortino – volatility and downside-adjusted return
VaR 95 percent and CVaR – tail risk measures from the realized distribution
Alpha and Beta – relationship to your chosen benchmark
If you would like to check out the original performance metrics script with multiple assets with a better explanation on all metrics please see
Monte Carlo exploration
When enabled, the forecast draws many synthetic paths from your realized daily returns:
Choose a horizon and a number of runs
Review the bands: p5 to p95 for a wide risk envelope; p16 to p84 for a narrower range; p50 as the median path
Use the table to read the expected return over the horizon and the tail outcomes
Remember it is a sketch based on your recent distribution, not a predictor
Concrete examples
Example A: Modest martingale
Base 10 percent, factor 1.25, cap 40 percent, RSI>50 signal. You will see small escalations on 2 to 4 loss runs and frequent resets. The equity curve usually remains smooth unless the signal enters a prolonged wrong-way regime. Max DD may rise moderately versus fixed sizing.
Example B: Aggressive martingale
Base 15 percent, factor 2.0, cap 60 percent, EMA cross signal. The curve can look stellar during favorable regimes, then a single extended streak pushes allocation to the cap, and a few more losses drive deep drawdown. CVaR and Max DD jump sharply. This is a textbook case of high tail risk.
Strengths
Bar-by-bar, transparent computation of equity from stance and size
Explicit handling of wins, losses, streaks, and caps
Portable signal inputs so you can A–B test ideas quickly
Risk diagnostics and forward uncertainty visualization in one place
Example, Rolling Max Drawdown
Limitations and important notes
Martingale sizing can escalate drawdowns rapidly. The cap limits position size but not the possibility of extended adverse runs.
No commissions, slippage, margin interest, borrow costs, or liquidity limits are modeled.
Signals are evaluated on closes. Real execution and fills will differ.
Monte Carlo assumes independent draws from your recent return distribution. Markets often have serial correlation, fat tails, and regime changes.
All results are hypothetical. Use this as an educational tool, not a production risk engine.
Practical tips
Prefer gentle factors such as 1.1 to 1.3. Doubling is usually excessive outside of toy examples.
Keep a strict cap. Many users cap between 20 and 40 percent of equity per leg.
Stress test with different start dates and subperiods. Long flat or trending regimes are where martingale weaknesses appear.
Compare to an anti-martingale (increase after wins, cut after losses) to understand the other side of the trade-off.
If you deploy sizing live, add external guardrails such as a daily loss cut, volatility filters, and a global max drawdown stop.
Settings recap
Backtest start date and initial capital
Initial allocation, increase-after-loss factor, max allocation cap
Signal source selector
Trading days per year and risk-free rate
Benchmark symbol for Alpha and Beta
UI toggles for equity, buy and hold, labels, metrics, PnL, and drawdown
Monte Carlo controls for enable, runs, horizon, and result table
Final thoughts
A martingale is not a free lunch. It is a way to tilt capital allocation toward losing streaks. If the signal has a real edge and mean reversion is common, careful and capped escalation can reduce time-to-recovery. If the signal lacks edge or regimes shift, the same rule can magnify losses at the worst possible moment. This simulator makes those trade-offs visible so you can calibrate parameters, understand tail risk, and decide whether the approach belongs anywhere in your research workflow.

Advanced Candlestick Patterns [MAB]🔎 Overview
Advanced Candlestick Patterns is a framework that detects well-defined candlestick patterns with a consistent Validation / Devalidation process, optional swing-context filters , and a hidden-candle reconstruction mode for stricter pattern anatomy.
The goal is clarity and discipline: signals are described, thresholds are visible, and risk parameters are explicit.
⚙️ Key Features
📊 Pattern Engine (Extensible) — Modular detection methods so new patterns can be added without changing workflow.
✅ Validation / Devalidation — Clear rules for confirmation and invalidation; plotted with distinct lines for transparency.
📈 Swing Filter (Optional) — Require setups to align with local swing highs/lows via selectable lookbacks.
🧩 Hidden-Candle Mode — Reconstructs OHLC (prev close + current extremes) to reveal intra-bar structure; visuals may differ from native bars.
🎯Target Systems — Choose Points, Percentage, or Risk:Reward; info label shows EP/SL/TP-1.
Performance-Safe Controls — Label size, info toggle, and non-editable internal lines.
📈 How to Use
Add the script to your chart (after access is granted).
Choose pattern types for Bullish and Bearish detection from the inputs.
⁃ Enable Hidden Candles if you want stricter intra-bar anatomy.
⁃ Enable Detect near Swings and pick a swing length (Smaller/Medium/Bigger).
💬Decide whether to show Trade Info Labels (Entry, SL, Target 1).
🎯Set your Target Mode (Points / Percentage / Risk:Reward) and parameter.
✅ Use the plotted Validation (confirmation) and Devalidation (invalidation) levels to plan.
Tip: With Detect near Swings ON, a setup counts only if the prior bar’s high/low equals the rolling extreme. If too strict, adjust the lookback or disable.
💡Recommended charting
• Intraday structure: 5m–15m–30m
• Swing confirmation: 2h-4h–1D
• Test across multiple symbols; avoid cherry-picking.
🛡 Risk Management System
This tool displays mechanics— you control the risk. A common template:
Entry : Entry is typically considered only after validation.
Stop-Loss : Initial SL at the structure-defined level (displayed).
Target 1 : Choose Points / % / Risk:Reward (e.g., 1R).
After TP-1 : Consider partial profits and trail the remainder via ATR / short MA / swing boxes (user-defined).
No target or trail is guaranteed—market conditions change.
🧭 Visual Guide
#1. Input Selections Window:
#2. Bearish Patterns: Valid and Devaild rules for the Bearish Patterns
#3. Bullish Patterns: Valid and Devalied rules for the Bullish Patterns
#4. Spotted Bullish Harami Pattern & Trade Info label explained:
#5. Spotted Bearish Engulfing Pattern:
⚠️ Important Notes
⏱️ Timeframes : Works on all timeframes. For intraday, start 5m–15m; for swing, use 4h–1D. Evaluate on bar close .
✅ Instruments : Any OHLC market (Crypto/FX/Indices/Equities). Forward-adjusted data may show minor visual differences.
🧩 Hidden-Candle Mode : Detection follows reconstructed bars; visuals may differ from native candles.
🔔 Signal Lifecycle : Deterministic New → Validated → Devalidated . Levels reset to na when devalidated.
🚫 No Look-Ahead : No repainting after bar close. Intrabar values can update until the bar closes.
📊 Performance : High label/line counts can slow charts on lower TFs; reduce label size or toggle Trade Info if needed.
🔐 Conclusion and Access
This framework promotes a disciplined, rules-first approach to pattern-based trading: clear definitions, visible Validation/Devalidation levels, and explicit risk references.
👉 For how to request access, please see the Author’s Instructions section below.
🧾 Disclaimer
This script is intended solely for educational and informational purposes. It does not provide financial or investment advice, nor should it be interpreted as a recommendation to buy, sell, or trade any securities or derivatives.
We are not SEBI-registered advisors , and the strategies shown are not personalized guidance . Past performance or backtested results are not indicative of future outcomes and should not be relied upon for live trading without thorough evaluation.
Trading in financial markets—especially options—involves significant risk. Both profits and losses are inherent to the trading process.

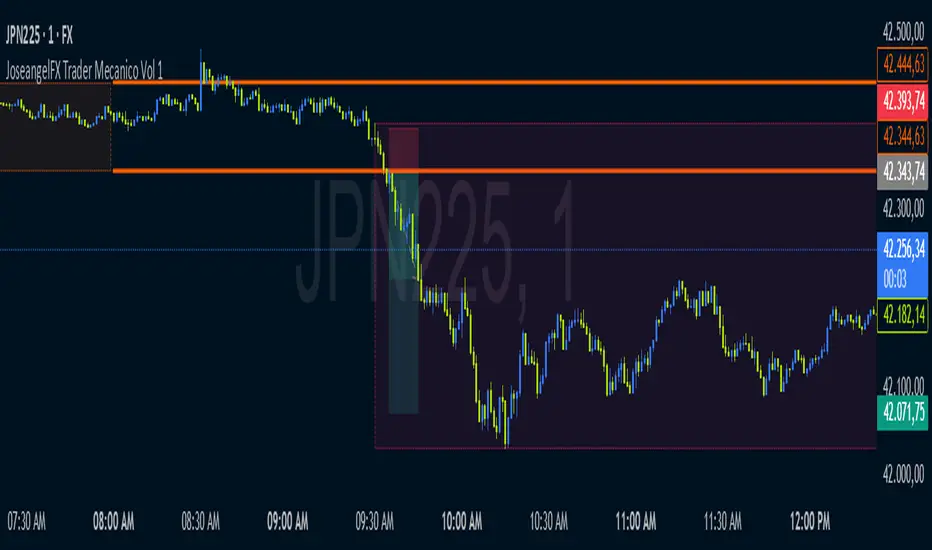
JoseangelFX Trader Mecanico Vol 1🔥 Tired of emotional trading? Transform yourself in 7 days with a 100% mechanical system!
Hi, I'm José Ángel FX, the Mechanical Trader. Forget long, theoretical courses. Here I give you a proven method to master the indices in record time. No subjective analysis, no emotions, just clear rules that work.
This code is responsible for indicating a trading range for a 100% mechanical system.
🚀 What will you achieve with this system?
✅ Trade like a pro in 7 days: You don't need years of study.
✅ Objective and repeatable signals: Eliminate doubts forever.
✅ Backtesting: Concrete results of the strategy.
✅ Discipline of Steel: Psychotrading armored against fear and greed.
📢 "In a week with this system, you are no longer the same trader."
Investment: Profitability really has no value, you'll achieve it (remote assistance with management system installation included, for MT4, MT5, and TradingView).
Requirement: Obedience...
👉 Schedule your FREE diagnosis:
WhatsApp: wa.me/584122928262
Telegram: @tradermecanicoJAFX
t.me
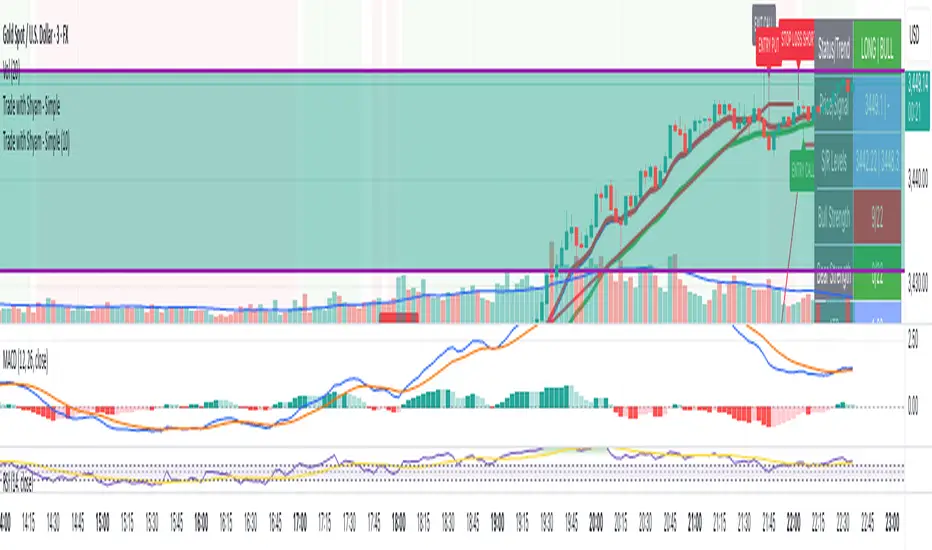
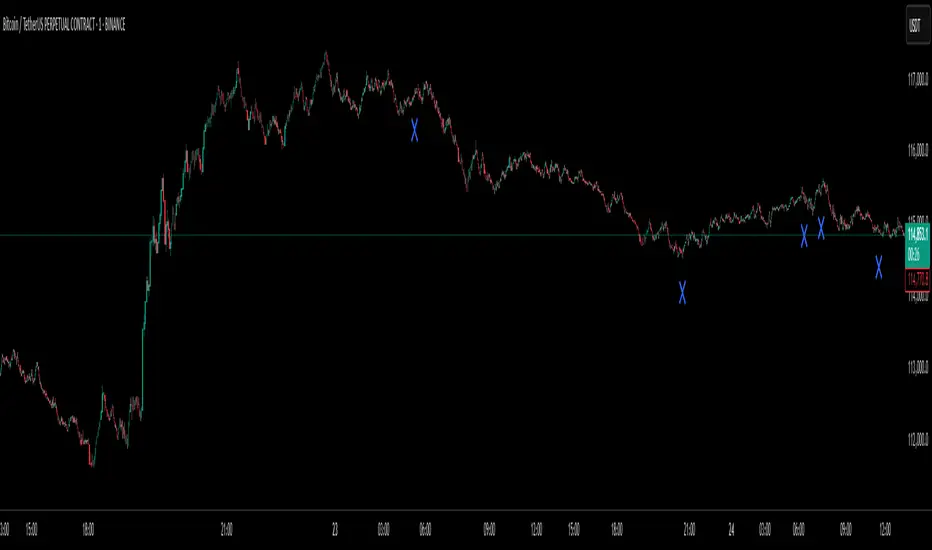
Trade with Shyam - SimpleStrategy Overview
This is a trend-following strategy that uses two Exponential Moving Averages (EMAs) to identify trading opportunities in the market. The strategy generates buy and sell signals based on the relationship between price and the EMA lines.
How It Works
Entry Signals
ENTRY CALL (Green): Generated when the complete candle closes above the EMA 9 (candle low > EMA 9)
ENTRY PUT (Red): Generated when the complete candle closes below the EMA 9 (candle high < EMA 9)
Exit Signals
EXIT CALL (Gray): Triggered when price closes below the EMA 21 (candle high < EMA 21)
EXIT PUT (Gray): Triggered when price closes above the EMA 21 (candle low > EMA 21)
Visual Components
Red Line (Thickness 3): EMA 9 - Short-term trend indicator
Green Line (Thickness 3): EMA 21 - Medium-term trend indicator
Green Triangles: Buy entry signals
Red Triangles: Sell entry signals
Gray X Marks: Exit signals
Background Coloring:
Light green: Currently in a long position
Light red: Currently in a short position
Strategy Logic
Buy Signal: When price shows strength by closing completely above the EMA 9
Sell Signal: When price shows weakness by closing completely below the EMA 9
Exit Long: When price weakness pulls back below EMA 21
Exit Short: When price strength pushes back above EMA 21
Key Features
Trend Following: Captures momentum in the direction of the trend
Dual EMA System: Uses faster EMA (9) for entries and slower EMA (21) for exits
Complete Candle Confirmation: Only triggers signals after full candle confirmation
Position Management: Maintains only one position at a time (no simultaneous long/short)
Visual Clarity: Clear labels and color coding for easy interpretation
Best Usage Conditions
Trending Markets: Works best in markets with clear directional bias
Moderate to High Volatility: Provides better signal quality in active markets
Multiple Timeframes: Can be used on any timeframe (15min, 1H, 4H, Daily recommended)
Risk Management Notes
The strategy uses the EMA 21 as a dynamic stop-loss level
Position sizing and additional risk management should be implemented separately
Past performance does not guarantee future results
Customization
You can adjust the EMA periods in the indicator settings to suit your trading style:
Shorter periods: More sensitive, more signals (higher frequency)
Longer periods: Less sensitive, fewer but potentially higher quality signals
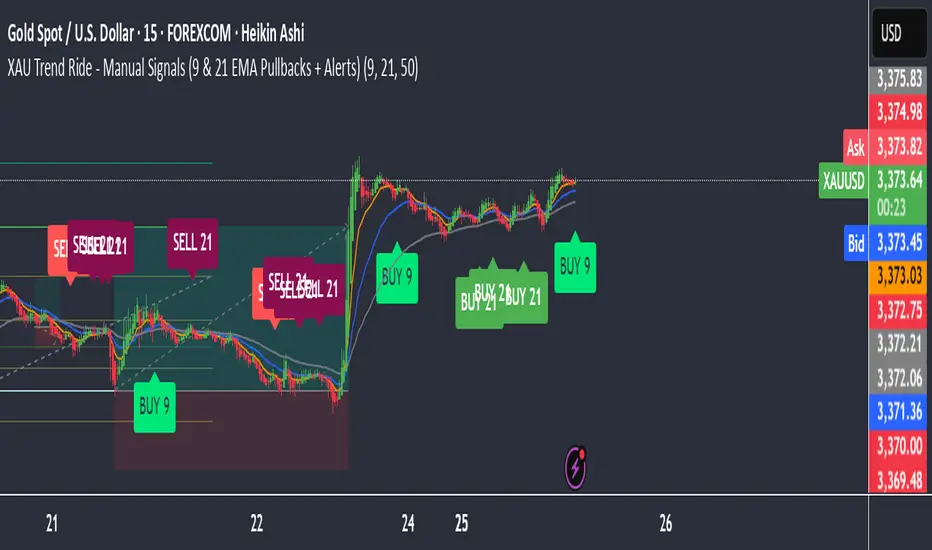
XAU Trend Ride - Manual Signals (9 & 21 EMA Pullbacks + Alerts)This strategy is designed for XAUUSD on the 15-minute chart and is based on mean reversion around the 50 EMA.
• A buy signal occurs when price is above the 50 EMA, the EMA is sloping upward, and price makes a pullback into the EMA before turning back up.
• A sell signal occurs when price is below the 50 EMA, the EMA is sloping downward, and price makes a pullback into the EMA before turning back down.
The system uses a fixed 2:1 risk-reward ratio, with the option to scale out partial profits at 1:1. It is intended for trending markets and may produce false signals in choppy, ranging conditions.
This makes the strategy simple, disciplined, and easy to follow without over-complicating the rules.
ATR Dashboard (Pane Only)🔧 Core Logic
ATR Source: Multi-timeframe ATR (default 1H while trading 5m/15m).
Threshold Rule:
TREND = ATR > (ATR_SMA × k)
NORMAL = otherwise
Sessions: Only evaluates during London (02:00–07:00 ET) and New York (07:00–11:30 ET) by default.
Smoothing: ATR compared against its SMA (default 10-period).
k Multiplier: Controls sensitivity (default 1.20).
🖥️ Visuals
✅ TREND: Green label (or green background if enabled).
⚪ NORMAL: Gray label.
⏸️ OUT OF SESSION: Dim label, so you don’t force trades off-hours.
📊 Optional panel shows ATR, ATR_SMA, and Threshold values in real time.
📊 Dashboard + Overlay Combo
Use this overlay on your chart TF for tactical entries.
Pair with an ATR Dashboard (pane) on a higher TF (like 1H) for the strategic backdrop.
Overlay TREND + Dashboard TREND → High conviction trending environment.
Overlay TREND but Dashboard NORMAL → Fragile breakout, trade smaller or pass.
Both NORMAL → Chop/range → stick to 1:1.4 BE rules.
⚖️ Trading Playbook Integration
NORMAL Mode (ATR below threshold)
50% partial at 1R.
BE @ 1:1.4.
Runner capped at 2R.
TREND Mode (ATR above threshold)
50% partial at 1R.
BE @ 1:1.6.
Remainder trails ATR ×1.5.
Reserve ~15% of trend trades as no-partials for fat-tail home runs (4R–6R+).
🔔 Alerts
ATR Trend ON (in session) → “ATR > Threshold → Switch to TREND BE (1:1.6).”
ATR Trend OFF (in session) → “ATR ≤ Threshold → Switch to NORMAL BE (1:1.4).”
Perfect for getting pinged the moment volatility regime flips.
📌 Tips
k = 1.20 → balanced (default).
k = 1.10–1.15 → more TREND calls (sensitive).
k = 1.30+ → only strongest trends count.
Run it with overlay ON chart TF for execution, and dashboard on HTF for context.
Best used during active London/NY sessions.
✅ This isn’t a signal generator. It’s a regime filter + risk manager.
It keeps you from chasing chop and helps you mechanically switch BE rules without hesitation.
⚡ Pro tip: Combine with a Trend Continuation HUD, Elliott Wave Convergence overlay, or a Bollinger+RSI/MFI reversal scanner for a full tactical playbook.

ATR Trend Switch (ATR > k*ATR_SMA) - Overlay + Session Windows🔧 Core Logic
ATR Source: Multi-timeframe ATR (default 1H while trading 5m/15m).
Threshold Rule:
TREND = ATR > (ATR_SMA × k)
NORMAL = otherwise
Sessions: Only evaluates during London (02:00–07:00 ET) and New York (07:00–11:30 ET) by default.
Smoothing: ATR compared against its SMA (default 10-period).
k Multiplier: Controls sensitivity (default 1.20).
🖥️ Visuals
✅ TREND: Green label (or green background if enabled).
⚪ NORMAL: Gray label.
⏸️ OUT OF SESSION: Dim label, so you don’t force trades off-hours.
📊 Optional panel shows ATR, ATR_SMA, and Threshold values in real time.
📊 Dashboard + Overlay Combo
Use this overlay on your chart TF for tactical entries.
Pair with an ATR Dashboard (pane) on a higher TF (like 1H) for the strategic backdrop.
Overlay TREND + Dashboard TREND → High conviction trending environment.
Overlay TREND but Dashboard NORMAL → Fragile breakout, trade smaller or pass.
Both NORMAL → Chop/range → stick to 1:1.4 BE rules.
⚖️ Trading Playbook Integration
NORMAL Mode (ATR below threshold)
50% partial at 1R.
BE @ 1:1.4.
Runner capped at 2R.
TREND Mode (ATR above threshold)
50% partial at 1R.
BE @ 1:1.6.
Remainder trails ATR ×1.5.
Reserve ~15% of trend trades as no-partials for fat-tail home runs (4R–6R+).
🔔 Alerts
ATR Trend ON (in session) → “ATR > Threshold → Switch to TREND BE (1:1.6).”
ATR Trend OFF (in session) → “ATR ≤ Threshold → Switch to NORMAL BE (1:1.4).”
Perfect for getting pinged the moment volatility regime flips.
📌 Tips
k = 1.20 → balanced (default).
k = 1.10–1.15 → more TREND calls (sensitive).
k = 1.30+ → only strongest trends count.
Run it with overlay ON chart TF for execution, and dashboard on HTF for context.
Best used during active London/NY sessions.
✅ This isn’t a signal generator. It’s a regime filter + risk manager.
It keeps you from chasing chop and helps you mechanically switch BE rules without hesitation.
⚡ Pro tip: Combine with a Trend Continuation HUD, Elliott Wave Convergence overlay, or a Bollinger+RSI/MFI reversal scanner for a full tactical playbook.

QAIS Advanced Liquidity Hunter [HYBRID ALERT]I Qais Shah from Kalmeshwar, Nagpur. Have Unlock Institutional-Grade Strategies with the Advanced Liquidity Hunter
This powerful indicator is designed for serious traders seeking to capitalize on the same market mechanics used by institutional players. The Advanced Liquidity Hunter identifies high-probability reversal setups by detecting key market events: Liquidity Sweeps, Fair Value Gaps (FVG), and RSI Divergence, all filtered through a multi-timeframe analysis for maximum confluence.
🔍 What This Indicator Does:
Detects Liquidity Sweeps: Finds precise moments where price aggressively sweeps beyond a recent swing high or low to trigger stop orders (liquidity) and then rejects back into the range—a classic sign of institutional activity.
Identifies Fair Value Gaps (FVG): Highlights imbalanced areas on the chart where price is likely to return, providing excellent entry zones.
Multi-Timeframe RSI Divergence: Confirms momentum shifts by analyzing divergence not just on your current chart, but also on the higher 1-hour timeframe for stronger, more reliable signals.
Volume Spike Confirmation: Ensures the move is validated by a significant increase in trading volume, separating genuine moves from false breakouts.
Smart Alert System: Sends direct alerts to your phone or email when a perfect confluence of conditions is met, so you never miss a setup.
⚙️ How to Use It:
This is a Hybrid Quant-Discretionary tool. It does the heavy lifting of scanning the markets 24/7, but it requires your expert discretion for final execution.
Wait for the Alert: The indicator will send an alert when a high-quality setup is detected.
Confirm on Higher Timeframe (HTF): Open the chart. Check that the signal aligns with a major HTF support/resistance level, trend, or order block.
Execute Your Plan: Manually enter the trade using the provided logic, ensuring you implement strict risk management (1-2% of capital per trade).
🎯 Ideal For:
Swing Traders and Day Traders looking for high-quality, high-probability entries.
Those who understand and trade based on market structure, liquidity, and order flow.
Traders who prefer a disciplined, alert-based system over emotional decision-making.
📊 Key Features:
Fully Customizable: Adjust all parameters (ATR multiplier, RSI length, volume spike) to fit your trading style and the current market volatility.
Clear Visuals: Easy-to-see triangles and crosses plot the exact entry points and liquidity sweeps directly on your chart.
Non-Repainting: The logic uses confirmed closing prices to ensure signals do not repaint.
Disclaimer: This tool is designed to identify high-probability opportunities, not guaranteed wins. Always practice proper risk management and backtest the strategy before using real capital. Past performance is not indicative of future results.
GOLDEN SCALP DEXDescription:
This tool is designed for traders who want to capture momentum shifts that occur within larger timeframe structures. The strategy identifies unique breakout opportunities inside the HTF cycle and provides precise entry and exit signals without cluttering the chart.
The system focuses on:
Pinpointing immediate momentum breakouts
Clean chart visualization with intuitive buy/sell markers
Full backtesting capability through TradingView’s Strategy Tester
Customizable position sizing for futures, forex, and crypto traders
It is especially useful for traders who prefer fast, rule-based signals during high-impact intraday moves.
⚠️ Disclaimer: This is a trading tool, not financial advice. Results may vary depending on market conditions, and proper risk management is essential.

Strategy Sheet — Customizable 4x8 Table📖 Script Description
The Strategy Sheet — 4 Columns / 8 Rows is a compact and highly customizable table-based tool for traders who want to keep their trading plan, rules, and session settings directly visible on the chart.
🔹 Features:
• Up to 4 fully configurable columns and 8 rows
• Compact UI with per-column color overrides
• Dark / Light / Custom theme modes
• Support for zebra row backgrounds (alternating colors)
• Adjustable position, padding, spacing, and alignment
• Clean layout with borders and header styling
• Perfect for trade plans, ORB setups, session notes, or risk rules
🔹 Use cases:
• Documenting strategy rules directly on chart
• Displaying ORB session times and risk management
• Creating a structured overview of trading setups
• Quick reference without leaving the chart
This script does not generate signals – it’s a visual aid designed to organize and display trading information in a clear and professional way.

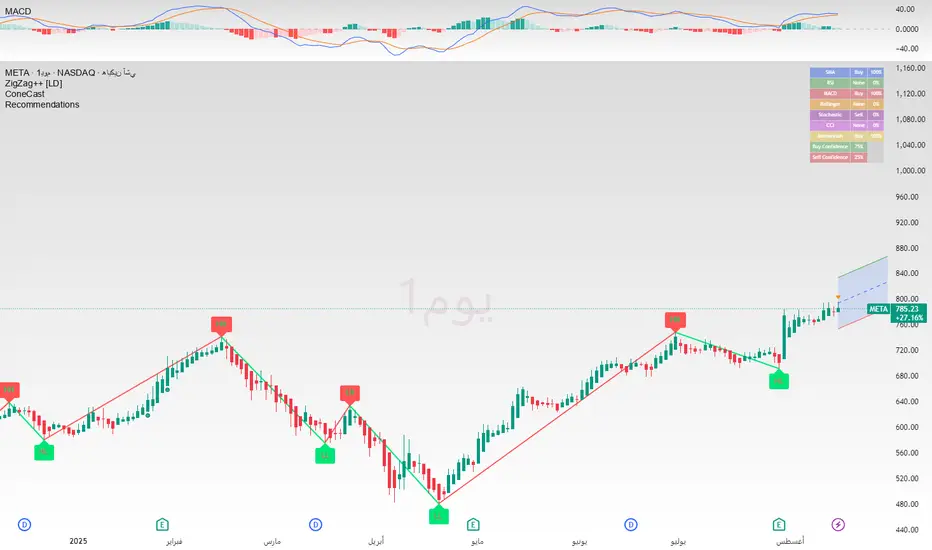
Recommendation Indicatorالوصف بالعربية
استراتيجية تداول مبنية على ٦ مؤشرات تأكيدية لرصد حركة السوق واتجاهه.
تعتمد على عدّ الشموع الصاعدة والهابطة المتتالية كعامل أساسي، وتدمج معها مؤشرات إضافية للتأكيد.
عند توافق المؤشرات معًا، يتم توليد إشارة شراء (BUY) أو بيع (SELL) واضحة على الرسم البياني.
هذا يعزز دقة الإشارات ويقلل من التذبذبات أو الإشارات الكاذبة، مما يجعلها مناسبة للمتداولين الباحثين عن قوة الاتجاه وتأكيده قبل الدخول في الصفقة.
🔎 ملاحظات الاستخدام
الاستراتيجية تحتوي على ٦ أدوات تأكيد مجتمعة لضمان إشارات أدق.
يُفضل استخدامها مع اختبار رجعي (Backtesting) قبل التداول الفعلي.
يمكن تعديل إعدادات المؤشرات لتناسب السوق أو الإطار الزمني المستخدم.
لا تعتبر توصية مالية مباشرة، وإنما أداة تعليمية وتجريبية.
---
📌 Description in English
A trading strategy built on 6 confirmation indicators to track market movements and trends.
It uses consecutive up and down bars as the core logic, combined with additional indicators for confirmation.
When all confirmations align, the strategy generates clear BUY or SELL signals on the chart.
This approach improves signal accuracy, reduces noise, and helps traders confirm market direction before entering a trade.
🔎 Usage Notes
The strategy incorporates 6 confirmation tools working together for higher accuracy.
Backtesting is recommended before applying it to live trading.
Indicator parameters can be adjusted to fit different markets and timeframes.
This is not financial advice, but an educational and experimental tool.

MARKET SWITCHERS FIB LEVELThe Market Switchers Fib Retracement strategy is built around combining breakout confirmation with Fibonacci retracement levels to identify high-probability trade setups. After the initial market move is established, the strategy uses Fibonacci retracement levels—typically the 50% level—as the key decision zone for entry. When price pulls back into this retracement zone, the strategy looks for continuation in the direction of the original move, offering traders a structured way to catch momentum at a discounted price rather than chasing breakouts. Risk management is defined in dollar terms (e.g., $500 stop loss and $1500 take profit), allowing trades to be executed with a consistent risk-to-reward ratio. The method enforces discipline by limiting trades to specific sessions and timeframes, ensuring that trades are aligned with volatility windows, while also applying a one-trade-per-day rule to reduce overtrading. Overall, the approach blends breakout momentum with Fibonacci retracement structure, giving traders a balance between precision entries and strong risk-reward setups
