DEMO BEETHello dear traders,
This is my first attempt to create an automatic trading strategy. This is 100% automatic, no need for any kind of human intervention.
The strategy is based on momentum and will buy when condition 1 and 2 are met, and sell when condition 3 and 4 are met.
This is very basic and i need to implement an exit strategy to bank the profits.
Enjoy.
Cari skrip untuk "the strat"
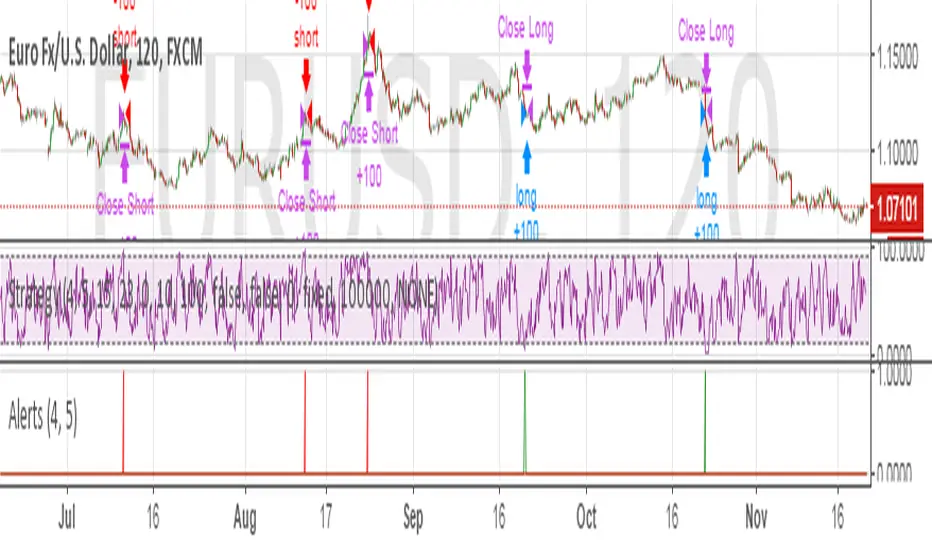
Adaptive Zero Lag EMA [STUDY]A user has asked for the Study/Indicator version of this Strategy .
If you encounter the error "loop....>100ms" simply toggle the eye icon to hide and unhide the indicator
The following is simply quoted from my previous post for your convenience: (obviously there won't be risk, Stop Loss, or Take profit parameters!)
OPERATING PRINCIPLE
The strategy is based on Ehlers idea that any indicator can be turned into a signal-producing trade system through smoothing and other filtering processes.
In fact, I'm using his Zero Lag EMA ( ZLEMA ) as a baseline indicator as well as some code snippets he has made public (1). God bless open source!
Next, I've provided the option to use an Instantaneous Frequency Measurement (IFM) method, which will adaptively choose the best period for the ZLEMA (2)
I've written other studies that use the differential calculus approximations for IFM, so it was only natural to include them in this strategy.
The primary two are Cosine IFM (3) and In-phase Quadrature IFM (4). You can also find an indicator with both plotted and the ability to average them together, as one IFM prefers long periods and the other short. (5)
BEFORE WE BEGIN
1. This strategy only runs on "normal" FX pairs ( EURUSD , GBPJPY , AUDUSD ...) and will fail on Metals or Commodities.
Cryptos are largely untested.
2. Please run it on these time frames: M15 to D.
Anything outside this range will likely fail.
HOW TO USE AND SUCCEED
1. If the Default settings don't produce good results right off the bat, then lower gain limit to 1 or 2 and threshold to 0.01.
2. Test each setting under adaptive method. If you want to leave it Off, then I'd recommend using some kind of IFM (see my links below) to
discover the most efficient period to use.
3. Once you have the best adaptive method chosen, begin incrementing gain limit until you find a nice balance between profit factor ( PF ) and drawdown.
4. Now, begin incrementing threshold. The goal is to have PF above 2 and a drawdown as low as possible.
5. Finally, change the source! Typically, close is the best option, but I have run into cases where high
yielded the highest returns and win rate.
6. Sit back, relax, and tweak the risk until you're happy with the return and drawdown amounts.
ADVANCED
You may need to adjust take profit (TP) points and stop loss (SL) points to create the best entry possible. Don't be greedy! You'll likely have poor
results if the TP is set to 300 and SL is 50.
If you are trading a pair that has a long Dominant Cycle Period, then you may increase Max Period to allow the IFM
to accept longer periods. Any period above the Max Period will be rejected. This may increase lag time!
Cheers and good luck trading!
-DasanC
(1)www.mesasoftware.com
(2)www.jamesgoulding.com
(3) Cosine IFM
(4) I-Q IFM
(5) Averaging IFM
IFM stands for Instantaneous frequency measurement
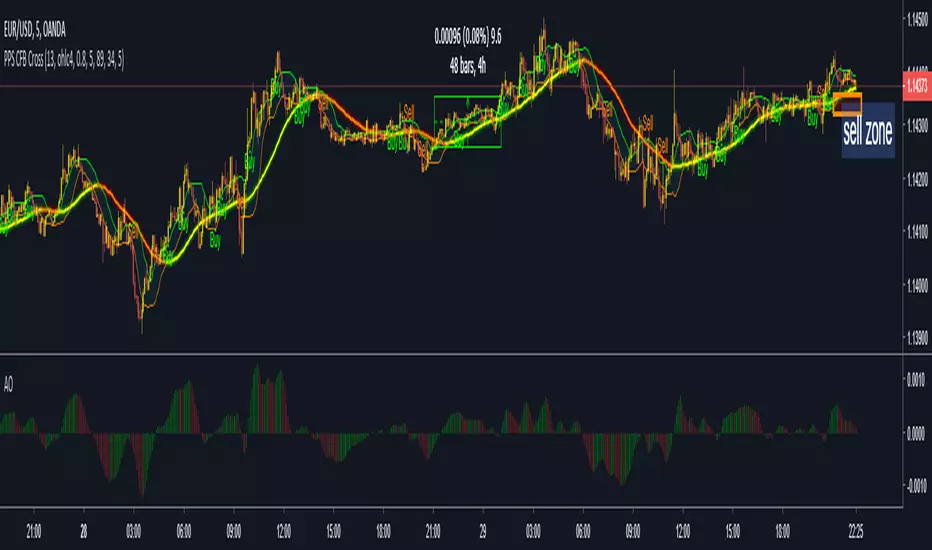
PPSignal BB-EWO BB $ CFB Strategy ScalpThis indicator is an implementation of the Bollinger Band, CFB and EWO Oscillator Scalping system.
This technique is for those who want the most simple method that is very effective. It is BEST traded during the busiest trading hours, 3am to 12am EST NY time. This method doesn't work in sideways markets, only in volatile trending markets.
-Time Frames: 1, 5, 10, 15 ,30 min.
-Currency pairs: majors, btc , futures and volatile stock.
Other Chart indicators:
Add EWO bb.
Optionally Add Squeeze Indicato or bbsqueeze .
Here's the strategy:
// Going LONG:
Enter a long position when CFB has crossed up through the Bollinger upper band (lime) . At the same time, the EWO BB or BBqueeze should be approaching or crossing it's zeroline, going up. This is indicated by "Buy" alert.
// Going SHORT:
Enter a short position when CFB has crossed down through the low Bollinger red. At the same time, the EWO BB or BBqueeze should be approaching or crossing it's zero line, going down. This is indicated by the "Sell" Alert.
// Take profit:
// 10-20 pips depending on pair or When Awesome Oscillator turns a different color.
// HINTS: Best trades tend to occur when price reversing bounce off outer band and and outside Optional Bollinger Squeeze indication.
PPSignal BB-EWO BB $ CFB Strategy ScalpThis indicator is an implementation of the Bollinger Band and EWO Oscillator and CFB Scalping system.
This technique is for those who want the most simple method that is very effective. It is BEST traded during the busiest trading hours, 3am to 12am EST NY time. This method doesn't work in sideways markets, only in volatile trending markets.
-Time Frames: 1, 5, 10, 15 ,30 min.
-Currency pairs: majors, btc , futures and volatile stock.
Other Chart indicators:
Add EWO bb.
Optionally Add Squeeze Indicato or bbsqueeze .
Here's the strategy:
// Going LONG:
Enter a long position when CFB has crossed up through the Bollinger upper band (lime) . At the same time, the EWO BB or BBqueeze should be approaching or crossing it's zeroline, going up. This is indicated by "Buy" alert.
// Going SHORT:
Enter a short position when CFB has crossed down through the low Bollinger red. At the same time, the EWO BB or BBqueeze should be approaching or crossing it's zero line, going down. This is indicated by the "Sell" Alert.
// Take profit:
// 10-20 pips depending on pair or When Awesome Oscillator turns a different color.
// HINTS: Best trades tend to occur when price reversing bounce off outer band and and outside Optional Bollinger Squeeze indication.
// References:
https://www.forexstrategiesresources.com...

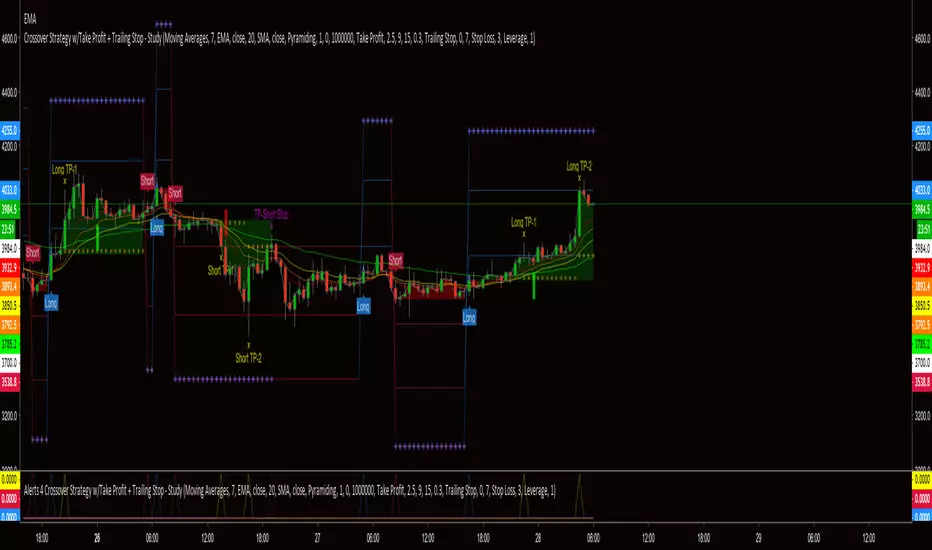
Crossover Strategy w/Take Profit + Trailing Stop - StudyThis script is a result of hours of trail, error and research. If something is not functioning as anticipated, please notify me with a description and possible screen shot of the issue.
The strategy is a basic crossover strategy. When MA1 crosses above MA2, it will trigger a long entry. When MA1 crosses below MA2, it will trigger a short entry.
When using the Take Profit function, the trailing stop will automatically activate at the defined TP3 level.
Also, when TP1 is hit a stop loss is set at 0.3% (this can be adjusted in settings) above/below the current entry. When TP2 is achieved, the stop will move up to the TP1 level.
If the trailing stop locks in LESS profit than the TP2 level, the stop will trigger at the TP2 level. This will continue until the trailing stop has moved to a level more advantageous than TP2.
There is a companion Alerts script for use with AutoView.
***AutoView syntax IS NOT provided***
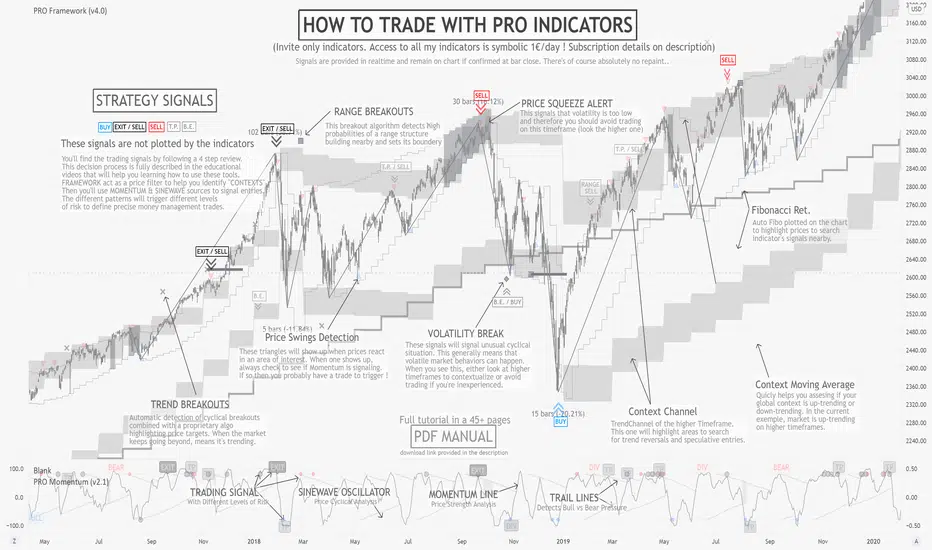
PRO FrameworkINVITE ONLY SCRIPT:
FEATURES:
As its name suggests, Framework is here to offer a non-subjective frame of reference to traders. Effectively filtering 90% of prices offering poor risk management opportunities. More importantly this is a multi-timeframe tool that will scan across three time frames all at once, offering a final synthesized rendering. Our goal was to provide a professional grade dynamic price analysis without bloating the chart with numerous plots. Nevertheless they are complex tools requiring extensive learning. To support students in their journey, there is a wide open online community of users in our Discord channel, providing peer-to-peer assistance to progress with the strategy as well as tutored courses.
OUTPUTS:
To share a brief description of the indicators functioning, we will scroll through the major set of outputs that are presented to the user. Please note that the indicator is meant to assist from Junior to Senior expertise, to achieve this we have set different base templates right into the indicators. To keep this description simple, we will present the outputs you’ll see with the beginner setup:
Context Channel: composed of two “ribbons” one above the price and one below. It represents the dynamic zones of supply and demand, where prices are likely to find support and resistance for the given chart timeframe. They are representing complex algorithmic versions of channels evolving over time, while adapting to both ranges and trend conditions. Allowing to visualize the current price channel which the price is trading within, but also review the history of past dynamics. Ultimately, studying both the recent and past context behavior tells us everything we need about the price structure.
Average Price: Corresponding to a simple 20 period moving average synchronized with the context channel reference timeframe. Looking at the channel’s position relative to this average will help us define the “context” of the market, thereby filtering the patterns we will be able to apply to this chart (range, trend, volatility).
Breakout Targets: represented by small plots on the chart (cross, square, diamond) they inform the trader that the market is attempting to move in a particular direction. Given the predetermined context in which that pattern triggers, this will help us in managing the risk.
Price Confirmations: corresponding to the small triangle plots on the chart, they are automatically calculated to determine areas where other traders might have taken actions. These triangles aren’t a trading signal per say, they will be the trigger for our trades with the PRO Strategy, but only when patterns are active (meaning we are in the right context, and have enough risk limitation elements to justify entry).
Auto-Fibonacci: As most of our patterns include certain retracement rules, we decided to include a built-in fibonacci plotting tool. The outputs will automatically update with new prices, allowing users to use it as a trigger for the TradingView alerts system.
Automated Context Detection: the actual real Intellectual property and added value of PRO Indicators resides in our semi-automated system, based on the complex algorithmic detection of potentially favorable contexts to apply the strategy on. This also means that you can set alerts, and let the cloud monitor the market and be notified when the conditions are deemed viable. As you progress to more Senior contexts and adjust the indicators’ template setup, more complex alerts will be detected.
GENERAL STRATEGY:
Overall, the PRO Strategy combines two “core” indicators, Framework and Momentum. Framework is plotted on the main chart section as an overlay, it is definitely the most important as it guides the user through the hard process of filtering prices and timeframes that are suitable for technical analysis. On the other hand, PRO Momentum is on a separate oscillator tab under the chart section, it will study the momentum and cyclical structure, also offering automated pattern detection. Ultimately, our strategy is based on collecting and processing non-subjective rules, emanating from the indicators outputs. Essentially, this means that the indicator actually takes care of producing all the necessary binary outputs, leaving you with the remaining task of combining them correctly following the strategy’s patterns.
RISK LIMITATION:
Even if we provide semi-automated detection of viable contexts, there is no “one-click” or "easy-win” solution, the user still needs to carefully review the elements. When applicable pattern rules are confirmed, the user will gather risk-limitation information (breakout targets, price confirmations, momentum and cyclical coordination) and decide whether or not to trade according to its own risk profile. If so, the position sizing, stop-loss positioning, risk management and profit targets will all be defined according to the same indicator’s outputs. This effectively suppresses most behavioral and personal biases the trader could introduce, creating a stable and statistical risk management structure aiming for a durable profitability.
Bones1390's GANN Strategy AlertsThese are the alerts to go along with my GANN Strategy. You can find the strategy here:
If you like my stuff, leave me a comment below.
If you're feeling kind or want to show some appreciation, you can donate Bitcoin to this Address here:
3Jp9Kow1VxvzAiLLwCdeeQ2g11wKyaT4rC
Also if there's anything you want to talk about PM me! I'm free to speak about anything. Want a custom indicator? I can do my best to code it for you!
Thanks!
Bones

🥢Crypto-Sticks: Momentum 1.0 by Cryptorthyhms🥢 Crypto-Sticks™ Momentum
A new series of indicators brought to you by Cryptorthyhms...giving you an alternate look at your trusted favorites!
🚀 Indicator Specific Info
Momentum can be a tricky indicator sometimes. Since it doesnt go into predictable overbought or oversold zones, it rather just oscillates around zero - making it harder to create a signals strategy. On the default view I tend to look for 2 candle "flat tops" and "flat bottoms" with one or both containing a decent wick.
Heiken Ashi candles adds some more clear entry exit points which can be executed at the second candle going in either direction (applicable only to this chart on 4H - other coins/charts will require their own strategy). For instance, enter on 2nd green, exit on 2nd red.
Volume weighting the HA candles adds a different dimension to the indicator which I have to explore more fully. Please leave me any ideas or feedback you have!
🚫If using HA or VW+HA, the strategy about "flat candles" doesnt apply anymore.
🚀 Crypto-Sticks General Info
💭This series isnt polished 100%, and I have some more options I will add in the future. But for now, I want to just release them, as I am not sure when I will have the time to put more work into them (many other big projects I am working on).
📊Its basically reinterpretations of all your favorite indicators. I calculate the values a little bit differently than normal, but the end result is creating a candlestick chart (for the indicator!). Then I added the option to plot them as Heiken Ashi candles to smooth out noise and make signaling easier. Here's how it looks as Heiken Ashi:
🔊Lastly I implemented a Volume Weighting system for them all which simply integrates volume into the formulas for these indicators. For the most part this feature is experimental and doesn't provide huge utility (yet - I have other ways I want to try it as well - just no time). Though on some of the indicators it already shows great promise. Here is Volume Weighted + Heiken Ashi:
👍Enjoying this indicator or find it useful? Please give me a like and follow! There are many more indicators to be released in this series, not to mention I post crypto analysis and other free indicators regularly.
💬Questions? Comments? Want to get access to an entire suite of proven trading indicators? Come visit us on telegram and chat, or just soak up some knowledge. We make timely posts about the market, news, and strategy everyday. Our community isnt open only to subscribers - everyone is welcome to join.

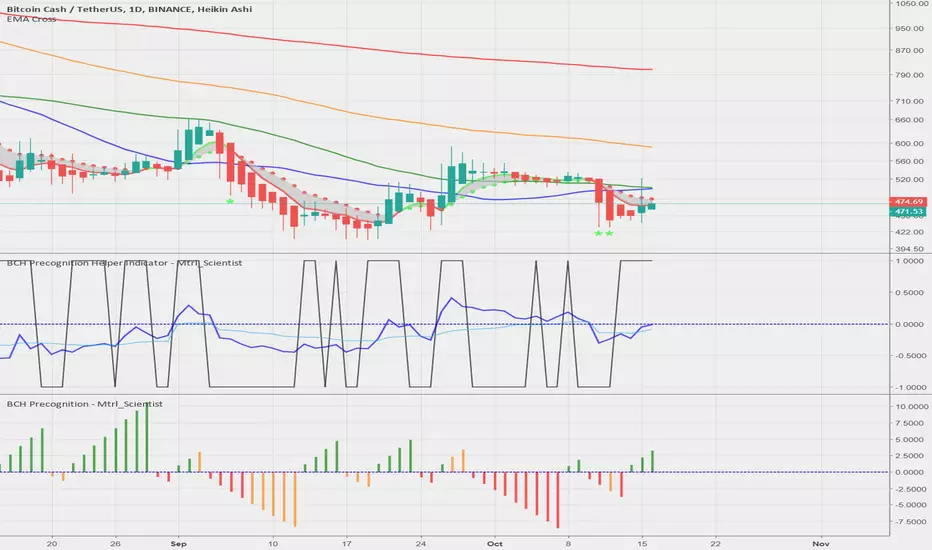
BCH Precognition - Mtrl_Scientist (study version)Hey everyone!
As requested, this is the study version of the improved 'BCH- Precognition' algorithm, meaning you'll only see the indicator and not have 'longs/shorts' painted on your chart.
- Works better with normal candles now, as internal calculations are forced to be done on Heikin Ashi, regardless of chosen candle format
- Turned into a study, rather than strategy, as not to interfere with strategies that are already in place
- Added Overbought/Oversold conditions (orange) with adjustable threshold, based on normalized price action helper indicator
Green means buy condition is valid, red mean short condition is valid, and orange means overbought/oversold (adjustable in settings).
Reminder: Only for use with BCHUSD, as it draws data for that coin from specific exchanges!
These changes were also added to the strategy version.
Please let me know what you would like to see improved!
BTC Precognition - Mtrl_Scientist (study version)Hey everyone!
This is the study version of the improved 'BTC - Precognition' algorithm, meaning you'll only see the indicator and not have 'longs/shorts' painted on your chart.
- Works better with normal candles now, as internal calculations are forced to be done on Heikin Ashi, regardless of chosen candle format
- Turned into a study, rather than strategy, as not to interfere with strategies that are already in place
- Added Overbought/Oversold conditions (orange) with adjustable threshold, based on normalized price action helper indicator
Reminder: Only for use with BTCUSD, as it draws data from specific exchanges!
I will also add these changes to the strategy version.
Please let me know what you would like to see improved!

Dane - MA StudyThis strategy has been developed as a development service. It is published for customer acceptance and verification. As such, I am unable to provide access to anyone other than the paying customer. Sorry about that.
For those interested in development services, please check out the backtest-rookies (.com) website.
MA Study
This is a study version of the Dane - MA Strategy with few extra features:
Position Simulation - So we can synchronise with the strategy.
Alerts for Going Long, Short and exiting positions
Plotting entry/exit and close markers
Plotting dots at the bottom of the chart to show whether we are in a simulated long, short or flat state.

-- Ultimate Crypto Trading Strategy -- By @CryptoNTez -- Ultimate EMA Cross Strategy. Easy and profitable strategy optimized for Crypto.
This script will signal Long and Exit signals on different timeframes based on different indicators using HA candles
The script is optimized to catch trend movements as soon as possible and maximize profitability.
Check the Strategy tester results. 92% Profitable on BTC Daily scale...
If you want access send me a PM on Tradingview or a DM in twitter @CryptoNTez.
Best regards and happy trading.

08-2018 Stochastic 5m [ALERT SETUP] [INDICATOR]This is an accumulation of small buy orders and a complete sell order strategy, that can be used for manual trading or for a trading bot. The strategy is based on stockastic divergences ( an indicator that I made myself and is published on my profile earlier ), and I added my personnal touch of course. Note that the bullish and bearish stochastic divergences are calculated separately and can be configured in the inputs.
To be used with a 5m timeframe, and on a flat or bullish pair.
Everyone can favorite the script, apply it to the chart, but only I can see or modify the code. If you need anything, leave a comment, thanks :D
More info about the script, such as inputs description, how to configure the script, strategy explanation, alert configuration can be found here : blockchainfiesta.com
--------------------------------------------------------------------------------------------------------------
I do commission work: TradingView Pine Script development & Reverse Engineering.
contact@blockchainfiesta.com.
You can also send me a message in TradingView or Discord (discord.gg)
Bitcoin address: 19sVQvCDmVfEACq7BiMnWSMqFPZ8qfSQ2K
ETH address: 0xc8a5d3a63a05db0c2363ea1c08b37a01cce9ebfb

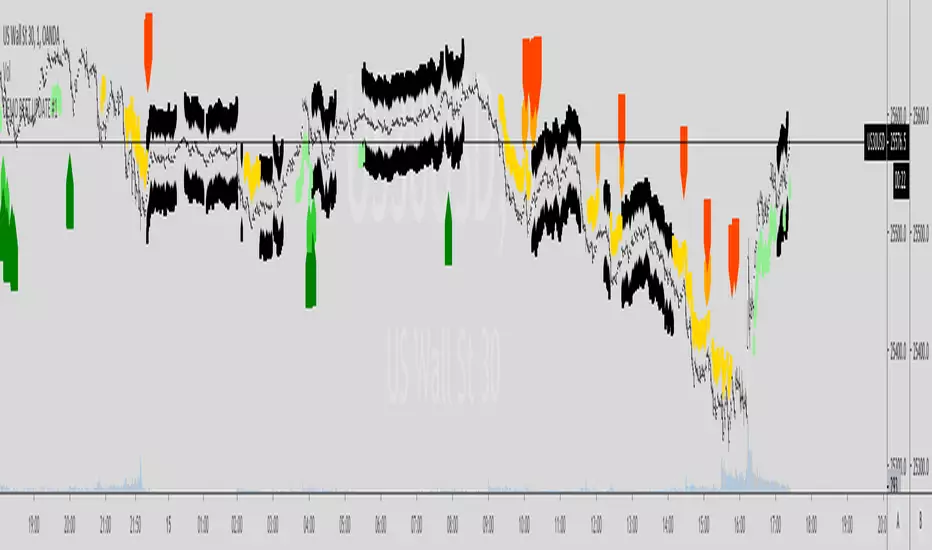
EdgeAnalysisGroup Volume Cloud V1.1EdgeAnalysisGroup Volume Cloud V1.1
Brief Intro
I will keep this sweet and simple so I can write about it elsewhere in greater deal later down the line.
I had the idea for this script when I saw the EMA ribbons indicator, and noticed something that was happening on the line crosses. I then tried to find a way to optimise the strategy for the fast moving volatile crypto-currency market~ this is where I came up with this indicator which was based of moving averages and volume, but was tradable like a cloud with an area. Another factor I decided to take from the ichimoku cloud was the offset it provides- this allows a clean image for the user to trade with and pre-plan.
This guaranteed a clear cut trading strategy which I could easily backtest and tweak for optimisation.
I can say this indicator seems to work well for the 1day chart.
There is lots I have to learn about the line crosses, and the direction of the cloud etc., so we can create new trading strategies.
This script will work better on some charts than others, but hopefully it is still a hit for most and all time frames.. I have alot of backtesting to do with this indicator on all markets- and potentially some heavy quality of life updates and technical tweaks too.
Trading strategy
Taking a position
There are 3 lines on the topside and the bottom side of the cloud.
Open : Price crossing and closing the middle line of the 3.
Stop-loss: Outer line of the 3 it has already crossed.
Target: Inside line of the opposite 3 it hasn't crossed. Any STRONG supports/resistances need to also be taken into account and price assessed as usual as the move is completing- manual closes are a big part of management.
VolumeCloud Twists
If there is a twist- (the 6 lines crossing across each other) this can either be bullish or bearish depending on the direction of the cloud, this is an early sign of a trend forming.
When it is above the cloud we can expect retests of the upper/lower lines on pullbacks. I am developing a trading strategy currently for breaks above the cloud with twists so stay tuned for that.
ETH/BTC Backtest
A small backtest on ETH/BTC gave an 80%+ win rate, this is a small sample size of about 25 positions or so, but with such a strong win rate I can only imagine it could be a strong tool to a clever trader.
Did you enjoy this brief little guide, why not join me and the other members of the EdgeAnalysisGroup ?
Message me on tradingview and I'll shoot you a link to our discord. Here you can get access to more indicators, a fantastic community and even high quality signals made by me and a few other top traders.
Xander
All information found here, including any ideas, opinions, views, predictions, forecasts, commentaries, suggestions, indicators, or stock/cryptocurrency picks, expressed or implied herein, are for informational, entertainment or educational purposes only and should not be construed as personal investment advice. These are not facts but my personal views and opinions.
I will not and cannot be held liable for any actions you take as a result of anything you read or use here,

Draculapresley Daytrading STRAT O' DOOM 1.3Very excited with my results after extensive testing I present the Strat O Doom version 1.3!
Using some custom settings with a few indicators and a custom movement algorithm I have fine tuned my strat even further. The strat now lends itself to quick trades but also better at finding longer movements as well.
I appreciate everyone participating and engaging with my last version and anyone who has donated will get access to the new settings!
For access please consider a donation...
BTC
19sbyzKm9PqYizeFgTkT1gSRvyfBNa2bn7
ETH
0x6b8ef9f4979df6efd51e745ba996299349d67306
LTC
LLMUH5v5DeurLZEeX2Atu9W36vLA1pTX7o
For donation confirmations or script purchase you can email draculapresley@gmail.com

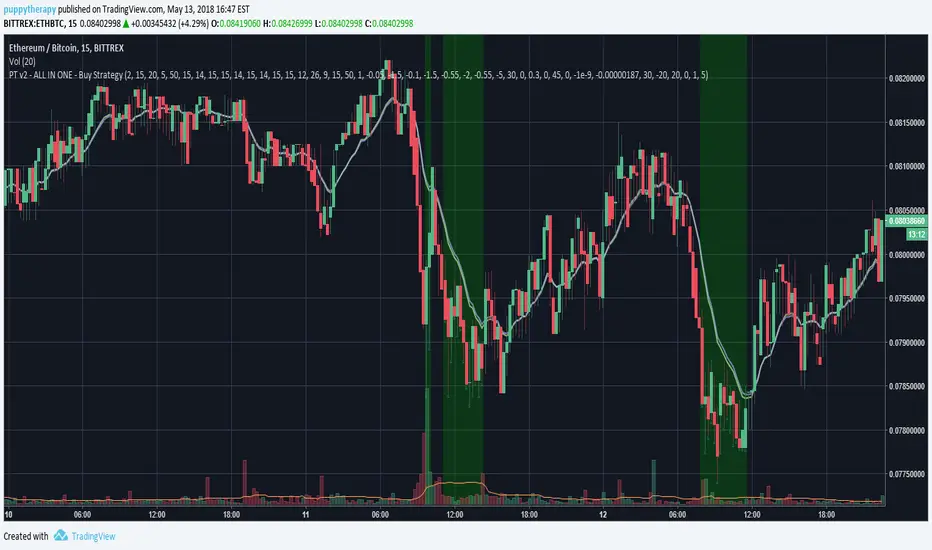
PT v2 - ALL IN ONE - Buy StrategiesBacktesting script for Profit Trailer.
It will mark with green color the area when all the strategies you select are gonna be true.
Strategy Description:
wiki.profittrailer.com
In Progress:
- OBV is still missing
- better visualisation
ICC WAVE STRATEGY SCRIPTwww.inflow-crypto.club
Proprietary developed, cutting-edge, scalping/swing trading hybrid >ICC< WAVE strategy.
This approach, developed in 2015 has been proven across different financial markets. Bringing together the best of both worlds for a risk-averse person with a tendency to look for minimal drawdown and a person with high-risk tolerance that is more oriented to maximize profits. The strategy can be applied to day trading on small time frames or/and swing trading on 4H and Daily time frame.
>ICC< WAVE and >ICC< TREND CONDITIONS indicators show you when suitable trend conditions are in place for high probability trades in the direction of 1-hour down to 5-minute trend (you can change the parameters for higher time frames).
- Red color indicates a bearish trend
- Blue color indicates a bullish trend
- 1st row (starting on top) is >1-h< trend, Blue = long, Red = short
- 2nd row (starting on top) is >15-min< trend, Blue = long, Red = short
- 3rd row (starting on top) is >5-min< trend, Blue = long, Red = short
- 4th row (starting on top) is a combination of rows 1-3. It shows when row 1-3 are in line for high probability long or short trades.
- When the 4th row is colored RED, it means that the conditions for sell (short) trades are in place.
- When the 4th row is colored BLUE, it means that the conditions for buy (long) trades are in place.
- When the 4th row is colored GRAY, it means that there is indecision between buyers and sellers, the market is in process of rolling over or consolidating. This means that there are no favorable conditions for >ICC< WAVE strategy trading and you should stay out of the market until there is a clear direction.

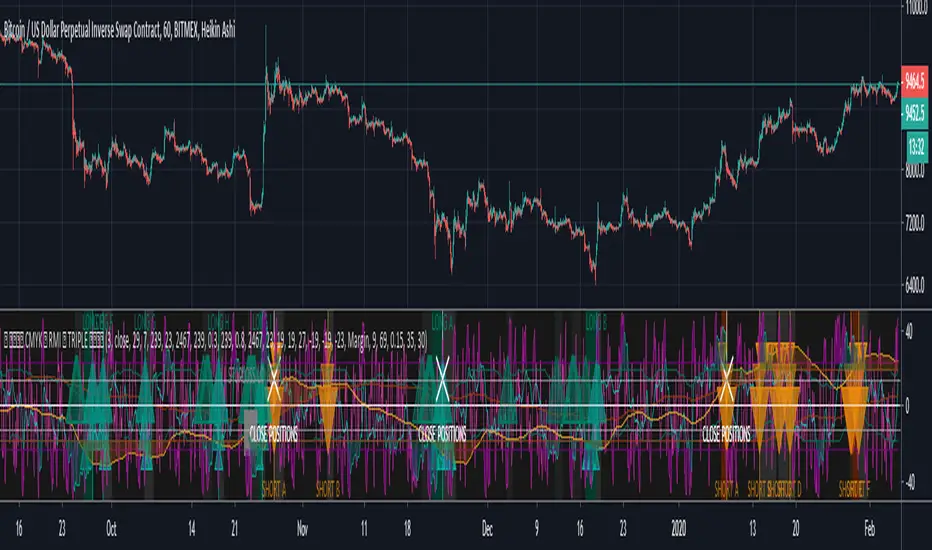
CMYK RMI TRIPLE Automated study for Autoview▼ This is the study version of the script, For usage with Autoview
◊ Introduction
This script makes use of three RMI 's, that indicate Overbought/Oversold on different timescales that correspond with Frequency’s that move the market.
◊ Origin
The Relative Momentum Index was developed by Roger Altman and was introduced in his article in the February, 1993 issue of Technical Analysis of Stocks & Commodities magazine.
While RSI counts up and down ticks from close to close, the Relative Momentum Index counts up and down ticks from the close relative to a close x number of days ago.
This results in an RSI that is smoother, and has another setting for fine tuning results.
This bot originated out of Project XIAM , an investigative script that outlined my approach towards Automated Trading Strategies.
Are you interested in writing bots yourself ? check out the beta version of this script.
It has many bugs, but also most of the Skeleton.
◊ Usage
This script is intended for Automated Trading with AUTOVIEW or TVAUTOTRADER , on the 1 minute chart.
◊ Features Summary
Overlay Mode
Indicator Mode
Three RMI's
Trend adjustment
Pyramiding
Ignore first entries
Take Profit
Stop Loss
Interval between Entries
Multiring Fix
Alert signal Seperation
◊ Community
Wanna try this script out ? need help resolving a problem ?
CMYK :: discord.gg
AUTOVIEW :: discordapp.com
TRADINGVIEW UNOFFICIAL :: discord.gg
◊ Setting up Autoview Alerts
Use the study version of this script, To set up The Alerts Autoview Picks up on.
The Signals to work with are :
Open 1 Long
Use this to open one Long Position.
With quantity being : /
Once per bar
Being larger than 0
Comment example : e=exchange b=long q=amount t=market
Open 1 Short
Use this to open one Short Position.
With quantity being : /
Once per bar
Being larger than 0
Comment example : e=exchange b=short q=amount t=market
Close1 Position
Use this to Close The amount of one Open Position.
With quantity* being : /
Once per bar
Being larger than 0
Comment example : e=exchange c=position q=amount t=market
*Beware when using a percental % quantity, instead of an absolute quantity.
Percental Quantities are based on the , Not
And will change in absolute value relative to the amount of open trades.
Close All positions
Use this to Close All Open Positions.
With quantity being :
Once per bar
Being larger than 0
Comment example : e=exchange c=position t=market
For the specific Syntax used in the comment of the alert, visit Autoview .
◊ Setting up TVAutotrader
Use the strategy version of this script, And load it into TVAT .
◊ Backtesting
Use the strategy version of this script for backtesting.
◊ Contact
Wanna try this script out ? need help resolving a problem ?
CMYK :: discord.gg
until1mil StrategyDo not let the strategy lead your trades. Strategies should be a confirmation of your knowledge.

Aggressive Pullback IndicatorThis indicator is designed to be used with the rules of Steven Hart's Aggressive Pullback Strategy. It is intended for use on the 4-hour timeframe but will work on all timeframes. The rules are customizable, but the default settings are:
Minimum Candle Pullback: 2
How Many Candles We Can Engulf: 3
Override Rule #2 If Candle's Body % of ATR Is Less Than: 99%
ATR Length: 14
EMA Length (close): 50
How Far To Look Back For Swings: 5 bars (this is used to invalidate engulfing candles that close above the swing high/lows that started the 2 candle pullback)
Visit www.thetradingchannel.net or www.youtube.com for information on how to use the strategy correctly (and profitably)!
* Note that like all indicators, it is not 100% accurate and will miss some signals. But it does catch the majority of them :)

Bollinger Awesome Alert R1 by JustUncleLThis indicator is an implementation of the Bollinger Band and Awesome Oscillator Scalping system.
This technique is for those who want the most simple method that is very effective. It is BEST traded during the busiest trading hours, 3am to 12am EST NY time. This method doesn't work in sideways markets, only in volatile trending markets.
Time Frames: 1, 5, 10, 15 ,30 min.
Currency pairs: majors.
Other Chart indicators:
Add Awesome Oscillator.
Optionally Add Squeeze Indicator.
Here's the strategy:
Going LONG:
Enter a long position when the black 3 EMA has crossed up through the Bollinger red middle band MA. At the same time, the Awesome should be approaching or crossing it's zeroline, going up. This is indicated by "Buy" alert.
Going SHORT:
Enter a short position when the black 3 EMA has crossed down through the Bollinger red middle band MA. At the same time, the Awesome should be approaching or crossing it's zero line, going down. This is indicated by the "Sell" Alert.
Take profit:
10-20 pips depending on pair or When Awesome Oscillator turns a different colour.
HINTS: Best trades tend to occur when price reversing bounce off outer band and outside the Optional Bollinger Squeeze indication.

BB and RSI Indicator Alert v0.3 by JustUncleLI have just recently revised this indicator alert for public release. This is for the 60sec Bollinger Band break Binary Option traders.
This indicator alert is a variation of one found in a well known Broker's marketing videos. It uses Bollinger bands, RSI and moving averages. Included is a pre-warning alert condition. The strategy and settings are designed for 1min charts and Binary Options, but it could work for up to 15 min charts.
The default settings are BB(14,2) and RSI(11) with 75/25 Levels boundaries. To be a valid trade the RSI needs to be within 75/25 channel. The optional Market direction filter is enabled by default and is calculated by two EMA (200 and 50):
When 200ema rising and 50ema above 200ema then market going up.
When 200ema falling and 50ema below 200ema then market going down.
A potential Bollinger Break reversal trades identified by shapes: The purple diamond is the pre-warning purple alert and the green and red pointers with the PUT/CALL labels are the trade alerts. Make Binary Option trade in specified direction 60sec (or can also use 120sec trade without Martingale).
* Notes and Hints *
The original videos specified a Martingale money management strategy, be careful using this management. When I use Martingale I recommend go to 3 levels: 10, 25, 65 if no win at 65 stop trading this alert and start next alert back at 10, you should recovery loss by future wins given you are able to get a reasonable ITM rate with this strategy. Alternatively instead of using Martingale use 120sec Binary Option trade.
Be wary of break alerts on a steep Bollinger, they tend to keep running away for awhile, especially if steep on both sides of Bollinger channel.
As with most of this style of indicator the alert conditions will redraw until the candle is closed. For me this is okay, as it is an Alert is only to a potential trade and final decision to trade is made by me.
You need to practise this and be aware of market news, sessions boundaries, slow trading periods etc. Plan your periods of when you should trade, I prefer Asian session before lunch and London sessions.

4All-Alert ScriptThis is the alert script for automating a previously shared strategy.
You can get the strategy script and instructions for setting it up here: