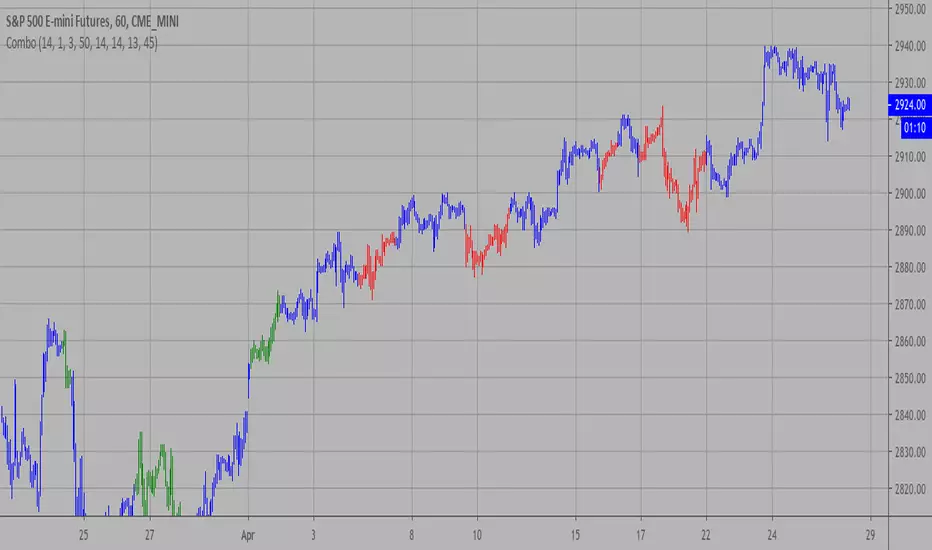
MrBS:Directional Movement Index [Trend Friend Strategy]This goes with my MrBS:DMI+ indicator. I originally combined them into one, but then you cannot set alerts based on what the ADX and DMI is doing, only strategy alerts, so separate ones have more flexibility and uses.
Indicator Version is found under "MrBS:Directional Movement Index " ()
//// THE IDEA
The majority of profits made in the market come from trending markets. Of course there are strategies that would say otherwise but for the majority of people, THE TREND IS YOUR FRIEND (until the end). The idea is to follow the trend, entering once it has established its self and exiting positions when the trend weakens. This strategy gives a rough idea of the returns produced from following purely the ADX signals. At first Heikin Ashi values were used for the calculation but the results show it's not that effective. The functionality to switch between calculation types has been left in, so we can uses HA candle data to generate signals from while looking at an OHLC chart, if we want to experiment. Due to the way strategies work, we are unable to get reliable results when running the strategy on the HA chart even if we are calculating the signals from the real OHLC values. It is best to always run strategies on standard charts.
When using this strategy, I look for confirmation of the signal based on stochastic (14:3:6) direction, reversal level of stochastic, and divergance, to add confidence and adjust position size accordingly. I am going to try and code some version of that in future updates, if anyone can help or has suggestions please drop me a message.
//// INDICATOR DETAILS
- The default settings are for optimized Daily charts, for 4 hour I would suggest a smoothing of 2.
- The default values used for calculation are the Real OHLC, we can change this to Heikin Ashi in the menu.
- The strategy enters a position when ADX crosses the threshold level, and closes the position when ADX starts to fall.
- There is a signal filter in the form of a 377 period Hull Moving Average, which the price must be above or bellow for long and short positions respectively.
- The strategy closes the position when a cross-under of the ADX and its 4 period EMA. This is an attempt to stay into positions longer as sometimes the ADX will fall for 1 bar and then keep rising, while the overall trend is strong. The downside to this is that we exit trades later and this affects our max drawdown.
Cari skrip untuk "the strat"

Bull Call Spread Entry StrategyThis strategy script uses the "Spread Entry Strength" overlay indicator script I designed to show entry timing optimized for an Option Bull
Call Spread.
As for this strategy...
The defaults for the strategy itself are as follows:
Period for strategy: 1/1/18 to 12/1/2021. This can be changed to a different period using the settings.
Condition for entry:
Bull Spread Entry Strength >= "Overlay Signal Strength Level"
Limit entry is used, price must be <= close when signaled
Entry occurs by next day or the order is cancelled
Condition for exit (uses a timed exit):
Bars passed since order entry >= 30 (6 weeks..~42 calendar days)
Thursday (day before "option" expiration date... assuming weekly options exist)
All of the user settings from the overlay are pulled into this for customization purposes. Details of the actual Spread Entry Strength overlay are as follows (copied from my shared indicator):
2 background shadings will occur:
The background will shade blue if the ticker is prime for a Bullish Call spread.
The background will shade purple if the the ticker is prime for a Bearish Put spread.
In theory, if the SE Strength is at one of the extremes of the Bear or Bull side, then a spread is prime for entry.
To calculate this, 8 conditions receive a 1 or zero dependent on whether the condition is true (1) or false (0), and then all of those are summed. The primary gist of the strength comes from Nishant's book, or my interpretation thereof, with some additives that limits what I need to review (such as condition 8 below.)
The 8 Bull Conditions are:
1) Bollinger Bands are outside of the Keltner Channels
2) ADX is trending up
3) RSI is trending up
4) -DI is trending down
5) RSI is under 30
6) Price is below the lower Keltner Channel
7) Price is between the lower Bollinger Band and the Bollinger basis.
8) Price at one point within the last 5 bars was below the lower Bollinger Band
The 8 Bear Conditions are the inverse conditions (except the first):
1) Bollinger Bands are outside of the Keltner Channels
2) ADX is trending down
3) RSI is trending down
4) +DI is trending up
5) RSI is over 70
6) Price is above the upper Keltner Channel
7) Price is between the upper Bollinger Band and the Bollinger basis.
8) Price at one point within the last 5 bars was above the upper Bollinger Band
There is a "market noise" filter that will filter out shading when another market move is considered, i.e. if you don't want to see the potential trade when QQQ moves more than 1% then do the following in the settings:
Check "Market Filter"
Enter QQQ in the "Market Ticker To Use"
Enter 1 in the "Market Too Hot Level"
Press Ok
Obviously, the same holds true for the "Market Too Cool Filter."
Second release notes:
Overlay Signal Strength Level - You can set your own "level" for the overlay in the settings, instead of having to change the script code itself. I have the default set to 6. A lower number shows more overlays, a higher number shows fewer (i.e. more conditions have been met.).
Provide Narrative (Troubleshooting) - Narrative label created with several outputs that will show after the last bar. This narrative needs to be turned on in the settings, as the default is "off" ... unchecked.
Remove Strength Indicator When Squeezed - when checked no overlays will be produced regardless of "scoring." Default is off.
Show Squeezes (Will Override Indicator When Concurrent) - overlays an orange background when the ticker is in a squeeze. I am still working on the accuracy here, but it's usable. This will override the strength indicator as well. This needs to be turned on, if you want it.
Short SMA Period - period used to calculate the short SMA, used in the narrative only, at this point in time.
Medium SMA Period - period used to calculate the medium SMA, used in the narrative only, at this point in time.
Long SMA Period - period used to calculate the medium SMA, used in the narrative only, at this point in time.
Outside of the settings... a few calculation adjustments here and there have occurred and some color shading adjustments to allow for the adjustable level setting.

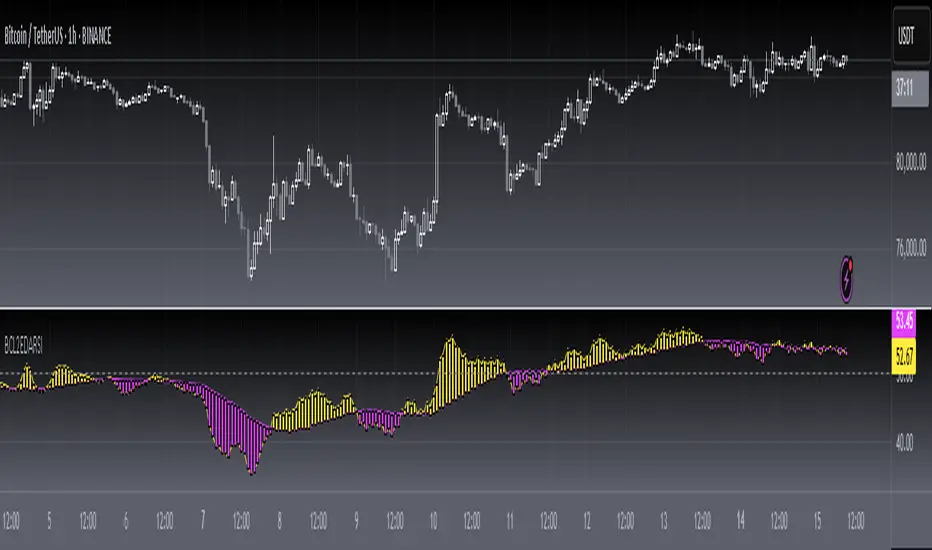
[blackcat] L2 Ehlers DFT-Adapted RSILevel: 2
Background
John F. Ehlers introuced his DFT-ADAPTED RELATIVE STRENGTH INDEX (RSI) in Jan, 2007.
Function
In "Fourier Transform For Traders" in Jan, 2007, John Ehlers presented an interesting technique of improving the resolution of spectral analysis that could be used to effectively measure market cycles. Better resolution is obtained by a surprisingly simple modification of the discrete Fourier transform. John Ehlers suggests using the discrete Fourier transform (DFT) to tune indicators. Here, I demonstrate this by building a DFT-adapted relative strength index (RSI) strategy.
Rather than display the RSI for a single cycle length across the entire chart, Ehlers DFT adaptive RSI value reflects the DFT-calculated dominant cycle length RSI. If the dominant cycle changes from 14 to 18 bars, the RSI length parameter changes accordingly. Computationally, this requires the strategy to continuously update values for all possible RSI cycle lengths via a "for" loop and array.
In details, a full-featured formula that implements a high-pass filter (HP) and a six-tap low-pass finite impulse response (FIR) filter on input, then does discrete Fourier transform calculations. I has taken liberty of adding extra parameters so the user can modify the analysis window length and the high-pass filter cutoff frequency in real time using the parameters window. Once the suite of possible RSI values is calculated, we use the DFT to select the relevant RSI for the current bar. The strategy then trades according to J. Welles Wilder's original rules for the RSI.
Key Signal
fastline--> DFT-ADAPTED RELATIVE STRENGTH INDEX (RSI) fast line
slowline--> DFT-ADAPTED RELATIVE STRENGTH INDEX (RSI) slow line
Pros and Cons
100% John F. Ehlers definition translation, even variable names are the same. This help readers who would like to use pine to read his book.
Remarks
The 71th script for Blackcat1402 John F. Ehlers Week publication.
Based on original work of Ehlers, I added ALMA smoothing on DFT-adapted relative strength index (RSI) so that clearer trend can be observed.
Readme
In real life, I am a prolific inventor. I have successfully applied for more than 60 international and regional patents in the past 12 years. But in the past two years or so, I have tried to transfer my creativity to the development of trading strategies. Tradingview is the ideal platform for me. I am selecting and contributing some of the hundreds of scripts to publish in Tradingview community. Welcome everyone to interact with me to discuss these interesting pine scripts.
The scripts posted are categorized into 5 levels according to my efforts or manhours put into these works.
Level 1 : interesting script snippets or distinctive improvement from classic indicators or strategy. Level 1 scripts can usually appear in more complex indicators as a function module or element.
Level 2 : composite indicator/strategy. By selecting or combining several independent or dependent functions or sub indicators in proper way, the composite script exhibits a resonance phenomenon which can filter out noise or fake trading signal to enhance trading confidence level.
Level 3 : comprehensive indicator/strategy. They are simple trading systems based on my strategies. They are commonly containing several or all of entry signal, close signal, stop loss, take profit, re-entry, risk management, and position sizing techniques. Even some interesting fundamental and mass psychological aspects are incorporated.
Level 4 : script snippets or functions that do not disclose source code. Interesting element that can reveal market laws and work as raw material for indicators and strategies. If you find Level 1~2 scripts are helpful, Level 4 is a private version that took me far more efforts to develop.
Level 5 : indicator/strategy that do not disclose source code. private version of Level 3 script with my accumulated script processing skills or a large number of custom functions. I had a private function library built in past two years. Level 5 scripts use many of them to achieve private trading strategy.
[blackcat] L2 Ehlers ITrendline Trigger Trend-Following SystemLevel: 2
Background
John F. Ehlers introuced the Instantaneous Trendline and the Trigger of the trend-following system in his "Cybernetic Analysis for Stocks and Futures" chapter 3 on 2004.
Function
The process for creating a trendfollowing trading system from the indicators is simple. One unique aspect of the code is that the ITrend is forced to be a finite impulse response (FIR)-smoothed version of price for the first seven bars of the calculation.
This initialization is included to cause the ITrend to converge more rapidly to its correct value from the beginning transient. The strategy enters a long position when the trigger crosses over the Instantaneous Trendline and enters a short position when the trigger crosses under the Instantaneous Trendline. However, an effective trading system is more than following a simple set of indicators.
First, experience has shown that greater profits result from using limit orders rather than market orders or stop orders. Market orders are selfexplanatory. Stop orders mean the market must be going in the direction of the trade before the order is filled. For example, for long-position trades, the stop order must be placed above the current price. Thus, the price must increase from its current level before you get stopped into the long-position trade. This means you necessarily give up some of the profits you would otherwise have gotten if you had entered on a market order at the instant of your signal. You can lose additional profits from stop orders due to slippage.
Key Signal
Trigger ---> trend-following system fast line
ITrend ---> trend-following system slow line
Pros and Cons
100% John F. Ehlers definition translation of original work, even variable names are the same. This help readers who would like to use pine to read his book. If you had read his works, then you will be quite familiar with my code style.
Remarks
The 22th script for Blackcat1402 John F. Ehlers Week publication.
Readme
In real life, I am a prolific inventor. I have successfully applied for more than 60 international and regional patents in the past 12 years. But in the past two years or so, I have tried to transfer my creativity to the development of trading strategies. Tradingview is the ideal platform for me. I am selecting and contributing some of the hundreds of scripts to publish in Tradingview community. Welcome everyone to interact with me to discuss these interesting pine scripts.
The scripts posted are categorized into 5 levels according to my efforts or manhours put into these works.
Level 1 : interesting script snippets or distinctive improvement from classic indicators or strategy. Level 1 scripts can usually appear in more complex indicators as a function module or element.
Level 2 : composite indicator/strategy. By selecting or combining several independent or dependent functions or sub indicators in proper way, the composite script exhibits a resonance phenomenon which can filter out noise or fake trading signal to enhance trading confidence level.
Level 3 : comprehensive indicator/strategy. They are simple trading systems based on my strategies. They are commonly containing several or all of entry signal, close signal, stop loss, take profit, re-entry, risk management, and position sizing techniques. Even some interesting fundamental and mass psychological aspects are incorporated.
Level 4 : script snippets or functions that do not disclose source code. Interesting element that can reveal market laws and work as raw material for indicators and strategies. If you find Level 1~2 scripts are helpful, Level 4 is a private version that took me far more efforts to develop.
Level 5 : indicator/strategy that do not disclose source code. private version of Level 3 script with my accumulated script processing skills or a large number of custom functions. I had a private function library built in past two years. Level 5 scripts use many of them to achieve private trading strategy.

Combo Backtest 123 Reversal & EMA & MA Crossover This is combo strategies for get a cumulative signal.
First strategy
This System was created from the Book "How I Tripled My Money In The
Futures Market" by Ulf Jensen, Page 183. This is reverse type of strategies.
The strategy buys at market, if close price is higher than the previous close
during 2 days and the meaning of 9-days Stochastic Slow Oscillator is lower than 50.
The strategy sells at market, if close price is lower than the previous close price
during 2 days and the meaning of 9-days Stochastic Fast Oscillator is higher than 50.
Second strategy
The Moving Average Crossover trading strategy is possibly the most popular
trading strategy in the world of trading. First of them were written in the
middle of XX century, when commodities trading strategies became popular.
This strategy is a good example of so-called traditional strategies.
Traditional strategies are always long or short. That means they are never
out of the market. The concept of having a strategy that is always long or
short may be scary, particularly in today’s market where you don’t know what
is going to happen as far as risk on any one market. But a lot of traders
believe that the concept is still valid, especially for those of traders who
do their own research or their own discretionary trading.
This version uses crossover of moving average and its exponential moving average.
WARNING:
- For purpose educate only
- This script to change bars colors.

Combo Strategy 123 Reversal & EMA & MA Crossover This is combo strategies for get a cumulative signal.
First strategy
This System was created from the Book "How I Tripled My Money In The
Futures Market" by Ulf Jensen, Page 183. This is reverse type of strategies.
The strategy buys at market, if close price is higher than the previous close
during 2 days and the meaning of 9-days Stochastic Slow Oscillator is lower than 50.
The strategy sells at market, if close price is lower than the previous close price
during 2 days and the meaning of 9-days Stochastic Fast Oscillator is higher than 50.
Second strategy
The Moving Average Crossover trading strategy is possibly the most popular
trading strategy in the world of trading. First of them were written in the
middle of XX century, when commodities trading strategies became popular.
This strategy is a good example of so-called traditional strategies.
Traditional strategies are always long or short. That means they are never
out of the market. The concept of having a strategy that is always long or
short may be scary, particularly in today’s market where you don’t know what
is going to happen as far as risk on any one market. But a lot of traders
believe that the concept is still valid, especially for those of traders who
do their own research or their own discretionary trading.
This version uses crossover of moving average and its exponential moving average.
WARNING:
- For purpose educate only
- This script to change bars colors.

Bollinger Bands BAT/USDT 30minThis is ready to use Bollinger Band strategy that was backtested on the data from the previous year 2019.
The main purpose of this strategy is to determine trades with the highest probability of success, to keep a consistent portfolio growth throughout the year. This strategy cherry-picks the most reliable points of entry on a particular timeframe (30m) for the particular asset (BAT/USDT). The backtest shows a great result of 78.95% profitability with the maximum drawdown of -4.02%. This is one of my strategies out of the group of automated strategies that helps to grow my portfolio steadily.
You are welcome to change inputs and backtest the following strategy. Any comments or ideas would be appreciated.
If you are happy with existing results and would like to automate the strategy, which can be done through alerts, then you need to convert it to study and add alerts in the code.
Let me know if you are interested in that and I will create a study based on this strategy.

Strategy VS Buy & HoldSUMMARY:
A strategy wrapper that makes a detailed and visual comparison between a given strategy and the buy & hold returns of the traded security.
DESCRIPTION:
TradingView has a "Buy & Hold Return" metric in the strategy tester that is often enough to assess how our strategy compares to a simple buy hold. However, one may want more information on how and when your strategy beats or is beaten by a simple buy & hold strategy. This script aims to show such detail by providing a more comprehensive metrics and charting the profit/loss of the given strategy against buy & hold.
As seen in the script, it plots/draws 4 elements:
1) Strategy P/L: strategy net profit + strategy open profit
2) Buy & Hold P/L: unrealized return
3) Difference: Strategy P/L - Buy & Hold P/L
4) Strategy vs Buy Hold Stats
> Percent of bars strategy P/L is above Buy & Hold
> Percent of bars strategy P/L is below Buy & Hold
> All Time Average Difference
ADJUSTABLE PARAMETERS:
All labels/panels can be disabled by unchecking these two options:
>bnh_info_panel = input(true, title='Enable Info Panel')
>bnh_indicator_panel = input(true, title='Enable Indicator Panel')
Comparison Date Range can be changed to better isolate specific areas:
>From Year, From Month, From Day
default: 1970 01 01
>To Year, To Month, To Day
default: 2050 12 31
Default settings basically covers all historical data.
HOW TO USE:
The default script contains a simple 50-200 SMA cross strategy, just delete and replace it. Those are everything between these lines:
/////////////////////////////////////////////////////////////////////////////////////
//////////////////////////////STRATEGY SCRIPT START//////////////////////////////////
(STRATEGY SCRIPT GOES HERE)
//////////////////////////////STRATEGY SCRIPT END////////////////////////////////////
/////////////////////////////////////////////////////////////////////////////////////
Removing all plots and drawings from your strategy is advisable.
If you are going to use the Comparison Date Range, apply "bnh_timeCond" to your strategy to align the dates. A sample on how it’s applied can be seen on the Placeholder MA cross strategy.
Note: bnh_timeCond returns a boolean series

TradersAI_UTBotCREDITS to @HPotter for the orginal code.
CREDITS to @Yo_adriiiiaan for recently publishing the UT Bot study based on the original code -
I just added some simple code to turn it into a strategy. Now, anyone can simply add the strategy to their chart to see the backtesting results!
While @Yo_adriiiiaan mentions it works best on a 4-hour timeframe or above, I am happy to share that this seems to be working on a 15-minute chart on e-mini S&P 500 Index (using the KeyValue setting at 10)! You can play around with the different settings, and may be you might discover even better settings.
Hope this helps. Btw, if any of you play with different settings and discover great settings for a specific instrument, please share them with the community here - it will be rewarded back multiple times!

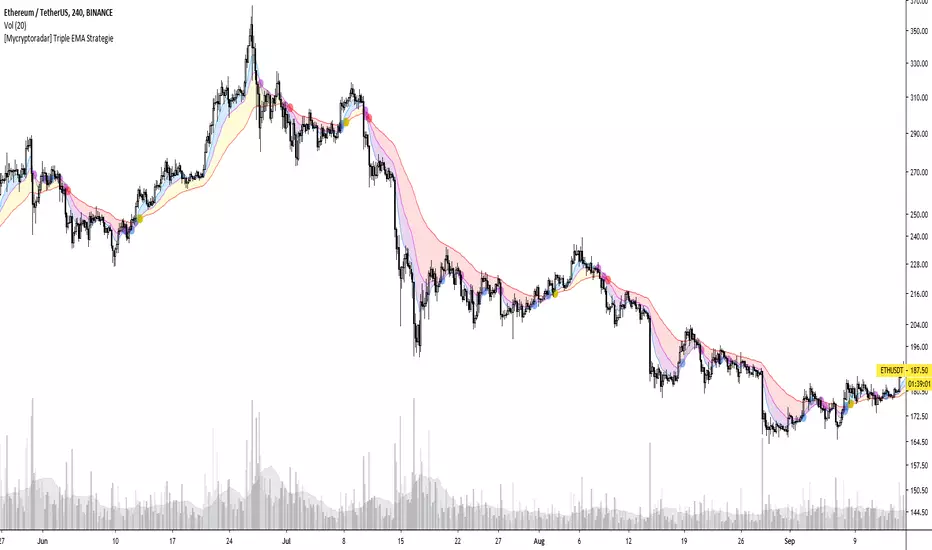
[Mycryptoradar] Triple EMA StrategieTriple EMA strategy consists of EMA 9, 21 & 55. A widely discussed trading strategy. If you want to know more about this strategy, enter the following search term at Google, "triple EMA 9, 21, 55 strategy".
How does this indicator work!
Background blue / yellow = bullish
Background red / purple = bearish
Every EMA crossover can be displayed on the chart (see circles)
Blue / blue / yellow circles = bullish
Purple / purple / red circles = bearish
Play with the settings and adjust them to your hand and don't forget to read about the EMA 9, 21, 55 strategy. Each background and crossover marking can be switched on and off separately.
This indicator visualizes the strategy and is not financial advice, you trade on your own findings. Has the indicator helped you with trading? Then leave a comment and like the indicator.
WANNA TIP ME? BUY ME SOME BEERS!
BTC: 3BMEXX5JrX94ziUSoQMLEmi51WcYwphAg3
ETH: 0x541e504bb461aa141de6ddce09dc89eb16f58f9c
LTC: LPBJXzUZJksCuCK27AY2qAVYGGGiUfejok
DON'T FORGET TO LOOK AT OUR SITE MYCRYPTORADAR
Combo Backtest 123 Reversal & Bill Williams Averages. 3Lines This is combo strategies for get
a cumulative signal. Result signal will return 1 if two strategies
is long, -1 if all strategies is short and 0 if signals of strategies is not equal.
First strategy
This System was created from the Book "How I Tripled My Money In The
Futures Market" by Ulf Jensen, Page 183. This is reverse type of strategies.
The strategy buys at market, if close price is higher than the previous close
during 2 days and the meaning of 9-days Stochastic Slow Oscillator is lower than 50.
The strategy sells at market, if close price is lower than the previous close price
during 2 days and the meaning of 9-days Stochastic Fast Oscillator is higher than 50.
Second strategy
This indicator calculates 3 Moving Averages for default values of
13, 8 and 5 days, with displacement 8, 5 and 3 days: Median Price (High+Low/2).
The most popular method of interpreting a moving average is to compare
the relationship between a moving average of the security's price with
the security's price itself (or between several moving averages).
WARNING:
- For purpose educate only
- This script to change bars colors.

Combo Strategy 123 Reversal & Bill Williams Averages. 3Lines This is combo strategies for get
a cumulative signal. Result signal will return 1 if two strategies
is long, -1 if all strategies is short and 0 if signals of strategies is not equal.
First strategy
This System was created from the Book "How I Tripled My Money In The
Futures Market" by Ulf Jensen, Page 183. This is reverse type of strategies.
The strategy buys at market, if close price is higher than the previous close
during 2 days and the meaning of 9-days Stochastic Slow Oscillator is lower than 50.
The strategy sells at market, if close price is lower than the previous close price
during 2 days and the meaning of 9-days Stochastic Fast Oscillator is higher than 50.
Second strategy
This indicator calculates 3 Moving Averages for default values of
13, 8 and 5 days, with displacement 8, 5 and 3 days: Median Price (High+Low/2).
The most popular method of interpreting a moving average is to compare
the relationship between a moving average of the security's price with
the security's price itself (or between several moving averages).
WARNING:
- For purpose educate only
- This script to change bars colors.
Combo Backtest 123 Reversal & Bear Power This is combo strategies for get
a cumulative signal. Result signal will return 1 if two strategies
is long, -1 if all strategies is short and 0 if signals of strategies is not equal.
First strategy
This System was created from the Book "How I Tripled My Money In The
Futures Market" by Ulf Jensen, Page 183. This is reverse type of strategies.
The strategy buys at market, if close price is higher than the previous close
during 2 days and the meaning of 9-days Stochastic Slow Oscillator is lower than 50.
The strategy sells at market, if close price is lower than the previous close price
during 2 days and the meaning of 9-days Stochastic Fast Oscillator is higher than 50.
Second strategy
Bear Power Indicator
To get more information please see "Bull And Bear Balance Indicator"
by Vadim Gimelfarb.
WARNING:
- For purpose educate only
- This script to change bars colors.

Combo Strategy 123 Reversal & Bear Power This is combo strategies for get
a cumulative signal. Result signal will return 1 if two strategies
is long, -1 if all strategies is short and 0 if signals of strategies is not equal.
First strategy
This System was created from the Book "How I Tripled My Money In The
Futures Market" by Ulf Jensen, Page 183. This is reverse type of strategies.
The strategy buys at market, if close price is higher than the previous close
during 2 days and the meaning of 9-days Stochastic Slow Oscillator is lower than 50.
The strategy sells at market, if close price is lower than the previous close price
during 2 days and the meaning of 9-days Stochastic Fast Oscillator is higher than 50.
Second strategy
Bear Power Indicator
To get more information please see "Bull And Bear Balance Indicator"
by Vadim Gimelfarb.
WARNING:
- For purpose educate only
- This script to change bars colors.

Combo Backtest 123 Reversal & (H-L)/C Histogram This is combo strategies for get
a cumulative signal. Result signal will return 1 if two strategies
is long, -1 if all strategies is short and 0 if signals of strategies is not equal.
First strategy
This System was created from the Book "How I Tripled My Money In The
Futures Market" by Ulf Jensen, Page 183. This is reverse type of strategies.
The strategy buys at market, if close price is higher than the previous close
during 2 days and the meaning of 9-days Stochastic Slow Oscillator is lower than 50.
The strategy sells at market, if close price is lower than the previous close price
during 2 days and the meaning of 9-days Stochastic Fast Oscillator is higher than 50.
Second strategy
This histogram displays (high-low)/close
Can be applied to any time frame.
WARNING:
- For purpose educate only
- This script to change bars colors.

Combo Strategy 123 Reversal & (H-L)/C Histogram This is combo strategies for get
a cumulative signal. Result signal will return 1 if two strategies
is long, -1 if all strategies is short and 0 if signals of strategies is not equal.
First strategy
This System was created from the Book "How I Tripled My Money In The
Futures Market" by Ulf Jensen, Page 183. This is reverse type of strategies.
The strategy buys at market, if close price is higher than the previous close
during 2 days and the meaning of 9-days Stochastic Slow Oscillator is lower than 50.
The strategy sells at market, if close price is lower than the previous close price
during 2 days and the meaning of 9-days Stochastic Fast Oscillator is higher than 50.
Second strategy
This histogram displays (high-low)/close
Can be applied to any time frame.
WARNING:
- For purpose educate only
- This script to change bars colors.

Combo Backtest 123 Reversal & Bandpass FilterThis is combo strategies for get
a cumulative signal. Result signal will return 1 if two strategies
is long, -1 if all strategies is short and 0 if signals of strategies is not equal.
First strategy
This System was created from the Book "How I Tripled My Money In The
Futures Market" by Ulf Jensen, Page 183. This is reverse type of strategies.
The strategy buys at market, if close price is higher than the previous close
during 2 days and the meaning of 9-days Stochastic Slow Oscillator is lower than 50.
The strategy sells at market, if close price is lower than the previous close price
during 2 days and the meaning of 9-days Stochastic Fast Oscillator is higher than 50.
Second strategy
The related article is copyrighted material from
Stocks & Commodities Mar 2010
You can use in the xPrice any series: Open, High, Low, Close, HL2, HLC3, OHLC4 and ect...
WARNING:
- For purpose educate only
- This script to change bars colors.

Combo Strategy 123 Reversal & Bandpass Filter This is combo strategies for get
a cumulative signal. Result signal will return 1 if two strategies
is long, -1 if all strategies is short and 0 if signals of strategies is not equal.
First strategy
This System was created from the Book "How I Tripled My Money In The
Futures Market" by Ulf Jensen, Page 183. This is reverse type of strategies.
The strategy buys at market, if close price is higher than the previous close
during 2 days and the meaning of 9-days Stochastic Slow Oscillator is lower than 50.
The strategy sells at market, if close price is lower than the previous close price
during 2 days and the meaning of 9-days Stochastic Fast Oscillator is higher than 50.
Second strategy
The related article is copyrighted material from
Stocks & Commodities Mar 2010
You can use in the xPrice any series: Open, High, Low, Close, HL2, HLC3, OHLC4 and ect...
WARNING:
- For purpose educate only
- This script to change bars colors.

Combo Backtest 123 Reversal & Average True Range Trailing Stops This is combo strategies for get
a cumulative signal. Result signal will return 1 if two strategies
is long, -1 if all strategies is short and 0 if signals of strategies is not equal.
First strategy
This System was created from the Book "How I Tripled My Money In The
Futures Market" by Ulf Jensen, Page 183. This is reverse type of strategies.
The strategy buys at market, if close price is higher than the previous close
during 2 days and the meaning of 9-days Stochastic Slow Oscillator is lower than 50.
The strategy sells at market, if close price is lower than the previous close price
during 2 days and the meaning of 9-days Stochastic Fast Oscillator is higher than 50.
Secon strategy
Average True Range Trailing Stops Strategy, by Sylvain Vervoort
The related article is copyrighted material from Stocks & Commodities Jun 2009
WARNING:
- For purpose educate only
- This script to change bars colors.

Combo Strategy 123 Reversal & Average True Range Trailing Stops This is combo strategies for get
a cumulative signal. Result signal will return 1 if two strategies
is long, -1 if all strategies is short and 0 if signals of strategies is not equal.
First strategy
This System was created from the Book "How I Tripled My Money In The
Futures Market" by Ulf Jensen, Page 183. This is reverse type of strategies.
The strategy buys at market, if close price is higher than the previous close
during 2 days and the meaning of 9-days Stochastic Slow Oscillator is lower than 50.
The strategy sells at market, if close price is lower than the previous close price
during 2 days and the meaning of 9-days Stochastic Fast Oscillator is higher than 50.
Secon strategy
Average True Range Trailing Stops Strategy, by Sylvain Vervoort
The related article is copyrighted material from Stocks & Commodities Jun 2009
WARNING:
- For purpose educate only
- This script to change bars colors.
Combo Backtest 123 Reversal and ADXR This is combo strategies for get
a cumulative signal. Result signal will return 1 if two strategies
is long, -1 if all strategies is short and 0 if signals of strategies is not equal.
First strategy
This System was created from the Book "How I Tripled My Money In The
Futures Market" by Ulf Jensen, Page 183. This is reverse type of strategies.
The strategy buys at market, if close price is higher than the previous close
during 2 days and the meaning of 9-days Stochastic Slow Oscillator is lower than 50.
The strategy sells at market, if close price is lower than the previous close price
during 2 days and the meaning of 9-days Stochastic Fast Oscillator is higher than 50.
Secon strategy
The Average Directional Movement Index Rating (ADXR) measures the strength
of the Average Directional Movement Index (ADX). It's calculated by taking
the average of the current ADX and the ADX from one time period before
(time periods can vary, but the most typical period used is 14 days).
Like the ADX, the ADXR ranges from values of 0 to 100 and reflects strengthening
and weakening trends. However, because it represents an average of ADX, values
don't fluctuate as dramatically and some analysts believe the indicator helps
better display trends in volatile markets.
WARNING:
- For purpose educate only
- This script to change bars colors.

Combo Strategy 123 Reversal and ADXR This is combo strategies for get
a cumulative signal. Result signal will return 1 if two strategies
is long, -1 if all strategies is short and 0 if signals of strategies is not equal.
First strategy
This System was created from the Book "How I Tripled My Money In The
Futures Market" by Ulf Jensen, Page 183. This is reverse type of strategies.
The strategy buys at market, if close price is higher than the previous close
during 2 days and the meaning of 9-days Stochastic Slow Oscillator is lower than 50.
The strategy sells at market, if close price is lower than the previous close price
during 2 days and the meaning of 9-days Stochastic Fast Oscillator is higher than 50.
Secon strategy
The Average Directional Movement Index Rating (ADXR) measures the strength
of the Average Directional Movement Index (ADX). It's calculated by taking
the average of the current ADX and the ADX from one time period before
(time periods can vary, but the most typical period used is 14 days).
Like the ADX, the ADXR ranges from values of 0 to 100 and reflects strengthening
and weakening trends. However, because it represents an average of ADX, values
don't fluctuate as dramatically and some analysts believe the indicator helps
better display trends in volatile markets.
WARNING:
- For purpose educate only
- This script to change bars colors.
Combo Backtest 123 Reversal and Accelerator Oscillator (AC) This is combo strategies for get
a cumulative signal. Result signal will return 1 if two strategies
is long, -1 if all strategies is short and 0 if signals of strategies is not equal.
First strategy
This System was created from the Book "How I Tripled My Money In The
Futures Market" by Ulf Jensen, Page 183. This is reverse type of strategies.
The strategy buys at market, if close price is higher than the previous close
during 2 days and the meaning of 9-days Stochastic Slow Oscillator is lower than 50.
The strategy sells at market, if close price is lower than the previous close price
during 2 days and the meaning of 9-days Stochastic Fast Oscillator is higher than 50.
Second strategy
The Accelerator Oscillator has been developed by Bill Williams
as the development of the Awesome Oscillator. It represents the
difference between the Awesome Oscillator and the 5-period moving
average, and as such it shows the speed of change of the Awesome
Oscillator, which can be useful to find trend reversals before the
Awesome Oscillator does.
WARNING:
- For purpose educate only
- This script to change bars colors.
