ATR PivotsThe "ATR Pivots" script is a technical analysis tool designed to help traders identify key levels of support and resistance on a chart. The indicator uses various metrics such as the Average True Range (ATR), Daily True Range ( DTR ), Daily True Range Percentage (DTR%), Average Daily Range (ADR), Previous Day High ( PDH ), and Previous Day Low ( PDL ) to provide a comprehensive picture of the volatility and movement of a security. The script also includes an EMA cloud and 200 EMA for trend identification and a 1-minute ATR scalping strategy for traders to make informed trading decisions.
ATR Detail:-
The ATR is a measure of the volatility of a security over a given period of time. It is calculated by taking the average of the true range (the difference between the high and low of a security) over a set number of periods. The user can input the number of periods (ATR length) to be used for the ATR calculation. The script also allows the user to choose whether to use the current close or not for the calculation. The script calculates various levels of support and resistance based on the relationship between the security's range ( high-low ) and the ATR. The levels are calculated by multiplying the ATR by different Fibonacci ratios (0.236, 0.382, 0.5, 0.618, 0.786, 1.000) and then adding or subtracting the result from the previous close. The script plots these levels on the chart, with the -100 level being the most significant level. The user also has an option to choose whether to plot all Fibonacci levels or not.
DTR and DTR% Detail:-
The Daily True Range Percentage (DTR%) is a metric that measures the daily volatility of a security as a percentage of its previous close. It is calculated by dividing the Daily True Range ( DTR ) by the previous close. DTR is the range between the current period's high and low and gives a measure of the volatility of the security on a daily basis. DTR% can be used as an indicator of the percentage of movement of the security on a daily basis. In this script, DTR% is used in combination with other metrics such as the Average True Range (ATR) and Fibonacci ratios to calculate key levels of support and resistance for the security. The idea behind using DTR% is that it can help traders to better understand the daily volatility of the security and make more informed trading decisions.
For example, if a security has a DTR% of 2%, it suggests that the security has a relatively low level of volatility and is less likely to experience significant price movements on a daily basis. On the other hand, if a security has a DTR% of 10%, it suggests that the security has a relatively high level of volatility and is more likely to experience significant price movements on a daily basis.
ADR:-
The script then calculates the ADR (Average Daily Range) which is the average of the daily range of the security, using the formula (Period High - Period Low) / ATR Length. This gives a measure of the average volatility of the security on a daily basis, which can be useful for determining potential levels of support and resistance .
PDH /PDL:-
The script also calculates PDH (Previous Day High) and PDL (Previous Day Low) which are the High and low of the previous day of the security. This gives a measure of the previous day's volatility and movement, which can be useful for determining potential levels of support and resistance .
EMA Cloud and 200 EMA Detail:-
The EMA cloud is a technical analysis tool that helps traders identify the trend of the market by comparing two different exponential moving averages (EMAs) of different lengths. The cloud is created by plotting the fast EMA and the slow EMA on the chart and filling the space between them. The user can input the length of the fast and slow EMA , and the script will calculate and plot these EMAs on the chart. The space between the two EMAs is then filled with a color that represents the trend, with green indicating a bullish trend and red indicating a bearish trend . Additionally, the script also plots a 200 EMA , which is a commonly used long-term trend indicator. When the fast EMA is above the slow EMA and the 200 EMA , it is considered a bullish signal, indicating an uptrend. When the fast EMA is below the slow EMA and the 200 EMA , it is considered a bearish signal, indicating a downtrend. The EMA cloud and 200 EMA can be used together to help traders identify the overall trend of the market and make more informed trading decisions.
1 Minute ATR Scalping Strategy:-
The script also includes a 1-minute ATR scalping strategy that can be used by traders looking for quick profits in the market. The strategy involves using the ATR levels calculated by the script as well as the EMA cloud and 200 EMA to identify potential buy and sell opportunities. For example, if the 1-minute ATR is above 11 in NIFTY and the EMA cloud is bullish , the strategy suggests buying the security. Similarly, if the 1-minute ATR is above 30 in BANKNIFTY and the EMA cloud is bullish , the strategy suggests buying the security.
Inside Candle:-
The Inside Candle is a price action pattern that occurs when the current candle's high and low are entirely within the range of the previous candle's high and low. This pattern indicates indecision or consolidation in the market and can be a potential sign of a trend reversal. When used in the 15-minute chart, traders can look for Inside Candle patterns that occur at key levels of support or resistance. If the Inside Candle pattern occurs at a key level and the price subsequently breaks out of the range of the Inside Candle, it can be a signal to enter a trade in the direction of the breakout. Traders can also use the Inside Candle pattern to trade in a tight range, or to reduce their exposure to a current trend.
Risk Management:-
As with any trading strategy, it is important to practice proper risk management when using the ATR Pivots script and the 1-minute ATR scalping strategy. This may include setting stop-loss orders, using appropriate position sizing, and diversifying your portfolio. It is also important to note that past performance is not indicative of future results and that the script and strategy provided are for educational purposes only.
In conclusion, the "ATR Pivots" script is a powerful tool that can help traders identify key levels of support and resistance , as well as trend direction. The additional metrics such as DTR , DTR%, ADR, PDH , and PDL provide a more comprehensive picture of the volatility and movement of the security, making it easier for traders to make better trading decisions. The inclusion of the EMA cloud and 200 EMA for trend identification, and the 1-minute ATR scalping strategy for quick profits can further enhance a trader's decision-making process. However, it is important to practice proper risk management and understand that past performance is not indicative of future results.
Special thanks to satymahajan for the idea of clubbing Average True Range with Fibonacci levels.
Cari skrip untuk "the strat"

GKD-C Double Smoothed Stochastic of Momentum [Loxx]Giga Kaleidoscope Double Smoothed Stochastic of Momentum Confirmation is a Confirmation module included in Loxx's "Giga Kaleidoscope Modularized Trading System".
What is Loxx's "Giga Kaleidoscope Modularized Trading System"?
The Giga Kaleidoscope Modularized Trading System is a trading system built on the philosophy of the NNFX (No Nonsense Forex) algorithmic trading.
What is an NNFX algorithmic trading strategy?
The NNFX algorithm is built on the principles of trend, momentum, and volatility. There are six core components in the NNFX trading algorithm:
1. Volatility - price volatility; e.g., Average True Range, True Range Double, Close-to-Close, etc.
2. Baseline - a moving average to identify price trend (such as "Baseline" shown on the chart above)
3. Confirmation 1 - a technical indicator used to identify trends. This should agree with the "Baseline"
4. Confirmation 2 - a technical indicator used to identify trends. This filters/verifies the trend identified by "Baseline" and "Confirmation 1"
5. Volatility/Volume - a technical indicator used to identify volatility/volume breakouts/breakdown.
6. Exit - a technical indicator used to determine when a trend is exhausted.
How does Loxx's GKD (Giga Kaleidoscope Modularized Trading System) implement the NNFX algorithm outlined above?
Loxx's GKD v1.0 system has five types of modules (indicators/strategies). These modules are:
1. GKD-BT - Backtesting module (Volatility, Number 1 in the NNFX algorithm)
2. GKD-B - Baseline module (Baseline and Volatility/Volume, Numbers 1 and 2 in the NNFX algorithm)
3. GKD-C - Confirmation 1/2 module (Confirmation 1/2, Numbers 3 and 4 in the NNFX algorithm)
4. GKD-V - Volatility/Volume module (Confirmation 1/2, Number 5 in the NNFX algorithm)
5. GKD-E - Exit module (Exit, Number 6 in the NNFX algorithm)
(additional module types will added in future releases)
Each module interacts with every module by passing data between modules. Data is passed between each module as described below:
GKD-B => GKD-V => GKD-C(1) => GKD-C(2) => GKD-E => GKD-BT
That is, the Baseline indicator passes its data to Volatility/Volume. The Volatility/Volume indicator passes its values to the Confirmation 1 indicator. The Confirmation 1 indicator passes its values to the Confirmation 2 indicator. The Confirmation 2 indicator passes its values to the Exit indicator, and finally, the Exit indicator passes its values to the Backtest strategy.
This chaining of indicators requires that each module conform to Loxx's GKD protocol, therefore allowing for the testing of every possible combination of technical indicators that make up the six components of the NNFX algorithm.
What does the application of the GKD trading system look like?
Example trading system:
Backtest: Strategy with 1-3 take profits, trailing stop loss, multiple types of PnL volatility, and 2 backtesting styles
Baseline: Leader Exponential Moving Average as shown on chart
Volatility/Volume: Volatility Ratio as shown on chart
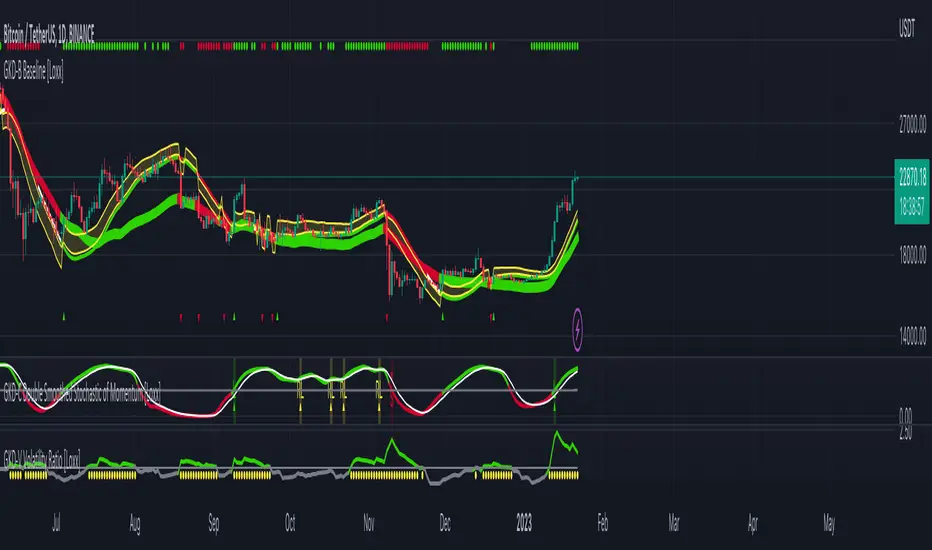
Confirmation 1: Double Smoothed Stochastic of Momentum as shown on the chart above
Confirmation 2: Jurik Turning Point Oscillator
Exit: Rex Oscillator
Each GKD indicator is denoted with a module identifier of either: GKD-BT, GKD-B, GKD-C, GKD-V, or GKD-E. This allows traders to understand to which module each indicator belongs and where each indicator fits into the GKD protocol chain.
Now that you have a general understanding of the NNFX algorithm and the GKD trading system. Let's go over what's inside the GKD-E Double Smoothed Stochastic of Momentum itself.
What is Double Smoothed Stochastic of Momentum?
The Double Smoothed Stochastic of Momentum demonstrates smoother indicators and therefore gives fewer false signals in comparison with the traditional oscillator.
The indicator is written in accordance with the description given in the book by Joe Dinapoli "Trading With DiNapoli Levels". This oscillator smoothing method leads to a filtering of the most "noise" component of the price movement.
The Double Smoothed Stochastic of Momentum indicator can be used in the strategies oriented to a standard stochastic. However, the stronger smoothing can lead to the loss of an array of signals. It is recommended to apply any trend indicator for more efficient use of the indicator and its signals filtering.
Signals
A GKD-C Confirmation indicator can be used as either a Confirmation 1, Confirmation 2, or Solo Confirmation indicator. See step 3 & 4 of the NNFX algorithm above to understand how this indicator fits into the GKD trading system. The Solo Confirmation setting allows you to test this indicator by itself without an additional GKD-C indicator present in the GKD protocol chain.
On the chart shown above, this indicator is shown as GKD-C Double Smoothed Stochastic of Momentum and is set to Solo Confirmation. The GKD-B Baseline, GKD-V Volatility Ratio, and this indicator satisfy the first three steps in the GKD trading system chain: GKD-B => GKD-V => GKD-C(solo).
The signals from each of these settings are as follows:
Confirmation 1 Signal
Initial Long (L): Double Smoothed Stochastic of Momentum crosses-up over middle-line*
Initial Short (S): Double Smoothed Stochastic of Momentum crosses-down under middle-line*
Continuation Long (CL): Double Smoothed Stochastic of Momentum is over middle-line, then crosses-up over the signal**
Continuation Short (CS): Double Smoothed Stochastic of Momentum is under middle-line, then crosses-down under the signal**
Post Baseline Cross Long (BL): Double Smoothed Stochastic of Momentum crossed-up over middle-line but Baseline is still in downtrend, then Baseline turns to uptrend within XX bars***
Post Baseline Cross Short (BS): Double Smoothed Stochastic of Momentum crossed-down under middle-line but Baseline is still in uptrend, then Baseline turns to downtrend within XX bars***
BL Recovery Continuation Long (RL): Double Smoothed Stochastic of Momentum is above middle-line. Baseline already crossed down into downtrend, then baseline crosses back up to uptrend; then, Double Smoothed Stochastic of Momentum crosses-up over the signal****
BL Recovery Continuation Short (RS): Double Smoothed Stochastic of Momentum is below middle-line. Baseline already crossed up into uptrend, then baseline crosses back down to downtrend; then, Double Smoothed Stochastic of Momentum crosses-down under the signal****
*All signals are shown regardless of Baseline and Volatility/Volume qualification
**All signals are shown regardless of Baseline qualification; however, when Baseline filter is active, only true continuations are shown. When the Baseline filter is not active, then all continuations are shown. True continuations are when the Baseline is active and maintains its uptrend/downtrend after the initial cross-up/cross-down over the middle-line respectively. This means that if the Baseline trend then moves against the Double Smoothed Stochastic of Momentum then any continuation signals are voided until another initial Long/Short. All continuations are will either show as regular continuations or be converted into recovery continuations
***All signals are shown regardless of Volatility/Volume qualification
****When the Baseline filter is active, some regular continuations are converted to recovery continuations and are shown. When the Baseline filter is not active, then these signals are not shown.
Confirmation 2 Signal
Initial Long (L): Double Smoothed Stochastic of Momentum crosses-up over middle-line*
Initial Short (S): Double Smoothed Stochastic of Momentum crosses-down under middle-line*
Continuation Long (CL): Double Smoothed Stochastic of Momentum is over middle-line, then crosses-up over the signal**
Continuation Short (CS): Double Smoothed Stochastic of Momentum is under middle-line, then crosses-down under the signal**
Post Baseline Cross Long (BL): Double Smoothed Stochastic of Momentum crossed-up over middle-line but Baseline is still in downtrend, then Baseline turns to uptrend within XX bars***
Post Baseline Cross Short (BS): Double Smoothed Stochastic of Momentum crossed-down under middle-line but Baseline is still in uptrend, then Baseline turns to downtrend within XX bars***
BL Recovery Continuation Long (RL): Double Smoothed Stochastic of Momentum is above middle-line. Baseline already crossed down into downtrend, then baseline crosses back up to uptrend while Double Smoothed Stochastic of Momentum is still above middle-line; then, Double Smoothed Stochastic of Momentum crosses-up over the signal****
BL Recovery Continuation Short (RS): Double Smoothed Stochastic of Momentum is below middle-line. Baseline already crossed up into uptrend, then baseline crosses back down to downtrend while Double Smoothed Stochastic of Momentum is still below middle-line; then, Double Smoothed Stochastic of Momentum crosses-down under the signal****
*All signals are shown regardless of Baseline and Volatility/Volume qualification
**All signals are shown regardless of Baseline qualification; however, when Baseline filter is active, only true continuations are shown. When the Baseline filter is not active, then all continuations are shown. True continuations are when the Baseline is active and maintains its uptrend/downtrend after the initial cross-up/cross-down over the middle-line respectively. This means that if the Baseline trend then moves against the Double Smoothed Stochastic of Momentum then any continuation signals are voided until another initial Long/Short. All continuations are will either show as regular continuations or be converted into recovery continuations
***All signals are shown regardless of Volatility/Volume qualification
****When the Baseline filter is active, some regular continuations are converted to recovery continuations and are shown. When the Baseline filter is not active, then these signals are not shown.
Confirmation 2 Confluence Background Color Signals; Confirmation Order: Regular; Confirmation Type: Confirmation 1
Initial Long (L): The imported GKD-C Confirmation 1 indicator crosses-up over middle-line, then Double Smoothed Stochastic of Momentum crosses-up over the middle-line on the same bar or "Number of Bars Confirmation" bars in the future (see X-bar rule below)
Initial Short (S): The imported GKD-C Confirmation 1 indicator crosses-down under middle-line, then Double Smoothed Stochastic of Momentum crosses-down under the middle-line on the same bar or "Number of Bars Confirmation" bars in the future (see X-bar rule below)
Continuation Long Confirmation 1 (CL): The imported GKD-C Confirmation 1 indicator is over middle-line, then crosses-up over the signal
Continuation Short Confirmation 1 (CS): The imported GKD-C Confirmation 1 indicator is under middle-line, then crosses-down under the signal
Post Baseline Cross Long (BL): The imported GKD-C Confirmation 1 crossed-up over middle-line but Baseline is still in downtrend; and Double Smoothed Stochastic of Momentum crossed-up over middle-line on the same bar or XX bars in the future but Baseline is still in downtrend; then Baseline turns to uptrend within "Maximum Allowable PSBC Bars Back" bars (see X-bar rule below)
Post Baseline Cross Short (BS): The imported GKD-C Confirmation 1 crossed-down under middle-line but Baseline is still in uptrend; and, Double Smoothed Stochastic of Momentum crossed-down under middle-line on the same bar or XX bars in the future but Baseline is still in uptrend; then Baseline turns to downtrend within "Maximum Allowable PSBC Bars Back" bars (see X-bar rule below)
BL Recovery Continuation Long (RL): The imported GKD-C Confirmation 1 indicator is above middle-line. Baseline already crossed down into downtrend, then baseline crosses back up to uptrend while Double Smoothed Stochastic of Momentum is still above middle-line; then, The imported GKD-C Confirmation 1 crosses-up over the signal
BL Recovery Continuation Short (RS): The imported GKD-C Confirmation 1 indicator is below middle-line. Baseline already crossed up into uptrend, then baseline crosses back down to downtrend while Double Smoothed Stochastic of Momentum is still below middle-line; then, The imported GKD-C Confirmation 1 crosses-down under the signal
Confirmation 2 Confluence Background Color Signals; Confirmation Order: Regular; Confirmation Type: Confirmation 2
Initial Long (L): same as Confirmation 2 Confluence Background Color Signals; Confirmation Order: Regular; Confirmation Type: Confirmation 1
Initial Short (S): same as Confirmation 2 Confluence Background Color Signals; Confirmation Order: Regular; Confirmation Type: Confirmation 1
Continuation Long Confirmation 2 (CL): Double Smoothed Stochastic of Momentum is over middle-line, then crosses-up over the signal
Continuation Short Confirmation 2 (CS): Double Smoothed Stochastic of Momentum is under middle-line, then crosses-down under the signal
Post Baseline Cross Long (BL): same as Confirmation 2 Confluence Background Color Signals; Confirmation Order: Regular; Confirmation Type: Confirmation 1
Post Baseline Cross Short (BS): same as Confirmation 2 Confluence Background Color Signals; Confirmation Order: Regular; Confirmation Type: Confirmation 1
BL Recovery Continuation Long (RL): Double Smoothed Stochastic of Momentum is above middle-line. Baseline already crossed down into downtrend, then baseline crosses back up to uptrend; then, Double Smoothed Stochastic of Momentum crosses-up over the signal
BL Recovery Continuation Short (RS): Double Smoothed Stochastic of Momentum is below middle-line. Baseline already crossed up into uptrend, then baseline crosses back down to downtrend; then, Double Smoothed Stochastic of Momentum crosses-down under the signal
Confirmation 2 Confluence Background Color Signals; Confirmation Order: Regular; Confirmation Type: Both
Initial Long (L): same as Confirmation 2 Confluence Background Color Signals; Confirmation Order: Regular; Confirmation Type: Confirmation 1
Initial Short (S): same as Confirmation 2 Confluence Background Color Signals; Confirmation Order: Regular; Confirmation Type: Confirmation 1
Continuation Long Confirmation 2 (CL): The imported GKD-C Confirmation 1 indicator is over middle-line, then crosses-up over the signal; Double Smoothed Stochastic of Momentum is over middle-line, then crosses-up over the signal within "Number of Bars Confirmation" bars in the future
Continuation Short Confirmation 2 (CS): The imported GKD-C Confirmation 1 indicator is under middle-line, then crosses-down under the signal; Double Smoothed Stochastic of Momentum is under middle-line, then crosses-down under the signal within "Number of Bars Confirmation" bars in the future
Post Baseline Cross Long (BL): same as Confirmation 2 Confluence Background Color Signals; Confirmation Order: Regular; Confirmation Type: Confirmation 1
Post Baseline Cross Short (BS): same as Confirmation 2 Confluence Background Color Signals; Confirmation Order: Regular; Confirmation Type: Confirmation 1
BL Recovery Continuation Long (RL): The imported GKD-C Confirmation 1 indicator is above middle-line and Double Smoothed Stochastic of Momentum is above middle-line. Baseline already crossed down into downtrend, then baseline crosses back up to uptrend; then, the imported GKD-C Confirmation 1 crosses-up over its signal, and Double Smoothed Stochastic of Momentum crosses-up over its signal within "Number of Bars Confirmation" bars in the future
BL Recovery Continuation Short (RS): The imported GKD-C Confirmation 1 indicator is below middle-line and Double Smoothed Stochastic of Momentum is below middle-line. Baseline already crossed up into uptrend, then baseline crosses back down to downtrend; then, the imported GKD-C Confirmation 1 crosses-down under its signal, and Double Smoothed Stochastic of Momentum crosses-down under its signal within "Number of Bars Confirmation" bars in the future
Confirmation 2 Confluence Background Color Signals; Confirmation Order: Both; Confirmation Type: (continuations don't change from the variations above)
Initial Long (L): The imported GKD-C Confirmation 1 indicator crosses-up over middle-line, then Double Smoothed Stochastic of Momentum crosses-up over the middle-line on the same bar or "Number of Bars Confirmation" bars in the future (see X-bar rule below); OR, Double Smoothed Stochastic of Momentum crosses-up over middle-line, then the imported GKD-C Confirmation 1 indicator crosses-up over the middle-line on the same bar or "Number of Bars Confirmation" bars in the future (see X-bar rule below)
Initial Short (S): The imported GKD-C Confirmation 1 indicator crosses-down under middle-line, then Double Smoothed Stochastic of Momentum crosses-down under the middle-line on the same bar or "Number of Bars Confirmation" bars in the future (see X-bar rule below); OR, Double Smoothed Stochastic of Momentum crosses-down under middle-line, then the imported GKD-C Confirmation 1 indicator crosses-down under the middle-line on the same bar or "Number of Bars Confirmation" bars in the future (see X-bar rule below)
Post Baseline Cross Long (BL): The imported GKD-C Confirmation 1 crossed-down under middle-line but Baseline is still in uptrend; and, Double Smoothed Stochastic of Momentum crossed-down under middle-line on the same bar or XX bars in the future but Baseline is still in uptrend; then Baseline turns to downtrend within "Maximum Allowable PSBC Bars Back" bars (see X-bar rule below); OR, Double Smoothed Stochastic of Momentum crossed-down under middle-line but Baseline is still in uptrend; and, the imported GKD-C Confirmation 1 crossed-down under middle-line on the same bar or XX bars in the future but Baseline is still in uptrend; then Baseline turns to downtrend within "Maximum Allowable PSBC Bars Back" bars (see X-bar rule below)
Post Baseline Cross Short (BS): The imported GKD-C Confirmation 1 crossed-down under middle-line but Baseline is still in uptrend; and, Double Smoothed Stochastic of Momentum crossed-down under middle-line on the same bar or XX bars in the future but Baseline is still in uptrend; then Baseline turns to downtrend within "Maximum Allowable PSBC Bars Back" bars (see X-bar rule below); OR, Double Smoothed Stochastic of Momentum crossed-down under middle-line but Baseline is still in uptrend; and, the imported GKD-C Confirmation 1 crossed-down under middle-line on the same bar or XX bars in the future but Baseline is still in uptrend; then Baseline turns to downtrend within "Maximum Allowable PSBC Bars Back" bars (see X-bar rule below)
Solo Confirmation Signals
Initial Long (L): Double Smoothed Stochastic of Momentum crosses-up over middle-line
Initial Short (S): Double Smoothed Stochastic of Momentum crosses-down under middle-line
Continuation Long (CL): Double Smoothed Stochastic of Momentum is over middle-line, then crosses-up over the signal
Continuation Short (CS): Double Smoothed Stochastic of Momentum is under middle-line, then crosses-down under the signal
Post Baseline Cross Long (BL): Double Smoothed Stochastic of Momentum crossed-up over middle-line but Baseline is still in downtrend, then Baseline turns to uptrend within XX bars
Post Baseline Cross Short (BS): Double Smoothed Stochastic of Momentum crossed-down under middle-line but Baseline is still in uptrend, then Baseline turns to downtrend within XX bars
BL Recovery Continuation Long (RL): Double Smoothed Stochastic of Momentum above middle-line. Baseline already crossed down into downtrend, then baseline crosses back up to uptrend while Double Smoothed Stochastic of Momentum is still above middle-line
BL Recovery Continuation Short (RS): Double Smoothed Stochastic of Momentum below middle-line. Baseline already crossed up into uptrend, then baseline crosses back down to downtrend while Double Smoothed Stochastic of Momentum is still below middle-line
X-bar Rule settings
This rule only applies when this indicator "Confirmation Type" set to "Confirmation 2"
Requirements
Inputs: Confirmation 1 and Solo Confirmation: GKD-V Volatility/Volume indicator; Confirmation 2: GKD-C Confirmation indicator
Output: Confirmation 2 and Solo Confirmation: GKD-E Exit indicator; Confirmation 1: GKD-C Confirmation indicator
Additional features will be added in future releases.
This indicator is only available to ALGX Trading VIP group members . You can see the Author's Instructions below to get more information on how to get access.
GKD-C Double Smoothed Stochastic [Loxx]Giga Kaleidoscope Double Smoothed Stochastic Confirmation is a Confirmation module included in Loxx's "Giga Kaleidoscope Modularized Trading System".
What is Loxx's "Giga Kaleidoscope Modularized Trading System"?
The Giga Kaleidoscope Modularized Trading System is a trading system built on the philosophy of the NNFX (No Nonsense Forex) algorithmic trading.
What is an NNFX algorithmic trading strategy?
The NNFX algorithm is built on the principles of trend, momentum, and volatility. There are six core components in the NNFX trading algorithm:
1. Volatility - price volatility; e.g., Average True Range, True Range Double, Close-to-Close, etc.
2. Baseline - a moving average to identify price trend (such as "Baseline" shown on the chart above)
3. Confirmation 1 - a technical indicator used to identify trends. This should agree with the "Baseline"
4. Confirmation 2 - a technical indicator used to identify trends. This filters/verifies the trend identified by "Baseline" and "Confirmation 1"
5. Volatility/Volume - a technical indicator used to identify volatility/volume breakouts/breakdown.
6. Exit - a technical indicator used to determine when a trend is exhausted.
How does Loxx's GKD (Giga Kaleidoscope Modularized Trading System) implement the NNFX algorithm outlined above?
Loxx's GKD v1.0 system has five types of modules (indicators/strategies). These modules are:
1. GKD-BT - Backtesting module (Volatility, Number 1 in the NNFX algorithm)
2. GKD-B - Baseline module (Baseline and Volatility/Volume, Numbers 1 and 2 in the NNFX algorithm)
3. GKD-C - Confirmation 1/2 module (Confirmation 1/2, Numbers 3 and 4 in the NNFX algorithm)
4. GKD-V - Volatility/Volume module (Confirmation 1/2, Number 5 in the NNFX algorithm)
5. GKD-E - Exit module (Exit, Number 6 in the NNFX algorithm)
(additional module types will added in future releases)
Each module interacts with every module by passing data between modules. Data is passed between each module as described below:
GKD-B => GKD-V => GKD-C(1) => GKD-C(2) => GKD-E => GKD-BT
That is, the Baseline indicator passes its data to Volatility/Volume. The Volatility/Volume indicator passes its values to the Confirmation 1 indicator. The Confirmation 1 indicator passes its values to the Confirmation 2 indicator. The Confirmation 2 indicator passes its values to the Exit indicator, and finally, the Exit indicator passes its values to the Backtest strategy.
This chaining of indicators requires that each module conform to Loxx's GKD protocol, therefore allowing for the testing of every possible combination of technical indicators that make up the six components of the NNFX algorithm.
What does the application of the GKD trading system look like?
Example trading system:
Backtest: Strategy with 1-3 take profits, trailing stop loss, multiple types of PnL volatility, and 2 backtesting styles
Baseline: Leader Exponential Moving Average as shown on chart
Volatility/Volume: Volatility Ratio as shown on chart
Confirmation 1: Double Smoothed Stochastic as shown on the chart above
Confirmation 2: Jurik Turning Point Oscillator
Exit: Rex Oscillator
Each GKD indicator is denoted with a module identifier of either: GKD-BT, GKD-B, GKD-C, GKD-V, or GKD-E. This allows traders to understand to which module each indicator belongs and where each indicator fits into the GKD protocol chain.
Now that you have a general understanding of the NNFX algorithm and the GKD trading system. Let's go over what's inside the GKD-E Double Smoothed Stochastic itself.
What is Double Smoothed Stochastic?
The Double Smoothed Stochastic demonstrates smoother indicators and therefore gives fewer false signals in comparison with the traditional oscillator.
The indicator is written in accordance with the description given in the book by Joe Dinapoli "Trading With DiNapoli Levels". This oscillator smoothing method leads to a filtering of the most "noise" component of the price movement.
The Double Smoothed Stochastic indicator can be used in the strategies oriented to a standard stochastic. However, the stronger smoothing can lead to the loss of an array of signals. It is recommended to apply any trend indicator for more efficient use of the indicator and its signals filtering.
Signals
A GKD-C Confirmation indicator can be used as either a Confirmation 1, Confirmation 2, or Solo Confirmation indicator. See step 3 & 4 of the NNFX algorithm above to understand how this indicator fits into the GKD trading system. The Solo Confirmation setting allows you to test this indicator by itself without an additional GKD-C indicator present in the GKD protocol chain.
On the chart shown above, this indicator is shown as GKD-C Double Smoothed Stochastic and is set to Solo Confirmation. The GKD-B Baseline, GKD-V Volatility Ratio, and this indicator satisfy the first three steps in the GKD trading system chain: GKD-B => GKD-V => GKD-C(solo).
The signals from each of these settings are as follows:
Confirmation 1 Signal
Initial Long (L): Double Smoothed Stochastic crosses-up over middle-line*
Initial Short (S): Double Smoothed Stochastic crosses-down under middle-line*
Continuation Long (CL): Double Smoothed Stochastic is over middle-line, then crosses-up over the signal**
Continuation Short (CS): Double Smoothed Stochastic is under middle-line, then crosses-down under the signal**
Post Baseline Cross Long (BL): Double Smoothed Stochastic crossed-up over middle-line but Baseline is still in downtrend, then Baseline turns to uptrend within XX bars***
Post Baseline Cross Short (BS): Double Smoothed Stochastic crossed-down under middle-line but Baseline is still in uptrend, then Baseline turns to downtrend within XX bars***
BL Recovery Continuation Long (RL): Double Smoothed Stochastic is above middle-line. Baseline already crossed down into downtrend, then baseline crosses back up to uptrend; then, Double Smoothed Stochastic crosses-up over the signal****
BL Recovery Continuation Short (RS): Double Smoothed Stochastic is below middle-line. Baseline already crossed up into uptrend, then baseline crosses back down to downtrend; then, Double Smoothed Stochastic crosses-down under the signal****
*All signals are shown regardless of Baseline and Volatility/Volume qualification
**All signals are shown regardless of Baseline qualification; however, when Baseline filter is active, only true continuations are shown. When the Baseline filter is not active, then all continuations are shown. True continuations are when the Baseline is active and maintains its uptrend/downtrend after the initial cross-up/cross-down over the middle-line respectively. This means that if the Baseline trend then moves against the Double Smoothed Stochastic then any continuation signals are voided until another initial Long/Short. All continuations are will either show as regular continuations or be converted into recovery continuations
***All signals are shown regardless of Volatility/Volume qualification
****When the Baseline filter is active, some regular continuations are converted to recovery continuations and are shown. When the Baseline filter is not active, then these signals are not shown.
Confirmation 2 Signal
Initial Long (L): Double Smoothed Stochastic crosses-up over middle-line*
Initial Short (S): Double Smoothed Stochastic crosses-down under middle-line*
Continuation Long (CL): Double Smoothed Stochastic is over middle-line, then crosses-up over the signal**
Continuation Short (CS): Double Smoothed Stochastic is under middle-line, then crosses-down under the signal**
Post Baseline Cross Long (BL): Double Smoothed Stochastic crossed-up over middle-line but Baseline is still in downtrend, then Baseline turns to uptrend within XX bars***
Post Baseline Cross Short (BS): Double Smoothed Stochastic crossed-down under middle-line but Baseline is still in uptrend, then Baseline turns to downtrend within XX bars***
BL Recovery Continuation Long (RL): Double Smoothed Stochastic is above middle-line. Baseline already crossed down into downtrend, then baseline crosses back up to uptrend while Double Smoothed Stochastic is still above middle-line; then, Double Smoothed Stochastic crosses-up over the signal****
BL Recovery Continuation Short (RS): Double Smoothed Stochastic is below middle-line. Baseline already crossed up into uptrend, then baseline crosses back down to downtrend while Double Smoothed Stochastic is still below middle-line; then, Double Smoothed Stochastic crosses-down under the signal****
*All signals are shown regardless of Baseline and Volatility/Volume qualification
**All signals are shown regardless of Baseline qualification; however, when Baseline filter is active, only true continuations are shown. When the Baseline filter is not active, then all continuations are shown. True continuations are when the Baseline is active and maintains its uptrend/downtrend after the initial cross-up/cross-down over the middle-line respectively. This means that if the Baseline trend then moves against the Double Smoothed Stochastic then any continuation signals are voided until another initial Long/Short. All continuations are will either show as regular continuations or be converted into recovery continuations
***All signals are shown regardless of Volatility/Volume qualification
****When the Baseline filter is active, some regular continuations are converted to recovery continuations and are shown. When the Baseline filter is not active, then these signals are not shown.
Confirmation 2 Confluence Background Color Signals; Confirmation Order: Regular; Confirmation Type: Confirmation 1
Initial Long (L): The imported GKD-C Confirmation 1 indicator crosses-up over middle-line, then Double Smoothed Stochastic crosses-up over the middle-line on the same bar or "Number of Bars Confirmation" bars in the future (see X-bar rule below)
Initial Short (S): The imported GKD-C Confirmation 1 indicator crosses-down under middle-line, then Double Smoothed Stochastic crosses-down under the middle-line on the same bar or "Number of Bars Confirmation" bars in the future (see X-bar rule below)
Continuation Long Confirmation 1 (CL): The imported GKD-C Confirmation 1 indicator is over middle-line, then crosses-up over the signal
Continuation Short Confirmation 1 (CS): The imported GKD-C Confirmation 1 indicator is under middle-line, then crosses-down under the signal
Post Baseline Cross Long (BL): The imported GKD-C Confirmation 1 crossed-up over middle-line but Baseline is still in downtrend; and Double Smoothed Stochastic crossed-up over middle-line on the same bar or XX bars in the future but Baseline is still in downtrend; then Baseline turns to uptrend within "Maximum Allowable PSBC Bars Back" bars (see X-bar rule below)
Post Baseline Cross Short (BS): The imported GKD-C Confirmation 1 crossed-down under middle-line but Baseline is still in uptrend; and, Double Smoothed Stochastic crossed-down under middle-line on the same bar or XX bars in the future but Baseline is still in uptrend; then Baseline turns to downtrend within "Maximum Allowable PSBC Bars Back" bars (see X-bar rule below)
BL Recovery Continuation Long (RL): The imported GKD-C Confirmation 1 indicator is above middle-line. Baseline already crossed down into downtrend, then baseline crosses back up to uptrend while Double Smoothed Stochastic is still above middle-line; then, The imported GKD-C Confirmation 1 crosses-up over the signal
BL Recovery Continuation Short (RS): The imported GKD-C Confirmation 1 indicator is below middle-line. Baseline already crossed up into uptrend, then baseline crosses back down to downtrend while Double Smoothed Stochastic is still below middle-line; then, The imported GKD-C Confirmation 1 crosses-down under the signal
Confirmation 2 Confluence Background Color Signals; Confirmation Order: Regular; Confirmation Type: Confirmation 2
Initial Long (L): same as Confirmation 2 Confluence Background Color Signals; Confirmation Order: Regular; Confirmation Type: Confirmation 1
Initial Short (S): same as Confirmation 2 Confluence Background Color Signals; Confirmation Order: Regular; Confirmation Type: Confirmation 1
Continuation Long Confirmation 2 (CL): Double Smoothed Stochastic is over middle-line, then crosses-up over the signal
Continuation Short Confirmation 2 (CS): Double Smoothed Stochastic is under middle-line, then crosses-down under the signal
Post Baseline Cross Long (BL): same as Confirmation 2 Confluence Background Color Signals; Confirmation Order: Regular; Confirmation Type: Confirmation 1
Post Baseline Cross Short (BS): same as Confirmation 2 Confluence Background Color Signals; Confirmation Order: Regular; Confirmation Type: Confirmation 1
BL Recovery Continuation Long (RL): Double Smoothed Stochastic is above middle-line. Baseline already crossed down into downtrend, then baseline crosses back up to uptrend; then, Double Smoothed Stochastic crosses-up over the signal
BL Recovery Continuation Short (RS): Double Smoothed Stochastic is below middle-line. Baseline already crossed up into uptrend, then baseline crosses back down to downtrend; then, Double Smoothed Stochastic crosses-down under the signal
Confirmation 2 Confluence Background Color Signals; Confirmation Order: Regular; Confirmation Type: Both
Initial Long (L): same as Confirmation 2 Confluence Background Color Signals; Confirmation Order: Regular; Confirmation Type: Confirmation 1
Initial Short (S): same as Confirmation 2 Confluence Background Color Signals; Confirmation Order: Regular; Confirmation Type: Confirmation 1
Continuation Long Confirmation 2 (CL): The imported GKD-C Confirmation 1 indicator is over middle-line, then crosses-up over the signal; Double Smoothed Stochastic is over middle-line, then crosses-up over the signal within "Number of Bars Confirmation" bars in the future
Continuation Short Confirmation 2 (CS): The imported GKD-C Confirmation 1 indicator is under middle-line, then crosses-down under the signal; Double Smoothed Stochastic is under middle-line, then crosses-down under the signal within "Number of Bars Confirmation" bars in the future
Post Baseline Cross Long (BL): same as Confirmation 2 Confluence Background Color Signals; Confirmation Order: Regular; Confirmation Type: Confirmation 1
Post Baseline Cross Short (BS): same as Confirmation 2 Confluence Background Color Signals; Confirmation Order: Regular; Confirmation Type: Confirmation 1
BL Recovery Continuation Long (RL): The imported GKD-C Confirmation 1 indicator is above middle-line and Double Smoothed Stochastic is above middle-line. Baseline already crossed down into downtrend, then baseline crosses back up to uptrend; then, the imported GKD-C Confirmation 1 crosses-up over its signal, and Double Smoothed Stochastic crosses-up over its signal within "Number of Bars Confirmation" bars in the future
BL Recovery Continuation Short (RS): The imported GKD-C Confirmation 1 indicator is below middle-line and Double Smoothed Stochastic is below middle-line. Baseline already crossed up into uptrend, then baseline crosses back down to downtrend; then, the imported GKD-C Confirmation 1 crosses-down under its signal, and Double Smoothed Stochastic crosses-down under its signal within "Number of Bars Confirmation" bars in the future
Confirmation 2 Confluence Background Color Signals; Confirmation Order: Both; Confirmation Type: (continuations don't change from the variations above)
Initial Long (L): The imported GKD-C Confirmation 1 indicator crosses-up over middle-line, then Double Smoothed Stochastic crosses-up over the middle-line on the same bar or "Number of Bars Confirmation" bars in the future (see X-bar rule below); OR, Double Smoothed Stochastic crosses-up over middle-line, then the imported GKD-C Confirmation 1 indicator crosses-up over the middle-line on the same bar or "Number of Bars Confirmation" bars in the future (see X-bar rule below)
Initial Short (S): The imported GKD-C Confirmation 1 indicator crosses-down under middle-line, then Double Smoothed Stochastic crosses-down under the middle-line on the same bar or "Number of Bars Confirmation" bars in the future (see X-bar rule below); OR, Double Smoothed Stochastic crosses-down under middle-line, then the imported GKD-C Confirmation 1 indicator crosses-down under the middle-line on the same bar or "Number of Bars Confirmation" bars in the future (see X-bar rule below)
Post Baseline Cross Long (BL): The imported GKD-C Confirmation 1 crossed-down under middle-line but Baseline is still in uptrend; and, Double Smoothed Stochastic crossed-down under middle-line on the same bar or XX bars in the future but Baseline is still in uptrend; then Baseline turns to downtrend within "Maximum Allowable PSBC Bars Back" bars (see X-bar rule below); OR, Double Smoothed Stochastic crossed-down under middle-line but Baseline is still in uptrend; and, the imported GKD-C Confirmation 1 crossed-down under middle-line on the same bar or XX bars in the future but Baseline is still in uptrend; then Baseline turns to downtrend within "Maximum Allowable PSBC Bars Back" bars (see X-bar rule below)
Post Baseline Cross Short (BS): The imported GKD-C Confirmation 1 crossed-down under middle-line but Baseline is still in uptrend; and, Double Smoothed Stochastic crossed-down under middle-line on the same bar or XX bars in the future but Baseline is still in uptrend; then Baseline turns to downtrend within "Maximum Allowable PSBC Bars Back" bars (see X-bar rule below); OR, Double Smoothed Stochastic crossed-down under middle-line but Baseline is still in uptrend; and, the imported GKD-C Confirmation 1 crossed-down under middle-line on the same bar or XX bars in the future but Baseline is still in uptrend; then Baseline turns to downtrend within "Maximum Allowable PSBC Bars Back" bars (see X-bar rule below)
Solo Confirmation Signals
Initial Long (L): Double Smoothed Stochastic crosses-up over middle-line
Initial Short (S): Double Smoothed Stochastic crosses-down under middle-line
Continuation Long (CL): Double Smoothed Stochastic is over middle-line, then crosses-up over the signal
Continuation Short (CS): Double Smoothed Stochastic is under middle-line, then crosses-down under the signal
Post Baseline Cross Long (BL): Double Smoothed Stochastic crossed-up over middle-line but Baseline is still in downtrend, then Baseline turns to uptrend within XX bars
Post Baseline Cross Short (BS): Double Smoothed Stochastic crossed-down under middle-line but Baseline is still in uptrend, then Baseline turns to downtrend within XX bars
BL Recovery Continuation Long (RL): Double Smoothed Stochastic above middle-line. Baseline already crossed down into downtrend, then baseline crosses back up to uptrend while Double Smoothed Stochastic is still above middle-line
BL Recovery Continuation Short (RS): Double Smoothed Stochastic below middle-line. Baseline already crossed up into uptrend, then baseline crosses back down to downtrend while Double Smoothed Stochastic is still below middle-line
X-bar Rule settings
This rule only applies when this indicator "Confirmation Type" set to "Confirmation 2"
Requirements
Inputs: Confirmation 1 and Solo Confirmation: GKD-V Volatility/Volume indicator; Confirmation 2: GKD-C Confirmation indicator
Output: Confirmation 2 and Solo Confirmation: GKD-E Exit indicator; Confirmation 1: GKD-C Confirmation indicator
Additional features will be added in future releases.
This indicator is only available to ALGX Trading VIP group members . You can see the Author's Instructions below to get more information on how to get access.

GKD-C DiNapoli Stochastic [Loxx]Giga Kaleidoscope DiNapoli Stochastic Confirmation is a Confirmation module included in Loxx's "Giga Kaleidoscope Modularized Trading System".
What is Loxx's "Giga Kaleidoscope Modularized Trading System"?
The Giga Kaleidoscope Modularized Trading System is a trading system built on the philosophy of the NNFX (No Nonsense Forex) algorithmic trading.
What is an NNFX algorithmic trading strategy?
The NNFX algorithm is built on the principles of trend, momentum, and volatility. There are six core components in the NNFX trading algorithm:
1. Volatility - price volatility; e.g., Average True Range, True Range Double, Close-to-Close, etc.
2. Baseline - a moving average to identify price trend (such as "Baseline" shown on the chart above)
3. Confirmation 1 - a technical indicator used to identify trends. This should agree with the "Baseline"
4. Confirmation 2 - a technical indicator used to identify trends. This filters/verifies the trend identified by "Baseline" and "Confirmation 1"
5. Volatility/Volume - a technical indicator used to identify volatility/volume breakouts/breakdown.
6. Exit - a technical indicator used to determine when a trend is exhausted.
How does Loxx's GKD (Giga Kaleidoscope Modularized Trading System) implement the NNFX algorithm outlined above?
Loxx's GKD v1.0 system has five types of modules (indicators/strategies). These modules are:
1. GKD-BT - Backtesting module (Volatility, Number 1 in the NNFX algorithm)
2. GKD-B - Baseline module (Baseline and Volatility/Volume, Numbers 1 and 2 in the NNFX algorithm)
3. GKD-C - Confirmation 1/2 module (Confirmation 1/2, Numbers 3 and 4 in the NNFX algorithm)
4. GKD-V - Volatility/Volume module (Confirmation 1/2, Number 5 in the NNFX algorithm)
5. GKD-E - Exit module (Exit, Number 6 in the NNFX algorithm)
(additional module types will added in future releases)
Each module interacts with every module by passing data between modules. Data is passed between each module as described below:
GKD-B => GKD-V => GKD-C(1) => GKD-C(2) => GKD-E => GKD-BT
That is, the Baseline indicator passes its data to Volatility/Volume. The Volatility/Volume indicator passes its values to the Confirmation 1 indicator. The Confirmation 1 indicator passes its values to the Confirmation 2 indicator. The Confirmation 2 indicator passes its values to the Exit indicator, and finally, the Exit indicator passes its values to the Backtest strategy.
This chaining of indicators requires that each module conform to Loxx's GKD protocol, therefore allowing for the testing of every possible combination of technical indicators that make up the six components of the NNFX algorithm.
What does the application of the GKD trading system look like?
Example trading system:
Backtest: Strategy with 1-3 take profits, trailing stop loss, multiple types of PnL volatility, and 2 backtesting styles
Baseline: Leader Exponential Moving Average as shown on chart
Volatility/Volume: Volatility Ratio as shown on chart
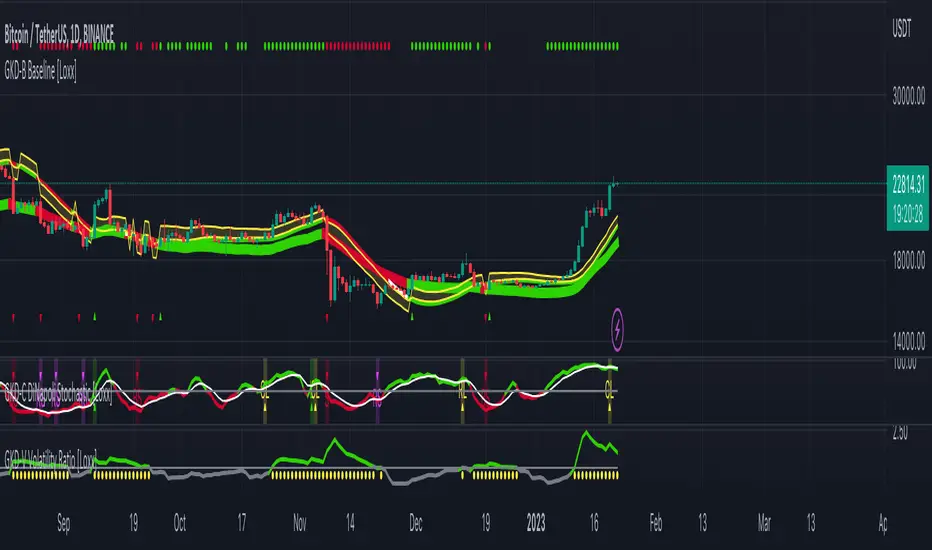
Confirmation 1: DiNapoli Stochastic as shown on the chart above
Confirmation 2: Jurik Turning Point Oscillator
Exit: Rex Oscillator
Each GKD indicator is denoted with a module identifier of either: GKD-BT, GKD-B, GKD-C, GKD-V, or GKD-E. This allows traders to understand to which module each indicator belongs and where each indicator fits into the GKD protocol chain.
Now that you have a general understanding of the NNFX algorithm and the GKD trading system. Let's go over what's inside the GKD-E DiNapoli Stochastic itself.
What is DiNapoli Stochastic?
The DiNapoli Stochastic demonstrates smoother indicators and therefore gives fewer false signals in comparison with the traditional oscillator.
The indicator is written in accordance with the description given in the book by Joe Dinapoli "Trading With DiNapoli Levels". This oscillator smoothing method leads to a filtering of the most "noise" component of the price movement.
The DiNapoli Stochastic indicator can be used in the strategies oriented to a standard stochastic. However, the stronger smoothing can lead to the loss of an array of signals. It is recommended to apply any trend indicator for more efficient use of the indicator and its signals filtering.
Signals
A GKD-C Confirmation indicator can be used as either a Confirmation 1, Confirmation 2, or Solo Confirmation indicator. See step 3 & 4 of the NNFX algorithm above to understand how this indicator fits into the GKD trading system. The Solo Confirmation setting allows you to test this indicator by itself without an additional GKD-C indicator present in the GKD protocol chain.
On the chart shown above, this indicator is shown as GKD-C DiNapoli Stochastic and is set to Solo Confirmation. The GKD-B Baseline, GKD-V Volatility Ratio, and this indicator satisfy the first three steps in the GKD trading system chain: GKD-B => GKD-V => GKD-C(solo).
The signals from each of these settings are as follows:
Confirmation 1 Signal
Initial Long (L): DiNapoli Stochastic crosses-up over middle-line*
Initial Short (S): DiNapoli Stochastic crosses-down under middle-line*
Continuation Long (CL): DiNapoli Stochastic is over middle-line, then crosses-up over the signal**
Continuation Short (CS): DiNapoli Stochastic is under middle-line, then crosses-down under the signal**
Post Baseline Cross Long (BL): DiNapoli Stochastic crossed-up over middle-line but Baseline is still in downtrend, then Baseline turns to uptrend within XX bars***
Post Baseline Cross Short (BS): DiNapoli Stochastic crossed-down under middle-line but Baseline is still in uptrend, then Baseline turns to downtrend within XX bars***
BL Recovery Continuation Long (RL): DiNapoli Stochastic is above middle-line. Baseline already crossed down into downtrend, then baseline crosses back up to uptrend; then, DiNapoli Stochastic crosses-up over the signal****
BL Recovery Continuation Short (RS): DiNapoli Stochastic is below middle-line. Baseline already crossed up into uptrend, then baseline crosses back down to downtrend; then, DiNapoli Stochastic crosses-down under the signal****
*All signals are shown regardless of Baseline and Volatility/Volume qualification
**All signals are shown regardless of Baseline qualification; however, when Baseline filter is active, only true continuations are shown. When the Baseline filter is not active, then all continuations are shown. True continuations are when the Baseline is active and maintains its uptrend/downtrend after the initial cross-up/cross-down over the middle-line respectively. This means that if the Baseline trend then moves against the DiNapoli Stochastic then any continuation signals are voided until another initial Long/Short. All continuations are will either show as regular continuations or be converted into recovery continuations
***All signals are shown regardless of Volatility/Volume qualification
****When the Baseline filter is active, some regular continuations are converted to recovery continuations and are shown. When the Baseline filter is not active, then these signals are not shown.
Confirmation 2 Signal
Initial Long (L): DiNapoli Stochastic crosses-up over middle-line*
Initial Short (S): DiNapoli Stochastic crosses-down under middle-line*
Continuation Long (CL): DiNapoli Stochastic is over middle-line, then crosses-up over the signal**
Continuation Short (CS): DiNapoli Stochastic is under middle-line, then crosses-down under the signal**
Post Baseline Cross Long (BL): DiNapoli Stochastic crossed-up over middle-line but Baseline is still in downtrend, then Baseline turns to uptrend within XX bars***
Post Baseline Cross Short (BS): DiNapoli Stochastic crossed-down under middle-line but Baseline is still in uptrend, then Baseline turns to downtrend within XX bars***
BL Recovery Continuation Long (RL): DiNapoli Stochastic is above middle-line. Baseline already crossed down into downtrend, then baseline crosses back up to uptrend while DiNapoli Stochastic is still above middle-line; then, DiNapoli Stochastic crosses-up over the signal****
BL Recovery Continuation Short (RS): DiNapoli Stochastic is below middle-line. Baseline already crossed up into uptrend, then baseline crosses back down to downtrend while DiNapoli Stochastic is still below middle-line; then, DiNapoli Stochastic crosses-down under the signal****
*All signals are shown regardless of Baseline and Volatility/Volume qualification
**All signals are shown regardless of Baseline qualification; however, when Baseline filter is active, only true continuations are shown. When the Baseline filter is not active, then all continuations are shown. True continuations are when the Baseline is active and maintains its uptrend/downtrend after the initial cross-up/cross-down over the middle-line respectively. This means that if the Baseline trend then moves against the DiNapoli Stochastic then any continuation signals are voided until another initial Long/Short. All continuations are will either show as regular continuations or be converted into recovery continuations
***All signals are shown regardless of Volatility/Volume qualification
****When the Baseline filter is active, some regular continuations are converted to recovery continuations and are shown. When the Baseline filter is not active, then these signals are not shown.
Confirmation 2 Confluence Background Color Signals; Confirmation Order: Regular; Confirmation Type: Confirmation 1
Initial Long (L): The imported GKD-C Confirmation 1 indicator crosses-up over middle-line, then DiNapoli Stochastic crosses-up over the middle-line on the same bar or "Number of Bars Confirmation" bars in the future (see X-bar rule below)
Initial Short (S): The imported GKD-C Confirmation 1 indicator crosses-down under middle-line, then DiNapoli Stochastic crosses-down under the middle-line on the same bar or "Number of Bars Confirmation" bars in the future (see X-bar rule below)
Continuation Long Confirmation 1 (CL): The imported GKD-C Confirmation 1 indicator is over middle-line, then crosses-up over the signal
Continuation Short Confirmation 1 (CS): The imported GKD-C Confirmation 1 indicator is under middle-line, then crosses-down under the signal
Post Baseline Cross Long (BL): The imported GKD-C Confirmation 1 crossed-up over middle-line but Baseline is still in downtrend; and DiNapoli Stochastic crossed-up over middle-line on the same bar or XX bars in the future but Baseline is still in downtrend; then Baseline turns to uptrend within "Maximum Allowable PSBC Bars Back" bars (see X-bar rule below)
Post Baseline Cross Short (BS): The imported GKD-C Confirmation 1 crossed-down under middle-line but Baseline is still in uptrend; and, DiNapoli Stochastic crossed-down under middle-line on the same bar or XX bars in the future but Baseline is still in uptrend; then Baseline turns to downtrend within "Maximum Allowable PSBC Bars Back" bars (see X-bar rule below)
BL Recovery Continuation Long (RL): The imported GKD-C Confirmation 1 indicator is above middle-line. Baseline already crossed down into downtrend, then baseline crosses back up to uptrend while DiNapoli Stochastic is still above middle-line; then, The imported GKD-C Confirmation 1 crosses-up over the signal
BL Recovery Continuation Short (RS): The imported GKD-C Confirmation 1 indicator is below middle-line. Baseline already crossed up into uptrend, then baseline crosses back down to downtrend while DiNapoli Stochastic is still below middle-line; then, The imported GKD-C Confirmation 1 crosses-down under the signal
Confirmation 2 Confluence Background Color Signals; Confirmation Order: Regular; Confirmation Type: Confirmation 2
Initial Long (L): same as Confirmation 2 Confluence Background Color Signals; Confirmation Order: Regular; Confirmation Type: Confirmation 1
Initial Short (S): same as Confirmation 2 Confluence Background Color Signals; Confirmation Order: Regular; Confirmation Type: Confirmation 1
Continuation Long Confirmation 2 (CL): DiNapoli Stochastic is over middle-line, then crosses-up over the signal
Continuation Short Confirmation 2 (CS): DiNapoli Stochastic is under middle-line, then crosses-down under the signal
Post Baseline Cross Long (BL): same as Confirmation 2 Confluence Background Color Signals; Confirmation Order: Regular; Confirmation Type: Confirmation 1
Post Baseline Cross Short (BS): same as Confirmation 2 Confluence Background Color Signals; Confirmation Order: Regular; Confirmation Type: Confirmation 1
BL Recovery Continuation Long (RL): DiNapoli Stochastic is above middle-line. Baseline already crossed down into downtrend, then baseline crosses back up to uptrend; then, DiNapoli Stochastic crosses-up over the signal
BL Recovery Continuation Short (RS): DiNapoli Stochastic is below middle-line. Baseline already crossed up into uptrend, then baseline crosses back down to downtrend; then, DiNapoli Stochastic crosses-down under the signal
Confirmation 2 Confluence Background Color Signals; Confirmation Order: Regular; Confirmation Type: Both
Initial Long (L): same as Confirmation 2 Confluence Background Color Signals; Confirmation Order: Regular; Confirmation Type: Confirmation 1
Initial Short (S): same as Confirmation 2 Confluence Background Color Signals; Confirmation Order: Regular; Confirmation Type: Confirmation 1
Continuation Long Confirmation 2 (CL): The imported GKD-C Confirmation 1 indicator is over middle-line, then crosses-up over the signal; DiNapoli Stochastic is over middle-line, then crosses-up over the signal within "Number of Bars Confirmation" bars in the future
Continuation Short Confirmation 2 (CS): The imported GKD-C Confirmation 1 indicator is under middle-line, then crosses-down under the signal; DiNapoli Stochastic is under middle-line, then crosses-down under the signal within "Number of Bars Confirmation" bars in the future
Post Baseline Cross Long (BL): same as Confirmation 2 Confluence Background Color Signals; Confirmation Order: Regular; Confirmation Type: Confirmation 1
Post Baseline Cross Short (BS): same as Confirmation 2 Confluence Background Color Signals; Confirmation Order: Regular; Confirmation Type: Confirmation 1
BL Recovery Continuation Long (RL): The imported GKD-C Confirmation 1 indicator is above middle-line and DiNapoli Stochastic is above middle-line. Baseline already crossed down into downtrend, then baseline crosses back up to uptrend; then, the imported GKD-C Confirmation 1 crosses-up over its signal, and DiNapoli Stochastic crosses-up over its signal within "Number of Bars Confirmation" bars in the future
BL Recovery Continuation Short (RS): The imported GKD-C Confirmation 1 indicator is below middle-line and DiNapoli Stochastic is below middle-line. Baseline already crossed up into uptrend, then baseline crosses back down to downtrend; then, the imported GKD-C Confirmation 1 crosses-down under its signal, and DiNapoli Stochastic crosses-down under its signal within "Number of Bars Confirmation" bars in the future
Confirmation 2 Confluence Background Color Signals; Confirmation Order: Both; Confirmation Type: (continuations don't change from the variations above)
Initial Long (L): The imported GKD-C Confirmation 1 indicator crosses-up over middle-line, then DiNapoli Stochastic crosses-up over the middle-line on the same bar or "Number of Bars Confirmation" bars in the future (see X-bar rule below); OR, DiNapoli Stochastic crosses-up over middle-line, then the imported GKD-C Confirmation 1 indicator crosses-up over the middle-line on the same bar or "Number of Bars Confirmation" bars in the future (see X-bar rule below)
Initial Short (S): The imported GKD-C Confirmation 1 indicator crosses-down under middle-line, then DiNapoli Stochastic crosses-down under the middle-line on the same bar or "Number of Bars Confirmation" bars in the future (see X-bar rule below); OR, DiNapoli Stochastic crosses-down under middle-line, then the imported GKD-C Confirmation 1 indicator crosses-down under the middle-line on the same bar or "Number of Bars Confirmation" bars in the future (see X-bar rule below)
Post Baseline Cross Long (BL): The imported GKD-C Confirmation 1 crossed-down under middle-line but Baseline is still in uptrend; and, DiNapoli Stochastic crossed-down under middle-line on the same bar or XX bars in the future but Baseline is still in uptrend; then Baseline turns to downtrend within "Maximum Allowable PSBC Bars Back" bars (see X-bar rule below); OR, DiNapoli Stochastic crossed-down under middle-line but Baseline is still in uptrend; and, the imported GKD-C Confirmation 1 crossed-down under middle-line on the same bar or XX bars in the future but Baseline is still in uptrend; then Baseline turns to downtrend within "Maximum Allowable PSBC Bars Back" bars (see X-bar rule below)
Post Baseline Cross Short (BS): The imported GKD-C Confirmation 1 crossed-down under middle-line but Baseline is still in uptrend; and, DiNapoli Stochastic crossed-down under middle-line on the same bar or XX bars in the future but Baseline is still in uptrend; then Baseline turns to downtrend within "Maximum Allowable PSBC Bars Back" bars (see X-bar rule below); OR, DiNapoli Stochastic crossed-down under middle-line but Baseline is still in uptrend; and, the imported GKD-C Confirmation 1 crossed-down under middle-line on the same bar or XX bars in the future but Baseline is still in uptrend; then Baseline turns to downtrend within "Maximum Allowable PSBC Bars Back" bars (see X-bar rule below)
Solo Confirmation Signals
Initial Long (L): DiNapoli Stochastic crosses-up over middle-line
Initial Short (S): DiNapoli Stochastic crosses-down under middle-line
Continuation Long (CL): DiNapoli Stochastic is over middle-line, then crosses-up over the signal
Continuation Short (CS): DiNapoli Stochastic is under middle-line, then crosses-down under the signal
Post Baseline Cross Long (BL): DiNapoli Stochastic crossed-up over middle-line but Baseline is still in downtrend, then Baseline turns to uptrend within XX bars
Post Baseline Cross Short (BS): DiNapoli Stochastic crossed-down under middle-line but Baseline is still in uptrend, then Baseline turns to downtrend within XX bars
BL Recovery Continuation Long (RL): DiNapoli Stochastic above middle-line. Baseline already crossed down into downtrend, then baseline crosses back up to uptrend while DiNapoli Stochastic is still above middle-line
BL Recovery Continuation Short (RS): DiNapoli Stochastic below middle-line. Baseline already crossed up into uptrend, then baseline crosses back down to downtrend while DiNapoli Stochastic is still below middle-line
X-bar Rule settings
This rule only applies when this indicator "Confirmation Type" set to "Confirmation 2"
Requirements
Inputs: Confirmation 1 and Solo Confirmation: GKD-V Volatility/Volume indicator; Confiration 2: GKD-C Confirmation indicator
Output: Confirmation 2 and Solo Confirmation: GKD-E Exit indicator; Confiration 1: GKD-C Confirmation indicator
Additional features will be added in future releases.
This indicator is only available to ALGX Trading VIP group members . You can see the Author's Instructions below to get more information on how to get access.
TwV Market SignalsSignals Indicator
Summary
This indicator allows traders to have in handy short and long signals and estimate the trend of the market.
The indicator draws Long and Short signals depending on the trend analysis. The indicators also use meaningful colors for traders to be able to visually understand the graphs, such us fillings on EMAs, so the possible trend is represented.
The colors used are light green for bullish, red for bearish, dark green for possible bearish to bullish change and purple for possible bullish to bearish change. These colors are applicable to all fillings and summary box.
How to use this indicator
The use of EMAs 10,20 and 50 draw the medium to long term trends, therefore avoiding signals against the trend. Furthermore the EMAs will advise possible change in trends, specially considering the 10 and 20 cross, considering that crossing the 10,20 and 50, might confirm the change in med to long term trend change of the price. This is completely visual in the chart as it tints green for positive trend and yellow to red for negative trend.
The 200 SMA is included as it also gives better confirmation to the trend, the basics tell that when the EMAs mentioned above are below the 200 SMA then the likelihood for entries in long positions are not the best and vice versa for short.
Therefore, the trader shall filter Long and Short Signals accordingly as this EMAs are not used to send Long and Short signals considering that they confirm the trend in a slow pace and not reactively to the price volatility.
There are two strategies built-in within the indicator:
Strategy 1 – Longer time trades and high volatility handling
The Long and Short Signals are based on 14 and EMAs (by default). This two Mas are used to send signals based on their crossovers as they are way more reactive to the price movement.
Trader shall consider that EMAs are used for higher timeframes, therefore the indicator has the possibility to adjust the EMAs and use SMAs or WMAs instead for one or the two parameters (14 and 21).
WMAs react faster to the price volatility so the trader shall adjust this according to the timeframe being used. (Lower timeframes suggested).
This strategy is used for trades that might keep running for longer periods of times.
For reference on what the SMAs, EMAs and WMAs are, please see below sections in the description.
Strategy 2 - Shorter time trades and unhandled high volatility
The Long and Short Signals are bases on HMA. HMAs (Hull Moving Averages) track the price movement and volatility way faster that SMAs, EMAs and WMAs, therefore as the HMA follow the price quicker, it is intended for short time trades even in higher timeframes.
Scalping is not suggested using this strategy as HMA do not handle high volatility even on higher timeframes.
One of the biggest differences from the first strategy is that there is no more than a single HMA length to work with, which is 24 as default.
HMAs calculation is different to other MAs, therefore combining various HMAs lengths looking for crossovers become trend identification a lot less precise. HMAs are not intended to be used with different length crossovers.
Exit points = The use of Stochastic and VRVP
Stochastic RSI
It is well known that when Stochastic RSI resets when overbought or oversold therefore traders have within a summary box the possibility to check whether the K & D lines in the Stochastic RSI hace crossed over bullish or bearish.
Although the crossover is not mandatory for a change trend, the crossover might be used by the trader to exit a position considering that the price might move on the opposite direction.
Traders shall look at the summary box, where bullish and bearish crossovers are shown, so they evaluate their position exit.
Visible Range Volume Profile
The use of the VRVP is to find support and resistance on the price movements. Although high and lows are used as possible supports and resistances, VRVP shows an area of confluence on the order book, where volume of positions are accumulated and that might act as support or resistance depending on the price direction.
Traders can visually activate the VRVP to see the Point of Control (POC) directly on the chart as a line (similar as how a support or resistance would be drawn). Moreover, traders have the ability to see within the summary box, whether to see if the price is above or below the POC, so they clearly know if it is acting as support or resistance.
Price Direction
Trade the market trend is well know to be used to identify possible price direction. It is important not to confuse the longer time trend drawn by the EMAs with the TTM Trend bar color. The TTM trend colors bars according to the price direction, helping traders not to confuse when a red bar appears on an up trend or green bars on a down trend.
This coloring helps traders not to exit trades based on bar coloring, which might psychologically affect when scalping or short-term trading specially.
Originally, the TTM trend is used considering the ADX in and indicator called TTM Squeeze, where the strength of the movement is measured, therefore although candle colors help with the price direction, ADX provides the trader the ability to see whether the direction is losing momentum and then catch the best possible exit before the direction change.
How to use Summary
1. Receive the Long or Short Signals using strategy 1 or 2, depending on the selected in the main menu of the indicator.
2. Evaluate the trend based on the 10,20, 50 and 200 MAs. Filter the Long and Short signals accordingly.
3. Monitor constantly the TTM Trend and the ADX for the direction and strength of the position entered and review if the momentum is being lost, considering step 4 or other possible reasons that might lead to exiting the position.
4. Once entered to a position evaluate constantly the Stochastic RSI bearish or bullish crossover or POC value on screen or summary box to exit the position.
Terminology basics
Trend indicators
Exponential Moving Average (EMAs): The base indicator is composed of moving averages of 10, 20 and 55 exponential periods, to determine a possible bullish or bearish trend (EMA Crossing)
Simple Moving Average (SMA): The base indicator is composed of a moving average of 200 simple periods, which in conjunction with the EMAs can lead to estimate potential upward or downwards moves, as well as possible resistances. (SMA Positioning)
Weighted moving average (WMA): It is a technical indicator that traders use to generate trade direction and make a long or short position. It assigns greater weighting to recent data points and less weighting on past data points. (WMA Crossing)
Strength and S/R indicators
VPVR (Volume Profile Visible Range): It allows to determine the Point of Control (POC) which is the node with the highest volume profile. This can be used as an important retest point or to calculate potential support and resistance. The POC level is represented with a red dotted line in the graph.
The VPVR is a simplified version of the “TwV Multi-timeframe Dynamic VRVP” that you can find for free use in my profile. This version calculates the main’s timeframe POC and also has the possibility to be fixed range if the trader enables it from the menu. (Dynamic range by default).
ADX (Average Directional Index): The ADX helps the indicator to estimate the strength of the movement, always considering the DI+ and DI- to not go against the trend strength. This is represented as summary text in a table.
/
Exit indicator
Stochastic RSI: It is an indicator used in technical analysis that ranges between zero and a hundred and is created by applying the Stochastic oscillator formula to a set of relative strength index (RSI) values rather than to standard price data. Using RSI values within the Stochastic formula gives traders an idea of whether the current RSI value is overbought or oversold (Exit zones)
/
Summary Panel
This panel allows the trader to have a summary of the current status (bearish or bullish) of some of the most determinant indicators within the strategy. It has the following characteristics:
It is placed on the right bottom side of the chart by the default. Traders can change its position or hidden it through the main menu of the indicator.
Its colors change according to the indicator’s values and constant change for easier detection.
The summary box shows the projection for each of the indicators (Trend, Stochastic, EMA, VPVR and ADX).
The summary box is multi-language (English and Spanish), which can be changes in the main menu of the indicator
Alerts
Within the indicator’s menu, you can set up alerts for all long, short, close long and close short signals, which might come in handy when the trader would like to have notifications on the Trading View website, desktop app or phone apps. Furthermore, there are also signals for possible exit points, which can also be activated from the indicator’s menu.

TwV Market Signals ScreenerMarket Signals Screener
This indicator allows traders to have a view of multiple pairs and timeframes Long/Short signals and specific information of parameters, based on the TwV Market Signals also developed by me and that can be found on my profile.
Full Screener Panel
This panel allows the trader to monitor multiple pairs at a single screen, giving an immediate vision of possible entries and exits (Long/Short). Moreover, allows traders to have handy all information of the TwV Market Signals Indicator that might be analyzed further for each pair. It has the following characteristics:
It can be placed anywhere on the screen through the main menu of the indicator.
It can be combined with the same indicator multiple times, as per screener is limited to show 40 pairs, you can select the number of panels being added to adjust position one next to each other.
It strengthens colors when a pair has changed its signals in order to the trader to know immediate changes and then do the follow up
The screener shows the pairs, which can be changed within the menus.
The screener shows the Long and Short Signals in its las column but previously, it shows the most critical parameters in the strategies (Market Signals Indicator) that determined the possible Long/Short position. Therefore, the EMAs, STOCH, SQZ, ADX, and TTM, are summarized in the screener for each pair.
For analyzing a specific pair, refer to the the Twv Market Signals Indicator, which is other indicator that might be on my TradingView Profile and that was used as base for the screener.
How to use this indicator and work with the strategies of the TwV Market Signals Indicator
The use of EMAs 10,20 and 50 draw the medium to long term trends, therefore avoiding signals against the trend. Furthermore, the EMAs will advise possible change in trends, especially considering the 10 and 20 cross, considering that crossing the 10,20 and 50, might confirm the change in med to long term trend change of the price. This is completely visual in the chart as it tints green for positive trend and yellow to red for negative trend.
The 200 SMA is included as it also gives better confirmation to the trend, the basics tell that when the EMAs mentioned above are below the 200 SMA then the likelihood for entries in long positions are not the best and vice versa for short.
Therefore, the trader shall filter Long and Short Signals accordingly as this EMAs are not used to send Long and Short signals considering that they confirm the trend in a slow pace and not reactively to the price volatility.
There are two strategies built-in within the indicator:
Strategy 1 – Longer time trades and high volatility handling
The Long and Short Signals are based on 14 and EMAs (by default). This two Mas are used to send signals based on their crossovers as they are way more reactive to the price movement.
Trader shall consider that EMAs are used for higher timeframes, therefore the indicator has the possibility to adjust the EMAs and use SMAs or WMAs instead for one or the two parameters (14 and 21).
WMAs react faster to the price volatility so the trader shall adjust this according to the timeframe being used. (Lower timeframes suggested).
This strategy is used for trades that might keep running for longer periods of times.
For reference on what the SMAs, EMAs and WMAs are, please see below sections in the description.
Strategy 2 - Shorter time trades and unhandled high volatility
The Long and Short Signals are bases on HMA. HMAs (Hull Moving Averages) track the price movement and volatility way faster that SMAs, EMAs and WMAs, therefore as the HMA follow the price quicker, it is intended for short time trades even in higher timeframes.
Scalping is not suggested using this strategy as HMA do not handle high volatility even on higher timeframes.
One of the biggest differences from the first strategy is that there is no more than a single HMA length to work with, which is 24 as default.
HMAs calculation is different to other MAs, therefore combining various HMAs lengths looking for crossovers become trend identification a lot less precise. HMAs are not intended to be used with different length crossovers.
Exit points = The use of Stochastic and VRVP
Stochastic RSI
It is well known that when Stochastic RSI resets when overbought or oversold therefore traders have within a summary box the possibility to check whether the K & D lines in the Stochastic RSI hace crossed over bullish or bearish.
Although the crossover is not mandatory for a change trend, the crossover might be used by the trader to exit a position considering that the price might move on the opposite direction.
Traders shall look at the summary box, where bullish and bearish crossovers are shown, so they evaluate their position exit.
Visible Range Volume Profile
The use of the VRVP is to find support and resistance on the price movements. Although high and lows are used as possible supports and resistances, VRVP shows an area of confluence on the order book, where volume of positions are accumulated and that might act as support or resistance depending on the price direction.
Traders can visually activate the VRVP to see the Point of Control (POC) directly on the chart as a line (similar as how a support or resistance would be drawn). Moreover, traders have the ability to see within the summary box, whether to see if the price is above or below the POC, so they clearly know if it is acting as support or resistance.
Price Direction
Trade the market trend is well known to be used to identify possible price direction. It is important not to confuse the longer time trend drawn by the EMAs with the TTM Trend bar color. The TTM trend colors bars according to the price direction, helping traders not to confuse when a red bar appears on an uptrend or green bars on a down trend.
This coloring helps traders not to exit trades based on bar coloring, which might psychologically affect when scalping or short-term trading specially.
Originally, the TTM trend is used considering the ADX in and indicator called TTM Squeeze, where the strength of the movement is measured, therefore although candle colors help with the price direction, ADX provides the trader the ability to see whether the direction is losing momentum and then catch the best possible exit before the direction change.
Terminology basics
Trend indicators
Exponential Moving Average (EMAs): The base indicator is composed of moving averages of 10, 20 and 55 exponential periods, to determine a possible bullish or bearish trend (EMA Crossing)
Simple Moving Average (SMA): The base indicator is composed of a moving average of 200 simple periods, which in conjunction with the EMAs can lead to estimate potential upward or downwards moves, as well as possible resistances. (SMA Positioning)
Weighted moving average (WMA): It is a technical indicator that traders use to generate trade direction and make a long or short position. It assigns greater weighting to recent data points and less weighting on past data points. (WMA Crossing)
Strength and S/R indicators
VPVR (Volume Profile Visible Range): It allows to determine the Point of Control (POC) which is the node with the highest volume profile. This can be used as an important retest point or to calculate potential support and resistance. The POC level is represented with a red dotted line in the graph.
The VPVR is a simplified version of the “TwV Multi-timeframe Dynamic VRVP” that you can find for free use in my profile. This version calculates the main’s timeframe POC and also has the possibility to be fixed range if the trader enables it from the menu. (Dynamic range by default).
ADX (Average Directional Index): The ADX helps the indicator to estimate the strength of the movement, always considering the DI+ and DI- to not go against the trend strength. This is represented as summary text in a table.
/
Exit indicator
Stochastic RSI: It is an indicator used in technical analysis that ranges between zero and a hundred and is created by applying the Stochastic oscillator formula to a set of relative strength index (RSI) values rather than to standard price data. Using RSI values within the Stochastic formula gives traders an idea of whether the current RSI value is overbought or oversold (Exit zones)
/
How to use Summary
1. Receive the Long or Short Signals using strategy 1 or 2, depending on the selected in the main menu of the indicator.
2. Evaluate the trend based on the 10,20, 50 and 200 MAs. Filter the Long and Short signals accordingly.
3. Monitor constantly the TTM Trend and the ADX for the direction and strength of the position entered and review if the momentum is being lost, considering step 4 or other possible reasons that might lead to exiting the position.
4. Once entered to a position evaluate constantly the Stochastic RSI bearish or bullish crossover or POC value on screen or summary box to exit the position.
5. Consider that for doing the evaluation individually, you shall use the TwV Market Signals.
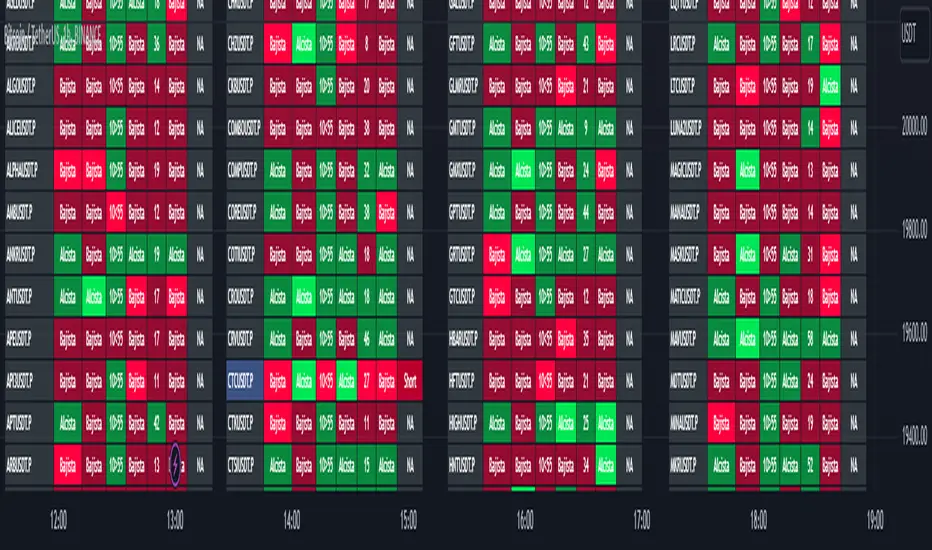
RSI Bands [APIDEVs]RSI BANDS:
It is an exclusive product of ApiDevs, this indicator selectively integrates a series of highly advanced algorithms that aim to provide the trader with an effective and profitable trading system, based on a series of conditions that project the price direction with a reasonable probability.
This indicator bears the name of “RSI Bands”, this is because we have based this trading system on the “Relative Strength Index ( RSI )”, the strength of this indicator is centennial and we at APIDEVs have decided to focus our efforts on the development of powerful tools based on the favorite indicators of the afternoon.
WHAT IT HAS INCORPORATED:
1. Exponential Moving Average (EMAs): The RSI Bands has, by default, a band composed of two moving averages of 10 and 55 exponential periods, which can be modified in the indicator menu.
• Possibility of changing the value of the EMAs.
• Function was enabled to change the color and transparency of the bands.
• Visual alerts SHORT (L) and LONG (L) were added when there is the crossing of the EMAS.
• Hull Moving Average ( HMA ) of 100 periods was also incorporated, also modifiable for those who wish to strengthen their visual analysis. (Disabled by default)
• We also add an Exponential Moving Average ( EMA ) of 200 periods to mark the trend. (Disabled by default).
2. ATR ( Average True Range ): This indicator has two main functions in the RSI Bands, the first is to mark the trend of the asset and the second is to establish a margin of safety in price volatility , that is, a maximum estimate of the setbacks without this representing a change in the direction of the price.
3. RSI ( Relative Strength Index ): It was visually incorporated into the RSI Bands, the graph is obtained on the right side and its purpose is to visually indicate where the price is with respect to the RSI PRO+ indicator, offering the following improvements :
• ALERT SYSTEM: THE RSI PRO+ has the ADX incorporated into its algorithm, which allows establishing a filter that will provide reliable inputs, represented by the LONG (L) and SHORT (S) signals.
• FILTER AGAINST TREND: The signals described above will be activated according to the crossing of the RSI above the 50 point, provided that the ADX agrees with the market direction.
• Possibility of deactivating this graphical representation.
4. ADX ( Average Directional Index ): The ADX in this indicator is intended to estimate the strength of the movement, it is present in each part of the code, either to indicate the strength of the market or to serve as a filter against trend. In the same way, we apply certain exclusive improvements for this indicator:
• It was established as default values of the ADX that the Level Range was 10 and the Level Trend 25. This significantly changes the behavior of this indicator, almost completely eliminating the zone of disinterest that was usually considered.
• A function was activated to paint the sails the color of the ADX .
5. ADX Ocillator: Yes, we developed a Wave oscillator type ADX and incorporated it into this strategy. From this indicator, which we recommend using in conjunction with the RSI Bands, we extracted the LONG (L) and SHORT (S) signals. The ADX Oscillator is the improved version of the traditional ADX as it offers the following improvements:
• Its interpretation is much simpler.
• Allows you to set entry and exit signals during the trend change and during the price path.
• It has an integrated alert system.
STRATEGY PANEL:
This panel is an exclusive creation of APIDEVs, and its purpose is to parameterize five conditionals based on the indicators that make up our RSI strategy, giving the trader an immediate vision of the status of the asset analyzed considering this strategy. That is, we decided to transfer our experience of using this indicator on a panel that will project the price trajectory visually. It has the following characteristics:
• It can be placed anywhere on the screen through the main menu of the indicator, it can even be deactivated.
• It can be resized, we designed this to adapt to all types of screens, including those of mobile phones.
• It has an upper panel called "Project" which will calculate the percentage probability that the price has to take a direction based on all the indicators incorporated into the strategy. Their values range from (+ 100%) to (-100%).
STRATEGY PANEL PARAMETERS:
1. EMAs: This panel has 2 variables:
• LONG: If the fast EMA is above the slow EMA .
• SHORT: If the fast EMA is below the slow EMA .
2. RSI: This panel has 3 variables:
• LONG: The RSI should be bullish (green) and above the 50 point.
• SHORT: The RSI should be bearish (red) and be below the 50 point.
• RANK: (Range)this condition is activated when there is no concordance with the RSI condition and its crossing.
3. ATR: This panel has 2 variables:
• LONG: When the price is above the ATR.
• SHORT: When the price is below the ATR.
4. ADX: This panel has 3 variables:
• LONG: The ADX is green. That is, the DI + is above the DI-.
• SHORT: The ADX is red. That is, the DI- is above the DI +.
• RANK: ADX is below point 10.
It also has a numerical value that indicates the value of the ADX and two texts indicating the strength of the trend:
• Trend ( bullish or bearish ).
• Strong trend ( bullish or bearish ).
5. OSC: This panel has 3 variables:
• LONG: The oscillator slopes upward and the built-in ADX is green.
• SHORT: The oscillator slopes downward and the built-in ADX is red.
• RANK: The oscillator slopes downward and the built-in ADX is green and the opposite. In short, there is no coherence in the movement of the oscillator and the projection of the ADX .

TL_Strategy [APIDEVs]TL_STRATEGY:
The TL_STRATEGY , is a whole ecosystem of indicators that make up a quite powerful and famous strategy in cryptocurrency trading, it is composed of the following indicators:
• Exponential moving media bands (10 and 55).
• Squeeze Momentum indicator (SQZMON PRO +).
• Volume profile (VP Developed by APIDEVs).
• Average directional index ( ADX PRO +).
In ApiDev , we decided to visually optimize this strategy, that is why we created an information panel that shows the joint projection of all the indicators that we already mentioned.
IMPROVEMENTS MADE IN THE STRATEGY:
Simpler: We simplified the interface of all indicators [so that the trader can follow the ABCs of his strategy without much complication.
Buy and sell signals: Based on a strategy that incorporates two moving averages of 10 and 55 periods, the observation of the strength of the ADX and the directionality of the oscillators of the SQZMON, signals of buying and selling to be valued by the trader.
Side panel: We integrate a side panel that allows observing the assessment and direction of all the indicators that make up the strategy.
It has an alert system that will send notifications about the changes that occur in the indicator.

Big Poppa Code Strat & Momentum Strategy IndicatorThis indicator is a combination of a few things in order to work with a unique trading style gleaned from Callme100k, jrgreatness, TrustMyLevels , FaithInTheStrat, Rob Smith and Saty Mahajan.
This Indicator is created to help you day trade using, ATR Fibonacci Levels, Price Action and Momentum.
It displays Fibonacci Levels Based on ATR to indicate when a security is 0.236, 0.382 +- the Days Open, +- the Days Open, 0.618 +- the Days Open and 1.0 +- Days Open.
To understand this script you need to understand
Average True Range (ATR)
1 Bar Inside Bar
2 Bar Outside Bar (Break either the top or bottom)
3 Bar Engulfing Bar
Strat Setups - 212, 322, 312
Fibonacci - 0.236, 0.382, 0.618, 1.0
Moving Averages
A Trend is considered bullish when (green)
Current Price is greater than the Fast EMA Value (8)
Fast EMA is greater than PIVOT EMA Value (21)
Pivot EMA is greater than SLOW EMA Value (34)
OR Hull is trending up and the Price is above the Volume Weighted Moving Average and price is above VWAP
A trend is considered Bearish when (red)
Current Price is less than the Fast EMA Value (8)
Fast EMA is less than PIVOT EMA Value (21)
Pivot EMA is less than SLOW EMA Value (34)
OR Hull is trending down and the Price is below the Volume Weighted Moving Average and price is below VWAP
If these conditions are not met then the Momentum is in Conflict (orange)
The Momentum band will match the color of the current trend
The table that is present can be turned off at any time lets you see
1) If Moving Averages are showing bullish, bearish or in conflict
2) If There us Time Frame Continuity, (if 5 min up, are all the other timeframes up also)
3) How much of the ATR have we moved on the day
4) Are we in Call or Put range for the day based on ATR Fib Levels
The Ideal situation for entering a call
1) Momentum is Green
2) FTFC on Green
3) A Strat Actionable Signal is present
4) You are in the call range, 0.236 - 0.618 ATR + the Price
5) The ATR still has room, I.e only 50% of the ATR has been run already
Ideal situation from entering a put
1) Momentum is red
2) FTFC on Red
3) A Strat Actionable Signal is present
4) You are in the put range, 0.236 - 0.618 ATR - the Price
5) The ATR still has room, I.e only 50% of the ATR has been run already
Exit the trade for these reasons you entered (for profit or loss)
1) ATR has no more room
2) FTFC is now in conflict
3) Momentum has shifted
Take Profit when
1) You reach a new ATR Level 0.618, 1.0 , -0.618, -1, etc
Passive Stop Loss
1) Open Price if you are aggressive
2) Next ATR Level Down or Up
Feel free to take profit and leave runners
This script does not give signals, you should do your own research, I am not a financial advisors, I am simply applying principles of seasoned veterans to code. You make all decisions about how you buy, sell and trade. The creator of this script makes no promises and takes no responsibility for your personal trading.
To research the methods described above look up
Rob Smith : The Strat
Saty Mahajan : ATR Levels
Fibonacci
Using the HULL Moving Average
Exponential Moving Averages
VWAP
VWMA

Fibonacci Zones EMA Zones StrategyThis idea is only for fun and learning purposes only.
The strategy represents 2 simple math formulas that are very simple. the "Fibo Formula" and the "EMA Formula" Please see source code for reference
I Feel like coders can learn a lot about developing strategies using this source code
This is to show that there is unlimited amount of variables and factors to a strategy and its all about working with probability.
Also to show that unlimited amount of conditions could be added to a strategy.
And unlimited amount of variables/factors with the settings that could change the results.
Rules are simple
Entry on close, Close/Entry must be in the blue Fibo Zone
Blue Fibonacci zone fully customizable
Other Conditions could be added involving EMA zones, Over Ema1, Under Ema1 etc..
TP/SL and Dates Fully Customizable
This script is just an idea fully for learning purposes.

RSI Strategy - Backtest [AlgoRider]█ OVERVIEW
Hello dear Tradingviewers !
We share with you this new indicator which simulates a trading strategy based solely on the well-known technical indicator RSI . We designed it for the sole educational and analytical purposes of showing novice traders and new investors that basing a trading strategy only on one such technical indicator is not necessarily a good thing to do. We do not recommend to apply this strategy for real.
Thanks to this indicator redesigned in our own way by incorporating our simple and easy-to-use Backtest functionality, you will be able to see and report on the performance and results that such a strategy has produced in the past.
The configuration window has also been designed to be easily readable and simple to use. Our goal is to make parameter customization as easy as possible.
█ HOW THE STRATEGY WORKS
• The script will trigger Long entries when the price crosses upwards the Oversold zone (Default 38.2) and Short entries when the price crosses downward the Overbought zone (Default 61.8).
• A Short signal ends a Long trade, a Long signal ends a Short trade.
• The script also allows setting up custom TP and SL.
• Several options allow you to reverse entry and exit conditions of trades. You can choose to reverse entries or/and exits (Ex: when the script detects a Long Entry, it will actually trigger a Short trade).
• You can also change the entry conditions of the strategy. Instead of entering oversold/overbought zone conditions, it will trigger entries when the Rsi changes direction and reverses (Ex: when the rsi has been going down for 5 candles, and the rsi starts going up) , regardless of the area in which the RSI is located.
• There is no repaint, once an entry/exit symbol or drawing is displayed it doesn't change anymore. The Short and Long signals appear at the open of the candles, just after the signal was confirmed at the close of the previous candle. The custom TP and custom SL signals can appear when a candle is not yet finished, but once displayed they don't change.
█ HOW TO PROCEED
1 — Once the script is applied to your chart, it already works with its default settings. You can already see the performance of the strategy in the data table directly on the chart (in the top right corner by default).
2 — You can customize the strategy and influence the results/performance by modifying its parameters. 4 types of parameters are present and can be modified.
3 — You can use this indicator in all types of markets.
4 — You can apply the script in every timeframe.
█ PARAMETERS
• Settings For Backtesting
- Strategy : Choose from a drop-down list if the strategy should execute only Long trades or only Short trades or both. Default Both.
- Invest. : Choose the amount you want to invest in the simulation. Default 10000.
- Position : Choose the amount of the position (Size order) that will be used during the simulation. This will be the $ amount staked/involved for each trade entry.
Ex: If you put 20000 in position and 10000 in Invest. We consider that you use at least a leverage x2. Default 10000.
- Slipp. TP : Choose the amount in percentage of average slippage for Take Profits. This parameter makes it possible to predict a potential gap between the theoretical exit price for each TP (On the graph) and the real exit price on an exchange when implementing the strategy for real (slippage may be due to a time lag of a few seconds from execution time of the order on the exchange and/or due to the execution of a market order).
Ex: If a TP exit order of a Long trade, with entry $19000 (on BTCUSDT ), is carried out in theory on the chart at $20000, in practice on the exchange the script have indeed sent an exit order at 20000 , but if the true exit price is 20050, the TP slippage is then +0.25%. Default 0.
- Slipp. SL : Choose the amount in percentage of average slippage for Stop Losses. This parameter makes it possible to predict a potential gap between the theoretical exit price for each SL (On the graph) and the real exit price on an exchange when implementing the strategy for real.
Ex: If an SL exit order of a Long trade, entry $19000 (on BTCUSDT ), is carried out in theory on the chart at $18000, in practice on the exchange the script have indeed sent an exit order at 18000 $, but if the true exit price is 17950, the slippage SL is then +0.278%. Default 0.
- Fees % : Choose the percentage amount of fees applied to each trade to simulate the application of the strategy on the exchange of your choice. Applies to the entry and exit of each trade. Ex: For Binance Futures: 0.04; For Bybit futures: 0.06; For Ftx Futures: 0.075. Default 0.
- Cumulate Trades : If you check this, the Backtest will use 100% of the balance as Order Size (Position) for All or in the next X consecutive trades. Default not checked.
⚠️ Be Careful please, this option is available to show the full extent and possibilities of the algorithm when pushed to its limits thanks to the accumulation of profits (cumulative earnings ), but it is a strategy that involves great risk. If a bad trade suffers a -50% loss, 50% of the account balance is lost, if the position is liquidated, the entire account balance is lost.
- All : If you check this All trades will be accumulated. Default not checked.
- Consecutive Trades : Choose the number of trades to accumulate. After X consecutive trades, the algorithm reassigns the initial order size to the current one and starts again for X consecutive trades. Minimum Value 2, Default 2.
• Change Entry & Exit conditions
- Rsi Turns Up/Down : Enable this option to change conditions for trade entries. For Long entries : It will start a Long trade when RSI turns up and the RSI was falling on the last X bar(s). For Short entries : It will start a Short trade when RSI turns down and the RSI was rising on the last X bar(s). Default not checked.
- After Falling/Rising Bars(s) : Choose the number of bars/candles since which the price was falling/rising. Default 5.
- Reverse Entries : Enable this option to reverse conditions for trade entries. When a Short signal appears, it will actually start a Long trade. When a Long signal appears, it will actually start a Short trade. Default not checked.
- Reverse Exits : Enable this option to reverse conditions for trade exits. Default not checked.
- Safety Stop Loss : Enable this option to quickly cut the trade when the price turns quickly. For a Long trade : if the price returns to the oversold zone, it ends the trade. For a Short trade : if the price returns to the overbought zone, it ends the trade. Mainly useful for basic strategy (overbought/oversold conditions). Default not checked.
• Settings To Optimize Performances and Risk Management
- Len RSI : The length of RSI . Default 14.
- Overbuy : You can change the limit value of the overbought zone of the RSI . Default 61.8.
- Oversell : You can change the limit value of the oversell zone of the RSI . Default 38.2.
- Use TP / Use SL : If you check these, the algorithm will trigger personalized trade exit signals when the price evolution has reached the amounts indicated since the trade entry. Default not Checked.
- % TP - SL : Indicate here the personalized amount in percentage that you want for your Take Profit and Stop Loss of each trade. Default 15-5.
• Settings For Appearances
- Small-size Data Table : If you check this, the data table will become smaller to free up more space on the chart to make it visually more pleasing. Default not checked.
Hide Table /
- Hide Labels / : You can check these to get a cleaner chart and focus only on what interests you in the indicator. Default not checked.
Hide Risk-Reward Areas
█ LIMITATIONS
• ⚠️ We repeat it once again, this strategy is not intended to be reproduced in real conditions, we have designed it for educational and analytical purposes only.
• Even if you see good performances when you backtest the strategy, you must take into account that these results are performed in the past and that in no case does this guarantee that these same performances will be repeated again in the future.
• When you run for real a trading strategy you must be aware of the fact that you are solely responsible for the results that you will be able to obtain and you must be aware of the possibility at all times of partial or even total losses of your invested capital.
• Keep in mind that generating profits in trading is difficult. A strategy can perform very well at one time in the past during a period that is favorable to it, then from one day to the next it can give really bad results for several months or years.
• When backtesting a trading strategy, there are many factors to consider, not just trade entries to which you add a Take Profit and sometimes a Stop Loss. You must at least take into account the size of the position in relation to the capital you want to invest, the trading fees, the slippages (which can be really important depending on the exchange on which you are trading and depending on the asset you are trading), trading frequency, risk management, momentum, volumes and even more.
The information published here on TradingView is not prohibited, doesn't constitute investment advice, and isn't created solely for qualified investors.
═════════════════════════════════════════════════════════════════════════
Important to note : our indicators with the same backtesting system are published in separate publications, because putting them together in a single script would considerably slow down the execution of the script. In addition each indicator, even when it is based on a simple technical indicator, has several options, parameters and entry/exit conditions specific to the underlying technical indicator. Finally, we want to keep the simplicity of use, configuration and understanding of our indicator by not mixing strategies that have nothing to do with each other.

PowerOfStocks_5EMAThis indicator is based of Subhashish Pani's (power of stocks) 5 EMA Strategy.
It plots 5 EMA and Buy/Sell signals with Target & Stoploss levels.
What is Subhashish Pani's (power of stocks) 5 EMA Strategy :-
His strategy is very simple to understand. for intraday use 5 minutes timeframe for selling. You can sell futures, sell call or buy Puts in selling strategy.
What this strategy tries to do is , it tries to catch the tops, so when you sell at top & it turns out to be a reversal point then you can get good profit.
this will hit stop losses often, but stop losses are small and minimum target should be 1:3. but if you stay with the trend you can get big profits.
According to Subhashish Pani this strategy has 60% success rate.
Strategy for Selling (Short future/Call/stock or buy Put)
When ever a Candle closes completely above 5 ema (no part of candle should be touching the 5ema), then that candle should be considered as Alert Candle.
If the next candle is also completely above 5 ema and it has not broken the low of previous alert candle, Then the previous Alert Candle should be ignored and the new candle should be considered as new Alert Candle.
so if this goes on then continue shifting the Alert Candle, but whenever the next candle breaks the low of the Alert Candle we should take the Short trade (Short future/Call/stock or buy Put).
Stoploss will be above high of the Alert Candle and minimum target will be 1:3.
Strategy for Buying (Buy future/Call/stock or sell Put)
When ever a Candle closes completely below 5 ema (no part of candle should be touching the 5ema), then that candle should be considered as Alert Candle.
If the next candle is also completely below 5 ema and it has not broken the high of previous alert candle, Then the previous Alert Candle should be ignored and the new candle should be considered as new Alert Candle.
so if this goes on then continue shifting the Alert Candle, but whenever the next candle breaks the high of the Alert Candle we should take the Long trade (Buy future/Call/stock or sell Put).
Stoploss will be below low of the Alert Candle and minimum target will be 1:3.
Buy/Sell with extra conditions :
it just adds 1 more condition to buying/selling
1. checks if closing of current candle is lower than alert candles closing for Selling & checks if closing of current candle is higher than alert candles closing for Buyling.
This can sometimes save you from false moves but by using this, you can also miss out on big moves as you'll enter trade after candle closing instead of entering at break of high/low.
Note :- According to Subhashish Pani Timeframe for intraday buying should be 15 minutes Timeframe.
If you haven't understood the strategy by reading above description, then search for "Subhashish Pani's (power of stocks) 5 EMA Strategy" on youtube to get a deeper understanding.
Note:- This is not only for Intraday trading , you can use this strategy for Positional/Swing trading as well. If you use this on Monthly Timeframe then it can be very good for Long Term Investing as well.
Rules will be same for all types of trades & Timeframes.
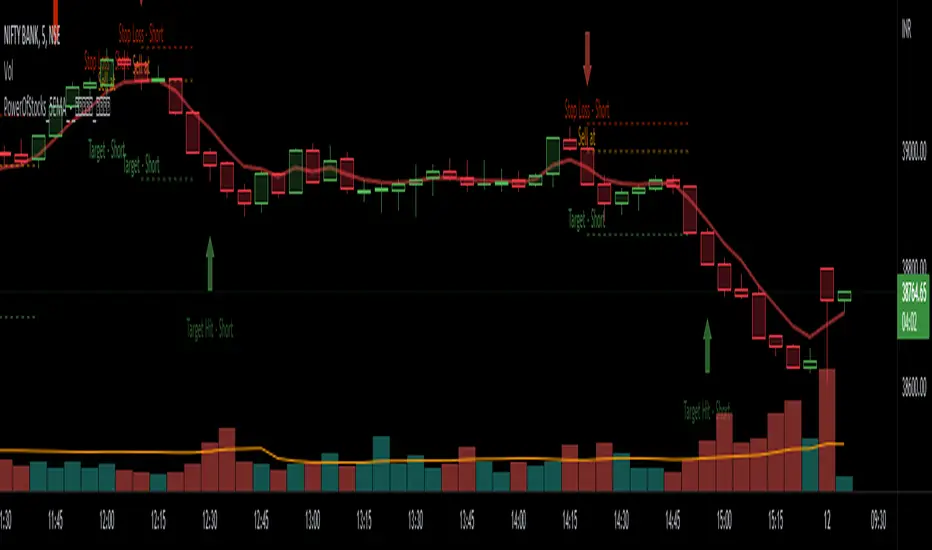
The $trat | by Octopu$1️⃣2️⃣3️⃣ The $trat | by Octopu$
The $trat: The Strat by Octopu$
Absolute Solution for The Strat Traders!
The Strat is a Strategy created by Rob Smith's and is well known by being an innovative trading system.
Continues to grow in popularity as more traders discover this method.
It is a simplified way to understand Price Action. It is based on three principles: Types of candles, 1, 2, and 3.
Other things to be known about The Strat are Actionable Signals and Time Frame Continuity.
The $trat has it all.
This Indicator includes Bar Types (1, 2 and 3) also known as Inside Bars, Twos (Up or Down) and Outside Bars.
It is also well crafted with a built-in Time Frame Continuity (TFC) which shows Price Movement at a glimpse.
On top of that, in the best of both worlds, also comes with information about the Bars Status for other TFs as well.
It means that you can know how another TF of you preference is performing. Right there.
Works in Any Time Frame.
On Any Ticker.
(Using SPY 5m just as an example:)
www.tradingview.com
SPY
Features:
• Candle Types (1, 2 and 3) IB, 2U & 2D and OB.
• Time Frame Continuity (TFC) for Price Movement/Trend Check
• Bar Status shortcut. So you can know Price Action/Direction fast.
• Reversal indicators for Action-taking and Situational Awareness
• Combos Labels. So nothing ever goes unnoticed.
Options:
• Absolutely fully Customizable: Colors, Sizes, Numbers. Everything.
• On/Off Switches for most of the Information and Optionable Selections
• Hammer/Shooter Indicator automatically inserted to Chart
• Candle/Bars Coloring for ease of reading.
• Highlight options for specific setups
Notes:
v1.0
$trat Indicator release
Changes and updates can come in the future for additional functionalities or per requests.
Did you like it? Boost it. Shoot a message! I'd appreciate if you dropped by to say thanks.
- Octopu$
🐙

TARVIS Labs - Alts Macro Bottom/Top SignalsSCRIPT DESCRIPTION
PLEASE READ THROUGH THIS CAREFULLY.
This is a script specifically written to help provide indicators from a macro view for ALTS. This script needs to be run on the 1 day. It helps indicate when to accumulate alts, and when its in a bull run when this a bull run top beginning to form with warnings, and a indicator that a top is in. This is described further below.
NOTE - in order to accomodate most alts the script had to be broad enough in its indicators to cover many different scenarios. If you are trading a smaller altcoin I suggest taking a more conservative approach to accumulation.
FAQs:
1. Why is there no accumulation zone showing up before an uptrend?
This could be because the trend has been so strong for this coin that there hasn't been a strong enough signal to accumulate or this could be that the chart doesnt have enough historical data (needs over 2 years) for the indicators to flash green.
2. Why is there no tops shown for a chart Im looking at?
This is either because there isn't enough historical data (needs over 2 years) for the indicators to build or because the altcoin didnt perform as well as the rest of the market. The altcoin has to perform as well as the market over the length of the bull run in order for the signals to show. Typically an altcoin that shows sharp increases and sharp drops shortly after will not have signals show up.
3. The "Potential End of Bull Run Top Indicator" showed up but we weren't near the top yet, why is that?
The alts indicator has to work across many altcoins, and their trends are not all the same. This can lead to the indicator showing but not necessarily being the exact top. The data from the alts macro bottom/top signals should be paired with the "TARVIS Labs bitcoin macro bottom/top signals" indicator for BTC. The reasoning is because if the top is not showing that its in for Bitcoin its likely that the altcoin's top is also not in. You should use the two in tandem to know if the bull run top is very likely in.
ACCUMULATION ZONE INDICATOR - LIGHT GREEN
Description
When we look at the general crypto landscape, the 200d & 300d EMAs are extremely useful. We can use their cross and momentum in order to determine a bottom forming. If the price has fallen over 40% below the 200 day EMA and the 200 day EMA has crossed below the 300d EMA, its a downtrend with a steep fall, which could indicate a good time to accumulate. When we see the 200 day EMA's slope drop drastically (over 5% w/w) it is also a good signal to accumulate.
Strategy for Usage
For alts, the strategy can vary drastically. You need to take into account:
1. the market cap of the altcoin, is it a smaller market cap altcoin or a larger one?
2. historical trend, does it typically trend strongly with a smaller accumulation zone?
Once you've taken these into account you can form a strategy. For example, if the altcoin has had smaller accumulation zones historically you'll want to take advantage of the accumulation zones when they pop up and be more aggressive (say a 30 day accumulation). If the altcoin has historically had longer accumulation zones then you'll want to be more conservative with your strategy and potentially have a 100 day (or even longer) accumulation period. If the altcoin is a smaller market cap alt, you will want to also take that into account. You'll want to likely be more conservative,
STRONG BUY IN ACCUMULATION ZONE INDICATOR - DARK GREEN
Description
We can add to the bottoming signal by looking for strong downtrends inside the bottoming signal. We do this by seeing when the 36 day EMA has a slope decreasing by 2% day/day.
Strategy for Usage
These strong downtrend days can be used to add more to our accumulation strategy. We can add more on these days (ex. double what you were planning to on a typical accumulation day).
LOCAL TOP NEAR BULL RUN TOP INDICATOR - RED
Description
When the 100 week EMA is in a strong uptrend (4% increase w/w) we can look for significant loss of momentum in order to determine if a local top is in near a bull run top. This strategy uses a MACD with 9/36/9 config for the daily chart. We look for the signals momentum loss, when the slope becomes negative.
Strategy for Usage
Ideally the right strategy to use here is to exit the market when this indicator starts. When the indicator ends if the "Potential End of Bull Run Top Indicator" is not showing on the chart you can buy back into the market.
POTENTIAL END OF BULL RUN TOP INDICATOR - DARK RED
Description
When the 100 week EMA is in a strong uptrend (3% increase w/w), and a MACD config of 108/234/9 has a negative signal slope signifying a very large momentum loss, but the 1d 18 EMA is still above the 1d 63 EMA we show this signal.
Strategy for Usage
This is a strong indicator that the top is in, and it potentially being the bull run top. Because alts can vary strongly in their charts, this should be a strong warning but not necessarily a certainty that the bull run is over.

ATRvsDTR + ADR Zone + SSS50%This Script is to be used for intra day as far as the adr zones. The adr zones are used as support and resistance but also can be used to determine whether the stock is breaking out or not. Also being that the adr zones are calculated using a 5 or 10 day period unless you change the settings, and are set when price opens. It does really help you know whether a stock is moving more than it does on average to me it just signifies its directional. So I added the atr vs dtr so you can see what a stock moves on average versus what it has moved today.
The atr period is calculated based on the daily period unless you change the settings. I added to the original script 3 more percentages the atr vs dtr will change as it goes higher so that you can be aware when the stock is getting closer to moving 100% of its atr. Even though a stock breaks above or below the adr that doesn't mean it has moved more than it normally moves.
I also have the weekly open on the script as I trade the strat and I want to know, at what price the the week will change from bearish to bullish and vice versa. So that I can understand the trend when I am trading intraday.
The 50% lines were added for Sara strat snipers 50% rule and you can change the timeframes on them. This is used to know whether a candle will go 3. This also can help with retracements vs reversals, because in traditional technical analysis 50% is around where people start think its a reversal more so than a retracement.
I believe the script will be very help as it can show you price being directional but can also let you know when the stock is getting close to moving more than it normally has or if it has moved more than it normally has. As well as being able to see if something is a retracement vs a reversal. I trade TheStrat strategy so this can be very helpful in that regard
The 50% retracement levels are default 1h and daily. You can change them and whether or not they show
In the example chart you can see we are below weekly open which is bearish and you can also see where price reverses out of the upper adr zone. As well as how much of the atr we have moved on this day in time.

Signals Pirate™ Buy Sell SignalsSignalsPirate™ Algo Premium includes standard Buy and Sell signals on the chart, All-in-One Premium Market Dashboard with current trades, and a wide variety of customizability to help you create your own, unique trading strategies.
The main Input options are 'Reactivity' and 'Depth', which allow for a dynamic trend following strategy that works on all time frames and assets. Using these values the strategy will print the bundles main ‘Buy’ and ‘Sell’ signals to try and identify the trend early and accurately. Their main functions are to dynamically calculate volatility and current trend direction – but we’ve gone more in-depth below!
Reactivity:
Reactivity controls how quickly the Algo reacts to changes in trend. This part of the bundle takes into account the Average True Range (ATR) to gauge current market volatility and direction of the trend. Lowering the reactivity value will generate quicker reaction times of the algorithm as it will lower the threshold of volatility required for a signal to be generated. Therefore, it’ll show trades more frequently.
Depth:
Depth controls the position of the signals according to the trend swing. Calculated using a variation of the Average Direction Index (ADX) to measure the changes in prices over a given period, when running parallel to the Reactivity volatility filter the trend can be identified quickly and accurately on any given time frame or asset. Higher Depth will allow for less frequent and slower entries. In contrast, lower Depth will give more frequent and earlier entries.
The default settings are the best settings we’ve found so far but you can change them to build your own unique trading strategy. We’d recommend experimenting with these values to find the best results for the asset you are trading, and your own personal trading and investing style.
Direction for use:
1. Use on any asset class and time frame.
2. Fine tune the Reactivity (volatility) and Depth (trend sensitivity).
3. Enter Long on ‘Buy’ signal after candle close, enter Short on ‘Sell’ signal after candle close.
4. Exit position on opposite entry signal, for example if you’re currently in a Long position and a ‘Sell’ signal is printed, close your Long position at the candle close, even if you do not plan on shorting and vice versa.
As mentioned previously, this is a trend base system that dynamically operates to function with superior accuracy regardless of what you’re trading. But with the level of customisation available, this can easily be fine tuned to accommodate scalping, reversal trading, or even long term investing.
The Dashboard shows the most relevant and real-time information within a simple panel on the chart. It includes three sections. The first section shows Volatility, Volume, Current Sentiment. The second section shows Trends from a 1-minute timeframe to a Month. The third section shows current trade with Variable TP 1, TP 2, TP 3 (calculated using a combination of S/R levels and ATR values), and Maximum Profit for the current trade that could have been entered using this bundle.
We hope you love this all in one package, and it takes your trading and investing to the next level. Please let us know if you have any questions or queries regarding the logic behind the bundle, or if you have any suggestions for improvements etc. We love your feedback and are constantly striving to continuously improve!

J-BUY & SELLIntroduction
I have been tracking the technical indicator for a long time. In my experience, I have tried various combinations of the existing indicators in the chart but have not been able to get satisfactory results.
The trend analysis method needs a lot of focus and time. Therefore, rather than speculating the future trend, I focused on building a code which will be continuous in terms of indications and remove the speculation out of the strategy. Hence, allow for automation.
Indicator Strategy
This is a simple, yet powerful indicator primarily based on price action and its relationship with SMAs .
Each candle is compared with the moving averages and the output is shown as a buy and sell signal through Up & Down arrows. Up arrow is a buy indicator and Down arrow is a sell indicator.
However, you might see in some case there is no Buy or Sell signals indication on the candle. No worries, please follow the previous signal in these cases.
How to add the indicator into your chart
1. Click the “Indicators” tab in the Trading view chart Tool Bar.
2. In the “Indicator & Strategies” menu, click on Public Library option.
3. Search for the “J-BUY & SELL” in the search box.
4. Add the indicator by clicking on the result.
How to add Buy & Sell alert
In addition to the indicator, you can also set BUY & SELL alerts for any of the stock/ index/ commodities etc.
1. Hover your mouse cursor over the indicator on the chart.
2. Click on the three dots captioned as “More”
3. Choose the option “Add alert on J-BUY & SELL”
4. You can choose the alert “Buy Bar/ Sell Bar or both as per your requirement by pressing the “Create” button.
Change the Color of the Up & Down arrows
For changing the color of the arrows, please “double click” on the arrow and the color as per your choice.

RSI Bands [APIDEVs]RSI BANDS:
It is an exclusive product of ApiDevs , this indicator selectively integrates a series of highly advanced algorithms that aim to provide the trader with an effective and profitable trading system, based on a series of conditions that project the price direction with a reasonable probability.
This indicator bears the name of “RSI Bands” , this is because we have based this trading system on the “Relative Strength Index (RSI)” , the strength of this indicator is centennial and we at APIDEVs have decided to focus our efforts on the development of powerful tools based on the favorite indicators of the afternoon.
WHAT IT HAS INCORPORATED:
1. Exponential Moving Average (EMAs): The RSI Bands has, by default, a band composed of two moving averages of 10 and 55 exponential periods, which can be modified in the indicator menu.
• Possibility of changing the value of the EMAs.
• Function was enabled to change the color and transparency of the bands.
• Visual alerts SHORT (L) and LONG (L) were added when there is the crossing of the EMAS.
• Hull Moving Average (HMA) of 100 periods was also incorporated, also modifiable for those who wish to strengthen their visual analysis. (Disabled by default)
• We also add an Exponential Moving Average (EMA) of 200 periods to mark the trend. (Disabled by default).
2. A TR (Average True Range): This indicator has two main functions in the RSI Bands, the first is to mark the trend of the asset and the second is to establish a margin of safety in price volatility, that is, a maximum estimate of the setbacks without this representing a change in the direction of the price.
3. RSI (Relative Strength Index): It was visually incorporated into the RSI Bands, the graph is obtained on the right side and its purpose is to visually indicate where the price is with respect to the RSI PRO+ indicator, offering the following improvements :
• ALERT SYSTEM: THE RSI PRO+ has the ADX incorporated into its algorithm, which allows establishing a filter that will provide reliable inputs, represented by the LONG (L) and SHORT (S) signals.
• FILTER AGAINST TREND: The signals described above will be activated according to the crossing of the RSI above the 50 point, provided that the ADX agrees with the market direction.
• Possibility of deactivating this graphical representation.
4. ADX (Average Directional Index): The ADX in this indicator is intended to estimate the strength of the movement, it is present in each part of the code, either to indicate the strength of the market or to serve as a filter against trend. In the same way, we apply certain exclusive improvements for this indicator:
• It was established as default values of the ADX that the Level Range was 10 and the Level Trend 25. This significantly changes the behavior of this indicator, almost completely eliminating the zone of disinterest that was usually considered.
• A function was activated to paint the sails the color of the ADX.
5. ADX Ocillator: Yes, we developed a Wave oscillator type ADX and incorporated it into this strategy. From this indicator, which we recommend using in conjunction with the RSI Bands, we extracted the LONG (L) and SHORT (S) signals. The ADX Oscillator is the improved version of the traditional ADX as it offers the following improvements:
• Its interpretation is much simpler.
• Allows you to set entry and exit signals during the trend change and during the price path.
• It has an integrated alert system.
STRATEGY PANEL:
This panel is an exclusive creation of APIDEVs , and its purpose is to parameterize five conditionals based on the indicators that make up our RSI strategy, giving the trader an immediate vision of the status of the asset analyzed considering this strategy. That is, we decided to transfer our experience of using this indicator on a panel that will project the price trajectory visually. It has the following characteristics:
• It can be placed anywhere on the screen through the main menu of the indicator, it can even be deactivated.
• It can be resized, we designed this to adapt to all types of screens, including those of mobile phones.
• It has an upper panel called "Project" which will calculate the percentage probability that the price has to take a direction based on all the indicators incorporated into the strategy. Their values range from (+ 100%) to (-100%).
STRATEGY PANEL PARAMETERS:
1. EMAs : This panel has 2 variables:
• LONG : If the fast EMA is above the slow EMA.
• SHORT : If the fast EMA is below the slow EMA.
2. RSI : This panel has 3 variables:
• LONG : The RSI should be bullish (green) and above the 50 point.
• SHORT : The RSI should be bearish (red) and be below the 50 point.
• RANK: (Range)this condition is activated when there is no concordance with the RSI condition and its crossing.
3. ATR : This panel has 2 variables:
• LONG : When the price is above the ATR.
• SHORT : When the price is below the ATR.
4. ADX: This panel has 3 variables:
• LONG : The ADX is green. That is, the DI + is above the DI-.
• SHORT : The ADX is red. That is, the DI- is above the DI +.
• RANK : ADX is below point 10.
It also has a numerical value that indicates the value of the ADX and two texts indicating the strength of the trend:
• Trend (bullish or bearish).
• Strong trend (bullish or bearish).
5. OSC : This panel has 3 variables:
• LONG : The oscillator slopes upward and the built-in ADX is green.
• SHORT : The oscillator slopes downward and the built-in ADX is red.
• RANK : The oscillator slopes downward and the built-in ADX is green and the opposite. In short, there is no coherence in the movement of the oscillator and the projection of the ADX.

TradingLatino_StrategySPANISH:
TL_STRATEGY:
El TL_STRATEGY, es todo un ecosistema de indicadores que conforman una estrategia bastante potente y famosa en el trading de criptomonedas, está compuesta por los siguientes indicadores:
• Bandas de medias móviles exponenciales (10 y 55)
• Squeeze Momentum Indicator (SQZMON PRO+).
• Volume Profile (VP Desarrollado por APIDEVs).
• Average Directional Index ( ADX PRO+).
En ApiDev, decidimos optimizar visualmente esta estrategia, es por ello que creamos un panel informativo que muestra la proyección conjunta de todos los indicadores que ya mencionamos.
MEJORAS REALIZADAS EN LA ESTRATEGIA:
Más simple: Simplificamos la interfaz de todos los indicadores [para que el operador pueda seguir el ABC de su estrategia sin mucha complicación.
Señales de compra y venta: Basado en una estrategia que incorpora dos medias móviles de 10 y 55 periodos, la observación de la fuerza del ADX y la direccionalidad de los osciladores del SQZMON, señales de compra y venta para ser valorado por el comerciante.
Panel lateral: Integramos un panel lateral que permite observar la valoración y dirección de todos los indicadores que componen la estrategia.
Tiene un sistema de alerta que enviará notificaciones sobre los cambios que se produzcan en el indicador.
ENGLISH:
TL_STRATEGY:
The TL_STRATEGY , is a whole ecosystem of indicators that make up a quite powerful and famous strategy in cryptocurrency trading, it is composed of the following indicators:
• Exponential moving media bands (10 and 55).
• Squeeze Momentum indicator (SQZMON PRO +).
• Volume profile (VP Developed by APIDEVs).
• Average directional index ( ADX PRO +).
In ApiDev , we decided to visually optimize this strategy, that is why we created an information panel that shows the joint projection of all the indicators that we already mentioned.
IMPROVEMENTS MADE IN THE STRATEGY:
Simpler: We simplified the interface of all indicators [so that the trader can follow the ABCs of his strategy without much complication.
Buy and sell signals: Based on a strategy that incorporates two moving averages of 10 and 55 periods, the observation of the strength of the ADX and the directionality of the oscillators of the SQZMON, signals of buying and selling to be valued by the trader.
Side panel: We integrate a side panel that allows observing the assessment and direction of all the indicators that make up the strategy.
It has an alert system that will send notifications about the changes that occur in the indicator.
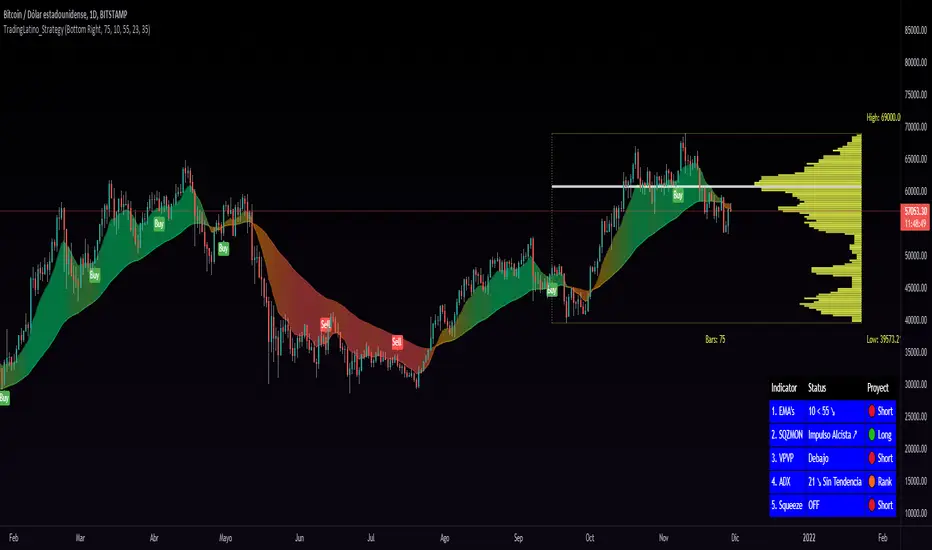
Moses Long-term Index ETF Investing StrategyMoses is a script designed for long-term Index ETF investors.
Moses Goals.
1. Alerts you when a major crash is starting or is underway (Bear Market Signal)
2. Warn you of price events in the market that may lead to increased volatility and downward price pressure (Shock Event Warning)
3. Clearly inform you when the market is in a bull phase (growing) or bear phase (decreasing) (Bull/Bear Signal)
4. Inform you if the market is showing early signs of recovery from a crash
5. Alert you to catastrophic events, which are extreme one bar price drops (typically occurring before or during a major stock market crash)
Moses Logic.
Moses is the product of years of testing, but the application of the logic is simple.
1. Moses is designed specifically to work on a weekly chart (5 days per bar). Do not use the scripts on daily, monthly, or intraday charts
2. Moses Uses 4 Moving Average Indicators
3. Moses uses the position of price and the moving averages to determine the state of the market (Bull/Bear/Recovery)
4. Moses uses price action to determine shock events and catastrophic event warnings
5. The script is hardcoded to start trading in 1997. Why? So that the script's primary goal of avoiding crashes is tested on 3 major crashes, the Dotcom 2000, the Financial Crisis 2008, and the Corona Crash in 2020.
How Moses Works
Being able to exit the market before or during a large market crash enables you to preserve a portion of your equity from decline. Buying back into the market on a Bull Market or Early Recovery Signal enables you to enter the market at a lower price. This goal is achieved during major crashes.
As with all scripts, there are false signals which may incur a losing trade; you can see in the strategy tester results the % of Winning/Losing Trades.
Strategy Setup In Tradingview
Initial Capital $10,000
Order Size 100% of equity (this is because it is a long-term strategy with only one trade in play – you are either long or not invested, using a smaller position size means you cannot meaningfully compare a Moses strategy to a Buy & Hold Strategy)
Commission is $5 per trade (this is negligible because the strategy only trades at most once per year)
Slippage – 10 ticks
This Script Displays the 5 Main MOSES Signals Directly On Your Chart To Help Your Investing Decision Making
1. Bull Market Signal - Green
2. Bear Market Signal - Red
3. Stock Market Recovery Signal - Amber/Yellow
4. Shock Event Warning - Shock Label on Price
5. Catastrophic Event Warning - Red Catastrophe Label
Includes 5 Moses Scripts
• Moses Signals 2.0 (plots all alerts directly on the price chart)
• Moses Buy on Bull - Sell on Bear (Plots a buy on the first Bull Market Signal - Closes All Positions on a Bear Market Signal)
• Moses Buy on Bull - Sell on Catastrophe (Plots a buy on the first Bull Market Signal - Closes All Positions on a Catastrophic event)
• Moses Buy on Recovery - Sell on Catastrophe (Plots a buy on the first Recovery Signal - Closes All Positions on a Catastrophic Event)
• Buy & Hold Script (Used to compare the effectiveness of the strategies versus a Buy and Hold Strategy)
As the script has 3 Moses Strategies, the idea is that you choose the strategy that best fits the ETF you are trading.
Moses is a long-term investing strategy that has historically outperformed the US and European Major Indices for the last 24 years. There is no guarantee of future performance.
Moses has outperformed the market (buy and hold strategy) from 1997 on the:
Nasdaq 100, S&P500, Russell 3000, Nasdaq Composite, EuroStoxx 50, Italian Milano Borsa, German DAX, Paris CAC40
Moses does not outperform the market on:
Nifty 50, BSE Sensex, ASX 200, Chinese Market
Backtested Performance
Test Timeframe Jan 13 1997 - Sept 21 2021
Duration Years 24.75
Initial Investment $10,000
North America Strategy-------------------------------$ Return------------CAGR-------Total %
Nasdaq 100 Buy & Hold----------------------------$176,380-----------12.30%------1664%
Buy Bull - Sell Bear------------------$288,554-----------14.55%------2786%
Buy Bull - Sell Catastrophe---------$202,491-----------12.92%------1925%
Buy Recovery - Sell Catastrophe---$229,866-----------13.50%------2199%
North America Strategy-------------------------------$ Return-----------CAGR------Total %
S&P 500 Buy & Hold----------------------------$58,122-----------7.37%------481%
Buy Bull - Sell Bear------------------$48,544-----------6.59%------385%
Buy Bull - Sell Catastrophe $59,573-----------7.48%------496%
Buy Recovery - Sell Catastrophe $64,579-----------7.83%------546%
North America Strategy-------------------------------$ Return-----------CAGR------Total %
Russell 3000 Buy & Hold----------------------------$61,363-----------7.61%------514%
Buy Bull - Sell Bear------------------$52,957-----------6.97%------430%
Buy Bull - Sell Catastrophe---------$64,027-----------7.79%------540%
Buy Recovery - Sell Catastrophe---$71,565-----------8.28%------616%
North America Strategy-------------------------------$ Return-----------CAGR------Total %
Nasdaq Composite Buy & Hold----------------------------$112,839-----------10.29%------1028%
Buy Bull - Sell Bear------------------$123,308-----------10.68%------1133%
Buy Bull - Sell Catastrophe---------$107,699-----------10.08%------977%
Buy Recovery - Sell Catastrophe---$112,453-----------10.27%------1025%
*CAGR - Compound Annual Growth Rate
From a Declaration of Principles jointly adopted by a Committee of the American Bar Association and a Committee of Publishers
This work is provided to you for informational purposes only and should not be construed as an offer to buy or sell a particular security or a solicitation of offers to buy or sell a particular security. The author may make available certain information related to the potential price movement of particular securities. By reading this report or using the training materials, you acknowledge and agree that any reliance upon the content or data available is at your own sole risk. You are strongly advised to use your own judgment, your own research, and question everything. The information is generic in nature and not targeted to individuals or individual circumstances. The author is an independent investor and is not licensed to give formal Stock advice to the individual, run funds of any type, or accept fees for individual stock advice. The Author accepts no responsibility for loss of money for following any of the lessons or systems created. Trading of securities may not be suitable for all users of this information; if in doubt, seek a professional advisor. All use of this work is at your sole risk.

Price Change Scalping Indicator v1.0 - 3Commas EditionIntroduction
This indicator implements the Price Change Scalping (PCS) strategy specifically for the 3Commas platform. The Input settings have been redesigned to match the same inputs as the 3Commas My Bot Settings page. Only the "Deal Start Condition" section will echo the required PCS-related settings found in the original Price Change Scalping Indicator v1.0 to successfully implement the strategy.
The indicator uses a price rate of change (ROC) momentum calculation to determine the percent change in price between a defined range of bars. The calculated ROC value is then compared to the Upper Threshold and Lower Threshold values to determine if a trade setup is to be activated. If the threshold is crossed, a trade setup will occur based on the indicator settings. Entry, Take Profit, and Stop Loss prices are calculated and displayed on the chart. Once the Entry Price is crossed, a long or short position is created (depending on the direction) and once the Take Profit price is crossed, the position is closed. If the Entry Price is not crossed within a specific number of bars, the trade setup is canceled, and it will proceed to monitor price changes for the next set up.
How is it original and useful?
This indicator is unique in that the strategy version fully supports the TradingView backtester, which will enable you to perform experiments with various settings to evaluate performance using the historical chart data. The study version implements the "Start Deal" and "Close Deal" alerts for you to integrate with 3Comma's "Trading View Custom Signal" start condition. Both script versions will provide the same configuration abilities. The following list is a brief description of its usefulness:
Full support for all possible 3Commas bot settings.
Define a short or long trading strategy.
Price change data source and offset settings.
Your layering placement relative to the entry price.
Your trading parameters like take profit and stop loss offsets, trailing take profit support, exchange commission rates, trading start time, and order size multiplication for each layer.
Flexible trade eligibility rules that can use other chart indicators, like RSI or EMA, to exclude the selection of entry prices for trading.
The visibility of detailed statistics from the chart history pertaining to trading sessions started and closed, session durations, win rate, price action drops and bounces, as well as layer utilization.
The visibility of detailed Used Amount for Each Step table that details how each layer will be allocated for trading.
How does it compare to other scripts in the Public Library?
The indicator offers a very detailed, comprehensive settings to address all types of markets found on TradingView where you can implement the price change scalping strategy. The strategy version can be considered the first of its kind on TradingView to leverage the backtester to provide informative, detailed performance measurements surrounding this unique trading strategy. The study version will implement the latest alert framework called "Any Alert() Function" where you can create a single alert to handle multiple events, which include:
Deal Start
Deal Close
Strategy Results
The default settings are designed to define a "loose" price change settings to ensure that the indicator will render chart elements when first loaded as well as to allow the backtester to gather order executions and display performance summary. The strategy version is using $10,000 initial capital, a commission rate of 0.1% for both entries and exits, and a 1 tick slippage setting. It is also using 3.4881% of the equity for the Base Order Size, 4.7097% of equity for the first Safety Order Size. The Maximum Safety Trade Count is 7 with a Safety Order Volume Scale of 1.33, and a take profit of 2% with no stop loss. All other settings are defaults.
It is recommended that the indicator be "tuned" for your specific market to best implement the price change strategy and obtain better desirable results. You do so by scrolling through the chart's history and observing moments when prices tend to move rapidly. Measure the number or bars it typically takes for the price to change at a specific rate. Using this information, you can adjust the Price Change Settings accordingly to configure the indicator for the chart.
Always keep in mind that past performance may not be indicative of future results. Settings that seem favorable for one market may be found to be disastrous in another. Therefore, do take the time needed to understand how the settings will behave with the given chart symbol.
Enjoy! 😊👍
How to obtain access to the script?
You have two choices:
Use the "Website" link below to obtain access to this indicator, or
Send us a private message (PM) in TradingView itself.

Price Change Scalping Indicator v1.0Introduction
This indicator uses a price rate of change (ROC) momentum calculation to determine the percent change in price between a defined range of bars. The calculated ROC value is then compared to the Upper Threshold and Lower Threshold values to determine if a trade setup is to be activated. If the threshold is crossed, a trade setup will occur based on the indicator settings. Entry, Take Profit, and Stop Loss prices are calculated and displayed on the chart. Once the Entry Price is crossed, a long or short position is created (depending on the direction) and once the Take Profit price is crossed, the position is closed. If the Entry Price is not crossed within a specific number of bars, the trade setup is canceled, and it will proceed to monitor price changes for the next set up.
How is it original and useful?
This indicator is unique in that the strategy version fully supports the TradingView backtester, which will enable you to perform experiments with various settings to evaluate performance using the historical chart data. The study version implements numerous custom alerts for you to build TradingView notifications around specific price action events and stay informed with market activity in real-time. Both script versions will provide the same configuration abilities where you can define:
Define a short or long trading strategy.
Price change data source and offset settings.
Your layering placement relative to the entry price.
Your trading parameters like take profit and stop loss offsets, exchange commission rates, trading start time, and order size multiplication for each layer.
Flexible trade eligibility rules that can use other chart indicators, like RSI or EMA, to exclude the selection of entry prices for trading.
The visibility of detailed statistics from the chart history pertaining to trading sessions started and closed, session durations, win rate, price action drops and bounces, as well as layer utilization.
How does it compare to other scripts in the Public Library?
The indicator offers a very detailed, comprehensive settings to address all types of markets found on TradingView where you can implement the price change scalping strategy. The strategy version can be considered the first of its kind on TradingView to leverage the backtester to provide informative, detailed performance measurements surrounding this unique trading strategy. The study version will contain numerous custom alerts to aid in your notification preferences and stay informed on the indicator's activities:
Price Crossed Above Threshold
Price Crossed Below Threshold
Enter Long Position
Exit Long Position
Enter Short Position
Exit Short Position
Price Crossed DCA Layer 1 (Long)
Price Crossed DCA Layer 2 (Long)
Price Crossed DCA Layer 3 (Long)
Price Crossed DCA Layer 4 (Long)
Price Crossed DCA Layer 5 (Long)
Price Crossed DCA Layer 6 (Long)
Price Crossed DCA Layer 7 (Long)
Price Crossed DCA Layer 8 (Long)
Price Crossed DCA Layer 1 (Short)
Price Crossed DCA Layer 2 (Short)
Price Crossed DCA Layer 3 (Short)
Price Crossed DCA Layer 4 (Short)
Price Crossed DCA Layer 5 (Short)
Price Crossed DCA Layer 6 (Short)
Price Crossed DCA Layer 7 (Short)
Price Crossed DCA Layer 8 (Short)
Strategy Results
The default settings are designed to define a "loose" price change settings to ensure that the indicator will render chart elements when first loaded as well as to allow the backtester to gather order executions and display performance summary. The strategy version is using $10,000 initial capital, a commission rate of 0.1% for both entries and exits, and a 1 tick slippage setting. It is also using 2.74506% of the equity with a Order Size Multiplier of 1.33, using 8 total DCA layers, and a take profit of 2% with no stop loss. All other settings are defaults.
It is recommended that the indicator be "tuned" for your specific market in order to best implement the price change strategy and obtain better desirable results. You do so by scrolling through the chart's history and observing moments when prices tend to move rapidly. Measure the number or bars it typcially takes for the price to change at a specific rate. Using this information, you can adjust the Price Change Settings accordingly to configure the indicator for the chart.
Always keep in mind that past performance may not be indicative of future results. Settings that seem favorable for one market may be found to be disastrous in another. Therefore, do take the time needed to understand how the settings will behave with the given chart symbol.
Enjoy! 😊👍
How to obtain access to the script?
You have two choices:
Use the "Website" link below to obtain access to this indicator, or
Send us a private message (PM) in TradingView itself.
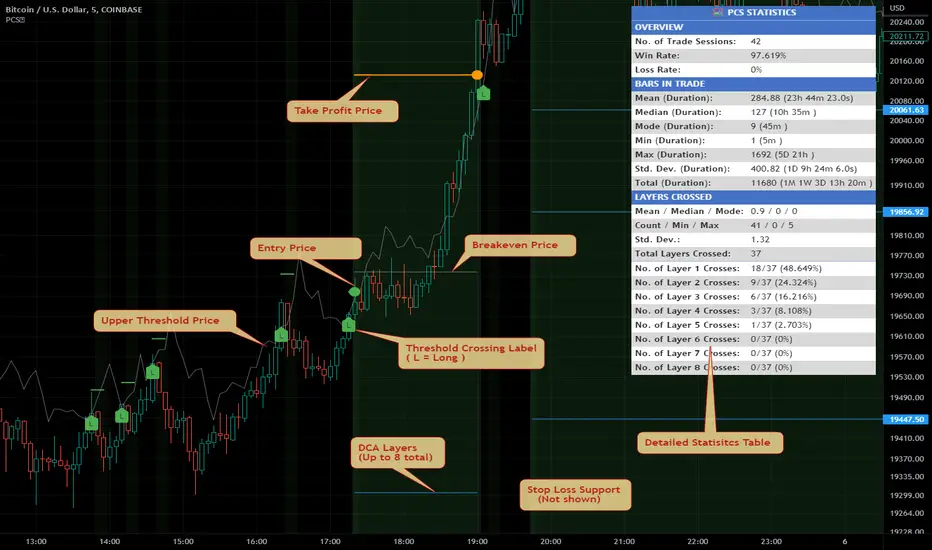
Quickfingers Lucs Base Breaking Indicator v2.5 - 3Commas EditionIntroduction
The indicator attempts to implement a popular price action strategy by Luc Thomas (a.k.a. Quickfingers Luc) typically referred to as a QFL base-breaking strategy specifically for the 3Commas platform. The Input settings have been redesigned to match the same inputs as the 3Commas My Bot Settings page. Only the "Deal Start Condition" section will echo the required QFL-related settings found in the original Quickfingers Luc's Base Breaking Indicator v2.5 to successfully implement the strategy.
The strategy revolves around price action movements that reveal “bases”, which are price levels of support that have a significant, rapid price surges called “bounces”. Once a base is revealed, the base price level is used as reference to implement multiple entries below the base using a layering technique of dollar-cost averaging to place multiple limit orders at various price levels below the base price. As price action breaks below the base price, the limit orders will be filled, and the take profit, breakeven and stop loss prices will be recalculated.
How is it original and useful?
This indicator is unique in that the strategy version fully supports the TradingView backtester, which will enable you to perform experiments with various settings to evaluate performance using the historical chart data. The study version implements the "Start Deal" and "Close Deal" alerts for you to integrate with 3Comma's "Trading View Custom Signal" start condition. Both script versions will provide the same configuration abilities. The following list is a brief description of its usefulness:
The ability to define the QFL base confirmation settings, including volume analysis.
The ability to define your preferred layering strategy of either dollar-cost averaging (DCA) or grid-like layers along with precise layer placement.
The ability to define your trading parameters like take profit and stop loss offsets, exchange commission rates, trading start time, and position size multiplication for each layer.
The ability to define flexible trade eligibility rules that can use other chart indicators, like RSI or EMA, to exclude the selection of base prices for trading.
The ability to set the visibility & color theme of the detailed statistics from the chart history pertaining to trading sessions started and closed, session durations, win rate, price action drops and bounces, as well as layer utilization.
How does it compare to other scripts in the Public Library?
The indicator offers a very detailed, comprehensive settings to implement the QFL base-breaking strategy ion 3Commas. The strategy version leverages the full features of the TradingView backtester to provide informative, detailed performance measurements surrounding this unique trading strategy. The study version will implement the latest alert framework called "Any Alert() Function" where you can create a single alert to handle multiple events, which include:
Deal Start
Deal Close
What does it do and how does it do it?
The strategy can be applied to any chart at any time frame, but the minimum should be no lower than 10 minutes. When applied to the chart for the first time, the default settings will work to render base price levels in orange and 8 DCA layers in thin blue lines. As you scroll through the chart's history you should see price action crossing the DCA layers, denoted with blue triangles, and a green take-profit line will render with green triangle denoting the crossing. Lastly, when a deal session begins upon the crossing of the first layer, the indicator will continue to identify base price levels, but the color of the price lines will be gray. When the trade session concludes upon the crossing of the take profit line, the indicator will switch the most recent base price line from gray to orange to make it active and eligible for trading.
As price action develops, the indicator will use the "Base Confirmation Settings" to look back by counting the number of bars to the left and right of a pivot low point, measure the price drops and bounces, and volume amounts to validate that they are within the specified values. If so, the indicator will draw an orange triangle beneath the candle bar to denote it as the pivot low point and begin rendering the orange line as the base price. The DCA layers will be calculated and offset relative to the base price using thin blue lines.
Optionally, the breakeven price line will be drawn to help visualize the true breakeven price which takes into consideration the exchange fees being applied. Base line, take profit, stop loss and DCA layer crossings will be denoted with colorful shapes to help visually recognize the events on the chart.
The volume is validated only at the pivot low candle. It will measure the volume against the moving average to determine base confirmation. A volume factor of 1 will mean that the volume must be at least the same value as the moving average value. A volume factor of 2 means it must be twice the moving average value.
Lastly, a table of statistics is positioned to the upper-right corner of the chart that summarize all the events that have taken place since the indicator began simulating deal sessions from the chart's history.
Strategy Results
The default settings are designed to define a "weak" QFL base to ensure that the indicator will render chart elements when first loaded as well as to allow the backtester to gather order executions and display performance summary. The strategy version is using $10,000 initial capital, a commission rate of 0.1% for both entries and exits, and a 1 tick slippage setting. It is also using 3.4881% of the equity for the Base Order Size, 4.7097% of equity for the first Safety Order Size. The Maximum Safety Trade Count is 7 with a Safety Order Volume Scale of 1.35, and a take profit of 5% with no stop loss. All other settings are defaults.
It is recommended that the indicator be "tuned" for your specific market in order to best implement the QFL trading strategy and obtain better desirable results. You do so by using the statistics table and observe the Mean Price Drop and Bounce values to learn what the indicator is detecting when it measures from the pivot low points. Using this information, you can adjust the Base Confirmation Settings accordingly, along with any volume specifications you require, to configure the indicator for the chart.
Always keep in mind that past performance may not be indicative of future results. Settings that seem favorable for one market may be found to be disastrous in another. Therefore, do take the time needed to understand how the settings will behave with the given chart symbol.
Enjoy! 😊👍
How to obtain access to the script?
You have two choices:
Use the "Website" link below to obtain access to this indicator, or
Send us a private message (PM) in TradingView itself.