MetaFOX DCA (ASAP-RSI-BB%B-TV)Welcome To ' MetaFOX DCA (ASAP-RSI-BB%B-TV) ' Indicator.
This is not a Buy/Sell signals indicator, this is an indicator to help you create your own strategy using a variety of technical analyzing options within the indicator settings with the ability to do DCA (Dollar Cost Average) with up to 100 safety orders.
It is important when backtesting to get a real results, but this is impossible, especially when the time frame is large, because we don't know the real price action inside each candle, as we don't know whether the price reached the high or low first. but what I can say is that I present to you a backtest results in the worst possible case, meaning that if the same chart is repeated during the next period and you traded for the same period and with the same settings, the real results will be either identical to the results in the indicator or better (not worst). There will be no other factors except the slippage in the price when executing orders in the real trading, So I created a feature for that to increase the accuracy rate of the results. For more information, read this description.
Below I will explain all the properties and settings of the indicator:
A) 'Buy Strategies' Section: Your choices of strategies to Start a new trade: (All the conditions works as (And) not (OR), You have to choose one at least and you can choose more than one).
- 'ASAP (New Candle)': Start a trade as soon as possible at the opening of a new candle after exiting the previous trade.
- 'RSI': Using RSI as a technical analysis condition to start a trade.
- 'BB %B': Using BB %B as a technical analysis condition to start a trade.
- 'TV': Using tradingview crypto screener as a technical analysis condition to start a trade.
B) 'Exit Strategies' Section: Your choices of strategies to Exit the trades: (All the conditions works as (And) not (OR), You can choose more than one, But if you don't want to use any of them you have to activate the 'Use TP:' at least).
- 'ASAP (New Candle)': Exit a trade as soon as possible at the opening of a new candle after opening the previous trade.
- 'RSI': Using RSI as a technical analysis condition to exit a trade.
- 'BB %B': Using BB %B as a technical analysis condition to exit a trade.
- 'TV': Using tradingview crypto screener as a technical analysis condition to exit a trade.
C) 'Main Settings' Section:
- 'Trading Fees %': The Exchange trading fees in percentage (trading Commission).
- 'Entry Price Slippage %': Since real trading differs from backtest calculations, while in backtest results are calculated based on the open price of the candle, but in real trading there is a slippage from the open price of the candle resulting from the supply and demand in the real time trading, so this feature is to determine the slippage Which you think it is appropriate, then the entry prices of the trades will calculated higher than the open price of the start candle by the percentage of slippage that you set. If you don't want to calculate any slippage, just set it to zero, but I don't recommend that if you want the most realistic results.
Note: If (open price + slippage) is higher than the high of the candle then don't worry, I've kept this in consideration.
- 'Use SL': Activate to use stop loss percentage.
- 'SL %': Stop loss percentage.
- 'SL settings options box':
'SL From Base Price': Calculate the SL from the base order price (from the trade first entry price).
'SL From Avg. Price': Calculate the SL from the average price in case you use safety orders.
'SL From Last SO.': Calculate the SL from the last (lowest) safety order deviation.
ex: If you choose 'SL From Avg. Price' and SL% is 5, then the SL will be lower than the average price by 5% (in this case your SL will be dynamic until the price reaches all the safety orders unlike the other two SL options).
Note: This indicator programmed to be compatible with '3COMMAS' platform, but I added more options that came to my mind.
'3COMMAS' DCA bots uses 'SL From Base Price'.
- 'Use TP': Activate to use take profit percentage.
- 'TP %': Take profit percentage.
- 'Pure TP,SL': This feature was created due to the differences in the method of calculations between API tools trading platforms:
If the feature is not activated and (for example) the TP is 5%, this means that the price must move upward by only 5%, but you will not achieve a net profit of 5% due to the trading fees. but If the feature is activated, this means that you will get a net profit of 5%, and this means that the price must move upward by (5% for the TP + the equivalent of trading fees). The same idea is applied to the SL.
Note: '3COMMAS' DCA bots uses activated 'Pure TP,SL'.
- 'SO. Price Deviation %': Determines the decline percentage for the first safety order from the trade start entry price.
- 'SO. Step Scale': Determines the deviation multiplier for the safety orders.
Note: I'm using the same method of calculations for SO. (safety orders) levels that '3COMMAS' platform is using. If there is any difference between the '3COMMAS' calculations and the platform that you are using, please let me know.
'3COMMAS' DCA bots minimum 'SO. Price Deviation %' is (0.21)
'3COMMAS' DCA bots minimum 'SO. Step Scale' is (0.1)
- 'SO. Volume Scale': Determines the base order size multiplier for the safety orders sizes.
ex: If you used 10$ to buy at the trade start (base order size) and your 'SO. Volume Scale' is 2, then the 1st SO. size will be 20, the 2nd SO. size will be 40 and so on.
- 'SO. Count': Determines the number of safety orders that you want. If you want to trade without safety orders set it to zero.
'3COMMAS' DCA bots minimum 'SO. Volume Scale' is (0.1)
- 'Exchange Min. Size': The exchange minimum size per trade, It's important to prevent you from setting the base order Size less than the exchange limit. It's also important for the backtest results calculations.
ex: If you setup your strategy settings and it led to a loss to the point that you can't trade any more due to insufficient funds and your base order size share from the strategy becomes less than the exchange minimum trade size, then the indicator will show you a warning and will show you the point where you stopped the trading (It works in compatible with the initial capital). I recommend to set it a little bit higher than the real exchange minimum trade size especially if you trade without safety orders to not stuck in the trade if you hit the stop loss
- 'BO. Size': The base order size (funds you use at the trade entry).
- 'Initial Capital': The total funds allocated for trading using your strategy settings, It can be more than what is required in the strategy to cover the deficit in case of a loss, but it should not exceed the funds that you actually have for trading using this strategy settings, It's important to prevent you from setting up a strategy which requires funds more than what you have. It's also has other important benefits (refer to 'Exchange Min. Size' for more information).
- 'Accumulative Results': This feature is also called re-invest profits & risk reduction. If it's not activated then you will use the same funds size in each new trade whether you are in profit or loss till the (initial capitals + net results) turns insufficient. If it's activated then you will reuse your profits and losses in each new trade.
ex: The feature is active and your first trade ended with a net profit of 1000$, the next trade will add the 1000$ to the trade funds size and it will be distributed as a percentage to the BO. & SO.s according to your strategy settings. The same idea in case of a loss, the trade funds size will be reduced.
D) 'RSI Strategy' Section:
- 'Buy': RSI technical condition to start a trade. Has no effect if you don't choose 'RSI' option in 'Buy Strategies'.
- 'Exit': RSI technical condition to exit a trade. Has no effect if you don't choose 'RSI' option in 'Exit Strategies'.
E) 'TV Strategy' Section:
- 'Buy': TradingView Crypto Screener technical condition to start a trade. Has no effect if you don't choose 'TV' option in 'Buy Strategies'.
- 'Exit': TradingView Crypto Screener technical condition to exit a trade. Has no effect if you don't choose 'TV' option in 'Exit Strategies'.
F) 'BB %B Strategy' Section:
- 'Buy': BB %B technical condition to start a trade. Has no effect if you don't choose 'BB %B' option in 'Buy Strategies'.
- 'Exit': BB %B technical condition to exit a trade. Has no effect if you don't choose 'BB %B' option in 'Exit Strategies'.
G) 'Plot' Section:
- 'Signals': Plots buy and exit signals.
- 'BO': Plots the trade entry price (base order price).
- 'AVG': Plots the trade average price.
- 'AVG options box': Your choice to plot the trade average price type:
'Avg. With Fees': The trade average price including the trading fees, If you exit the trade at this price the trade net profit will be 0.00
'Avg. Without Fees': The trade average price but not including the trading fees, If you exit the trade at this price the trade net profit will be a loss equivalent to the trading fees.
- 'TP': Plots the trade take profit price.
- 'SL': Plots the trade stop loss price.
- 'Last SO': Plots the trade last safety order that the price reached.
- 'Exit Price': Plots a mark on the trade exit price, It plots in 3 colors as below:
Red (Default): Trade exit at a loss.
Green (Default): Trade exit at a profit.
Yellow (Default): Trade exit at a profit but this is a special case where we have to calculate the profits before reaching the safety orders (if any) on that candle (compatible with the idea of getting strategy results at the worst case).
- 'Result Table': Plots your strategy result table. The net profit percentage shown is a percentage of the 'initial capital'.
- 'TA Values': Plots your used strategies Technical analysis values. (Green cells means valid condition).
- 'Help Table': Plots a table to help you discover 100 safety orders with its deviations and the total funds needed for your strategy settings. Deviations shown in red is impossible to use because its price is <= 0.00
- 'Portfolio Chart': Plots your Portfolio status during the entire trading period in addition to the highest and lowest level reached. It's important when evaluating any strategy not only to look at the final result, but also to look at the change in results over the entire trading period. Perhaps the results were worryingly negative at some point before they rose again and made a profit. This feature helps you to see the whole picture.
- 'Welcome Message': Plots a welcome message and showing you the idea behind this indicator.
- 'Green Net Profit %': It plots the 'Net Profit %' in the result table in green color if the result is equal to or above the value that you entered.
- 'Green Win Rate %': It plots the 'Win Rate %' in the result table in green color if the result is equal to or above the value that you entered.
- 'User Notes Area': An empty text area, Feel free to use this area to write your notes so you don't forget them.
The indicator will take care of you. In some cases, warning messages will appear for you. Read them carefully, as they mean that you have done an illogical error in the indicator settings. Also, the indicator will sometimes stop working for the same reason mentioned above. If that happens then click on the red (!) next to the indicator name and read the message to find out what illogical error you have done.
Please enjoy the indicator and let me know your thoughts in the comments below.
Cari skrip untuk "the strat"

M Farm Scalper v4"M Farm Scalper v2" Trading Indicator on TradingView
Overview
This script uses a combination of indicators to help attempt the best view of when to exit and enter markets. The author has seen that usage of multiple indicators combined provided value and create profit.
1. Improved Signal Reliability
Combining swing highs and lows with Swing Failure Patterns (SFP) increases the reliability of the signals. Each indicator contributes different insights into market behavior:
Swing Highs and Lows: These help identify key support and resistance levels.
Swing Failure Patterns: These provide early warning signs of potential trend reversals when price fails to maintain new highs or lows.
2. Comprehensive Market Analysis
Using multiple indicators allows for a more comprehensive analysis of market conditions:
Trend Analysis: Swing highs and lows can indicate the overall trend direction.
Reversal Signals: SFPs highlight potential reversal points where the current trend might be weakening.
3. Enhanced Signal Strength
The script not only detects basic SFPs but also evaluates their strength by considering the number of failures within a specified range:
Strength of SFPs: By quantifying the strength of SFPs, the script can distinguish between weak and strong reversal signals. This helps traders prioritize stronger signals, reducing false positives.
4. Visual and Alert-based Trading
The combined use of these indicators improves both visual analysis and automated alert systems:
Visual Representation: Plotting different characters for swing points and SFPs makes it easier for traders to quickly interpret the chart.
Alerts: Automated alerts for specific conditions (like swing high/low failures) enable traders to respond promptly to significant market movements without constantly monitoring the charts.
5. Flexibility and Customization
The script includes parameters that allow traders to customize the behavior of the indicators based on their trading preferences:
Customization of Lookback Period (swingHistory): Traders can adjust this to fine-tune the sensitivity of swing point detection.
Selective Plotting (plotSwings, plotFirstSFPOnly, plotStrongerSFPs): These options provide flexibility in how much information is displayed on the chart, preventing clutter and focusing on relevant signals.
6. Minimized Noise and False Signals
By using a combination of indicators, the strategy aims to filter out market noise and reduce the likelihood of false signals:
Confluence of Signals: When multiple indicators align to provide a signal, it generally indicates a higher probability setup, thus reducing the chances of acting on false or less significant market moves.
7. Contextual Market Understanding
Combining indicators offers a more contextual understanding of market dynamics:
Market Context: Identifying both support/resistance levels (via swing points) and potential trend reversals (via SFPs) provides a fuller picture of market conditions, allowing traders to make more informed decisions.
Conclusion
Combining multiple indicators in the "M Farm Scalper v2" script is a strategic choice designed to enhance the robustness, reliability, and actionable quality of the trading signals. This approach leverages the strengths of each indicator to provide a well-rounded, comprehensive trading tool that aids traders in identifying high-probability trade setups and minimizing the risk of false signals.
ChatGPT can make mistakes. Check important info.
Introducing "M Farm Scalper v2" – an advanced proprietary trading indicator designed exclusively for the TradingView platform. This tool excels in identifying key swing points and Swing Failure Patterns (SFPs), offering traders unique visual and auditory cues to enhance decision-making. It's particularly tailored for the 5-minute timeframe but adaptable to suit a variety of trading styles.
Unique Features
Advanced Swing Point Detection: Leverages a sophisticated algorithm to detect swing highs and lows, integrating predictive analytics to forecast potential market reversals.
Dynamic Swing Failure Pattern Analysis: Employs a real-time analysis combining price action and volume data to pinpoint bullish and bearish reversal opportunities with high precision.
Innovative Visual and Auditory Cues: Features unique, easy-to-understand icons such as animals and fruits to represent market signals, simplifying complex market data into actionable insights.
Functionality
"M Farm Scalper v2" is crafted to deliver:
Configurable Parameters: Users can adjust settings including Swing History, visibility of swing points, and sensitivity for detecting stronger SFPs, making it highly customizable to fit individual trading strategies.
Clear, Actionable Outputs: Designed to offer straightforward visual signals directly on the trading chart, facilitating quick and effective decision-making.
Compliance and Originality
Original Integration of Features: This script combines several analytical techniques into a cohesive unit that surpasses the capabilities of existing open-source scripts in both originality and functionality.
Justification for Closed-Source: The proprietary nature of the algorithms and the unique method of data presentation are maintained as closed-source to protect the integrity and effectiveness of the tool, providing users with a reliable competitive advantage.
Application Instructions
To apply "M Farm Scalper v2," add it from the TradingView "Indicators" menu by searching for our script. Adjust the customizable settings as per your trading requirements and observe how the indicator’s outputs make market dynamics easy to interpret and act upon.
Chart Presentation
The accompanying chart is presented cleanly, focusing solely on the outputs of "M Farm Scalper v2." Each visual cue is annotated to demonstrate its relevance, ensuring that traders can easily understand and utilize the information provided without distraction.
Conclusion
"M Farm Scalper v2" is not just an indicator but an essential trading tool for those seeking precision and efficiency in their trading operations. Its advanced features and user-friendly design make it a valuable addition to any trader’s arsenal, especially for those involved in scalping and short-term trading.
Protected script
This script is published closed-source but you may use it freely. You can favorite it to use it on a chart. You cannot view or modify its source code.
Disclaimer
The information and publications are not meant to be, and do not constitute, financial, investment, trading, or other types of advice or recommendations supplied or endorsed by TradingView. Read more in the Terms of Use.

EMA Scalping StrategyEMA Slope Indicator Overview:
The indicator plots two exponential moving averages (EMAs) on the chart: a 9-period EMA and a 15-period EMA.
It visually represents the EMAs on the chart and highlights instances where the slope of each EMA exceeds a certain threshold (approximately 30 degrees).
Scalping Strategy:
Using the EMA Slope Indicator on a 5-minute timeframe for scalping can be effective, but it requires adjustments to account for the shorter time horizon.
Trend Identification: Look for instances where the 9-period EMA is above the 15-period EMA. This indicates an uptrend. Conversely, if the 9-period EMA is below the 15-period EMA, it suggests a downtrend.
Slope Analysis: Pay attention to the slope of each EMA. When the slope of both EMAs is steep (exceeds 30 degrees), it signals a strong trend. This can be a favorable condition for scalping as it suggests potential momentum.
Entry Points:
For Long (Buy) Positions: Consider entering a long position when both EMAs are sloping upwards strongly (exceeding 30 degrees) and the 9-period EMA is above the 15-period EMA. Look for entry points when price retraces to the EMAs or when there's a bullish candlestick pattern.
For Short (Sell) Positions: Look for opportunities to enter short positions when both EMAs are sloping downwards strongly (exceeding -30 degrees) and the 9-period EMA is below the 15-period EMA. Similar to long positions, consider entering on retracements or bearish candlestick patterns.
Exit Strategy: Use tight stop-loss orders to manage risk, and aim for small, quick profits. Since scalping involves short-term trading, consider exiting positions when the momentum starts to weaken or when the price reaches a predetermined profit target.
Risk Management:
Scalping involves high-frequency trading with smaller profit targets, so it's crucial to implement strict risk management practices. This includes setting stop-loss orders to limit potential losses and not risking more than a small percentage of your trading capital on each trade.
Backtesting and Optimization:
Before implementing the strategy in live trading, backtest it on historical data to assess its performance under various market conditions. You may also consider optimizing the strategy parameters (e.g., EMA lengths) to maximize its effectiveness.
Continuous Monitoring:
Keep a close eye on market conditions and adjust your strategy accordingly. Market dynamics can change rapidly, so adaptability is key to successful scalping.

Previous Day High Low Close By Anil ChawraHow Users Can Make Profit Using This Script:
1. Calculate the difference between the previous day's high and low prices to determine the price range.
2. Identify if today's close price is significantly higher or lower than the previous day's close price.
3. If today's close price is at least 10 points higher than the previous close, consider a potential buy signal.
4. If today's close price is at least 10 points lower than the previous close, consider a potential sell signal.
5. These signals indicate potential profit opportunities based on significant price movements.
6. Users should verify market conditions and perform additional analysis before executing trades.
7. Monitoring price action and volume can help confirm the validity of these signals.
8. Implementing stop-loss orders can help mitigate risks associated with trading based on price movements.
9. Regularly reviewing and adjusting trading strategies based on market conditions is essential for long-term success.
10. Exercise caution and discipline when trading, and consider seeking advice from financial professionals if needed.
How the Script Works:
1. The strategy analyzes the high, low, and close prices of the previous trading day.
2. It calculates the range of prices by subtracting the low from the high.
3. The close price of the current trading day is compared to the previous day's close.
4. If today's close is significantly higher than yesterday's close, it could indicate bullish sentiment.
5. Conversely, if today's close is significantly lower, it could suggest bearish sentiment.
6. A threshold, typically 10 points, is set to identify significant price movements.
7. If today's close is at least 10 points higher, it triggers a potential buy signal.
8. If it's at least 10 points lower, it triggers a potential sell signal.
9. Users can act on these signals to enter or exit trades for potential profit.
10. Regular monitoring, risk management, and market analysis are essential for effective implementation of this strategy.

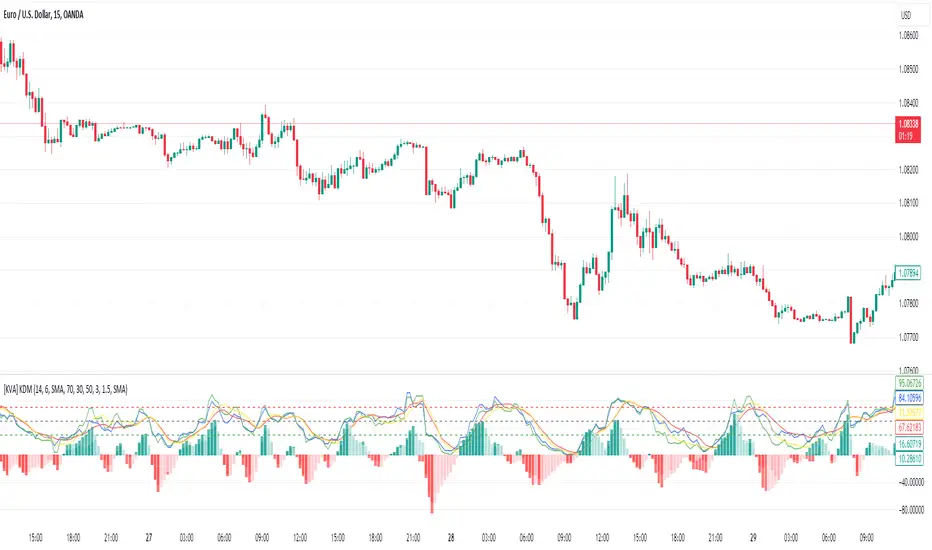
[KVA] Kamvia Directional MovementKamvia Directional Movement (KDM) Indicator is an analytical tool designed to identify potential buying and selling opportunities in the market. It highlights the phases of price depletion which typically align with price highs and lows, offering a nuanced understanding of market dynamics.
Efficient at pinpointing trend breakdowns and excelling in the identification of intra-day entry and exit points, the Kamvia Directional Movement Indicator is a valuable asset for traders aiming to optimize their market strategies.
The KDM not only takes into account the traditional high and low price points within its analysis but also introduces an innovative approach by incorporating the concepts of body high and body low. This nuanced analysis offers a deeper insight into market momentum and potential shifts in market dynamics.
High and Low Analysis : The indicator examines the price highs and lows to gauge the overall market volatility and potential turning points. By analyzing these extremities, traders can get a sense of market strength and possible shifts in trend direction. The high points indicate periods of maximum buying interest, potentially signaling overbought conditions, while the low points reflect selling interest, hinting at oversold conditions.
Body High and Body Low Analysis : Unique to the KDM Indicator is the emphasis on the body of the candlestick, which is the range between the open and close prices. This analysis offers a more refined view of market sentiment by focusing on the actual trading range experienced within the period. The body high (the upper end of the candlestick body) and body low (the lower end of the candlestick body) provide insights into the buying and selling pressure during the trading session, beyond mere price extremities.
The indicator is calibrated on a scale from 0 to 100, making interpretation intuitive and straightforward. A reading above 70 is considered to be in the overbought region, suggesting that the market might be experiencing a heightened level of buying activity that could lead to a potential pullback or reversal. Conversely, a reading below 30 falls into the oversold region, indicating a possible exhaustion in selling pressure and a potential for market reversal or bounce back.
This scale and the detailed analysis of both price and body dynamics equip traders with a comprehensive tool for assessing market conditions. The distinction between high/low and body high/body low analysis enriches the indicator's capability to provide more targeted insights into market behavior, enabling traders to make more nuanced decisions based on a broader spectrum of information. By identifying the duration and extent to which these conditions persist, traders can better interpret the market's momentum and align their strategies with the prevailing trend or prepare for an impending reversal.
KDM Strategy
The strategy focuses on spotting price reversals within a confirmed trend. While the indicator features regions indicating overbought and oversold conditions, these signals alone are not sufficient predictors of a market reversal.
The terms "overbought" and "oversold" describe scenarios where prices reach levels that are unusually high or low within a specified look-back period. Entering these zones often indicates a continuation of the trend rather than a reversal.
A "strongly overbought" condition signals buying pressure, whereas a "strongly oversold" condition indicates selling pressure. The key to leveraging these conditions lies in analyzing the duration for which the market remains in either state. This duration can provide critical insights into whether the market is trending or ranging.
Extended periods in extreme overbought territories confirm an uptrend, while prolonged presence in slight overbought zones (above 50 but below 70, for example) suggests a more moderate uptrend. Conventionally, levels above 70 signal extreme overbought conditions, and those below 30 indicate extreme oversold conditions.
Traders are advised to exercise caution when the oscillator stays within these extreme areas. Ideally, the strategy involves capitalizing on temporary price drops within an overall uptrend or on temporary price spikes within an overall downtrend.
Identifying trading opportunities with the KDM Indicator involves looking for the indicator to exit these extreme overbought or oversold regions, signaling potential reversals or continuations in the market's direction. This approach helps traders make informed decisions by considering the broader market trend alongside short-term price movements.
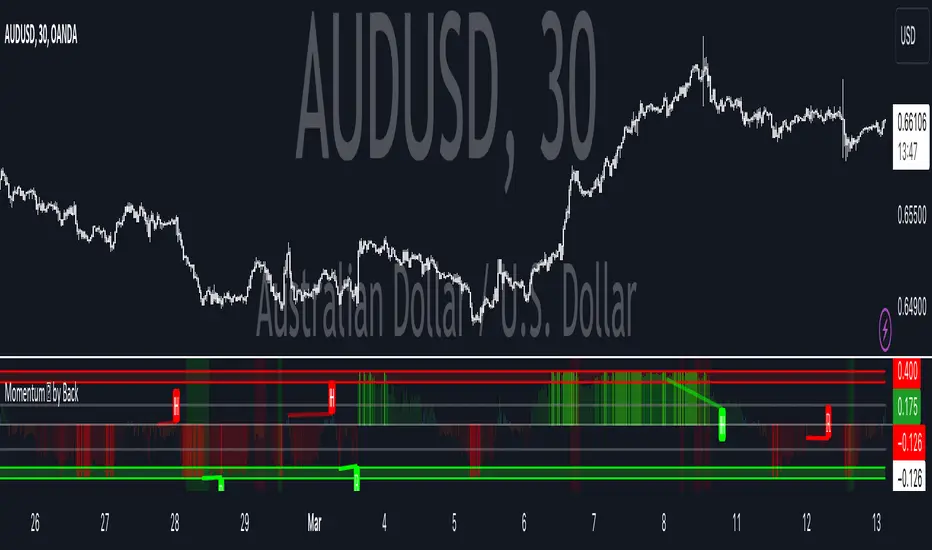
Momentum Velocity [BackQuant]Momentum Velocity
Main Features:
- Momentum Based Oscillator
- Divergences
- Overbought and Oversold Conditions based off a VZO
- Alert Conditions
- Ability to make Adaptive
- Big User input menu for customisation
The Momentum Velocity indicator is based on the principle of momentum , which is a measure of the rate of change or the speed at which prices move over a specified time period. The underlying assumption of momentum trading is that assets that have performed well in the recent past will continue to perform well in the near future, and conversely, assets that have performed poorly will continue to perform poorly. This concept is widely accepted and empirically supported in financial literature, making the Momentum Velocity indicator empirically sound for several reasons:
Empirical Evidence on Momentum
Academic Research: A foundational piece of research that supports the momentum strategy is Jegadeesh and Titman's study, "Returns to Buying Winners and Selling Losers: Implications for Stock Market Efficiency," published in the Journal of Finance in 1993. The authors find that strategies which buy stocks that have performed well in the past and sell stocks that have performed poorly generate significantly higher than expected returns over 3- to 12-month holding periods. This study is one of many that empirically validate the momentum effect in stock returns.
Behavioural Finance Theories:
Behavioural finance provides explanations for the momentum effect that go beyond the efficient market hypothesis. Theories such as investor herding, overreaction and under reaction to news, and the disposition effect can cause price trends to continue. The momentum strategy exploits these behavioural biases by assuming that prices will continue to move in their current direction for some time.
Global Evidence:
The momentum effect is not limited to specific markets or asset classes. Studies have documented momentum profits across various countries, markets, and asset types (stocks, bonds, commodities, and currencies). For instance, Asness, Moskowitz, and Pedersen in their paper, "Value and Momentum Everywhere," published in the Journal of Finance in 2013, show that momentum strategies can yield positive returns in different international markets.
Risk Factors:
Some researchers argue that the returns to momentum strategies are compensation for bearing certain risks. However, the empirical evidence suggests that momentum returns are difficult to explain by traditional risk factors alone, adding to the strategy’s attractiveness. The factor model of Carhart (1997), which adds a momentum factor to the Fama and French three-factor model, highlights the importance of momentum as a distinct source of returns.
Empirical Evidence Application
The Momentum Velocity indicator applies these empirical insights by quantitatively measuring the speed and direction of price movements over a given period, adjusting for recent market conditions through adaptive filtering, and normalizing the results to identify potential trading signals. By doing so, it provides traders with a tool that not only captures the essence of the momentum anomaly but also enhances it with modern technical analysis techniques for real-time market application.
Trading Application
Due to the robustness of momentum, traders are able to use this as a confluence metric into their system on any timeframe. Providing robust signals, that by extention are adaptive to the market. This is also further enabled by using adaptive filtering.
Conclusion
In summary, the empirical soundness of the Momentum Velocity indicator is grounded in the well-documented momentum effect observed in financial markets. By leveraging historical price data to predict future price movements, it aligns with both academic research and observed market behavior, making it a potentially valuable tool for traders seeking to exploit momentum-based trading opportunities.
User Inputs:
Calculation Source: Choose the price component (e.g., close) to base calculations on.
Lookback Period: Define the period over which momentum and normalization are calculated.
Use Adaptive Filtering?: Toggle the use of DEMA for more responsive momentum calculation.
Adaptive Lookback Period: Set the period for the adaptive filter when enabled.
Show Momentum Moving Average?: Option to display a moving average of the plotosc for trend smoothing.
MA Period: Specify the period for the momentum moving average.
Show Static High and Low Levels: Display predefined levels indicating extreme momentum thresholds.
Color Bars According to Trend?: Color price bars based on the momentum direction for quick visual reference.
Show Overbought and Oversold Signals: Highlight extreme volume conditions as potential buy/sell signals.
Signal Calculation Period: Set the period for calculating volume-based signals.
Show Detected Divergences?: Enable or disable the visualization of bullish and bearish divergences.
How it can be used in the context of a Trading System
Momentum and momentum divergences are pivotal concepts in trading systems, offering traders insights into the strength and potential reversal points of market trends. Momentum, a measure of the rate of price changes, helps traders identify the velocity of market movements, allowing them to ride the wave of prevailing trends for profits. When momentum divergences occur—where price movement and momentum indicators move in opposite directions—they signal a weakening of the current trend and potential for reversal. Traders can use these signals to adjust their positions, entering or exiting trades based on the anticipation of trend changes. Incorporating momentum and its divergences into a trading system provides a dynamic strategy that leverages the market's natural cycles of trend strength and exhaustion, aiming to capitalize on both continuation and reversal opportunities for enhanced trading outcomes.
We have also added a volume based component for traders to use as a point of confluence. It is shown on the chart giving background hues for overbought and oversold signals.
Thus following all of the key points here are some sample backtests on the 1D Chart
Disclaimer: Backtests are based off past results, and are not indicative of the future.
INDEX:BTCUSD
INDEX:ETHUSD
BINANCE:SOLUSD
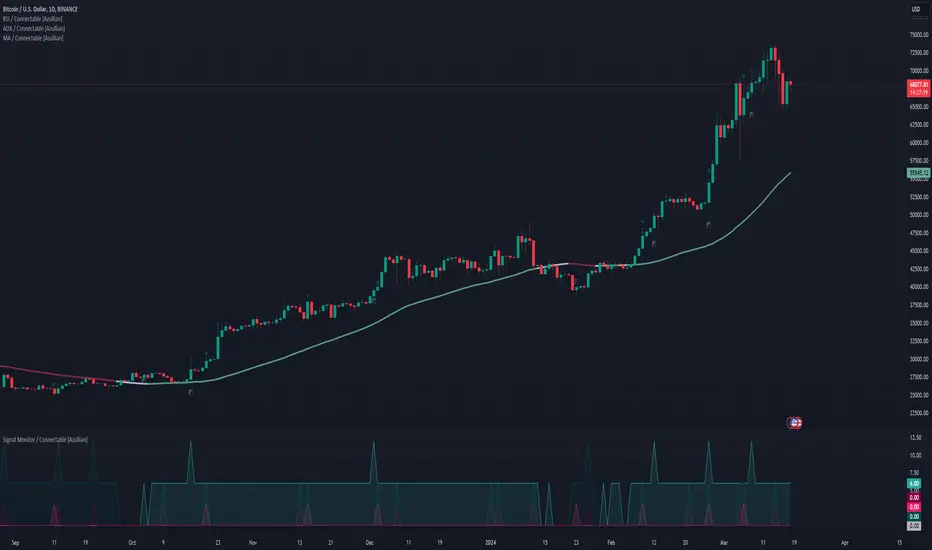
Signal Monitor / Connectable [Azullian]The connectable signal monitor is a connectable tool to help test, visualize signal weights. Like all connectable indicators , it interacts through the TradingView input source, which serves as a signal connector to link indicators to each other. All connectable indicators send signal weight to the next node in the system until it reaches either a connectable signal monitor, signal filter and/or strategy.
Let's review the separate parts of this indicator.
█ INPUTS
We've provided 3 inputs for connecting indicators or chains (1→, 2→, 3→) which are all set to 'Close' by default.
An input has several controls:
• Enable disable: Toggle the entire input on or off
• Input: Connect indicators here, choose indicators with a compatible : Signal connector.
■ VISUALS
• ☼: Brightness % : Set the opacity for the signal curves
• 🡓: ES Color : Set the color for the ES: Entry Short signal
• ⭳: XS Color : Set the color for the XS: Exit Short signal
• ⌥: Plot mode : Set the plotting mode
○ Signals IN: Show all signals
○ Signals OUT: Show only scoring signals
• 🡑: EL Color : Set the color for the EL: Enter Long signal
• ⭱: XL Color : Set the color for the XL: Exit Long signal
█ USAGE OF CONNECTABLE INDICATORS
■ Connectable chaining mechanism
Connectable indicators can be connected directly to the signal monitor, signal filter or strategy , or they can be daisy chained to each other while the last indicator in the chain connects to the connectable signal monitor, signal filter or strategy . When using a signal filter or signal monitor you can chain the filter to the strategy input to make your chain complete.
• Direct chaining: Connect an indicator directly to the signal monitor, signal filter or strategy through the provided inputs (→).
• Daisy chaining: Connect indicators using the indicator input (→). The first in a daisy chain should have a flow (⌥) set to 'Indicator only'. Subsequent indicators use 'Both' to pass the previous weight. The final indicator connects to the signal monitor, signal filter, or strategy.
■ Set up the signal monitor with a connectable indicator and strategy
Let's connect the MACD to a connectable signal monitor :
1. Load all relevant indicators
• Load MACD / Connectable
• Load Signal monitor / Connectable
2. Signal Monitor: Connect the MACD to the Signal Monitor
• Open the signal monitor settings
• Choose one of the three input dropdowns (1→, 2→, 3→) and choose : MACD / Connectable: Signal Connector
• Toggle the enable box before the connected input to enable the incoming signal
Now that everything is connected, you'll notice green spikes in the signal monitor representing long signals, and red spikes indicating short signals.
█ BENEFITS
• Adaptable Modular Design: Arrange indicators in diverse structures via direct or daisy chaining, allowing tailored configurations to align with your analysis approach.
• Streamlined Backtesting: Simplify the iterative process of testing and adjusting combinations, facilitating a smoother exploration of potential setups.
• Intuitive Interface: Navigate TradingView with added ease. Integrate desired indicators, adjust settings, and establish alerts without delving into complex code.
• Signal Weight Precision: Leverage granular weight allocation among signals, offering a deeper layer of customization in strategy formulation.
• Advanced Signal Filtering: Define entry and exit conditions with more clarity, granting an added layer of strategy precision.
• Clear Visual Feedback: Distinct visual signals and cues enhance the readability of charts, promoting informed decision-making.
• Standardized Defaults: Indicators are equipped with universally recognized preset settings, ensuring consistency in initial setups across different types like momentum or volatility.
• Reliability: Our indicators are meticulously developed to prevent repainting. We strictly adhere to TradingView's coding conventions, ensuring our code is both performant and clean.
█ COMPATIBLE INDICATORS
Each indicator that incorporates our open-source 'azLibConnector' library and adheres to our conventions can be effortlessly integrated and used as detailed above.
For clarity and recognition within the TradingView platform, we append the suffix ' / Connectable' to every compatible indicator.
█ COMMON MISTAKES, CLARIFICATIONS AND TIPS
• Removing an indicator from a chain: Deleting a linked indicator and confirming the "remove study tree" alert will also remove all underlying indicators in the object tree. Before removing one, disconnect the adjacent indicators and move it to the object stack's bottom.
• Point systems: The azLibConnector provides 500 points for each direction (EL: Enter long, XL: Exit long, ES: Enter short, XS: Exit short) Remember this cap when devising a point structure.
• Flow misconfiguration: In daisy chains the first indicator should always have a flow (⌥) setting of 'indicator only' while other indicator should have a flow (⌥) setting of 'both'.
• Hide attributes: As connectable indicators send through quite some information you'll notice all the arguments are taking up some screenwidth and cause some visual clutter. You can disable arguments in Chart Settings / Status line.
• Layout and abbreviations: To maintain a consistent structure, we use abbreviations for each input. While this may initially seem complex, you'll quickly become familiar with them. Each abbreviation is also explained in the inline tooltips.
• Inputs: Connecting a connectable indicator directly to the strategy delivers the raw signal without a weight threshold, meaning every signal will trigger a trade.
█ A NOTE OF GRATITUDE
Through years of exploring TradingView and Pine Script, we've drawn immense inspiration from the community's knowledge and innovation. Thank you for being a constant source of motivation and insight.
█ RISK DISCLAIMER
Azullian's content, tools, scripts, articles, and educational offerings are presented purely for educational and informational uses. Please be aware that past performance should not be considered a predictor of future results.
Smart DCA StrategyINSPIRATION
While Dollar Cost Averaging (DCA) is a popular and stress-free investment approach, I noticed an opportunity for enhancement. Standard DCA involves buying consistently, regardless of market conditions, which can sometimes mean missing out on optimal investment opportunities. This led me to develop the Smart DCA Strategy – a 'set and forget' method like traditional DCA, but with an intelligent twist to boost its effectiveness.
The goal was to build something more profitable than a standard DCA strategy so it was equally important that this indicator could backtest its own results in an A/B test manner against the regular DCA strategy.
WHY IS IT SMART?
The key to this strategy is its dynamic approach: buying aggressively when the market shows signs of being oversold, and sitting on the sidelines when it's not. This approach aims to optimize entry points, enhancing the potential for better returns while maintaining the simplicity and low stress of DCA.
WHAT THIS STRATEGY IS, AND IS NOT
This is an investment style strategy. It is designed to improve upon the common standard DCA investment strategy. It is therefore NOT a day trading strategy. Feel free to experiment with various timeframes, but it was designed to be used on a daily timeframe and that's how I recommend it to be used.
You may also go months without any buy signals during bull markets, but remember that is exactly the point of the strategy - to keep your buying power on the sidelines until the markets have significantly pulled back. You need to be patient and trust in the historical backtesting you have performed.
HOW IT WORKS
The Smart DCA Strategy leverages a creative approach to using Moving Averages to identify the most opportune moments to buy. A trigger occurs when a daily candle, in its entirety including the high wick, closes below the threshold line or box plotted on the chart. The indicator is designed to facilitate both backtesting and live trading.
HOW TO USE
Settings:
The input parameters for tuning have been intentionally simplified in an effort to prevent users falling into the overfitting trap.
The main control is the Buying strictness scale setting. Setting this to a lower value will provide more buying days (less strict) while higher values mean less buying days (more strict). In my testing I've found level 9 to provide good all round results.
Validation days is a setting to prevent triggering entries until the asset has spent a given number of days (candles) in the overbought state. Increasing this makes entries stricter. I've found 0 to give the best results across most assets.
In the backtest settings you can also configure how much to buy for each day an entry triggers. Blind buy size is the amount you would buy every day in a standard DCA strategy. Smart buy size is the amount you would buy each day a Smart DCA entry is triggered.
You can also experiment with backtesting your strategy over different historical datasets by using the Start date and End date settings. The results table will not calculate for any trades outside what you've set in the date range settings.
Backtesting:
When backtesting you should use the results table on the top right to tune and optimise the results of your strategy. As with all backtests, be careful to avoid overfitting the parameters. It's better to have a setup which works well across many currencies and historical periods than a setup which is excellent on one dataset but bad on most others. This gives a much higher probability that it will be effective when you move to live trading.
The results table provides a clear visual representation as to which strategy, standard or smart, is more profitable for the given dataset. You will notice the columns are dynamically coloured red and green. Their colour changes based on which strategy is more profitable in the A/B style backtest - green wins, red loses. The key metrics to focus on are GOA (Gain on Account) and Avg Cost .
Live Trading:
After you've finished backtesting you can proceed with configuring your alerts for live trading.
But first, you need to estimate the amount you should buy on each Smart DCA entry. We can use the Total invested row in the results table to calculate this. Assuming we're looking to trade on BITSTAMP:BTCUSD
Decide how much USD you would spend each day to buy BTC if you were using a standard DCA strategy. Lets say that is $5 per day
Enter that USD amount in the Blind buy size settings box
Check the Blind Buy column in the results table. If we set the backtest date range to the last 10 years, we would expect the amount spent on blind buys over 10 years to be $18,250 given $5 each day
Next we need to tweak the value of the Smart buy size parameter in setting to get it as close as we can to the Total Invested amount for Blind Buy
By following this approach it means we will invest roughly the same amount into our Smart DCA strategy as we would have into a standard DCA strategy over any given time period.
After you have calculated the Smart buy size , you can go ahead and set up alerts on Smart DCA buy triggers.
BOT AUTOMATION
In an effort to maintain the 'set and forget' stress-free benefits of a standard DCA strategy, I have set my personal Smart DCA Strategy up to be automated. The bot runs on AWS and I have a fully functional project for the bot on my GitHub account. Just reach out if you would like me to point you towards it. You can also hook this into any other 3rd party trade automation system of your choice using the pre-configured alerts within the indicator.
PLANNED FUTURE DEVELOPMENTS
Currently this is purely an accumulation strategy. It does not have any sell signals right now but I have ideas on how I will build upon it to incorporate an algorithm for selling. The strategy should gradually offload profits in bull markets which generates more USD which gives more buying power to rinse and repeat the same process in the next cycle only with a bigger starting capital. Watch this space!
MARKETS
Crypto:
This strategy has been specifically built to work on the crypto markets. It has been developed, backtested and tuned against crypto markets and I personally only run it on crypto markets to accumulate more of the coins I believe in for the long term. In the section below I will provide some backtest results from some of the top crypto assets.
Stocks:
I've found it is generally more profitable than a standard DCA strategy on the majority of stocks, however the results proved to be a lot more impressive on crypto. This is mainly due to the volatility and cycles found in crypto markets. The strategy makes its profits from capitalising on pullbacks in price. Good stocks on the other hand tend to move up and to the right with less significant pullbacks, therefore giving this strategy less opportunity to flourish.
Forex:
As this is an accumulation style investment strategy, I do not recommend that you use it to trade Forex.
STRATEGY IN ACTION
Here you see the indicator running on the BITSTAMP:BTCUSD pair. You can read the indicator as follows:
Vertical green bands on historical candles represents where buy signals triggered in the past
Table on the top right represents the results of the A/B backtest against a standard DCA strategy
Green Smart Buy column shows that Smart DCA was more profitable than standard DCA on this backtest. That is shown by the percentage GOA (Gain on Account) and the Avg Cost
Smart Buy Zone label marks the threshold which the entire candle must be below to trigger a buy signal (line can be changed to a box under plotting settings)
Green color of Smart Buy Zone label represents that the open candle is still valid for a buy signal. A signal will only be generated if the candle closes while this label is still green
Below is the same BITSTAMP:BTCUSD chart a couple of days later. Notice how the threshold has been broken and the Smart Buy Zone label has turned from green to red. No buy signal can be triggered for this day - even if the candle retraced and closed below the threshold before daily candle close.
Notice how the green vertical bands tend to be present after significant pullbacks in price. This is the reason the strategy works! Below is the same BITSTAMP:BTCUSD chart, but this time zoomed out to present a clearer picture of the times it would invest vs times it would sit out of the market. You will notice it invests heavily in bear markets and significant pullbacks, and does not buy anything during bull markets.
Finally, to visually demonstrate the indicator on an asset other than BTC, here is an example on CRYPTO:ETHUSD . In this case the current daily high has not touched the threshold so it is still possible for this to be a valid buy trigger on daily candle close. The vertical green band will not print until the buy trigger is confirmed.
BACKTEST RESULTS
Now for some backtest results to demonstrate the improved performance over a standard DCA strategy using all non-stablecoin assets in the top 30 cryptos by marketcap.
I've used the TradingView ticker (exchange name denoted as CRYPTO in the symbol search) for every symbol tested with the exception of BTCUSD because there was some dodgy data at the beginning of the TradingView BTCUSD chart which overinflated the effectiveness of the Smart DCA strategy on that ticker. For BTCUSD I've used the BITSTAMP exchange data. The symbol links below will take you to the correct chart and exchange used for the test.
I'm using the GOA (Gain on Account) values to present how each strategy performed.
The value on the left side is the standard DCA result and the right is the Smart DCA result.
✅ means Smart DCA strategy outperformed the standard DCA strategy
❌ means standard DCA strategy outperformed the Smart DCA strategy
To avoid overfitting, and to prove that this strategy does not suffer from overfitting, I've used the exact same input parameters for every symbol tested below. The settings used in these backtests are:
Buying strictness scale: 9
Validation days: 0
You can absolutely tweak the values per symbol to further improve the results of each, however I think using identical settings on every pair tested demonstrates a higher likelihood that the results will be similar in the live markets.
I'm presenting results for two time periods:
First price data available for trading pair -> closing candle on Friday 26th Jan 2024 (ALL TIME)
Opening candle on Sunday 1st Jan 2023 -> closing candle on Friday 26th Jan 2024 (JAN 2023 -> JAN 2024)
ALL TIME:
BITSTAMP:BTCUSD 80,884% / 133,582% ✅
CRYPTO:ETHUSD 17,231% / 36,146% ✅
CRYPTO:BNBUSD 5,314% / 2,702% ❌
CRYPTO:SOLUSD 1,745% / 1,171% ❌
CRYPTO:XRPUSD 2,585% / 4,544% ✅
CRYPTO:ADAUSD 338% / 353% ✅
CRYPTO:AVAXUSD 130% / 160% ✅
CRYPTO:DOGEUSD 13,690% / 16,432% ✅
CRYPTO:TRXUSD 414% / 466% ✅
CRYPTO:DOTUSD -16% / -7% ✅
CRYPTO:LINKUSD 1,161% / 2,164% ✅
CRYPTO:TONUSD 25% / 47% ✅
CRYPTO:MATICUSD 1,769% / 1,587% ❌
CRYPTO:ICPUSD 70% / 50% ❌
CRYPTO:SHIBUSD -20% / -19% ✅
CRYPTO:LTCUSD 486% / 718% ✅
CRYPTO:BCHUSD -4% / 3% ✅
CRYPTO:LEOUSD 102% / 151% ✅
CRYPTO:ATOMUSD 46% / 91% ✅
CRYPTO:UNIUSD -16% / 1% ✅
CRYPTO:ETCUSD 283% / 414% ✅
CRYPTO:OKBUSD 1,286% / 1,935% ✅
CRYPTO:XLMUSD 1,471% / 1,592% ✅
CRYPTO:INJUSD 830% / 1,035% ✅
CRYPTO:OPUSD 138% / 195% ✅
CRYPTO:NEARUSD 23% / 44% ✅
Backtest result analysis:
Assuming we have an initial investment amount of $10,000 spread evenly across each asset since the creation of each asset, it would have provided the following results.
Standard DCA Strategy results:
Average percent return: 4,998.65%
Profit: $499,865
Closing balance: $509,865
Smart DCA Strategy results:
Average percent return: 7,906.03%
Profit: $790,603
Closing balance: $800,603
JAN 2023 -> JAN 2024:
BITSTAMP:BTCUSD 47% / 66% ✅
CRYPTO:ETHUSD 26% / 33% ✅
CRYPTO:BNBUSD 15% / 17% ✅
CRYPTO:SOLUSD 272% / 394% ✅
CRYPTO:XRPUSD 7% / 12% ✅
CRYPTO:ADAUSD 43% / 59% ✅
CRYPTO:AVAXUSD 116% / 151% ✅
CRYPTO:DOGEUSD 8% / 14% ✅
CRYPTO:TRXUSD 48% / 65% ✅
CRYPTO:DOTUSD 24% / 35% ✅
CRYPTO:LINKUSD 83% / 124% ✅
CRYPTO:TONUSD 7% / 21% ✅
CRYPTO:MATICUSD -3% / 7% ✅
CRYPTO:ICPUSD 161% / 196% ✅
CRYPTO:SHIBUSD 1% / 8% ✅
CRYPTO:LTCUSD -15% / -7% ✅
CRYPTO:BCHUSD 47% / 68% ✅
CRYPTO:LEOUSD 9% / 11% ✅
CRYPTO:ATOMUSD 1% / 15% ✅
CRYPTO:UNIUSD 9% / 23% ✅
CRYPTO:ETCUSD 27% / 40% ✅
CRYPTO:OKBUSD 21% / 30% ✅
CRYPTO:XLMUSD 11% / 19% ✅
CRYPTO:INJUSD 477% / 446% ❌
CRYPTO:OPUSD 77% / 91% ✅
CRYPTO:NEARUSD 78% / 95% ✅
Backtest result analysis:
Assuming we have an initial investment amount of $10,000 spread evenly across each asset for the duration of 2023, it would have provided the following results.
Standard DCA Strategy results:
Average percent return: 61.42%
Profit: $6,142
Closing balance: $16,142
Smart DCA Strategy results:
Average percent return: 78.19%
Profit: $7,819
Closing balance: $17,819

NY Open Breakout Strategy - High Liquidity & Favorable RRR Pine Description:
The NY Open Breakout Strategy is an advanced Pine Script indicator tailored for the TradingView platform. This strategy is specifically designed to exploit the high liquidity found during the New York session opening in the Forex market. Its primary goal is to provide traders with an opportunity to engage in positions with lower risk and higher potential profits, thereby ensuring an advantageous risk-to-reward ratio (RRR).
Core Objectives:
Leveraging High Liquidity: Capitalizes on the significant market movements at the New York session opening, known for its high liquidity, to identify strong breakout signals.
Achieving Favorable RRR: By setting strategic stop-loss and take-profit levels, the strategy aims for a higher RRR. This approach can lead to overall profitability, even if the win rate is lower than the loss rate.
Functionality:
Dynamic Breakout Identification: Uses the first 15-minute candle’s high and low after NY open as benchmarks for detecting potential breakouts.
Customizable Stop-Loss & Take-Profit: Provides options to configure stop-loss at the last swing or the previous candle’s close. The take-profit levels are determined based on a favorable risk-reward ratio.
Visual Session Indicators: Includes distinct background coloring and vertical lines to mark the New York session for easy visibility.
Methodology:
This strategy hinges on the premise that the opening of the New York session often triggers key price movements due to an influx of trading activity. By focusing on these moments, our indicator aims to capture strong trends and breakout patterns. The carefully calibrated stop-loss and take-profit settings ensure that each trade aims for a higher potential reward compared to the risk undertaken.
Unique Features:
Enhanced Risk Management: With adaptable risk-reward settings, traders can tailor their trading strategies to align with individual risk appetites.
Personalized User Experience: Offers a range of customizable settings for visual elements, allowing traders to adjust the look and feel of the indicator to their preferences.
Usage Guidelines:
Customize the indicator settings, including the stop-loss reference and risk-reward ratio, to match your trading style.
Watch for 'Buy Enter' and 'Sell Enter' signals during the New York session opening.
Utilize the displayed stop-loss and take-profit levels to effectively manage each trade.
This NY Open Breakout Strategy is ideal for traders who prioritize efficient risk management while aiming to capitalize on the high liquidity periods of the Forex market. The strategy is designed to be robust, providing a pathway to profitability even in scenarios where the number of losing trades surpasses winning ones, thanks to its emphasis on a high risk-to-reward ratio.

QQE MOD + SSL Hybrid + Waddah Attar Explosion IndicatorINDICATOR PURPOSE
This indicator is designed to complement my original QQE MOD + SSL Hybrid + Waddah Attar Explosion strategy.
Multiple users have requested that I convert the strategy to an indicator because alertconditions do not work on strategies and people want to specific set alerts for BUY, SELL, CLOSE BUY and CLOSE SELL. This can only be achieved using alertcondition().
This indicator functions in the exact same way as the strategy, but it doesn't have any backtesting functionality. I recomment that you use the original QQE MOD + SSL Hybrid + Waddah Attar Explosion strategy for parameter tuning and backtesting, then if you need more control on alerts you can use this indicator for that purpose.
Only other difference is that I have added grey exit labels on the chart since it's not obvious where the exits would happen like it was in the strategy version.
CREDITS
QQE MOD byMihkel00
SSL Hybrid by Mihkel00
Waddah Attar Explosion by shayankm

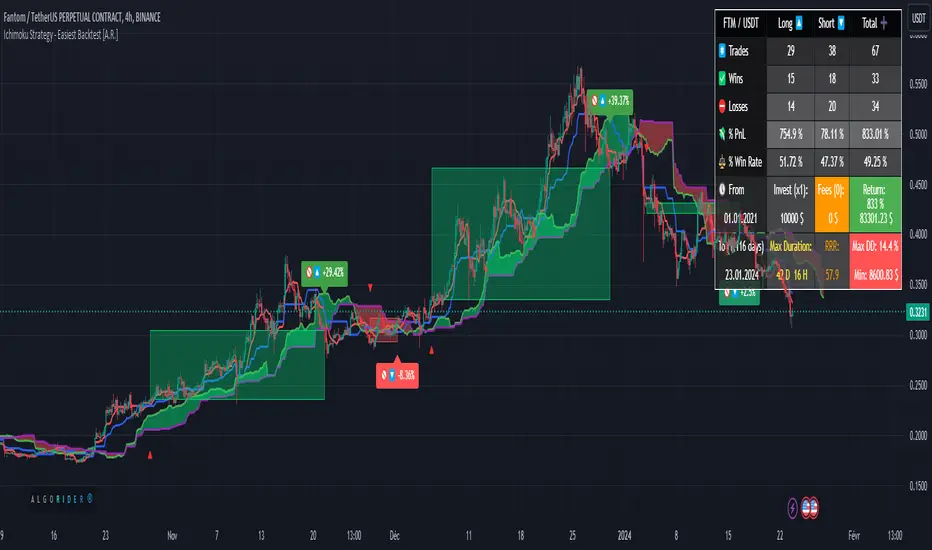
Ichimoku Strategy - Easiest Backtest [A.R.]▓ INTRODUCTION
This indicator allows a new "sandbox" approach to the Ichimoku system allowing to combine several entry, confirmation and exit conditions, to add basic risk management, to be able to backtest the performance of the strategy using a table directly on chart, and automate entry and exit signals using alerts.
▓ DEFINITION
The Ichimoku strategy is a trading system based on technical analysis, using a set of graphical indicators to evaluate the trend, strength and support/resistance levels of a financial asset. It integrates components such as the conversion line (Tenkan), the baseline (Kijun), the cloud delimited by the Senkou Span A and the Senkou Span B (SSA - SSB - Kumo) and the lagging span (Chikou) to provide different trading signals.
▓ ADDED VALUE
Several indicators and strategies concerning Ichimoku are already available on Tradingview, we are publishing this indicator to make this strategy even more accessible, what makes it original:
▪️ Unique Settings Windows, easy-to-read. The settings categories are clearly separated. Some parameters are aligned to avoid having an endless list of parameters to modify. This makes the settings window easy to understand and pleasant to use.
▪️ Sandbox type settings, you can choose 1 or 2 Entry conditions, choose to add 1 Confirmation, choose to add between 1 and 3 Exit Conditions. Dozens of possible configurations.
▪️ Possibility of adding basic Risk Management (TP/SL)
▪️ Backtest table directly on chart that allow to get quickly the results (script execution <1 sec) which makes it practical, allowing dozens of different configurations to be tested in a short period of time
▪️ Monitoring historical and current trades on chart thanks to Boxes and Labels
▓ HOW TO USE
You can try the indicator with default settings but you can also modify backtesting settings and trade Entry conditions, Entry Confirmation, and Exit conditions, also you can decide to add a Stop Loss and/or a Take Profit. Then you can find the stats of the backtesting in a table directly in the top right corner of the chart. Finally you can automate the strategy using Alert conditions. You can find all the settings below:
Initial backtesting settings:
🔹Set up Side: Choose Long|Short, Long or Short
🔹Set up Investment: Choose an amount in $, it simulates the equity / funds on the trading account.
🔹Set up Position Size: Choose an amount in $, it simulates the amount of the position size of each trade. If you want to simulate leverage trading, you can put a Position Size superior to Investment. For exemple Investment = 10000 and Position Size = 20000 simulates a x2 leverage.
🔹Set up your Fee rate %: Each trade entry and trade exit, a % of position size will be deducted from the PnL stats. For example if you choose 0.04% with 10000 Position Size, 4$ will be deducted each trade entry and each trade exit = 8$ fees each trade.
🔹Set up the Start and End date: It allows to backtest the strategy over a period of time, for Example from 01-01-2021 to 01-12-2022. By default the end date is year 2050, the backtest will start to take into account data from Start Date to the current time.
Backtest the main Ichimoku sub-strategies choosing entry conditions:
🔸Cloud Breakouts trading: Choose this Entry condition to start a trade when Price crosses the Cloud Upside (Long) or Downside (Short)
🔸Tenkan x Kijun cross trading: Choose this Entry condition to start a trade when Tenkan (Red line) crosses Kijun (Blue line) Upside (Long) or Downside (Short)
* There is no repaint, a signal is validated after the condition is confirmed at the end of the previous candle. If a signal appears on the chart, it won't ever disappear.
Entry Confirmations:
✔️ Chikou Above or Below price: if you check this setting, Long entry signals will be confirmed only when the Chikou (White Line) is Above the current price and Short entry signals will be confirmed only when the Chikou (White Line) is below the current price. In the Ichimoku system the Chikou is often used to confirm all types of signals.
Exit Conditions:
❌ Cloud Reintegrations: When a trade is open (Long or Short), if the price goes back into the cloud the trade is closed
❌ Reverse Cloud Breakouts: When a Long trade is open, if the price breaks out of the cloud from below the trade is closed. When a Short trade is open, if the price breaks out of the cloud from above the trade is closed.
❌ Reverse Tenkan-Kijun Cross: When a Long trade is open, if the Tenkan crosses Downside the Kijun the trade is closed. When a Short trade is open, if the Tenkan crosses Upside the Kijun the trade is closed.
Basic Risk Management:
⛔️ SL: Choose to set up a Stop Loss
✅ 1 single TP: Choose to set up a Take Profit
Signals:
🔔 Entry/Exit Alerts available: 4 types of alert conditions are available ENTRY LONG, ENTRY SHORT, EXIT LONG, EXIT SHORT. The entry conditions trigger at the beginning of the candle, choose alert frequence = once per bar.
👉 Tips: Easier to find profitable configurations in High Timeframe above H4.
▓ BACKTESTING SYSTEM
The Backtesting system integrated into the script tracks each trade. It allows you to test the strategy over a fixed period between a start date and an end date. It also allows to quickly and directly display on the chart the most important data to determine if a configuration is profitable such as the % PnL, the Max Drawdown, the amount of fees, the risk-reward ratio. It has been designed to be easy and quick to use even for a beginner.
═════════════════════════════════════════════════════════════════════════
The information published here on TradingView is not prohibited, doesn't constitute investment advice, and isn't created solely for qualified investors.
Important to note: The source code of this indicator is not accessible because it benefits from the code of our backtesting system present in other non-public indicators that we protect. Our indicators with the same backtesting system are published in separate publications because putting them together in a single script would considerably slow down the execution of the script.
PKJ StrategyWelcome to the Daily Price Action Mastery Strategy, a powerful approach to navigating the financial markets using the purest form of market analysis – price action. This trading view strategy is meticulously crafted for those seeking a method that harnesses the daily price movements to make informed and strategic trading decisions.
Key Features:
Daily Candlestick Analysis: Dive into the daily candlestick patterns to identify key support and resistance levels, trend reversals, and potential breakout points. The strategy leverages the valuable information encapsulated in each day's price action to discern market sentiment.
Trend Identification: Utilize trend analysis tools and indicators to pinpoint the prevailing market direction. By understanding the dynamics of daily trends, traders can align their positions with the broader market movement for higher probability trades.
Dynamic Support and Resistance: Implement dynamic support and resistance levels derived from daily price action. These levels act as crucial markers for entry and exit points, helping traders set effective stop-loss and take-profit orders.
Chart Patterns Recognition: Uncover chart patterns such as head and shoulders, flags, and triangles on the daily timeframe. The strategy incorporates pattern recognition techniques to identify potential trend continuation or reversal scenarios, offering traders a comprehensive view of market dynamics.
Volatility Analysis: Gauge market volatility by studying daily price ranges and fluctuations. Volatility indicators are integrated to help traders adjust their risk management strategies in response to varying market conditions.
Confirmation through Indicators: Supplement price action analysis with carefully selected indicators for additional confirmation signals. These indicators are chosen to align with the philosophy of the Daily Price Action Mastery Strategy, enhancing the precision of trade entries and exits.
Risk Management Guidelines: Discover effective risk management practices tailored to the daily timeframe. Learn how to optimize position sizes, set appropriate stop-loss levels, and manage capital to ensure long-term success and sustainability in your trading journey.
Whether you are a seasoned trader or a newcomer to the markets, the Daily Price Action Mastery Strategy provides a comprehensive framework to navigate the complexities of daily price movements. Elevate your trading experience by incorporating this strategy into your analysis, and empower yourself to make well-informed decisions in the dynamic world of finance.

Envelope and Moving Average**Description:**
- This script creates an indicator that combines an envelope and a simple moving average (MA).
- The envelope is constructed using a specified length, percentage deviation, and source price (close by default).
- The moving average is calculated based on a specified length and source price.
**Inputs:**
1. Envelope:
- Length: Number of periods used for the envelope calculation (default is 20).
- Percentage Deviation: Percentage above and below the envelope basis (default is 10%).
- Source: The price used for the envelope calculation (default is close).
- Exponential MA: Option to use exponential moving average for the envelope basis (default is false).
2. Moving Average:
- Length: Number of periods used for the moving average calculation (default is 20).
- Source: The price used for the moving average calculation (default is close).
**Plotting:**
- The script plots the envelope basis, upper envelope line, and lower envelope line.
- The area between the upper and lower envelope lines is filled with a semi-transparent color for better visualization.
- The moving average is plotted on the chart with a specified color and line width.
**How to Use in a Strategy:**
1. **Envelope Crossovers:**
- Go Long (Buy): When the close price crosses above the upper envelope line.
- Go Short (Sell): When the close price crosses below the lower envelope line.
2. **Moving Average Crossovers:**
- Go Long (Buy): When the close price crosses above the moving average.
- Go Short (Sell): When the close price crosses below the moving average.
3. **Confirmation:**
- Consider additional confirmation signals or filters to improve the robustness of your strategy.
- For example, you might require a certain amount of price momentum or use other technical indicators in conjunction with envelope and moving average signals.
4. **Optimization:**
- Experiment with different parameter values (e.g., envelope length, percentage deviation, moving average length) to optimize the strategy for specific market conditions.
5. **Risk Management:**
- Implement proper risk management techniques, such as setting stop-loss orders and position sizing, to control risk.
Remember to thoroughly backtest any strategy before deploying it in a live trading environment. Additionally, consider the current market conditions and adapt your strategy accordingly.
GCMML [Orderflowing]GCMML | Gaussian Channel Murray Math Lines | Trend Analysis | Extremity Analysis
Built using Pine Script V5.
Introduction
The GCMML (Gaussian Channel & Murray Math Lines) Indicator is a TA tool that combines the precision of Gaussian Channels with the strategic insights of Murray Math Lines (MMLE).
This indicator is designed for traders seeking analysis of market trends and volatility while also keeping an eye on extreme pivot levels, offering a unique mix of technical analysis methods.
Innovation and Inspiration
Thank you Matt S. for the idea to create this indicator: www.tradingview.com
GCMML is inspired by the need to integrate the robustness of Gaussian Channels with the extremities of MMLE.
This hybrid approach provides traders with a more nuanced tool for market analysis.
The innovation lies in seamlessly blending these two methodologies to offer a trend & volatility perspective.
Core Features
Gaussian Channel: Uses Gaussian Channels for trend analysis, offering a view of market direction and potential reversals.
Murray Math Lines (MMLE): Incorporates MMLE for precise support and resistance levels, used for pivotal decision-making.
Customizable Settings: Offers flexibility in setting the number of bars for MMLE, type of moving average for Gaussian Channels, and various other parameters to tailor the indicator to individual trading styles.
Input Parameters
MMLE Settings: Adjust the number of bars, level display options, and price wick inclusion for MMLE calculations.
Gaussian Channel Settings: Choose the number of poles, sampling period, and multiplier for the Gaussian Channel. Options for less lag or fast modes for custom analysis.
Smoothing Options: Select from various smoothing methods like HMA, SMA, EMA, WMA, DEMA, and TEMA for color change in the Gaussian Channel.
Functionality
Adaptive Analysis: Dynamically adjusts to market conditions, providing relevant insights through the Gaussian Channel and MMLE.
Visual: Offers clear visual cues through color-coded bands and levels, aiding in quick interpretation of market trends and potential pivot points.
Analysis and Interpretation
Market Trends: The Gaussian Channel provides a visual representation of the market trend, with color changes indicating shifts in momentum.
Support and Resistance: MMLE levels offer critical insights into potential support and resistance areas, guiding traders in making informed decisions.
Usage and Applications
Trend Identification: Use the Gaussian Channel for identifying market trends and potential reversal points.
Strategic Decision-Making: Leverage MMLE levels for setting stop-losses, take-profits, and identifying entry and exit points.
Comprehensive Market Analysis: Combine insights from both Gaussian Channels and MMLE for a more thorough analysis of market movements.
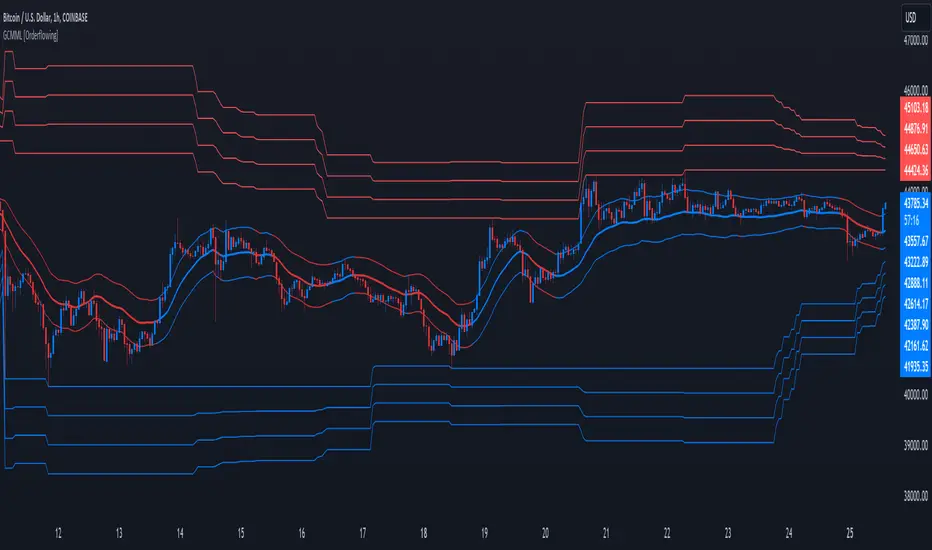
Example - Only Displaying the Gaussian Channel:
Example - Disable Fast Response & Reduced Lag Mode:
Example - Multi-Timeframe (6H Calculation / 4H Chart - 32Bars MMLE - GC Default Settings):
The Value
GCMML stands out as a unique and valuable technical analysis tool.
Its innovative combination of Gaussian Channels and MMLE, along with customizable settings, gives the trader an edge in market analysis.
The indicator's ability to provide customizable analysis justifies its position as a closed-source product.
Conclusion
The GCMML indicator is a new dual tool that offers traders a method to analyze market trends and volatility. Its approach of combining Gaussian Channels with MMLE provides a comprehensive view of the market, making it a niche addition to a trader's toolkit.
It is recommended to use GCMML in conjunction with other trading strategies.
It is not recommended to use the GCMML by itself for trading decisions.
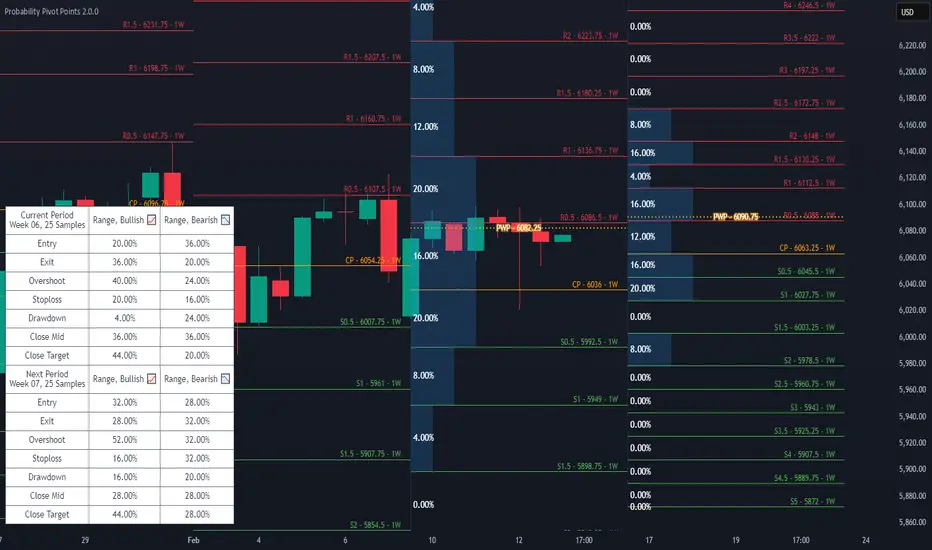
Probability Pivot PointsProbability Pivot Points integrates a customizable Pivot Points indicator with conditional probabilities calculated from historical occurrences.
Features
Six different discretionarily Pivot Point Bias strategies utilizing Midpoint Pivot Points in bullish and bearish variants: Standard, Range, Continuation, Counter Trend, Expansion, and Extension.
Next Period's Pivot Points given the current period's OHLC data. Includes settings to use theoretical OHLC values to see what the next period's Pivot Points could look like.
Supports Traditional, Floor, Fibonacci, and Average True Range Pivot Point calculations.
Includes settings to customize the Fibonacci ratios and Average True Range calculations.
Automatically maximize or manually set the number of historical Pivot Points to draw.
Probability visualizations for the Pivot Points based on historical occurrences for the current and upcoming trading periods. The Probability Weighted Pivot (PWP) Point uses the probabilities calculated as weights against every displayed Pivot Point to show a mean of the data.
Load seasonal or non-seasonal historical data to calculate the odds of a High, Low, or Close occurring between any two Pivot Points.
Settings to manually set the weekly, monthly, and quarterly seasonal data loaded into the Pivot Probabilities feature. Automatic detection and loading of the current seasonal period's data is the default behavior. Includes a table that displays the data that's loaded.
Get probabilities for the currently selected Pivot Point Bias strategy.
Check the odds of High, Low, or Close occurrences at the strategy's marked Entry, Exit, or Stop Loss Pivot Points.
Seasonal Filters let you select specific years to sample probabilities from.
Customize pivot colors, width, label size, label color, Bias Entry and Exit Zone colors, Pivot Probability colors, and pick between the Point Five and M Legacy Midpoint label styles.
Auto Timeframe changes the Pivot Points higher timeframe based on the chart timeframe in use. Includes settings to customize what chart timeframes will display specific Pivot Point higher timeframes.
Q: Is this an update to your older Pivot Probabilities indicator?
Pivot Probabilities was designed to require a separately applied Pivot Points indicator to be interpreted and used properly. Probability Pivot Points is designed with an included set of Pivot Pivots that can interact with the probability calculations, which helps make improvements to new calculations and visualizations that Pivot Probabilities was never originally designed to do. Features from Pivot Probabilities are being completely redesigned, reimplemented, and expanded upon as a component in this larger Probability Pivot Points indicator. Anyone with access to the old Pivot Probabilities will also get access to Probability Pivot Points and are considered part of the same package.
Absolute Momentum (Time Series Momentum)Absolute momentum , also known as time series momentum , focuses on the trend of an asset's own past performance to predict its future performance. It involves analyzing an asset's own historical performance, rather than comparing it to other assets.
The strategy determines whether an asset's price is exhibiting an upward (positive momentum) or downward (negative momentum) trend by assessing the asset's return over a given period (standard look-back period: 12 months or approximately 250 trading days). Some studies recommend calculating momentum by deducting the corresponding Treasury bill rate from the measured performance.
Absolute Momentum Indicator
The Absolute Momentum Indicator displays the rolling 12-month performance (measured over 250 trading days) and plots it against a horizontal line representing 0%. If the indicator crosses above this line, it signifies positive absolute momentum, and conversely, crossing below indicates negative momentum. An additional, optional look-back period input field can be accessed through the settings.
Hint: This indicator is a simplified version, as some academic approaches measure absolute momentum by subtracting risk-free rates from the 12-month performance. However, even with higher rates, the values will still remain close to the 0% line.
Benefits of Absolute Momentum
Absolute momentum, which should not be confused with relative momentum or the momentum indicator, serves as a timing instrument for both individual assets and entire markets.
Gary Antonacci , a key contributor to the absolute momentum strategy (find study below), emphasizes its effectiveness in multi-asset portfolios and its importance in long-only investing. This is particularly evident in a) reducing downside volatility and b) mitigating behavioral biases.
Moskowitz, Ooi, and Pedersen document significant 'time series momentum' across various asset classes, including equity index, currency, commodity, and bond futures, in 58 liquid instruments (find study below). There's a notable persistence in returns ranging from one to 12 months, which tends to partially reverse over longer periods. This pattern aligns with sentiment theories suggesting initial under-reaction followed by delayed over-reaction.
Despite its surprising ease of implementation, the academic community has successfully measured the effects of absolute momentum across decades and in every major asset class, including stocks, bonds, commodities, and foreign exchange (FX).
Strategies for Implementing Absolute Momentum:
To Buy a Stock:
Select a Look-Back Period: Choose a historical period to analyze the stock's performance. A common period is 12 months, but this can vary based on your investment strategy.
Calculate Excess Return: Determine the stock's excess return over this period. You can also assume a risk-free rate of "0" to simplify the process.
Evaluate Momentum:
If the excess return is positive, it indicates positive absolute momentum. This suggests the stock is in an upward trend and could be a good buying opportunity.
If the excess return is negative, it suggests negative momentum, and you might want to delay buying.
Consider further conditions: Align your decision with broader market trends, economic indicators, or fundamental analysis, for additional context.
To Sell a Stock You Own:
Regularly Monitor Performance: Use the same look-back period as for buying (e.g., 12 months) to regularly assess the stock's performance.
Check for Negative Momentum: Calculate the excess return for the look-back period. Again, you can assume a risk-free rate of "0" to simplify the process. If the stock shows negative momentum, it might be time to consider selling.
Consider further conditions:Align your decision with broader market trends, economic indicators, or fundamental analysis, for additional context.
Important note: Note: Entering a position (i.e., buying) based on positive absolute momentum doesn't necessarily mean you must sell it if it later exhibits negative absolute momentum. You can initiate a position using positive absolute momentum as an entry indicator and then continue holding it based on other criteria, such as fundamental analysis.
General Tips:
Reassessment Frequency: Decide how often you will reassess the momentum (monthly, quarterly, etc.).
Remember, while absolute momentum provides a systematic approach, it's recommendable to consider it as part of a broader investment strategy that includes diversification, risk management, fundamental analysis, etc.
Relevant Capital Market Studies:
Antonacci, Gary. "Absolute momentum: A simple rule-based strategy and universal trend-following overlay." Available at SSRN 2244633 (2013)
Moskowitz, Tobias J., Yao Hua Ooi, and Lasse Heje Pedersen. "Time series momentum." Journal of financial economics 104.2 (2012): 228-250
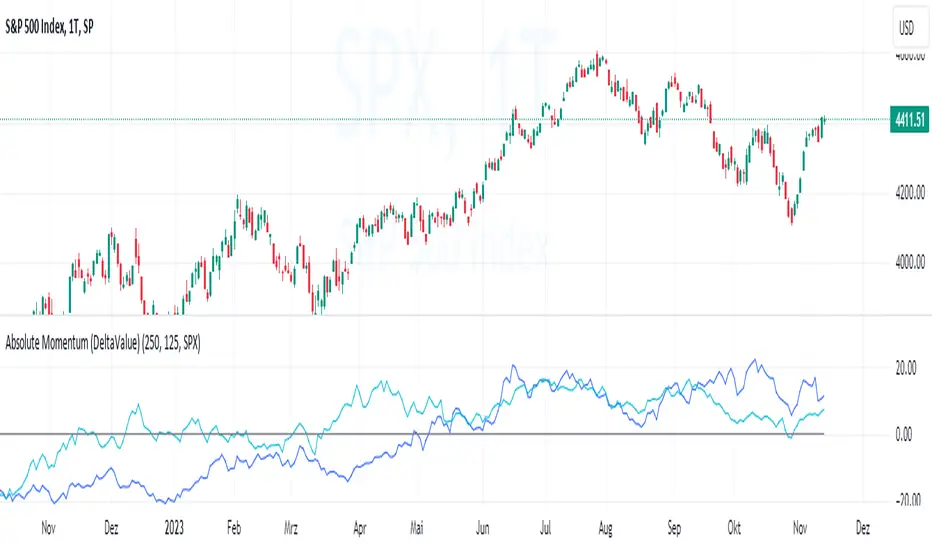
Combined Indicator by rocky vermaThe combined indicator you've provided consists of three different indicator logics. Here's how to use it:
1. **Indicator 1: Trend Trader AVR Strategy**
- This indicator is based on the Trend Trader AVR Strategy.
- It uses three input parameters: `Length1`, `LengthMA1`, and `Multiplier1`.
- The indicator plots a moving average (`nResMA1`) and changes the bar color based on certain conditions.
- The conditions for changing the bar color are defined in the `pos1` variable.
2. **Indicator 2: HYE Trend Hunter**
- This indicator is based on the HYE Trend Hunter strategy.
- It uses various input parameters such as `slowtenkansenPeriod`, `slowkijunsenPeriod`, `fasttenkansenPeriod`, and `fastkijunsenPeriod`.
- The logic of this indicator is not fully provided in your code snippet, but it seems to calculate various values related to the HYE Trend Hunter strategy.
3. **Indicator 3: Phenom**
- This indicator provides EMA (Exponential Moving Average) lines with different lengths.
- It allows you to configure whether to display EMA lines and their colors.
- Additionally, it provides options to display stop loss levels based on ATR (Average True Range).
To use this combined indicator:
- Apply it to a chart in TradingView by copying the entire code snippet and pasting it into the Pine Script editor.
- Configure the input parameters for each of the three indicator logics as desired. You can adjust the input values in the indicator's settings panel on the chart.
- You can also modify the indicator's appearance by changing the plot colors or turning on/off specific components.
- Once you have configured the input parameters and appearance settings to your liking, you can then interpret the signals and information provided by the three indicator logics on the chart.
Keep in mind that this is a basic combination of the three indicators you provided, and it may require further customization to meet your specific trading strategy and preferences. Additionally, ensure you thoroughly understand the strategies and conditions used by each of the indicators to make informed trading decisions.

GOLDEN BOX**Golden Box Trading Strategy Indicator**
The "Golden Box" trading strategy indicator is a visual tool designed to facilitate the execution of the Golden Box trading strategy on the TradingView platform. This strategy involves identifying potential buy and sell signals based on specific price movements within defined trading sessions.
**Features:**
- Custom session definition with adjustable time and time zone settings.
- Real-time tracking of session high, low, open, and close prices.
- Visual representation of trading sessions with highlighted high and low price ranges.
- Condition-based buy and sell signals based on closing prices and session levels.
- Informative tables outlining step-by-step strategy execution for both buy and sell scenarios.
**Strategy Highlights:**
- **Buy Strategy:** Wait for Monday's session completion. If the last candle's closing price is above the session's 50% level, set a pending buy limit order. Stop loss at the session high (100% level), take profits at 75% and 100%.
- **Sell Strategy:** Wait for Monday's session completion. If the last candle's closing price is below the session's 50% level, place a pending sell limit order. Stop loss at the session high (100% level), take profits at 25% and 0%.
**Disclaimer:** This indicator is for educational purposes and does not offer financial advice. Thoroughly understand the strategy and conduct testing before implementing it in live trading.
---
Feel free to modify this description to align with your preferences and to add any additional information that you believe will help users understand the indicator and strategy better.

mrD-Smart RangesmrD-Smart Ranges aims to offer a complete strategy based on Order Blocks. Ranges signals based on order volume are highlighted, from which smart ranges are suggested to provide potential entries.
This script also includes warnings for each signal marked.
🔶 SETTINGS
Pair Strategy: Select the desired from the list. Change the chart to the one specified in the Strategy.
Current TF Order Blocks: Allows the user to select how many most recent Internal Order Blocks appear in the current time frame on the chart.
Order Block Filter: Allows the user to select how the script mitigates an Order Block.
Hide Overlap: Allows the user to display overlapping Order Blocks.
Show Metrics: Allows the user to display volume % metrics within the Order Blocks.
Show Volume Box: Allows the user to display buy/sell activity within Order Blocks.
High Timeframe: Allows the user to choose a higher or lower timeframe to find the Signals.
Show Failed Buy Sell: Allows the user to display the Signals.
Show HTF Box: Allows the user to display a higher or lower timeframe Order Blocks.
🔶 DETAILS
Order blocks are formed after a slight bearish order block, these can provide an opportunity to change polarity, thus acting as a potential support/resistance level.
A retest/retrace on the order block, combined with order volume between the current timeframe and from the higher timeframe will establish the conditions for smart ranges are suggested to provide potential entries.
🔶 USAGE
mrD-Smart Ranges aims to provide users with a minimalistic screen next to the optimal ranges to keep in mind to find trading setups as shown below.
Here we can see a suggested Sell range and display a label to confirm this range
Signal(s) that can be used for potential entries only during range retest are order blocks.
Users can search for more potential entry ranges based on larger timeframes in the settings: High Timeframe
In the image above, we can see that the price has generated potential orange and bearish entry signals. A confirmation signal with a red label is displayed on the chart when the price retests the Sell range.
Note: While range retests can still work well if they occur later in price action, it's best to look for signals only when price retests the range at the outset rather than retesting it. second price.
The logic of generating signal ranges using different rules is described below:
- Define order blocks in the current timeframe.
- Define the order blocks with the largest volume in the current timeframe.
- Define order blocks in larger timeframes in High Timeframe settings
- Define order blocks with the largest volume in larger timeframes in High Timeframe settings
Entry Range: The combination of the highest volume order blocks in the current timeframe and the highest volume order blocks in the larger timeframe.
🔶General disclaimer:
Trading stocks, futures, forex, options, ETFs, cryptocurrency, or any other financial instrument has huge potential rewards and risks.
You must be aware of the risks and willing to accept them to invest in stocks, futures, forex, options, ETFs, or cryptocurrencies.
Don't trade with money you can't afford to lose.
This is not an offer or an offer to Buy/Sell stocks, futures, Forex, options, ETFs, cryptocurrencies, or any other financial instrument.
Do not represent that any account will or is likely to achieve profit or loss of any kind.
The past performance of any trading system or method is not necessarily indicative of future results.
My Scripts/Indicators/Ideas/Algos/Systems are only for educational purposes!
Oliver Velez IndicatorOliver Velez is a well-known trader and educator who has developed multiple trading strategies. One of them is the 20-200sma strategy, which is a basic moving average crossover strategy. The strategy involves using two simple moving averages (SMAs) - a short-term SMA with a period of 20 and a long-term SMA with a period of 200 - on a 2-minute timeframe chart.
When the short-term SMA crosses above the long-term SMA, it signals a potential bullish trend and traders may look for opportunities to enter a long position. Conversely, when the short-term SMA crosses below the long-term SMA, it signals a potential bearish trend and traders may look for opportunities to enter a short position.
Traders using this strategy may also look for additional confirmations, such as price action signals or other technical indicators, before entering or exiting a trade. It is important to note that no trading strategy can guarantee profits, and traders should always use risk management techniques to limit potential losses.
This script is an implementation of the 2 SMA's (can also choose other types of MA's), with Elephant Bar Indicator (EBI) and the Tail Bars Indicator in TradingView.
The Elephant Bar Indicator is a technical indicator used in trading to identify potential trend reversals in the market. It is named after the large size of the bullish or bearish candlestick that it represents. The Tail Bars Indicator is a pattern recognition technique that identifies candlestick patterns with long tails or wicks.
The script starts by defining the input parameters for both indicators. For the Elephant Bar Indicator, the user inputs the lookback period and the size multiplier. For the Tail Bars Indicator, the user inputs the tail ratio and opposite wick ratio.
Next, the script calculates the moving averages of the closing price over the defined short and long periods using the Moving Average function. The script then calculates the average candle size and volume over the lookback period.
The script then identifies the Elephant Bars and Tail Bars using the input parameters and additional conditions. For Elephant Bars, the script identifies bullish and bearish bars that meet certain criteria, such as a size greater than the average candle size and volume greater than the average volume.
For Tail Bars, the script identifies bullish and bearish bars that have long tails or wicks and meet certain criteria such as opposite wick size less than or equal to the tail size multiplied by the input opposite wick ratio.
Finally, the script plots the Elephant Bar and Tail Bar signals on the chart using different colors and shapes. The script also plots the moving averages and Keltner Channels to help traders identify potential trend reversals.
It is still under development, so please, if someone has ideas to add, more than welcome
Legend Scanning System - Telegram SenderHello traders, I'm Only Fibonacci.
This is what i posted, not really an indicator or strategy. An alarm mechanism.
What does it do?
First, you select a period during which the vehicle will scan.
Then, with this system, you adjust the settings of the strategies installed on our vehicle. Then you select forty symbols and specify which strategy you want the symbols to be scanned.
We come to the alarm setting screen, select the alarm, and enter your telegram bot's token-hosted message request link from the webhook section. You should contact me for assistance in these matters.
You can see most of the settings in the image below.
You can see most of the settings in the image below.
Important note: The period of the open graph must be less than the scanned period. Otherwise, the results may be erroneous.
Strategies will be constantly updated and become more customizable.
Proper use of this tool gives you:
It serves to scan different strategies on forty symbols different instruments of your choice. And not only that, you will receive these results in telegram.
The strategies loaded in these scans consist of the strategies in the techniques section in tradingview.
Vigilant Asset Allocation G4 Backtesting EngineThis script was based off of an idea that @CubanEmissary had so the description and some of the code that @CubanEmissary built on TradingView was used.
Vigilant Asset Allocation G4 (VAA G4) is a dual-momentum based investment strategy that aggressively monitors the market and reallocates portfolio funds based on the relative momentums of user-defined risk assets and safety assets. It was created by Wouter Keller and JW Keuning, based on their paper "Breadth Momentum and Vigilant Asset Allocation." In contrast to traditional dual momentum strategies, VAA G4 monitors the market itself through the two asset types. When all risk assets have positive momentum, the portfolio is allocated entirely into the risk asset with the strongest momentum At any other time, the portfolio is allocated entirely into the safety asset with the strongest momentum. The combination of breadth momentum with a very defensive reallocation trigger results in a strategy which captures alpha consistently.
The Strategy Rules:
1. Calculate each asset's momentum score on each monthly close:
momentumScore = (12*(currentMonthlyClose/lastMonthlyClose))+(4*(currentMonthlyClose/thirdLastMonthlyClose))+(2*(currentMonthlyClose/sixthLastMonthlyClose))+(currentMonthlyClose/twelvethLastMonthlyClose)-19
2. If all risk asset momentums are positive, allocate entire portfolio to the risk asset with the strongest momentum.
3. If any risk asset's momentum is negative, allocate entire portfolio to the safety asset with the strongest momentum.
4. Reevaluate at the end of each month.
Caveats:
1. It seems like TradingView only has limited price data for these tickers that are listed in the strategy. So it is best to start the strategy when they all have ample data (~ June 2nd, 2008)
2. This backtesting engine is basic and doesn't account for slippage and trading fees. So I implemented a basic "trading fee" input that will subtract a trading fee whenever the strategy makes a trade at the end of the month.
3. It is assumed in this engine that the trades will be made the exact second a new monthly bar opens up.
4. MUST USE ON MONTHLY CHART. It is hard-coded to work on monthly chart, if you open it on a daily chart , the Sharpe, Sortino, & CAGR calculations might not be right as well as the momentum score

ikulichkov: Dynamic Support and Resistance LevelsIntroduction:
In this TradingView community post, we will introduce the "ikulichkov: Dynamic Support and Resistance Levels" strategy. This strategy aims to identify dynamic support and resistance levels based on recent price movements.
Strategy Overview:
The "ikulichkov: Dynamic Support and Resistance Levels" strategy uses the highest high and lowest low over a specified period to determine dynamic support and resistance levels. The period parameter can be adjusted by the user to customize the strategy for their specific trading needs.
The strategy creates two plots, the dynamic resistance level and the dynamic support level, as well as two reference lines for the highest high price and lowest low price over the period.
The dynamic resistance level and dynamic support level are calculated using the current close price, the previous dynamic level, and the specified period. If the close price is higher than the previous dynamic resistance level, then the dynamic resistance level is updated to the current close price. Otherwise, the dynamic resistance level is adjusted by subtracting the difference between the previous dynamic resistance level and the current close price divided by the specified period. The dynamic support level (flc) is calculated in a similar manner but with the opposite direction.
Trading Rules:
It's important to note that the strategy only identifies potential support and resistance levels based on recent price movements. The user is responsible for making trading decisions based on their own analysis and risk management strategy.
One possible trading strategy using this indicator is to buy when the price bounces off the dynamic support level and sell when the price reaches the dynamic resistance level. Traders may also use other indicators or chart patterns to confirm the support or resistance levels identified by this strategy.
Conclusion:
In conclusion, the "ikulichkov: Dynamic Support and Resistance Levels" strategy is a useful tool for identifying dynamic support and resistance levels based on recent price movements. The strategy is customizable, allowing traders to adjust the period parameter to fit their specific trading needs. As always, traders should conduct their own analysis and risk management strategy when using any trading strategy or indicator.
