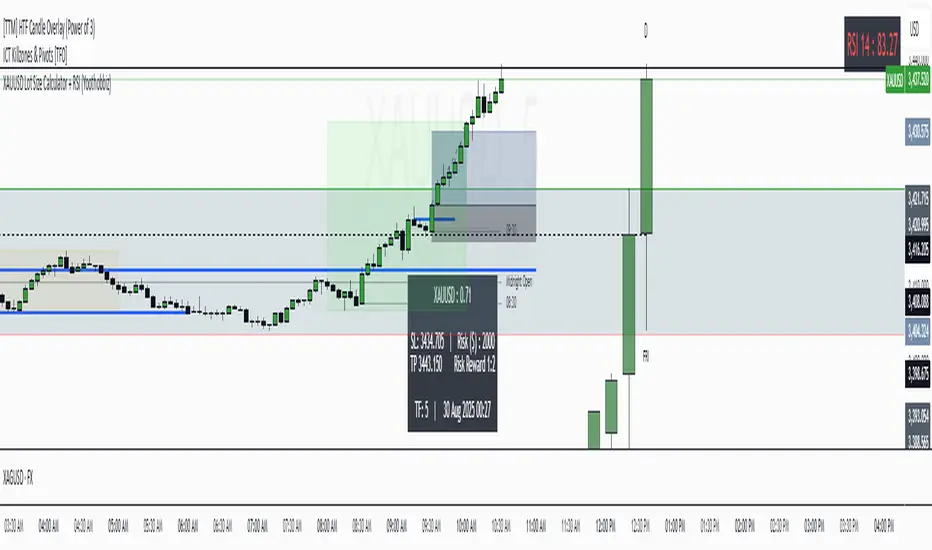
XAUUSD Lot Size Calculator + RSI (Yoothobbiz)This indicator is designed for Gold traders on the 5-minute timeframe (M5) who want a clear and editable lot size, stop loss, and take profit calculator directly on their chart.
✨ Features:
📌 Dynamic Lot Size Calculation – based on account capital, chosen risk %, and stop loss distance.
⚖️ Risk/Reward Management – automatically displays TP level using a customizable risk/reward ratio (e.g., 1:2, 1:3, etc.).
🛑 Stop Loss in Points & Price – calculates SL from recent M5 highs/lows, including spread.
🎯 Take Profit in Price & Points – automatically adjusted to your risk/reward ratio.
💵 Risk in USD – instantly shows how much capital is at risk per trade.
🕒 Custom Time Zone Support – displays the real trading time (default UTC-4 for New York), fully editable for any user.
⏱ Timeframe Label – clearly shows the working timeframe (M5 by default).
🎨 Fully Editable Display Panel:
Position (6 corners available).
Font family, size, style (bold/italic).
Text and background colors.
Adjustable spacing between lines.
🔑 How to Use:
Set your capital and risk % in the settings.
Adjust spread (in points) if needed.
Choose your risk/reward ratio.
The panel will display:
Recommended lot size for XAUUSD
Stop loss (price + points)
Take profit (price + ratio)
Risk in $
Timeframe & real-time clock
📍 Notes:
Optimized for XAUUSD (Gold) and the 5M timeframe.
Works on any asset/timeframe, but SL logic is based on M5 candle highs/lows.
Ideal for traders who want a fast and disciplined risk management tool right on their chart.
Cari skrip untuk "text"
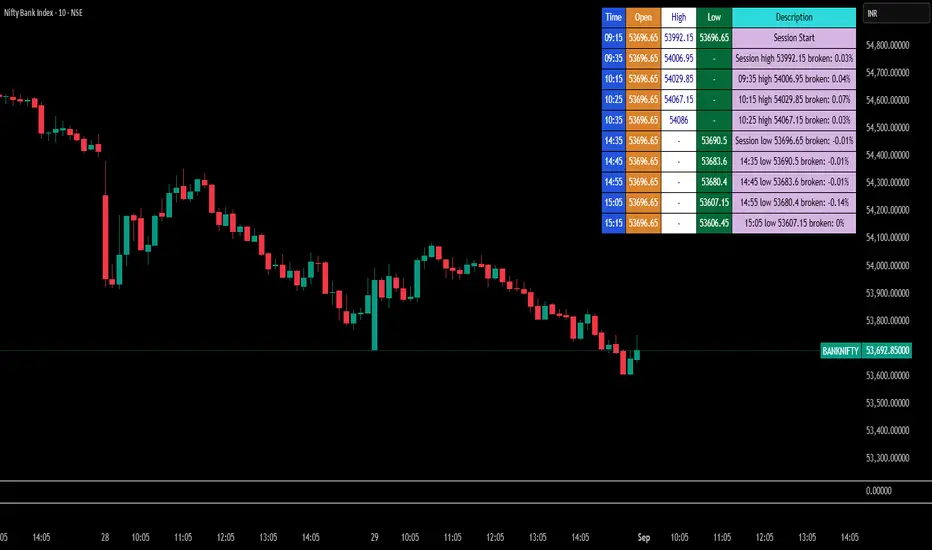
Break Point Record Table — GSK-VIZAG-AP-INDIA "Break Point Record Table — GSK-VIZAG-AP-INDIA" indicator captures key break points during each trading session and presents a clear, color-coded table overlay on the chart for quick visual reference. Specifically, it logs sessions' open price and monitors subsequent price action for notable breaks in the session high or low prices. Each break event is recorded with the time, price, and percentage change from the previous break, helping traders identify significant price movements within the session at a glance.
Key Features:
Records the session start time and opening price for context.
Tracks every intraday break above the previous session high or below the previous session low.
Calculates and displays the percentage change at each break event.
Highlights breaks with descriptive text including break time and values to aid trade decision-making.
Displays a table with columns for Time, Open, High, Low, and a Description of the event.
Uses color-coded cells to differentiate between session start, highs, lows, and break descriptions for better readability.
Maintains performance and readability by limiting the table to the latest 30 break events.
Usage & Benefits:
This indicator is ideal for intraday traders who want reliable visual cues to monitor momentum shifts and breakout/breakdown points during the trading day. By capturing these break points as discrete events and organizing the data into an easily accessible, visually intuitive table, it improves situational awareness and supports timely trading decisions.
Elliott Wave [BigBeluga]🔵 OVERVIEW
Elliott Wave automatically finds and draws an Elliott-style 5-wave impulse and a dashed projection for a potential -(a)→(b)→(c) correction. It detects six sequential reversal points from rolling highs/lows — 1, 2, 3, 4, 5, (a) — validates their relative placement, and then renders the wave with labels and horizontal reference lines. If price invalidates the structure by closing back through the Wave-5 level inside a 100-bar window, the pattern is cleared (optionally kept as “broken”) while key dotted levels remain for context.
🔵 CONCEPTS
Reversal harvesting from extremes : The script scans highest/lowest values over a user-set Length and stores swing points with their bar indices.
Six-point validation : A pattern requires six pivots (1…5 and (a)). Their vertical/temporal order must satisfy Elliott-style constraints before drawing.
Impulse + projection : After confirming 1→5, the tool plots a curved polyline through the pivots and a dashed forward path from (a) toward (b) (midpoint of 5 and (a)) and back to (c).
Risk line (invalidator) : The Wave-5 price is tracked; a close back through it within 100 bars marks the structure as broken.
Minimal persistence : When broken, the wave drawing is removed to avoid noise, while dotted horizontals for waves 5 and 4 remain as reference.
🔵 FEATURES
Automatic pivot collection from rolling highs/lows (user-controlled Length ).
Wave labeling : Points 1–5 are printed; the last collected swing is marked b
. Projected i
& i
are shown with a dashed polyline.
Breaker line & cleanup : If price closes above Wave-5 (opposite for bears) within 100 bars, the pattern is removed; only dotted levels of 5 and 4 stay.
Styling controls :
Length (pivot sensitivity)
Text Size for labels (tiny/small/normal/large)
Wave color input
Show Broken toggle to keep invalidated patterns visible
Lightweight memory : Keeps a compact buffer of recent pivots/draws to stay responsive.
🔵 HOW TO USE
Set sensitivity : Increase Length on noisy charts for cleaner pivots; decrease to catch earlier/shorter structures.
Wait for confirmation : Once 1→5 is printed and (a) appears, use the Wave-5 line as your invalidation. A close back through it within ~100 bars removes the active wave (unless Show Broken is on).
Plan with the dashed path : The (a)→(b)→(c) projection offers a scenario for potential corrective movement and risk placement.
Work MTF : Identify cleaner waves on higher TFs; refine execution on lower TFs near the breaker or during the move toward (b).
Seek confluence : Align with structure (S/R), volume/Delta, or your trend filter to avoid counter-context trades.
🔵 CONCLUSION
Elliott Wave systematizes discretionary wave analysis: it detects and labels the 5-wave impulse, projects a plausible (a)-(b)-(c) path, and self-cleans on invalidation. With clear labels, dotted reference levels, and a practical breaker rule, it gives traders an objective framework for scenario planning, invalidation, and timing.

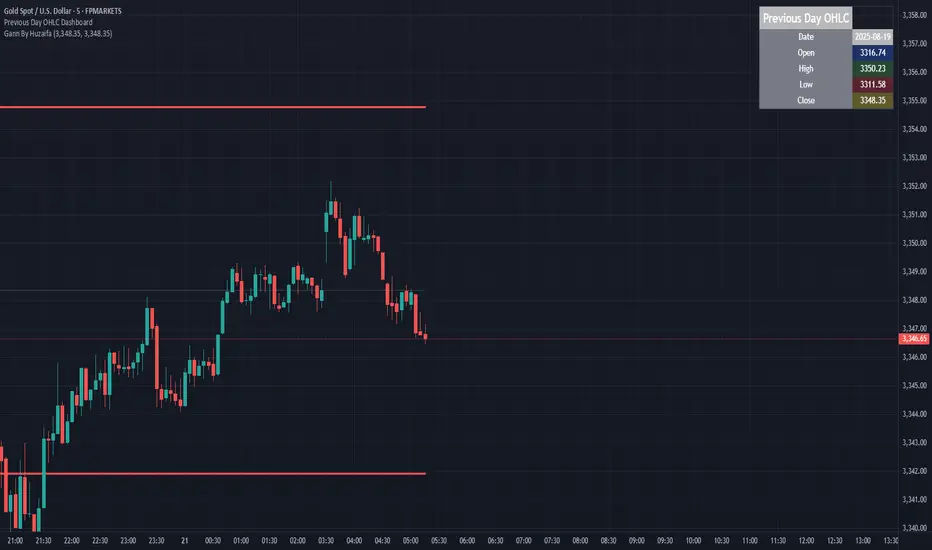
Previous Day OHLC Dashboard (Last N Days)Indicator: Previous Day OHLC Dashboard (Multi-Day)
This indicator displays a dashboard-style table on your chart that shows the Open, High, Low, and Close (OHLC) of the previous trading days. It’s designed to help traders quickly reference key daily levels that often act as important support and resistance zones.
🔑 Features:
Dashboard Table: Shows OHLC data for the last N trading days (default = 3, up to 10).
Customizable Appearance:
Change the position of the dashboard (Top-Right, Top-Left, Bottom-Right, Bottom-Left).
Adjust text size (Tiny → Huge).
Customize colors for header, labels, and each OHLC column.
Yesterday’s OHLC Lines (optional): Plots horizontal lines on the chart for the previous day’s Open, High, Low, and Close.
Intraday & Multi-Timeframe Compatible: Works on all timeframes below Daily — values update automatically from the daily chart.
📊 Use Cases:
Quickly identify yesterday’s key levels for intraday trading.
Track how current price reacts to previous day’s support/resistance.
Keep a multi-day reference for trend bias and range context.
⚙️ How it Works:
The indicator pulls daily OHLC values using request.security() with lookahead_on to ensure prior day’s values are extended across the next session.
These values are displayed in a compact table for quick reference.
Optionally, the most recent daily levels (D-1) are plotted as chart lines.
✅ Perfect for day traders, scalpers, and swing traders who rely on yesterday’s price action to plan today’s trades.
Follow-up Buy / Sell Volume Pressure at Supply / Demand Zones█ Overview:
BE-Volume Footprint & Pressure Candles, is an indicator which is preliminarily designed to analyze the supply and demand patterns based on Rally Base Rally (RBR), Drop Base Drop (DBD), Drop Base Rally (DBR) & Rally Base Drop (RBD) concepts in conjunction to volume pressure. Understanding these concepts are crucial. Let's break down why the "Base" is you Best friend in this context.
Commonness in RBR, DBD, DBR, RBD patterns ?
There is an impulse price movement at first, be it rally (price moving up) or the Drop (price moving down), followed by a period of consolidation which is referred as "BASE" and later with another impulse move of price (Rally or Drop).
Why is the Base Important
1. Market Balance: Base represents a balance between buyers and sellers. This is where decisions are made.
2. Confirmation: It confirms the strength of previous impulse move which has happened.
Base & the Liquidity Play:
Supply & Demand Zone predict the presence of all large orders within the limits of the Base Zone. Price is expected to return to the zone to fill the unfilled orders placed by large players.
For the price to move in the intended direction Liquidity plays the major role. hence indicator aims to help traders in identifying those zones where liquidity exists and the volume pressure helps in confirming that liquidity is making its play.
Bottom pane in the below snapshots is a visual representation of Buyers volume pressure (Green Line & the Green filled area) making the price move upwards vs Sellers volume pressure (Red Line & the Red filled area) making the price move downwards.
Top pane in the below snapshots is a visual representation on the pattern identification (Blue marked zone & the Blue line referred as Liquidity level)
Bullish Pressure On Buy Liquidity:
Bearish Pressure On Sell Liquidity:
█ How It Works:
1. Indicator computes technical & mathematical operations such as ATR, delta of Highs & Lows of the candle and Candle ranges to identify the patterns and marks the liquidity lines accordingly.
2. Indicator then waits for price to return to the liquidity levels and checks if Directional volume pressure to flow-in while the prices hover near the Liquidity zones.
3. Once the Volume pressure is evident, loop in to the ride.
█ When It wont Work:
When there no sufficient Liquidity or sustained Opposite volume pressure, trades are expected to fail.
█ Limitations:
Works only on the scripts which has volume info. Relays on LTF candles to determine intra-bar volumes. Hence, Use on TF greater than 1 min and lesser than 15 min.
█ Indicator Features:
1. StrictEntries: employs' tighter rules (rather most significant setups) on the directional volume pressure applied for the price to move. If unchecked, liberal rules applied on the directional volume pressure leading to more setups being identified.
2. Setup Confirmation period: Indicates Waiting period to analyze the directional volume pressure. Early (lesser wait period) is Risky and Late (longer wait period) is too late for the
ride. Find the quant based on the accuracy of the setup provided in the bottom right table.
3. Algo Enabled with Place Holders:
Indicator is equipped with algo alerts, supported with necessary placeholders to trade any instrument like stock, options etc.
Accepted PlaceHolders (Case Sensitive!!)
1. {{ticker}}-->InstrumentName
2. {{datetime}}-->Date & Time Of Order Placement
3. {{close}}-->LTP Price of Script
4. {{TD}}-->Current Level:
Note: Negative Numbers for Short Setup
5. {{EN}} {{SL}} {{TGT}} {{T1}} {{T2}} --> Trade Levels
6. {{Qty}} {{Qty*x}} --> Qty -> Trade Qty mapped in Settings. Replace x with actual number of your choice for the multiplier
7. {{BS}}-->Based on the Direction of Trade Output shall be with B or S (B == Long Trade & S == Short Trade)
8. {{BUYSELL}}-->Based on the Direction of Trade Output shall be with BUY or SELL (BUY == Long Trade & SELL == Short Trade)
9. {{IBUYSELL}}-->Based on the Direction of Trade Output shall be with BUY or SELL (BUY == SHORT Trade & SELL == LONG Trade)
Dynamic Alerts:
10. { {100R0} }-->Dynamic Place Holder 100 Refers to Strike Difference and Zero refers to ATM
11. { {100R-1} }-->Dynamic Place Holder 100 Refers to Strike Difference and -1 refers to
ATM - 100 strike
12. { {50R2} }-->Dynamic Place Holder 50 Refers to Strike Difference and 2 refers to
ATM + (2 * 50 = 100) strike
13. { {"ddMMyy", 0} }-->Dynamically Picks today date in the specified format.
14. { {"ddMMyy", n} }-->replace n with actual number of your choice to Pick date post today date in the specified format.
15. { {"ddMMyy", "MON"} }-->dynamically pick Monday date (coming Monday, if today is not Monday)
Note. for the 2nd Param-->you can choose to specify either Number OR any letter from =>
16. {{CEPE}} {{ICEPE}} {{CP}} {{ICP}} -> Dynamic Option Side CE or C refers to Calls and PE or P refers to Puts. If "I" is used in PlaceHolder text, On long entries PUTs shall be used
Indicator is equipped with customizable Trade & Risk management settings like multiple Take profit levels, Trailing SL.

Signal Hunter Pro - GKDXLSignal Hunter Pro - GKDXL combines four powerful technical indicators with trend strength filtering and volume confirmation to generate reliable BUY/SELL signals. This indicator is perfect for traders who want a systematic approach to market analysis without the noise of conflicting signals.
🔧 Core Features
📈 Multi-Indicator Signal System
Moving Averages: EMA 20, EMA 50, and SMA 200 for trend analysis
Bollinger Bands: Dynamic support/resistance with price momentum detection
RSI: Enhanced RSI logic with smoothing and multi-zone analysis
MACD: Traditional MACD with signal line crossovers and zero-line analysis
🎛️ Advanced Filtering System
ADX Trend Strength Filter: Only signals when trend strength exceeds threshold
Volume Confirmation: Ensures signals occur with adequate volume participation
Multi-Timeframe Logic: Works on any timeframe from 1m to 1D and beyond
🚨 Intelligent Signal Generation
Requires 3 out of 4 indicators to align for signal confirmation
Separate bullish and bearish signal conditions
Real-time signal strength scoring (1/4 to 4/4)
Built-in alert system for automated notifications
⚙️ Customizable Parameters
📊 Technical Settings
Moving Averages: Adjustable EMA and SMA periods
Bollinger Bands: Configurable length and multiplier
RSI: Customizable length, smoothing, and overbought/oversold levels
MACD: Flexible fast, slow, and signal line settings
🎯 Risk Management
Risk Percentage: Set your risk per trade (0.1% to 10%)
Reward Ratio: Configure risk-to-reward ratios (1:1 to 1:5)
ADX Threshold: Control minimum trend strength requirements
🖥️ Display Options
Indicator Visibility: Toggle individual indicators on/off
Information Table: Optional detailed status table (off by default)
Volume Analysis: Real-time volume vs. average comparison
🎨 Visual Elements
📈 Chart Indicators
EMA Lines: Blue (20) and Orange (50) exponential moving averages
SMA 200: Gray long-term trend line
Bollinger Bands: Upper/lower bands with semi-transparent fill
Clean Interface: Minimal visual clutter for clear analysis
📋 Information Table (Optional)
Real-time indicator status with ✓/✗/— symbols
Current signal strength and direction
ADX trend strength measurement
Volume confirmation status
No-signal reasons when conditions aren't met
🔔 Alert System
📢 Three Alert Types
BUY Signal: Triggered when 3+ indicators align bullishly
SELL Signal: Triggered when 3+ indicators align bearishly
General Alert: Any signal detection for broader monitoring
📱 Alert Messages
Clear, actionable alert text
Includes indicator name for easy identification
Compatible with webhook integrations
🎯 How It Works
📊 Signal Logic
Indicator Assessment: Each of the 4 indicators is evaluated as Bullish/Bearish/Neutral
Consensus Building: Counts aligned indicators (minimum 3 required)
Filter Application: Applies trend strength and volume filters
Signal Generation: Generates BUY/SELL when all conditions are met
🔍 Indicator States
Moving Averages: Price position, EMA alignment, and crossovers
Bollinger Bands: Price relative to bands and momentum shifts
RSI: Multi-zone analysis with momentum and crossover detection
MACD: Signal line crossovers and zero-line positioning
🎉 Why Choose Signal Hunter Pro?
✅ Multi-Indicator Confirmation reduces false signals
✅ Trend Strength Filtering improves win rate
✅ Volume Confirmation ensures market participation
✅ Customizable Parameters adapt to any trading style
✅ Clean Visual Design doesn't clutter your charts
✅ Professional Alert System for automated trading
✅ No Repainting - reliable historical signals
✅ Works on All Timeframes from scalping to investing

Range TableThe Range Table indicator calculates and displays the Daily Average True Range (ATR), the current day's True Range (TR), and two customizable ATR percentage values in a clean table format. It provides values in ticks, points, and USD, helping traders set stop-loss buffers based on market volatility.
**Features:**
- Displays the Daily ATR (14-period) and current day's True Range (TR) with its percentage of the Daily ATR.
- Includes two customizable ATR percentages (default: 75% and 10%, with the second disabled by default).
- Shows values in ticks, points, and USD based on the symbol's tick size and point value.
- Customizable table position, background color, text color, and font size.
- Toggle visibility for the table and percentage rows via input settings.
**How to Use:**
1. Add the indicator to your chart.
2. Adjust the table position, colors, and font size in the input settings.
3. Enable or disable the 75% and 10% ATR rows or customize their percentages.
4. Use the displayed values to set stop-loss or take-profit levels based on volatility.
**Ideal For:**
- Day traders and swing traders looking to set volatility-based stop-losses.
- Users analyzing tick, point, and USD-based risk metrics.
**Notes:**
- Ensure your chart is set to a timeframe that aligns with the daily ATR calculations.
- USD values are approximate if `syminfo.pointvalue` is unavailable.
Developed by FlyingSeaHorse.

Smart Money Trades Pro [BOSWaves]Smart Money Trades Pro – Advanced Market Structure & Liquidity Visualizer
Overview
Smart Money Trades Pro is a comprehensive trading tool designed for traders seeking an in-depth understanding of market structure, liquidity dynamics, and institutional flow. The indicator systematically identifies key market turning points, including break of structure (BOS) and change of character (CHoCH) events, and overlays these with adaptive visualizations to highlight high-probability trade setups. By integrating ATR-based risk zones, progressive take-profit levels, and real-time trade analytics, Smart Money Trades Pro transforms complex price action into an interpretable framework suitable for multiple trading styles, including scalping, intraday, and swing trading.
Unlike traditional static indicators, Smart Money Trades Pro adapts continuously to market conditions. It evaluates swing highs and lows over a configurable lookback period, then determines structural breaks using customizable confirmation methods (candle body or wick). The resulting signals are augmented with dynamic entry, stop-loss, and target levels, allowing traders to analyze potential trade opportunities with both precision and context. The indicator’s design ensures that each visual element—trend-colored candles, signal markers, and risk/reward boxes—reflects real-time market conditions, offering an actionable interpretation of institutional activity.
How It Works
The indicator’s foundation is built upon market structure analysis. By calculating pivot highs and lows over a specified period, Smart Money Trades Pro identifies potential points of liquidity accumulation and exhaustion. When price breaks a pivot high or low, the indicator evaluates whether this constitutes a BOS or a CHoCH, signaling trend continuation or reversal. These events are marked on the chart with distinct visual cues, allowing traders to quickly discern shifts in market sentiment without manually analyzing historical price action.
Once a structural break is confirmed, the indicator automatically determines entry levels, stop-loss placements, and progressive take-profit zones (TP1, TP2, TP3). These calculations are based on ATR-derived volatility, ensuring that targets scale with current market conditions. Risk and reward zones are plotted as shaded boxes, providing a clear visual representation of potential profit relative to risk for each trade setup. This system allows traders to maintain discipline and consistency, with dynamic trade management baked directly into the visualization.
Trend direction is further reinforced by color-coded candles, which reflect the prevailing market bias. Bullish trends are represented by one color, bearish trends by another, and neutral conditions are displayed in muted tones. This continuous visual feedback simplifies the process of trend assessment and helps confirm the validity of trade setups alongside BOS and CHoCH markers.
Signals and Breakouts
Smart Money Trades Pro includes structured visual signals to indicate actionable price movements:
Bullish Break Signals – Triangular markers below the candle appear when a swing high is broken, suggesting potential long opportunities.
Bearish Break Signals – Triangular markers above the candle appear when a swing low is broken, indicating potential short setups.
Change of Character (CHoCH) – Special markers highlight trend reversals, showing where momentum shifts from bullish to bearish or vice versa.
These markers are strategically spaced to prevent overlap and remain clear during high-volatility periods. Traders can use them in combination with trend-colored candles, risk/reward zones, and ATR-based targets to assess the strength and reliability of each setup. The integrated table provides live trade information, including entry price, stop-loss level, take-profit levels, risk/reward ratio, and trade direction, ensuring that trade decisions are informed and data-driven.
Interpretation
Trend Analysis : The indicator’s trend coloring, combined with BOS and CHoCH detection, provides an immediate view of market direction. Rising structures indicate bullish momentum, while falling structures signal bearish momentum. CHoCH markers highlight potential trend reversals or significant liquidity sweeps.
Volatility and Risk Assessment : ATR-based calculations determine stop-loss distances and target levels, giving a quantitative measure of risk relative to market volatility. Wide ATR readings indicate periods of high price fluctuation, whereas narrow readings suggest consolidation and reduced risk exposure.
Market Structure Insights : By monitoring swing highs and lows alongside break confirmations, traders can identify where institutional players are likely active. Areas with multiple structural breaks or overlapping targets can indicate liquidity hotspots, potential reversal zones, or areas of market congestion.
Trade Management : The built-in trade zones allow traders to visualize entry, risk, and reward simultaneously. Progressive targets (TP1, TP2, TP3) reflect incremental profit-taking strategies, while dynamic stop-loss levels help preserve capital during adverse moves.
Strategy Integration
Smart Money Trades Pro supports a range of trading approaches:
Trend Following : Enter trades in the direction of confirmed BOS while using CHoCH markers and trend-colored candles to validate momentum.
Pullback Entries : Use failed breakout retests or minor reversals toward broken structure levels for lower-risk entries.
Mean Reversion : In consolidated zones with narrow ATR and repeated BOS/CHoCH activity, anticipate reversals or short-term corrective moves.
Multi-Timeframe Confirmation : Overlay signals on higher or lower timeframes to filter noise and improve trade accuracy.
Stop-loss levels should be placed just beyond the opposing structural point, while take-profit targets can be scaled using the ATR-based zones. Progressive targets allow for partial exits or scaling out of trades while maintaining exposure to larger moves.
Advanced Techniques
Traders seeking greater precision can combine Smart Money Trades Pro with volume, momentum, or volatility indicators to validate signals. Observing sequences of BOS and CHoCH markers across multiple timeframes provides insight into liquidity accumulation and depletion trends. Tracking the expansion or contraction of ATR-based zones helps anticipate shifts in volatility, enabling better timing for entries and exits.
Customizing the structure period and confirmation type allows the indicator to adapt to different asset classes and timeframes. Shorter periods increase sensitivity to smaller swings, while longer periods filter noise and emphasize higher-probability structural breaks. By integrating these features, the indicator offers a robust statistical framework for disciplined, data-driven trading decisions.
Inputs and Customization
Structure Detection Period : Defines the lookback window for pivot high and low calculation.
Break Confirmation : Choose whether to confirm breaks using candle body or wick.
Display CHoCH : Toggle visibility of change-of-character markers.
Color Trend Bars : Enable color-coding of candles based on market structure direction.
Show Info Table : Display trade dashboard showing entry, stop-loss, take-profits, risk/reward, and bias.
Table Position : Choose from top-left, top-right, bottom-left, or bottom-right placement.
Color Customization : Configure bullish, bearish, neutral, risk, reward, and text colors for enhanced visual clarity.
Why Use Smart Money Trades Pro
Smart Money Trades Pro transforms complex market behavior into an actionable visual framework. By combining market structure analysis, liquidity tracking, ATR-based risk/reward mapping, and a dynamic trade dashboard, it provides a multidimensional view of the market. Traders can focus on execution, interpret trends, and evaluate overextensions or reversals without relying on guesswork. The indicator is suitable for scalping, intraday, and swing strategies, offering a comprehensive system for understanding and trading alongside institutional participants.

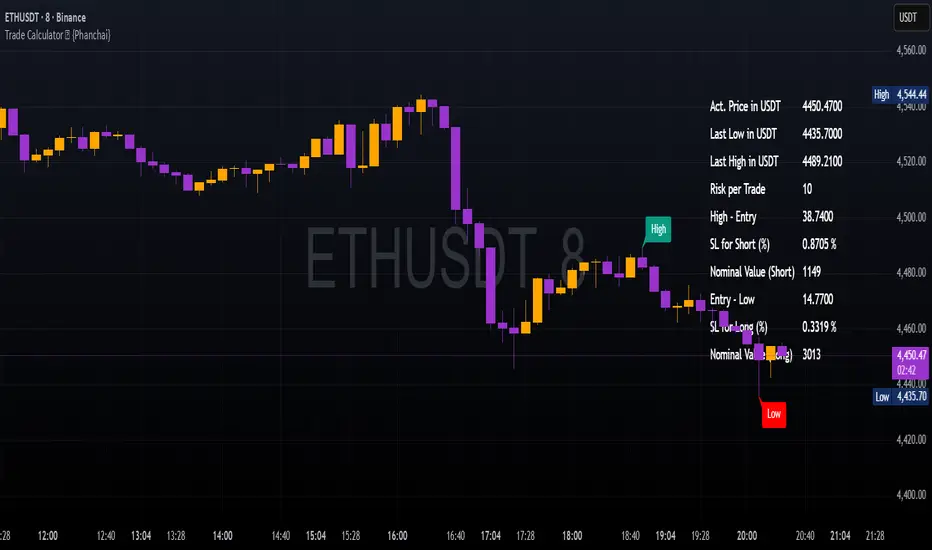
Trade Calculator {Phanchai}Trade Calculator 🧮 {Phanchai} — Documentation
A lightweight sizing helper for TradingView that turns your risk per trade into an estimated maximum nominal position size — using the most recent chart low as your stop reference. Built for speed and clarity right on the chart.
Key Features
Clean on-chart info table with configurable font size and position.
Row toggles: show/hide each line (Price, Last Low, Risk per Trade, Entry − Low, SL to Low %, Max. Nominal Value in USDT).
Configurable low reference: Last N bars or Running since load .
Low label placed exactly at the wick of the lowest bar (no horizontal line).
Custom padding: add extra rows above/below and blank columns left/right (with custom whitespace/text fillers) to fine-tune layout.
Integer display for Risk per Trade (USDT) and Max. Nominal Value (USDT); decimals configurable elsewhere.
Open source script — easy to read and extend.
How to Use
Add the indicator: open TradingView → Indicators → paste the source code → Add to chart.
Pick your low reference in settings:
Last N bars — uses the lowest low within your chosen lookback.
Running since load — tracks the lowest low since the script loaded.
Set your capital and risk:
Total Capital — your account size in USDT.
Max. invest Capital per Trade (%) — your risk per trade as a percent of Total Capital.
Tidy the table:
Use Table Position and Table Size to place it.
Add Extra rows/columns and set left/right fillers (spaces allowed) for padding.
Toggle individual rows (on/off) to show only what you need.
Read the numbers:
Act. Price in USDT — current close.
Last Low in USDT — stop reference price.
Risk per Trade — whole-USDT value of your risk budget for this trade.
Entry − Low — absolute risk per unit.
SL to Low (%) — percentage distance from price to low.
Max. Nominal Value in USDT — estimated max nominal position size given your risk budget and stop at the low.
Scope
This calculator is designed for long trades only (stop below price at the chart low).
Notes & Assumptions
Does not factor fees, funding, slippage, tick size, or broker/venue position limits.
“Running since load” updates as new lows appear; “Last N bars” uses only the selected lookback window.
If price equals the low (zero distance), sizing will be undefined (division by zero guarded as “—”).
Risk Warning
Trading involves substantial risk. Always double-check every value the calculator shows, confirm your stop distance, and verify position sizing with your broker/platform before entering any order. Never risk money you cannot afford to lose.
Open Source & Feedback
The source code is open. If you spot a bug or have an idea to improve the tool, feel free to share suggestions — I’m happy to iterate and make it better.
JL - Market HeatmapThis indicator plots a static table on your chart that displays any tickers you want and their % change on the day so far.
It updates in real time, changes color as it updates, and has several custom functions available for you:
1. Plot up to 12 tickers of your choice
2. Choose a layout with 1-4 rows
3. Display % Change or Not
4. Choose your font size (Tiny, Small, Normal, Large)
5. Up/Down Cell Colors (% change dependent)
6. Up/Down Text Colors (high contrast to your color choices)
The purpose of the indicator is to quickly measure a broad basket of market instruments to paint a more context-rich perspective of the chart you are looking at.
I hope this indicator can help you (and me) accomplish this task in a simple, clean, and seamless manner.
Thanks and enjoy - Jack

MACD StrategyOverview
The "MACD Strategy" is a straightforward trading strategy tested for BTCUSDT Futures on the 1-minute timeframe, leveraging the Moving Average Convergence Divergence (MACD) indicator to identify momentum-based buy and sell opportunities. Developed with input from expert trading analyst insights, this strategy combines technical precision with risk management, making it suitable for traders of all levels on platforms like TradingView. It focuses on capturing trend reversals and momentum shifts, with clear visual cues and automated alerts for seamless integration with trading bots (e.g., Bitget webhooks).
#### How It Works
This strategy uses the MACD indicator to generate trading signals based on momentum and trend direction:
- **Buy Signal**: Triggered when the MACD line crosses above the signal line, and the MACD histogram turns positive (above zero). This suggests increasing bullish momentum.
- **Sell Signal**: Triggered when the MACD line crosses below the signal line, and the MACD histogram turns negative (below zero), indicating growing bearish momentum.
Once a signal is detected, the strategy opens a position (long for buy, short for sell) with a position size calculated based on your risk tolerance. It includes a stop-loss to limit losses and a take-profit to lock in gains, both dynamically adjusted using the Average True Range (ATR) for adaptability to market volatility.
#### Key Features
- **MACD-Based Signals**: Relies solely on MACD for entry points, plotted in a separate pane for clear momentum analysis.
- **Risk Management**: Automatically calculates position size based on a percentage of your account balance and sets stop-loss and take-profit levels using ATR multipliers and a risk:reward ratio.
- **Visual Feedback**: Plots entry, stop-loss, and take-profit lines on the chart with labeled markers for easy tracking.
- **Alerts**: Includes Bitget webhook-compatible alerts for automated trading, notifying you of buy and sell signals in real-time.
#### Input Parameters
- **Account Balance**: Default 10000 – Set your initial trading capital to determine position sizing.
- **MACD Fast Length**: Default 12 – The short-term EMA period for MACD sensitivity.
- **MACD Slow Length**: Default 26 – The long-term EMA period for MACD calculation.
- **MACD Signal Length**: Default 9 – The smoothing period for the signal line.
- **Risk Per Trade (%)**: Default 3.0 – The percentage of your account balance risked per trade (e.g., 3% of 10000 = 300).
- **Risk:Reward Ratio**: Default 3.0 – The ratio of potential profit to risk (e.g., 3:1 means risking 1 to gain 3).
- **SL Multiplier**: Default 1.0 – Multiplies ATR to set the stop-loss distance (e.g., 1.0 x ATR).
- **TP Multiplier**: Default 3.0 – Multiplies ATR to set the take-profit distance, adjusted by the risk:reward ratio.
- **Line Length (bars)**: Default 25 – Duration in bars for displaying trade lines on the chart.
- **Label Position**: Default 'left' – Position of text labels (left or right) relative to trade lines.
- **ATR Period**: Default 14 – The number of periods for calculating ATR to measure volatility.
#### How to Use
1. **Add to Chart**: Load the "MACD Strategy" as a strategy and the "MACD Indicator" as a separate indicator on your TradingView chart (recommended for BTCUSDT Futures on the 1-minute timeframe).
2. **Customize Settings**: Adjust the input parameters based on your risk tolerance and market conditions. For BTCUSDT Futures, consider reducing `Risk Per Trade (%)` during high volatility (e.g., 1%) or increasing `SL Multiplier` for wider stops.
3. **Visual Analysis**: Watch the main chart for trade entry lines (green for buy, red for sell), stop-loss (red), and take-profit (green) lines with labels. Use the MACD pane below to confirm momentum shifts.
4. **Set Alerts**: Create alerts in TradingView for "Buy Signal" and "Sell Signal" to automate trades via Bitget webhooks.
5. **Backtest and Optimize**: Test the strategy on historical BTCUSDT Futures 1-minute data to fine-tune parameters. The short timeframe requires quick execution, so monitor closely for slippage or latency.
#### Tips for Success
- **Market Conditions**: This strategy performs best in trending markets on the 1-minute timeframe. Avoid choppy conditions where MACD crossovers may produce false signals.
- **Risk Management**: Start with the default 3% risk per trade and adjust downward (e.g., 1%) during volatile periods like BTCUSDT news events. The 3:1 risk:reward ratio targets consistent profitability.
- **Timeframe**: Optimized for 1-minute charts; switch to 5-minute or 15-minute for less noise if needed.
- **Confirmation**: Cross-check MACD signals with price action or support/resistance levels for higher accuracy on BTCUSDT Futures.
#### Limitations
- This strategy relies solely on MACD, so it may lag in fast-moving or sideways markets. Consider adding a secondary filter (e.g., RSI) if needed.
- Stop-loss and take-profit are ATR-based and may need adjustment for BTCUSDT Futures’ high volatility, especially during leverage trading.
#### Conclusion
The "MACD Strategy" offers a simple yet effective way to trade momentum shifts using the MACD indicator, tested for BTCUSDT Futures on the 1-minute timeframe, with robust risk management and visual tools. Whether you’re scalping crypto futures or exploring short-term trends, this strategy provides a solid foundation for automated or manual trading. Share your feedback or customizations in the comments, and happy trading!

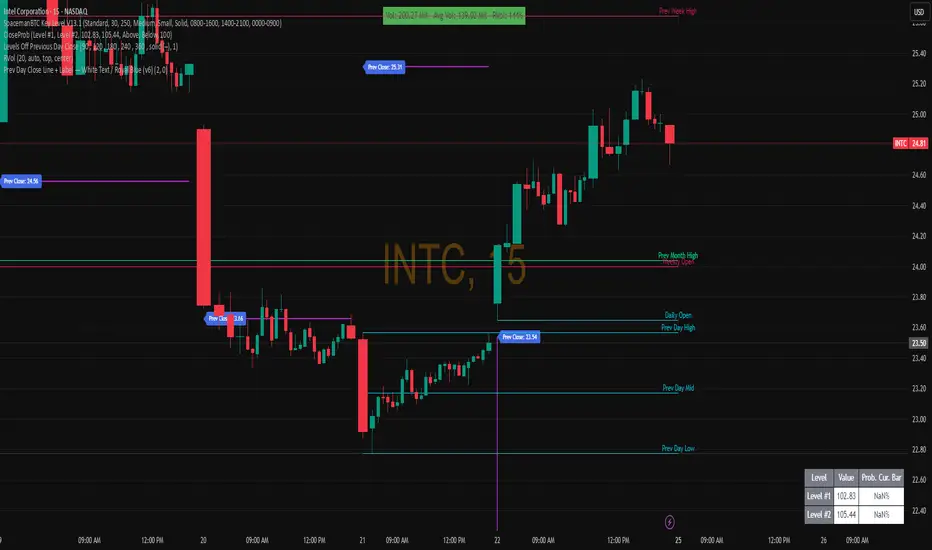
Prev Day Close Line + Label — White Text / Royal Blue (v6)Previous Day Close line with clear labeling.
- Gap up vs PDC
- Gap down vs PDC
Helps analyze what yesterday attempted to do helps to confirm whether the attempt was successful.
Trend dealing rangeHi all!
This indicator will help you find the current dealing range according to the trend. If the trend is bullish the indicator will look for a range between the latest low pivot to the latest high pivot. Vice versa in a bearish trend. The code uses my new library 'FibonacciRetracement' () that has the same code as my other indicator 'Fibonacci retracement' ().
It plots 5 lines from the low to the high and labels them 0 %, 25 %, 50 %, 75 % and 100 %. A trendline can be drawn between the two pivots (dashed and gray by default). Firstly you can define the pivot lengths used, this setting is in the 'Market structure' section but it also applies to the dealing range (it defaults to 5 (left) and 2 (right)). You can show prices if you want to (shown in parantheses, off by default). You can change the default labels position (from left) and the font size (12 by default and higher up it's 7 for market structure text). Lastly you can change the alert frequency (defaults to once per bar close) and the price that has to enter a zone for alert to be sent. 'Close' means that the closing price (or current price if you change the alert frequency to all or once per bar) has to be inside the zone and 'Wick' means that the entire candle needs to be inside the zone.
It's very useful for traders to find the current dealing range and this indicator will help you to do so.
So, this indicator will give you the dealing range and basic market structure through break of structures and change of characters.
If you have any input or suggestions on future features or bugs, don't hesitate to let me know!
Best of trading luck!

FibonacciRetracementHi all!
This library will help you draw Fibonacci retracement levels (zones). The code is from my indicator "Fibonacci retracement" (). You can see that description for more information about the behaviour and example of how to use this library. The code is almost the same with the addition of alerts. If the alert frequency is 'alert.freq_once_per_bar_close' alert messages will be concatenated and have a header saying how many messages it contains (if it's more than 1).
Hope this is of help!
Library "FibonacciRetracement"
ConcateAlerts(context)
Concatenates all alerts from the bar to one string (separated by new lines) and clears alert messages on the current bar.
Parameters:
context (Context)
AddAlert(context, message, unshiftInsteadOfPush)
Parameters:
context (Context)
message (string)
unshiftInsteadOfPush (bool)
Range(context, structure, settings)
Will return values if new levels/zones should be drawn.
Parameters:
context (Context) : The 'Context' for the Fibonacci retracement.
structure (Structure type from mickes/PriceAction/1) : The current 'Structure' from the 'MarketStructure' library.
settings (Settings) : The 'Settings' object for the 'Context'.
Returns: A tuple with the start and end pivot if new zones should be drawn, ' ' otherwise.
DrawAll(context, settings, start, end)
Draws lines and labels for the zone. It will also set the 'Price' value that will be used for absolute positions.
Parameters:
context (Context) : The 'Context' for the Fibonacci retracement.
settings (Settings) : The 'Settings' object for the 'Context'.
start (Pivot type from mickes/PriceAction/1)
end (Pivot type from mickes/PriceAction/1)
AlertActive(context, settings)
Will alert for all zones that are active. If multiple alert messages are added they will be concatenated (separated by a new line) with a header saying how many messages the alert contains.
Parameters:
context (Context) : The 'Context' for the Fibonacci retracement. This contains the zones that will be alerted if price (wick or close according to the settings) enters it.
settings (Settings) : The 'Settings' object for the 'Context'.
TrendlineSettings
Holds all the values for 'TrendlineSettings'.
Fields:
Enabled (series bool) : If the trendline should be visible or not.
Color (series color) : The color of the trendline.
Style (series string) : The style of the trendline (as a string).
GenericZonesSettings
Holds all the values for 'GenericZonesSettings', that will be applicable to all drawn objects.
Fields:
ExtendRight (series bool) : If all lines should extend to the right or not.
Style (series string) : The style of all drawn lines
Reverse (series bool) : If true, all lines will be reversed.
Prices (series bool) : If price levels should be shown or not.
Levels (series bool) : If levels should be shown or not.
LevelsValue (series string) : Either 'Value' or 'Percent'. Defined if value or percentage should be shown.
FontSize (series int) : The for size of the text in labels drawn.
LabelsPosition (series string) : Coul be 'Left', 'Rigth' or 'Adapt'. 'Adapt' will try to adapt the labels position to the prices.
ZoneSettings
Holds all the values for 'ZoneSettings'.
Fields:
Enabled (series bool) : If this zone is enabled or not.
Level (series float) : The level of the zone.
Color (series color) : The color that will be displayed.
Price (series float) : The price of the level. Will be set internally.
Settings
Holds all the values for 'Settings'.
Fields:
PivotLeftLength (series int) : The left length used to find pivots through the 'MarketStructure' library.
PivotRightLength (series int) : The right length used to find pivots through the 'MarketStructure' library.
Trendline (TrendlineSettings) : The settings for the 'Trendline' object.
GenericZonesSettings (GenericZonesSettings) : The setting applicable to all zones.
AlertFrequency (series string) : The frequency for the alerts. If 'alert.freq_once_per_bar_close', alert messages will be concatenated and have a header saying how many messages it contains (if it's more than 1).
AlertPrice (series string) : The price that has to enter a zone. Can be 'Close' (the closing price) or 'Wick' (the whole candle needs to be in the zone).
Zone1 (ZoneSettings) : The 'ZoneSettings' that represents this zone.
Zone2 (ZoneSettings) : The 'ZoneSettings' that represents this zone.
Zone3 (ZoneSettings) : The 'ZoneSettings' that represents this zone.
Zone4 (ZoneSettings) : The 'ZoneSettings' that represents this zone.
Zone5 (ZoneSettings) : The 'ZoneSettings' that represents this zone.
Zone6 (ZoneSettings) : The 'ZoneSettings' that represents this zone.
Zone7 (ZoneSettings) : The 'ZoneSettings' that represents this zone.
Zone8 (ZoneSettings) : The 'ZoneSettings' that represents this zone.
Zone9 (ZoneSettings) : The 'ZoneSettings' that represents this zone.
Zone10 (ZoneSettings) : The 'ZoneSettings' that represents this zone.
Zone11 (ZoneSettings) : The 'ZoneSettings' that represents this zone.
Zone12 (ZoneSettings) : The 'ZoneSettings' that represents this zone.
Zone13 (ZoneSettings) : The 'ZoneSettings' that represents this zone.
Zone14 (ZoneSettings) : The 'ZoneSettings' that represents this zone.
Zone15 (ZoneSettings) : The 'ZoneSettings' that represents this zone.
Zone16 (ZoneSettings) : The 'ZoneSettings' that represents this zone.
Zone17 (ZoneSettings) : The 'ZoneSettings' that represents this zone.
Zone18 (ZoneSettings) : The 'ZoneSettings' that represents this zone.
Zone19 (ZoneSettings) : The 'ZoneSettings' that represents this zone.
Zone20 (ZoneSettings) : The 'ZoneSettings' that represents this zone.
Zone21 (ZoneSettings) : The 'ZoneSettings' that represents this zone.
Zone22 (ZoneSettings) : The 'ZoneSettings' that represents this zone.
Zone23 (ZoneSettings) : The 'ZoneSettings' that represents this zone.
Zone24 (ZoneSettings) : The 'ZoneSettings' that represents this zone.
Context
Holds all the values for 'Context'.
Fields:
Lines (array) : All the drawn lines for the current 'Context'.
Labels (array) : All the drawn labels for the current 'Context'.
Boxes (array) : All the drawn boxes for the current 'Context'.
Alerts (array) : All the alert messages on the current tick.
Start (series int) : The start bar index of the current 'Context'.

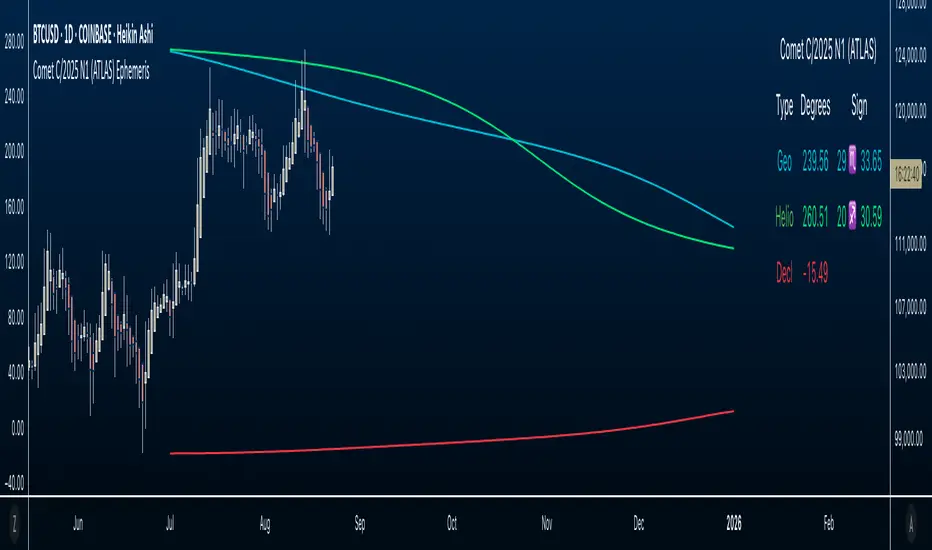
Comet C/2025 N1 (ATLAS) Ephemeris☄️ Ephemeris How-To: Plot JPL Horizons Data on TradingView (Educational)
Overview
This open-source Pine Script™ v6 indicator demonstrates how to bring external astronomical ephemeris into TradingView and plot it on a daily chart. Using Comet C/2025 N1 (ATLAS) as an example dataset, it shows the mechanics of structuring arrays, indexing by date, and drawing past and forward ( future projections ) values—strictly as an educational visualization of celestial motion.
Why This Approach
Data is generated from NASA JPL Horizons, a mission-grade, publicly available ephemeris service ( (ssd.jpl.nasa.gov)). On the daily timeframe, Horizons provides high-precision positions you can regenerate whenever solutions update—useful for educational accuracy in exploring orbital data.
What’s Plotted
- Geocentric ecliptic longitude (Earth-view)
- Heliocentric ecliptic longitude (Sun-centered)
- Declination (deg from celestial equator)
Features
- Simple arrays + date indexing (no per-row timestamps)
- Circles for historical/current bars; polylines to connect forward points, emphasizing future projections
- Toggle any series on/off via inputs
- Daily timeframe enforced (runtime error if not 1D)
- Optional table with zodiac conversion (AstroLib by BarefootJoey)
Data & Updates
The example arrays span 2025-07-01 (discovery date) → 2026-01-01. You can refresh them anytime from JPL Horizons (Observer: Geocentric; daily step; include ecliptic lon/lat and declination) and paste the new values into the script.
How we pulled the ephemeris from JPL Horizons (quick guide):
0) Open ssd.jpl.nasa.gov System
1. Ephemeris Type: Observer Table
2. Target Body: C/2025 N1 (ATLAS) (or any object you want)
3. Observer Location: Geocentric
4. Time Specification: set Start, Stop, Step = 1 day
5. Table Settings → Quantities:
* Astrometric RA & Dec
* Heliocentric ecliptic longitude & latitude
* Observer (geocentric) ecliptic longitude & latitude
6. Additional Table Settings:
* Calendar format: Gregorian
* Date/Time: calendar (UTC), Hours & Minutes (HH:MM)
* Angle format: Decimal degrees
* Refraction model: No refraction / airless
* Range units: Astronomical units (au)
7. Generate → Download results (CSV or text).
8. Use AI or a small script to parse columns (e.g., Obs ecliptic lon, Helio ecliptic lon, Declination) into arrays, then paste them into your Pine script.
Educational Note
This indicator’s goal is to show how to prepare and plot ephemeris—so you can adapt the method for other comets or celestial bodies, or swap in data from existing astro libraries, for learning about astronomical projections using JPL daily data.
Credits & License
- Ephemeris: Solar System Dynamics Group, Horizons On-Line Ephemeris System, 4800 Oak Grove Drive, Jet Propulsion Laboratory, Pasadena, CA 91109, USA.
- Zodiac conversion: AstroLib by BarefootJoey
- License: MIT
- For educational use only.
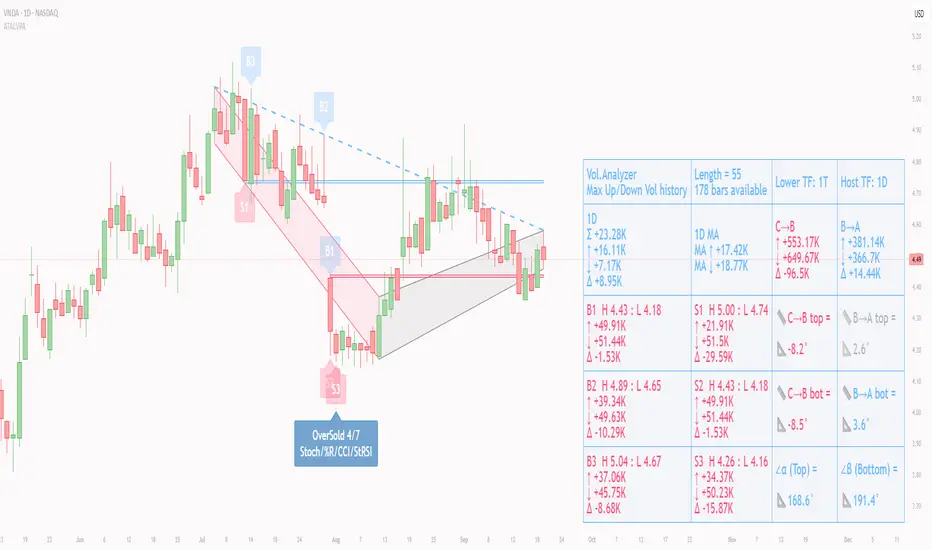
ATAI Volume Pressure Analyzer V 1.0 — Pure Up/DownATAI Volume Pressure Analyzer V 1.0 — Pure Up/Down
Overview
Volume is a foundational tool for understanding the supply–demand balance. Classic charts show only total volume and don’t tell us what portion came from buying (Up) versus selling (Down). The ATAI Volume Pressure Analyzer fills that gap. Built on Pine Script v6, it scans a lower timeframe to estimate Up/Down volume for each host‑timeframe candle, and presents “volume pressure” in a compact HUD table that’s comparable across symbols and timeframes.
1) Architecture & Global Settings
Global Period (P, bars)
A single global input P defines the computation window. All measures—host‑TF volume moving averages and the half‑window segment sums—use this length. Default: 55.
Timeframe Handling
The core of the indicator is estimating Up/Down volume using lower‑timeframe data. You can set a custom lower timeframe, or rely on auto‑selection:
◉ Second charts → 1S
◉ Intraday → 1 minute
◉ Daily → 5 minutes
◉ Otherwise → 60 minutes
Lower TFs give more precise estimates but shorter history; higher TFs approximate buy/sell splits but provide longer history. As a rule of thumb, scan thin symbols at 5–15m, and liquid symbols at 1m.
2) Up/Down Volume & Derived Series
The script uses TradingView’s library function tvta.requestUpAndDownVolume(lowerTf) to obtain three values:
◉ Up volume (buyers)
◉ Down volume (sellers)
◉ Delta (Up − Down)
From these we define:
◉ TF_buy = |Up volume|
◉ TF_sell = |Down volume|
◉ TF_tot = TF_buy + TF_sell
◉ TF_delta = TF_buy − TF_sell
A positive TF_delta indicates buyer dominance; a negative value indicates selling pressure. To smooth noise, simple moving averages of TF_buy and TF_sell are computed over P and used as baselines.
3) Key Performance Indicators (KPIs)
Half‑window segmentation
To track momentum shifts, the P‑bar window is split in half:
◉ C→B: the older half
◉ B→A: the newer half (toward the current bar)
For each half, the script sums buy, sell, and delta. Comparing the two halves reveals strengthening/weakening pressure. Example: if AtoB_delta < CtoB_delta, recent buying pressure has faded.
[ 4) HUD (Table) Display /i]
Colors & Appearance
Two main color inputs define the theme: a primary color and a negative color (used when Δ is negative). The panel background uses a translucent version of the primary color; borders use the solid primary color. Text defaults to the primary color and flips to the negative color when a block’s Δ is negative.
Layout
The HUD is a 4×5 table updated on the last bar of each candle:
◉ Row 1 (Meta): indicator name, P length, lower TF, host TF
◉ Row 2 (Host TF): current ↑Buy, ↓Sell, ΔDelta; plus Σ total and SMA(↑/↓)
◉ Row 3 (Segments): C→B and B→A blocks with ↑/↓/Δ
◉ Rows 4–5: reserved for advanced modules (Wings, α/β, OB/OS, Top
5) Advanced Modules
5.1 Wings
“Wings” visualize volume‑driven movement over C→B (left wing) and B→A (right wing) with top/bottom lines and a filled band. Slopes are ATR‑per‑bar normalized for cross‑symbol/TF comparability and converted to angles (degrees). Coloring mirrors HUD sign logic with a near‑zero threshold (default ~3°):
◉ Both lines rising → blue (bullish)
◉ Both falling → red (bearish)
◉ Mixed/near‑zero → gray
Left wing reflects the origin of the recent move; right wing reflects the current state.
5.2 α / β at Point B
We compute the oriented angle between the two wings at the midpoint B:
β is the bottom‑arc angle; α = 360° − β is the top‑arc angle.
◉ Large α (>180°) or small β (<180°) flags meaningful imbalance.
◉ Intuition: large α suggests potential selling pressure; small β implies fragile support. HUD cells highlight these conditions.
5.3 OB/OS Spike
OverBought/OverSold (OB/OS) labels appear when directional volume spikes align with a 7‑oscillator vote (RSI, Stoch, %R, CCI, MFI, DeMarker, StochRSI).
◉ OB label (red): unusually high sell volume + enough OB votes
◉ OS label (teal): unusually high buy volume + enough OS votes
Minimum votes and sync window are user‑configurable; dotted connectors can link labels to the candle wick.
5.4 Top3 Volume Peaks
Within the P window the script ranks the top three BUY peaks (B1–B3) and top three SELL peaks (S1–S3).
◉ B1 and S1 are drawn as horizontal resistance (at B1 High) and support (at S1 Low) zones with adjustable thickness (ticks/percent/ATR).
◉ The HUD dedicates six cells to show ↑/↓/Δ for each rank, and prints the exact High (B1) and Low (S1) inline in their cells.
6) Reading the HUD — A Quick Checklist
◉ Meta: Confirm P and both timeframes (host & lower).
◉ Host TF block: Compare current ↑/↓/Δ against their SMAs.
◉ Segments: Contrast C→B vs B→A deltas to gauge momentum change.
◉ Wings: Right‑wing color/angle = now; left wing = recent origin.
◉ α / β: Look for α > 180° or β < 180° as imbalance cues.
◉ OB/OS: Note labels, color (red/teal), and the vote count.
◉Top3: Keep B1 (resistance) and S1 (support) on your radar.
Use these together to sketch scenarios and invalidation levels; never rely on a single signal in isolation.
[ 7) Example Highlights (What the table conveys) /i]
◉ Row 1 shows the indicator name, the analysis length P (default 55), and both TFs used for computation and display.
◉ B1 / S1 blocks summarize each side’s peak within the window, with Δ indicating buyer/seller dominance at that peak and inline price (B1 High / S1 Low) for actionable levels.
◉ Angle cells for each wing report the top/bottom line angles vs. the horizontal, reflecting the directional posture.
◉ Ranks B2/B3 and S2/S3 extend context beyond the top peak on each side.
◉ α / β cells quantify the orientation gap at B; changes reflect shifting buyer/seller influence on trend strength.
Together these visuals often reveal whether the “wings” resemble a strong, upward‑tilted arm supported by buyer volume—but always corroborate with your broader toolkit
8) Practical Tips & Tuning
◉ Choose P by market structure. For daily charts, 34–89 bars often works well.
◉ Lower TF choice: Thin symbols → 5–15m; liquid symbols → 1m.
◉ Near‑zero angle: In noisy markets, consider 5–7° instead of 3°.
◉ OB/OS votes: Daily charts often work with 3–4 votes; lower TFs may prefer 4–5.
◉ Zone thickness: Tie B1/S1 zone thickness to ATR so it scales with volatility.
◉ Colors: Feel free to theme the primary/negative colors; keep Δ<0 mapped to the negative color for readability.
Combine with price action: Use this indicator alongside structure, trendlines, and other tools for stronger decisions.
Technical Notes
Pine Script v6.
◉ Up/Down split via TradingView/ta library call requestUpAndDownVolume(lowerTf).
◉ HUD‑first design; drawings for Wings/αβ/OBOS/Top3 align with the same sign/threshold logic used in the table.
Disclaimer: This indicator is provided solely for educational and analytical purposes. It does not constitute financial advice, nor is it a recommendation to buy or sell any security. Always conduct your own research and use multiple tools before making trading decisions.