Combined ATR + VolumeOverview
The Combined ATR + Volume indicator (C-ATR+Vol) is designed to measure both price volatility and market participation by merging the Average True Range (ATR) and trading volume into a single normalized value. This provides traders with a more comprehensive tool than ATR alone, as it highlights not only how much price is moving, but also whether there is sufficient volume behind those moves.
Originality & Utility
Two Key Components
ATR (Average True Range): Measures price volatility by analyzing the range (high–low) over a specified period. A higher ATR often indicates larger price swings.
Volume: Reflects how actively traders are participating in the market. High volume typically indicates strong buying or selling interest.
Normalized Combination
Both ATR and volume are independently normalized to a 0–100 range.
The final output (C-ATR+Vol) is the average of these two normalized values. This makes it easy to see when both volatility and market participation are relatively high.
Practical Use
Above 80: Signifies elevated volatility and strong volume. Markets may experience significant moves.
Around 50–80: Indicates moderate activity. Price swings and volume are neither extreme nor minimal.
Below 50: Suggests relatively low volatility and lower participation. The market may be ranging or consolidating.
This combined approach can help filter out situations where volatility is high but volume is absent—or vice versa—providing a more reliable context for potential breakouts or trend continuations.
Indicator Logic
ATR Calculation
Uses Pine Script’s built-in ta.tr(true) function to measure true range, then smooths it with a user-selected method (RMA, SMA, EMA, or WMA).
Key Input: ATR Length (default 14).
Volume Calculation
Smooths the built-in volume variable using the same selectable smoothing methods.
Key Input: Volume Length (default 14).
Normalization
For each metric (ATR and Volume), the script finds the lowest and highest values over the lookback period and converts them into a 0–100 scale:
normalized value
=(current value−min)(max−min)×100
normalized value= (max−min)(current value−min) ×100
Combined Score
The final plot is the average of Normalized ATR and Normalized Volume. This single value simplifies the process of identifying high-volatility, high-volume conditions.
How to Use
Setup
Add the indicator to your chart.
Adjust ATR Length, Volume Length, and Smoothing to match your preferred time horizon or chart style.
Interpretation
High Values (above 80): The market is experiencing significant price movement with high participation. Potential for strong trends or breakouts.
Moderate Range (50–80): Conditions are active but not extreme. Trend setups may be forming.
Low Values (below 50): Indicates quieter markets with reduced liquidity. Expect ranging or less decisive moves.
Strategy Integration
Use C-ATR+Vol alongside other trend or momentum indicators (e.g., Moving Averages, RSI, MACD) to confirm potential entries/exits.
Combine it with support/resistance or price action analysis for a broader market view.
Important Notes
This script is open-source and intended as a community contribution.
No Future Guarantee: Past market behavior does not guarantee future results. Always use proper risk management and validate signals with additional tools.
The indicator’s performance may vary depending on timeframes, asset classes, and market conditions.
Adjust inputs as needed to suit different instruments or personal trading styles.
By adhering to TradingView’s publishing rules, this script is provided with sufficient detail on what it does, how it’s unique, and how traders can use it. Feel free to customize the settings and experiment with other technical indicators to develop a trading methodology that fits your objectives.
🔹 Combined ATR + Volume (C-ATR+Vol) 지표 설명
이 인디케이터는 ATR(Average True Range)와 거래량(Volume)을 결합하여 시장의 변동성과 유동성을 동시에 측정하는 지표입니다.
ATR은 가격 변동성의 크기를 나타내며, 거래량은 시장 참여자의 활동 수준을 반영합니다. 보통 높은 ATR은 가격 변동이 크다는 의미이고, 높은 거래량은 시장에서 적극적인 거래가 이루어지고 있음을 나타냅니다.
이 두 지표를 각각 0~100 범위로 정규화한 후, 평균을 구하여 "Combined ATR + Volume (C-ATR+Vol)" 값을 계산합니다.
이를 통해 단순한 가격 변동성뿐만 아니라 거래량까지 고려하여, 더욱 신뢰성 있는 변동성 판단을 할 수 있도록 도와줍니다.
📌 핵심 개념
1️⃣ ATR (Average True Range)란?
시장의 변동성을 측정하는 지표로, 일정 기간 동안의 고점-저점 변동폭을 기반으로 계산됩니다.
ATR이 높을수록 가격 변동이 크며, 낮을수록 횡보장이 지속될 가능성이 큽니다.
하지만 ATR은 방향성을 제공하지 않으며, 단순히 변동성의 크기만을 나타냅니다.
2️⃣ 거래량 (Volume)의 역할
거래량은 시장 참여자의 관심과 유동성을 반영하는 중요한 요소입니다.
높은 거래량은 강한 매수 또는 매도세가 존재함을 의미하며, 낮은 거래량은 시장 참여가 적거나 관심이 줄어들었음을 나타냅니다.
3️⃣ ATR + 거래량의 결합 (C-ATR+Vol)
단순한 ATR 값만으로는 변동성이 커도 거래량이 부족할 수 있으며, 반대로 거래량이 많아도 변동성이 낮을 수 있습니다.
이를 해결하기 위해 ATR과 거래량을 각각 0~100으로 정규화하여 균형 잡힌 변동성 지표를 만들었습니다.
두 지표의 평균값을 계산하여, 가격 변동과 거래량이 동시에 높은지를 측정할 수 있도록 설계되었습니다.
📊 사용법 및 해석
80 이상 → 강한 변동성 구간
가격 변동성이 크고 거래량도 높은 상태
강한 추세가 진행 중이거나 큰 변동이 일어날 가능성이 큼
상승/하락 방향성을 확인한 후 트렌드를 따라가는 전략이 유리
50~80 구간 → 보통 수준의 변동성
가격 움직임이 일정하며, 거래량도 적절한 수준
점진적인 추세 형성이 이루어질 가능성이 있음
시장이 점진적으로 상승 혹은 하락할 가능성이 크므로, 보조지표를 활용하여 매매 타이밍을 결정하는 것이 중요
50 이하 → 낮은 변동성 및 유동성 부족
가격 변동이 적고, 거래량도 낮은 상태
시장이 횡보하거나 조정 기간에 들어갈 가능성이 큼
박스권 매매(지지/저항 활용) 또는 돌파 전략을 고려할 수 있음
💡 활용 방법 및 전략
✅ 1. 트렌드 판단 보조지표로 활용
단독으로 사용하는 것보다는 RSI, MACD, 이동평균선(MA) 등의 지표와 함께 활용하는 것이 효과적입니다.
예를 들어, MACD가 상승 신호를 주고, C-ATR+Vol 값이 80을 초과하면 강한 상승 추세로 해석할 수 있습니다.
✅ 2. 변동성 돌파 전략에 활용
C-ATR+Vol이 80 이상인 구간에서 가격이 특정 저항선을 돌파한다면, 강한 추세의 시작을 의미할 수 있습니다.
반대로, C-ATR+Vol이 50 이하에서 가격이 저항선에 가까워지면 돌파 가능성이 낮아질 수 있습니다.
✅ 3. 시장 참여도와 변동성 확인
단순히 ATR만 높아서는 신뢰하기 어려운 경우가 많습니다. 예를 들어, 급등 후 거래량이 급감하면 상승 지속 가능성이 낮아질 수도 있습니다.
하지만 C-ATR+Vol을 사용하면 거래량이 함께 증가하는지를 확인하여 보다 신뢰할 수 있는 분석이 가능합니다.
🚀 결론
🔹 Combined ATR + Volume (C-ATR+Vol) 인디케이터는 단순한 ATR이 아니라 거래량까지 고려하여 변동성을 측정하는 강력한 도구입니다.
🔹 시장이 큰 움직임을 보일 가능성이 높은 구간을 찾는 데 유용하며, 80 이상일 경우 강한 변동성이 있음을 나타냅니다.
🔹 단독으로 사용하기보다는 보조지표와 함께 활용하여, 트렌드 분석 및 돌파 전략 등에 효과적으로 적용할 수 있습니다.
📌 주의사항
변동성이 크다고 해서 반드시 가격이 급등/급락한다는 보장은 없습니다.
특정한 매매 전략 없이 단순히 이 지표만 보고 매수/매도를 결정하는 것은 위험할 수 있습니다.
시장 상황에 따라 변동성의 의미가 다르게 작용할 수 있으므로, 반드시 다른 보조지표와 함께 활용하는 것이 중요합니다.
🔥 이 지표를 활용하여 시장의 변동성과 거래량을 보다 효과적으로 분석해보세요! 🚀
Cari skrip untuk "swing"

Liquidity Hunt SwiftEdgeThe "Liquidity Hunt Dashboard By SwiftEdge" indicator is designed to assist traders in identifying potential liquidity zones by placing a dynamic target line based on swing points and weighted liquidity. It leverages technical analysis tools such as SMA (Simple Moving Average), pivot points, and volume to predict market movements and provides daily statistics on hits and success rate. The target line updates automatically when the price hits it, adapting to the market trend (up, down, or neutral). A dashboard displays the current price, target level, prediction, and trend, making it easy to make informed trading decisions.
Features:
Target Line: A yellow dashed line marks the next expected liquidity level (up to approximately 20 pips away on 1m).
Prediction: Displays "Up (Chasing Sell Liquidity)," "Down (Chasing Buy Liquidity)," or "Neutral" based on trend and liquidity.
Daily Statistics: Tracks hits and success rate, resetting daily.
Trend Indicator: Shows market direction ("Up," "Down," or "Neutral") in the dashboard.
Dynamic Updates: The line moves to a new target level when the price hits the current target.
Recommended Settings for 1-Minute Timeframe:
For Indices (e.g., S&P 500):
Lookback Period: 180 (3 hours to capture more stable swing points).
Max Distance (%): 0.015 (approximately 15 pips, suitable for indices).
Cooldown Period: 5 (stabilizes after hits).
Line Duration: 60 (displays the line for 1 hour).
For Crypto (e.g., BTC/USD):
Lookback Period: 120 (2 hours to capture short-term swing points).
Max Distance (%): 0.024 (approximately 20 pips, suitable for volatile crypto markets).
Cooldown Period: 5.
Line Duration: 60.
For Forex (e.g., EUR/USD):
Lookback Period: 180 (3 hours for greater data density in less volatile markets).
Max Distance (%): 0.012 (approximately 10-12 pips, suitable for forex).
Cooldown Period: 5.
Line Duration: 60.
Guide for Higher Timeframes:
This indicator can be adapted for higher timeframes (e.g., 5m, 15m, 1H) by adjusting the settings to account for larger price movements and slower market dynamics. Follow these steps:
Select Your Timeframe: Switch your chart to the desired timeframe (e.g., 5m, 15m, or 1H).
Adjust Lookback Period: Increase the "Lookback Period" to cover a longer historical period. For example:
5m: Set to 360 (equivalent to 6 hours).
15m: Set to 480 (equivalent to 8 hours).
1H: Set to 720 (equivalent to 12 hours).
Adjust Max Distance (%): Higher timeframes require larger targets to account for bigger price swings. For example:
5m: Increase to 0.05 (approximately 50 pips).
15m: Increase to 0.1 (approximately 100 pips).
1H: Increase to 0.2 (approximately 200 pips).
Adjust Cooldown Period: On higher timeframes, you may want a longer cooldown to avoid frequent updates. For example:
5m: Set to 10.
15m: Set to 15.
1H: Set to 20.
Adjust Line Duration: Extend the duration the line is displayed to match the timeframe. For example:
5m: Set to 120 (equivalent to 10 hours).
15m: Set to 240 (equivalent to 60 hours).
1H: Set to 480 (equivalent to 20 days).
Monitor the Dashboard: The dashboard will still show the target level, prediction, and trend, but the values will now reflect the larger timeframe's dynamics.
Usage Instructions:
Set your chart to a 1-minute timeframe (or follow the higher timeframe guide).
Adjust the settings based on the market and timeframe (see recommendations above).
Monitor the dashboard for the current price, target level, and prediction.
Use the yellow line as a potential entry or exit level, and adjust your strategy based on the trend and statistics.
Notes:
This indicator is intended solely for educational and analytical purposes and should not be considered financial advice.
Test the indicator on a demo account before using it with real funds.
The indicator complies with TradingView guidelines by not providing trading advice, automated trading signals, or guarantees of profit.

Fractal Breakout Trend Following System█ OVERVIEW
The Fractal Breakout Trend Following System is a custom technical analysis tool designed to pinpoint significant fractal pivot points and breakout levels. By analyzing price action through configurable pivot parameters, this indicator dynamically identifies key support and resistance zones. It not only marks crucial highs and lows on the chart but also signals potential trend reversals through real-time breakout detections, helping traders capture shifts in market momentum.
█ KEY FEATURES
Fractal Pivot Detection
Utilizes user-defined left and right pivot lengths to detect local highs (pivot highs) and lows (pivot lows). This fractal-based approach ensures that only meaningful price moves are considered, effectively filtering out minor market noise.
Dynamic Line Visualization
Upon confirmation of a pivot, the system draws a dynamic line representing resistance (from pivot highs) or support (from pivot lows). These lines extend across the chart until a breakout occurs, offering a continuous visual guide to key levels.
Trend Breakout Signals
Monitors for price crossovers relative to the drawn pivot lines. A crossover above a resistance line signals a bullish breakout, while a crossunder below a support line indicates a bearish move, thus updating the prevailing trend.
Pivot Labelling
Assigns labels such as "HH", "LH", "LL", or "HL" to detected pivots based on their relative values.
It uses the following designations:
HH (Higher High) : Indicates that the current pivot high is greater than the previous pivot high, suggesting continued upward momentum.
LH (Lower High) : Signals that the current pivot high is lower than the previous pivot high, which may hint at a potential reversal within an uptrend.
LL (Lower Low) : Shows that the current pivot low is lower than the previous pivot low, confirming sustained downward pressure.
HL (Higher Low) : Reveals that the current pivot low is higher than the previous pivot low, potentially indicating the beginning of an upward reversal in a downtrend.
These labels provide traders with immediate insight into the market structure and recent price behavior.
Customizable Visual Settings
Offers various customization options:
• Adjust pivot sensitivity via left/right pivot inputs.
• Toggle pivot labels on or off.
• Enable background color changes to reflect bullish or bearish trends.
• Choose preferred colors for bullish (e.g., green) and bearish (e.g., red) signals.
█ UNDERLYING METHODOLOGY & CALCULATIONS
Fractal Pivot Calculation
The script employs a sliding window technique using configurable left and right parameters to identify local highs and lows. Detected pivot values are sanitized to ensure consistency in subsequent calculations.
Dynamic Line Plotting
When a new pivot is detected, a corresponding line is drawn from the pivot point. This line extends until the price breaks the level, at which point it is reset. This method provides a continuous reference for support and resistance.
Trend Breakout Identification
By continuously monitoring price interactions with the pivot lines, the indicator identifies breakouts. A price crossover above a resistance line suggests a bullish breakout, while a crossunder below a support line indicates a bearish shift. The current trend is updated accordingly.
Pivot Label Assignment
The system compares the current pivot with the previous one to determine if the move represents a higher high, lower high, higher low, or lower low. This classification helps traders understand the underlying market momentum.
█ HOW TO USE THE INDICATOR
1 — Apply the Indicator
• Add the Fractal Breakout Trend Following System to your chart to begin visualizing dynamic pivot points and breakout signals.
2 — Adjust Settings for Your Market
• Pivot Detection – Configure the left and right pivot lengths for both highs and lows to suit your desired sensitivity:
- Use shorter lengths for more responsive signals in fast-moving markets.
- Use longer lengths to filter out minor fluctuations in volatile conditions.
• Visual Customization – Toggle the display of pivot labels and background color changes. Select your preferred colors for bullish and bearish trends.
3 — Interpret the Signals
• Support & Resistance Lines – Observe the dynamically drawn lines that represent key pivot levels.
• Pivot Labels – Look for labels like "HH", "LH", "LL", and "HL" to quickly assess market structure and trend behavior.
• Trend Signals – Watch for price crossovers and corresponding background color shifts to gauge bullish or bearish breakouts.
4 — Integrate with Your Trading Strategy
• Use the identified pivot points as potential support and resistance levels.
• Combine breakout signals with other technical indicators for comprehensive trade confirmation.
• Adjust the sensitivity settings to tailor the indicator to various instruments and market conditions.
█ CONCLUSION
The Fractal Breakout Trend Following System offers a robust framework for identifying critical fractal pivot points and potential breakout opportunities. With its dynamic line plotting, clear pivot labeling, and customizable visual settings, this indicator equips traders with actionable insights to enhance decision-making and optimize entry and exit strategies.

Auto Fib Retracement [victhoreb]Auto Fib Retracement is an automated Fibonacci retracement tool for TradingView that dynamically identifies key swing points and plots Fibonacci levels to help traders visualize potential support and resistance areas. Using a Zigzag algorithm, the indicator detects recent pivot highs and lows and calculates retracement levels based on these significant price swings. Key features include:
- Dynamic Pivot Detection: Automatically identifies recent swing highs and lows using configurable lookback periods, ensuring the Fibonacci levels adjust as the market evolves.
- Customizable Fibonacci Levels: Users can tailor the Fibonacci retracement levels (0, 0.214, 0.382, 0.5, 0.618, 0.786,) along with individual colors, offering flexibility to match various trading strategies.
- Zigzag Visualization: Optionally displays a Zigzag line that connects the detected pivot points, providing a clear visual representation of the price swing dynamics.
- Adjustable Line Extension: Retracement lines can be extended for a specified number of bars.
- Repainting Option: Includes an option to repaint the Zigzag, ensuring that the most current price action is reflected in the indicator’s output.
- The Auto Fibonacci Retracement itself DOES NOT REPAINT : )
This indicator streamlines the analysis process by automatically drawing Fibonacci retracement levels, allowing traders to quickly identify potential reversal areas and make more informed trading decisions.

BullDozz Fibo ZigZagFibo ZigZag - Advanced Fibonacci Retracement Tool 🔥
📌 Overview
The Fibo ZigZag indicator is a powerful tool for trend structure analysis using the ZigZag pattern and Fibonacci retracement levels. It automatically identifies swing highs & lows, draws ZigZag lines, and overlays Fibonacci levels with price labels at the right end for better readability.
This indicator is designed for traders who use price action, trend reversal strategies, and support/resistance analysis.
🛠 Features
✅ Automatic ZigZag detection with customizable depth, deviation, and backstep
✅ Fibonacci retracement levels (0%, 23.6%, 38.2%, 50%, 61.8%, 100%, 161.8%, 261.8%, 423.6%)
✅ Price labels at Fibonacci levels (placed at the right end of the levels)
✅ Alerts for new swing highs & lows
✅ Customizable line colors, text colors, and label sizes
✅ Lightweight and optimized for fast performance
📊 How It Works
1️⃣ The script detects ZigZag structure points based on price swings
2️⃣ It connects recent highs & lows with a ZigZag line
3️⃣ Fibonacci retracement levels are calculated and drawn between the last two significant swing points
4️⃣ Each Fibo level is labeled with its percentage & exact price, placed at the right end for clarity
5️⃣ Alerts trigger automatically when a new swing high or low is detected
⚙ Customization Options
🔹 ZigZag Settings: Adjust Depth, Deviation, BackStep, and Leg length
🔹 Fibonacci Levels: Modify line colors, label text colors, and visibility
🔹 Alerts: Enable/disable trend change alerts
📈 Best Use Cases
🚀 Identifying Trend Reversals – Detect key turning points using Fibonacci levels
📉 Support & Resistance Trading – Use retracement levels as entry/exit points
📊 Swing Trading & Scalping – Combine ZigZag with price action for effective strategies
🔔 Alert-Based Trading – Get notified when new swing highs/lows form
🚀 How to Use
📌 Add the indicator to your chart
📌 Adjust the settings to match your trading strategy
📌 Use the Fibonacci levels & ZigZag lines to analyze trend direction & key price zones
📌 Wait for alerts or manually enter trades based on price reaction to Fibo levels
📢 Final Thoughts
The Fibo ZigZag is an essential tool for traders who rely on price action, trend reversals, and Fibonacci levels. Whether you're a beginner or a pro, this indicator helps you spot high-probability trading opportunities with ease.
⚡ Try it now & enhance your trading strategy! 🚀
💬 Let us know your feedback & suggestions in the comments! Happy trading! 📊🔥

Fibonacci 3-D🟩 The Fibonacci 3-D indicator is a visual tool that introduces a three-dimensional approach to Fibonacci projections, leveraging market geometry. Unlike traditional Fibonacci tools that rely on two points and project horizontal levels, this indicator leverages slopes derived from three points to introduce a dynamic element into the calculations. The Fibonacci 3-D indicator uses three user-defined points to form a triangular structure, enabling multi-dimensional projections based on the relationships between the triangle’s sides.
This triangular framework forms the foundation for the indicator’s calculations, with each slope (⌳AB, ⌳AC, and ⌳BC) representing the rate of price change between its respective points. By incorporating these slopes into Fibonacci projections, the indicator provides an alternate approach to identifying potential support and resistance levels. The Fibonacci 3-D expands on traditional methods by integrating both historical price trends and recent momentum, offering deeper insights into market dynamics and aligning with broader market geometry.
The indicator operates across three modes, each defined by the triangular framework formed by three user-selected points (A, B, and C):
1-Dimensional (1-D): Fibonacci levels are based on a single side of the triangle, such as AB, AC, or BC. The slope of the selected side determines the angle of the projection, allowing users to analyze linear trends or directional price movements.
2-Dimensional (2-D): Combines two slopes derived from the sides of the triangle, such as AB and BC or AC and BC. This mode adds depth to the projections, accounting for both historical price swings and recent market momentum.
3-Dimensional (3-D): Integrates all three slopes into a unified projection. This mode captures the full geometric relationship between the points, revealing a comprehensive view of geometric market structure.
🌀 THEORY & CONCEPT 🌀
The Fibonacci 3-D indicator builds on the foundational principles of traditional Fibonacci analysis while expanding its scope to capture more intricate market structures. At its core, the indicator operates based on three user-selected points (A, B, and C), forming the vertices of a triangle that provides the structural basis for all calculations. This triangle determines the slopes, projections, and Fibonacci levels, aligning with the unique geometric relationships between the chosen points. By introducing multiple dimensions and leveraging this triangular framework, the indicator enables a deeper examination of price movements.
1️⃣ First Dimension (1-D)
In technical analysis, traditional Fibonacci retracement and extension tools operate as one-dimensional instruments. They rely on two price points, often a swing high and a swing low, to calculate and project horizontal levels at predefined Fibonacci ratios. These levels identify potential support and resistance zones based solely on the price difference between the selected points.
A one-dimensional Fibonacci showing levels derived from two price points (B and C).
The Fibonacci 3-D indicator extends this one-dimensional concept by introducing Ascending and Descending projection options. These options calculate the levels to align with the directional movement of price, creating sloped projections instead of purely horizontal levels.
1-D mode with an ascending projection along the ⌳BC slope aligned to the market's slope. Potential support is observed at 0.236 and 0.382, while resistance appears at 1.0 and 0.5.
2️⃣ Second Dimension (2-D)
The second dimension incorporates a second side of the triangle, introducing relationships between two slopes (e.g., ⌳AB and ⌳BC) to form a more dynamic three-point structure (A, B, and C) on the chart. This structure enables the indicator to move beyond the single-axis (price) calculations of traditional Fibonacci tools. The sides of the triangle (AB, AC, BC) represent slopes calculated as the rate of price change over time, capturing distinct components of market movement, such as trend direction and momentum.
2-D mode of the Fibonacci 3-D indicator using the ⌳AC slope with a descending projection. The Fibonacci projections align closely with observed market behavior, providing support at 0.236 and resistance at 0.618. Unlike traditional zigzag setups, this configuration uses two swing highs (A and B) and a swing low (C). The alignment along the descending slope highlights the geometric relationships between selected points in identifying potential support and resistance levels.
3️⃣ Third Dimension (3-D)
The third dimension expands the analysis by integrating all three slopes into a unified calculation, encompassing the entire triangle structure formed by points A, B, and C. Unlike the second dimension, which analyzes pairwise slope relationships, the 3-D mode reflects the combined geometry of the triangle. Each slope contributes a distinct perspective: AB and AC provide historical context, while BC emphasizes the most recent price movement and is given greater weight in the calculations to ensure projections remain responsive to current dynamics.
Using this integrated framework, the 3-D mode dynamically adjusts Fibonacci projections to balance long-term patterns and short-term momentum. The projections extend outward in alignment with the triangle’s geometry, offering a comprehensive framework for identifying potential support and resistance zones and capturing market structures beyond the scope of simpler 1-D or 2-D modes.
Three-dimensional Fibonacci projection using the ⌳AC slope, aligning closely with the market's directional movement. The projection highlights key levels: resistance at 0.0 and 0.618, and support at 1.0, 0.786, and 0.382.
By leveraging all three slopes simultaneously, the 3-D mode introduces a level of complexity particularly suited for volatile or non-linear markets. The weighted slope calculations ensure no single price movement dominates the analysis, allowing the projections to adapt dynamically to the broader market structure while remaining sensitive to recent momentum.
Three-dimensional ascending projection. In 3D mode, the indicator integrates all three slopes to calculate the angle of projection for the Fibonacci levels. The resulting projections adapt dynamically to the overall geometry of the ABC structure, aligning with the market’s current direction.
🔂 Interactions: Dimensions. Slope Source, Projections, and Orientation
The Dimensions , Projections , and Orientation settings work together to define Fibonacci projections within the triangular framework. Each setting plays a specific role in the geometric analysis of price movements.
♾️ Dimension determines which of the three modes (1-D, 2-D, or 3-D) is used for Fibonacci projections. In 1-D mode, the projections are based on a single side of the triangle, such as AB, AC, or BC. In 2-D mode, two sides are combined, producing levels based on their geometric relationship. The 3-D mode integrates all three sides of the triangle, calculating projections using weighted averages that emphasize the BC side for its relevance to recent price movement while maintaining historical context from the AB and AC sides.
A one-dimensional Fibonacci projection using the ⌳AB slope with a neutral projection. Important levels of interaction are highlighted: repeated resistance at Level 1.0 and repeated support at Levels 0.5 and 0.618. The projection aligns horizontally, reflecting the relationship between points A, B, and C while identifying recurring zones of market structure.
🧮 Slope Source determines which side of the triangle (AB, AC, or BC) serves as the foundation for Fibonacci projections. This selection directly impacts the calculations by specifying the slope that anchors the geometric relationships within the chosen Dimension mode (1-D, 2-D, or 3-D).
In 1-D mode, the selected Source defines the single side used for the projection. In 2-D and 3-D modes, the Source works in conjunction with other settings to refine projections by integrating the selected slope into the multi-dimensional framework.
One-dimensional Fibonacci projection using the ⌳AC Slope Source and Ascending projection. The projection continues on the AC slope line.
🎯 Projection controls the direction and alignment of Fibonacci levels. Neutral projections produce horizontal levels, similar to traditional Fibonacci tools. Ascending and Descending projections adjust the levels along the calculated slope to reflect market trends. These options allow the indicator’s outputs to align with different market behaviors.
An ascending projection along the ⌳BC slope aligns with resistance levels at 1.0, 0.618, and 0.236. The geometric relationship between points A, B, and C illustrates how the projection adapts to market structure, identifying resistance zones that may not be captured by traditional Fibonacci tools.
🧭 Orientation modifies the alignment of the setup area defined by points A, B, and C, which influences Fibonacci projections in 2-D and 3-D modes. In Default mode, the triangle aligns naturally based on the relative positions of points B and C. In Inverted mode, the geometric orientation of the setup area is reversed, altering the slope calculations while preserving the projection direction specified in the Projection setting. In 1-D mode, Orientation has no effect since only one side is used for the projection.
Adjusting the Orientation setting provides alternative views of how Fibonacci levels align with the market's structure. By recalibrating the triangle’s setup, the inverted orientation can highlight different relationships between the sides, providing additional perspectives on support and resistance zones.
2-D inverted. The ⌳AC slope defines the projection, and the inverted orientation adjusts the alignment of the setup area, altering the angles used in level calculations. Key levels are highlighted: resistance at 0.786, strong support at 0.5 and 0.236, and a resistance-turned-support interaction at 0.618.
🛠️ CONFIGURATION AND SETTINGS 🛠️
The Fibonacci 3-D indicator includes configurable settings to adjust its functionality and visual representation. These options include customization of the dimensions (1-D, 2-D, or 3-D), slope calculations, orientations, projections, Fibonacci levels, and visual elements.
When adding the indicator to a new chart, select three reference points (A, B, and C). These are usually set to recent swing points. All three points can be easily changed at any time by clicking on the reference point and dragging it to a new location.
By default, all settings are set to Auto . The indicator uses an internal algorithm to estimate the projections based on the orientation and relative positions of the reference points. However, all values can be overridden to reflect the user's interpretation of the current market geometry.
⚙️ Core Settings
Dimensions : Defines how many sides of the triangle formed by points A, B, and C are incorporated into the calculations for Fibonacci projections. This setting determines the level of complexity and detail in the analysis. 1-D : Projects levels along the angle of a single user-selected side of the triangle.
2-D : Projects levels based on a composite slope derived from the angles of two sides of the triangle.
3-D : Projects levels based on a composite slope derived from all three sides of the triangle (A-B, A-C, and B-C), providing a multi-dimensional projection that adapts to both historical and recent market movements.
Slope Source : Determines which side of the triangle is used as the basis for slope calculations. A–B: The slope between points A and B. In 1-D mode, this determines the projection. In 2-D and 3-D modes, it contributes to the composite slope calculation.
A–C: The slope between points A and C. In 1-D mode, this determines the projection. In 2-D and 3-D modes, it contributes to the composite slope calculation.
B--C: The slope between points B and C. In 1-D mode, this determines the projection. In 2-D and 3-D modes, it contributes to the composite slope calculation.
Orientation : Defines the triangle's orientation formed by points A, B, and C, influencing slope calculations. Auto : Automatically determines orientation based on the relative positions of points B and C. If point C is to the right of point B, the orientation is "normal." If point C is to the left, the orientation is inverted.
Inverted : Reverses the orientation set in "Auto" mode. This flips the triangle, reversing slope calculations ⌳AB becomes ⌳BA).
Projection : Determines the direction of Fibonacci projections: Auto : Automatically determines projection direction based on the triangle formed by A, B, and C.
Ascending : Projects the levels upward.
Neutral : Projects the levels horizontally, similar to traditional Fibonacci retracements.
Descending : Projects the levels downward.
⚙️ Fibonacci Level Settings Show or hide specific levels.
Level Value : Adjust Fibonacci ratios for each level. The 0.0 and 1.0 levels are fixed.
Color : Set level colors.
⚙️ Visibility Settings Show Setup : Toggle the display of the setup area, which includes the projected lines used in calculations.
Show Triangle : Toggle the display of the triangle formed by points A, B, and C.
Triangle Color : Set triangle line colors.
Show Point Labels : Toggle the display of labels for points A, B, and C.
Show Left/Right Labels : Toggle price labels on the left and right sides of the chart.
Fill % : Adjust the fill intensity between Fibonacci levels (0% for no fill, 100% for full fill).
Info : Set the location or hide the Slope Source and Dimension. If Orientation is Inverted , the Slope Source will display with an asterisk (*).
⚙️ Time-Price Points : Set the time and price for points A, B, and C, which define the Fibonacci projections.
A, B, and C Points : User-defined time and price coordinates that form the foundation of the indicator's calculations.
Interactive Adjustments : Changes made to points on the chart automatically synchronize with the settings panel and update projections in real time.
Notes
Unlike traditional Fibonacci tools that include extensions beyond 1.0 (e.g., 1.618 or 2.618), the Fibonacci 3-D indicator restricts Fibonacci levels to the range between 0.0 and 1.0. This is because the projections are tied directly to the proportional relationships along the sides of the triangle formed by points A, B, and C, rather than extending beyond its defined structure.
The indicator's calculations dynamically sort the user-defined A, B, and C points by time, ensuring point A is always the earliest, point C the latest, and point B the middle. This automatic sorting allows users to freely adjust the points directly on the chart without concern for their sequence, maintaining consistency in the triangular structure.
🖼️ ADDITIONAL CHART EXAMPLES 🖼️
Three-dimensional ⌳AC slope is used with an ascending projection, even as the broader market trend moves downward. Despite the apparent contradiction, the projected Fibonacci levels align closely with price action, identifying zones of support and resistance. These levels highlight smaller countertrend movements, such as pullbacks to 0.382 and 0.236, followed by continuations at resistance levels like 0.618 and 0.786.
In 2-D mode, an ascending projection based on the BC slope highlights the market's geometric structure. A setup triangle, defined by a swing high (A), a swing low (B), and another swing high (C), reveals Fibonacci projections aligning with support at 0.236, 0.382, and 0.5, and resistance at 0.618, 0.786, and 1.0, as shown by the green and red arrows. This demonstrates the ability to uncover dynamic support and resistance levels not calculated in traditional Fibonacci tools.
In 2-D mode with an ascending projection from the ⌳AB slope, price movement is contained within the 0.5 and 0.786 levels. The 0.5 level serves as support, while the 0.786 level acts as resistance, with price action consistently interacting with these boundaries.
An AC (2-D) ascending projection is derived from two swing highs (A and B) and a swing low (C), reflecting a non-linear market structure that deviates from traditional zigzag patterns. The ascending projection aligns closely with the market's upward trajectory, forming a channel between the 0.0 and 0.5 Fibonacci levels. Note how price action interacts with the projected levels, showing support at 0.236 and 0.382, with the 0.5 level acting as a mid-channel equilibrium.
Two-dimensional ascending Fibonacci projection using the ⌳AC slope. Arrows highlight resistance at 0.786 and support at 0.0 and 0.236. The projection follows the ⌳AC slope, reflecting the geometric relationship between points A, B, and C to identify these levels.
Three-dimensional Fibonacci projection using the ⌳AC slope, aligned with the actual market's directional trend. By removing additional Fibonacci levels, the image emphasizes key areas: resistance at Level 0.0 and support at Levels 1.0 and 0.5. The projection dynamically follows the ⌳AC slope, adapting to the market's structure as defined by points A, B, and C.
A three-dimensional configuration uses the ⌳AB slope as the baseline for projections while incorporating the geometric influence of point C. Only the 0.0 and 0.618 levels are enabled, emphasizing the relationship between support at 0.0 and resistance at 0.618. Unlike traditional Fibonacci tools, which operate in a single plane, this setup reveals levels that rely on the triangular relationship between points A, B, and C. The third dimension allows for projections that align more closely with the market’s structure and reflect its multi-dimensional geometry.
The Fibonacci 3-D indicator can adapt to non-traditional point selection. Point A serves as a swing low, while points B and C are swing highs, forming an unconventional configuration. ⌳The BC slope is used in 2-D mode with an inverted orientation, flipping the projection direction and revealing resistance at Level 0.786 and support at Levels 0.618 and 0.5.
⚠️ DISCLAIMER ⚠️
The Fibonacci 3-D indicator is a visual analysis tool designed to illustrate Fibonacci relationships. While the indicator employs precise mathematical and geometric formulas, no guarantee is made that its calculations will align with other Fibonacci tools or proprietary methods. Like all technical and visual indicators, the Fibonacci projections generated by this tool may appear to visually align with key price zones in hindsight. However, these projections are not intended as standalone signals for trading decisions. This indicator is intended for educational and analytical purposes, complementing other tools and methods of market analysis.
🧠 BEYOND THE CODE 🧠
The Fibonacci 3-D indicator, like other xxattaxx indicators , is designed to encourage both education and community engagement. Your feedback and insights are invaluable to refining and enhancing the Fibonacci 3-D indicator. We look forward to the creative applications, adaptations, and observations this tool inspires within the trading community.

Uptrick: Zero Lag HMA Trend Suite1. Name and Purpose
Uptrick: Zero Lag HMA Trend Suite is a Pine Version 6 script that builds upon the Hull Moving Average (HMA) to offer an advanced trend analysis tool. Its purpose is to help traders identify trend direction, potential reversals, and overall market momentum with reduced lag compared to traditional moving averages. By combining the HMA with Average True Range (ATR) thresholds, slope-dependent coloring, Volume Weighted Average Price (VWAP) ribbons, and optional reversal signals, the script aims to give a detailed view of price activity in various market environments.
2. Overview
This script begins with the calculation of a Hull Moving Average, a method that blends Weighted Moving Averages in a way designed to cut down on lag while still smoothing out price fluctuations. Next, several enhancements are applied. The script compares current HMA values to previous ones for slope-based coloring, which highlights uptrends and downtrends at a glance. It also plots buy and sell signals when price moves beyond or below thresholds determined by the ATR and the user’s chosen signal multiplier. An optional VWAP ribbon can be shown to confirm bullish or bearish conditions relative to a volume-weighted benchmark. Additionally, the script can plot reversal signals (labeled with B) at points where price crosses back toward the HMA from above or below. Taken together, these elements allow traders to visualize both the short-term momentum and the broader context of how price interacts with volatility and overall market direction.
3. Why These Indicators Have Been Linked Together
The reason the Hull Moving Average, the Average True Range, and the VWAP have been integrated into one script is to tackle multiple facets of market analysis in a single tool. The Zero Lag Hull Moving Average provides a responsive trend line, the ATR offers a measure of volatility that helps distinguish significant price shifts from typical fluctuations, and the VWAP acts as a reference for fair value based on traded volume. By layering all three, the script helps traders avoid the need to juggle multiple separate indicators and offers a holistic perspective. The slope-based coloring focuses on trend direction, the ATR-based thresholds refine possible buy and sell zones, and the VWAP ribbons provide insight into how price stands relative to an important volume-weighted level. The inclusion of up and down signals and reversal B labels further refines entries and exits.
4. Why Use Uptrick: Zero Lag HMA Trend Suite
The Hull Moving Average is already known for reacting more quickly to price changes compared to other moving averages while retaining a degree of smoothness. This suite enhances the basic HMA by showing colored gradients that make it easy to spot trend direction changes, highlighting potential entry or exit points based on volatility-driven thresholds, and optionally layering a volume-based measure of bullish or bearish market sentiment. By relying on a zero lag approach and additional data points, the script caters to those wanting a more responsive method of identifying shifts in market dynamics. The added reversal signals and up or down alerts give traders extra confirmation for potential turning points.
5. How This Extension Improves on the Basic HMA
This extension not only plots the Hull Moving Average but also includes data-driven alerts and visual cues that traditional HMA lines do not provide. First, it offers multi-layered slope coloring, making up or down trends quickly apparent. Second, it uses ATR-based thresholds to pinpoint moments when price may be extending beyond normal volatility, thus generating buy or sell signals. Third, the script introduces an optional VWAP ribbon to indicate whether the market is trading above or below this pivotal volume-weighted benchmark, adding a further confirmation step for bullish or bearish conditions. Finally, it incorporates optional reversal signals labeled with B, indicating points where price might swing back toward the main HMA line.
6. Core Components
The script can be broken down into several primary functions and features.
a. Zero Lag HMA Calculation
Uses two Weighted Moving Averages (half-length and full-length) combined through a smoothing step based on the square root of the chosen length. This approach is designed to reduce lag significantly compared to other moving averages.
b. Slope Detection
Compares current and prior HMA values to determine if the trend is up or down. The slope-based coloring changes between turquoise shades for upward movement and magenta shades for downward movement, making trend direction immediately visible.
c. ATR-Based Thresholding for Up and Down Signals
The script calculates an Average True Range over a user-defined period, then multiplies it by a signal factor to form two bands around the HMA. When price crosses below the lower band, an up (buy) signal appears; when it crosses above the upper band, a down (sell) signal is shown.
d. Reversal Signals (B Labels)
Tracks when price transitions back toward the main HMA from an extreme zone. When enabled, these reversal points are labeled with a B and can help traders see potential turning points or mean-reversion setups.
e. VWAP Bands
An optional Volume Weighted Average Price ribbon that plots above or below the HMA, indicating bullish or bearish conditions relative to a volume-weighted price benchmark. This can also act as a kind of support/ resistance.
7. User Inputs
a. HMA Length
Controls how quickly the moving average responds to price changes. Shorter lengths react faster but can lead to more frequent signals, whereas longer lengths produce smoother lines.
b. Source
Specifies the price input, such as close or an alternative source, for the calculation. This can help align the HMA with specific trading strategies.
c. ATR Length and Signal Multiplier
Defines how the script calculates average volatility and sets thresholds for buy or sell alerts. Adjusting these values can help filter out noise or highlight more aggressive signals.
d. Slope Index
Determines how many bars to look back for detecting slope direction, influencing how sensitive the slope coloring is to small fluctuations.
e. Show Buy and Sell Signals, Reversal Signals, and VWAP
Lets users toggle the display of these features. Turning off certain elements can reduce chart clutter if traders prefer a simpler layout.
8. Calculation Process
The script’s calculation follows a step-by-step approach. It first computes two Weighted Moving Averages of the selected price source, one over half the specified length and one over the full length. It then combines these using 2*wma1 minus wma2 to reduce lag, followed by applying another weighted average using the square root of the length. Simultaneously, it computes the ATR for a user-defined period. By multiplying ATR by the signal multiplier, it establishes upper and lower bands around the HMA, where crossovers generate buy (up) or sell (down) signals. The script can also plot reversal signals (B labels) when price crosses back from these bands in the opposite direction. For the optional VWAP feature, Pine Script’s ta.vwap function is used, and differences between the HMA and VWAP levels determine the color and opacity of the ribbon.
9. Signal Generation and Filtering
The ATR-based thresholds reduce the influence of small, inconsequential price swings. When price falls below the lower band, the script issues an up (buy) signal. If price breaks above the upper band, a down (sell) signal appears. These signals are visible through labels placed near the bars. Reversal signals, labeled with B, can be turned on to help detect when price retraces from an extended area back toward the main HMA line. Traders can disable or enable these signals to match their preferred level of chart detail or risk tolerance.
10. Visualization on the Chart
The Zero HMA Lag Trend Suite aims for visual clarity. The HMA line is plotted multiple times with increasing transparency to create a gradient effect. Turquoise gradients indicate upward slopes, and magenta gradients signify downward slopes. Bar coloring can be configured to align with the slope direction, providing quick insight into current momentum. When enabled, buy or sell labels are placed under or above the bars as price crosses the ATR-defined boundaries. If the reversal option is active, B labels appear around areas where price changes direction. The optional VWAP ribbons form background bands, using distinct coloration to signal whether price is above or below the volume-weighted metric.
11. Market Adaptability
Because the script’s parameters (HMA length, ATR length, signal multiplier, and slope index) are user-configurable, it can adapt to a wide range of markets and timeframes. Intraday traders may prefer a shorter HMA length for quick signals, while swing or position traders might use a longer HMA length to filter out short-lived price changes. The source setting can also be adjusted, allowing for specialized data inputs beyond just close or open values.
12. Risk Management Considerations
The script’s signals and labels are based on past price data and volatility readings, and they do not guarantee profitable outcomes. Sharp market reversals or unforeseen fundamental events can produce false signals. Traders should combine this tool with broader risk management strategies, including stop-loss placement, position sizing, and independent market analyses. The Zero HMA Lag Trend Suite can help highlight potential opportunities, but it should not be relied upon as the sole basis for trade decisions.
13. Combining with Other Tools
Many traders choose to verify signals from the Zero HMA Lag Trend Suite using popular indicators like the Relative Strength Index (RSI), Moving Average Convergence Divergence (MACD), or even simple volume-based metrics to confirm whether a price movement has sufficient momentum. Conventional techniques such as support and resistance levels, chart patterns, or candlestick analysis can also supplement signals generated by the script’s up, down, or reversal B labels.
14. Parameter Customization and Examples
a. Short-Term Day Trading
Using a shorter HMA length (for instance, 9 or 14) and a slightly higher ATR multiplier might provide timely buy and sell signals, though it may also produce more whipsaws in choppy markets.
b. Swing or Position Trading
Selecting a longer HMA length (such as 50 or 100) with a moderate ATR multiplier can help users track more significant and sustained market moves, potentially reducing the effect of minor fluctuations.
c. Multiple Timeframe Blends
Some traders load two versions of the indicator on the same chart, one for short-term signals (with frequent B label reversals) and another for the broader trend direction, aligning entry and exit decisions with the bigger picture.
15. Realistic Expectations
Even though the Hull Moving Average helps minimize lag and the script incorporates volatility-based filters and optional VWAP overlays, it cannot predict future market behavior with complete accuracy. Periods of low liquidity or sudden market shocks can still lead to signals that do not reflect longer-term trends. Frequent parameter review and manual confirmation are advised before executing trades based solely on the script’s outputs.
16. Theoretical Background
The Hull Moving Average formula aims to balance smoothness with reactivity, accomplished by combining Weighted Moving Averages at varying lengths. By subtracting a slower average from a faster one and then applying another smoothing step with the square root of the original length, the HMA is designed to respond more promptly to price changes than typical exponential or simple moving averages. The ATR component, introduced by J. Welles Wilder, calculates the average range of price movement over a user-defined period, allowing the script to assess volatility and adapt signals accordingly. VWAP provides a volume-weighted benchmark that many institutional traders track to gauge fair intraday value.
17. Originality and Uniqueness
Although multiple HMA-based indicators can be found, Uptrick: Zero Lag HMA Trend Suite sets itself apart by merging slope-based coloring, ATR thresholds, VWAP ribbons, up or down labels, and optional reversal signals all in one cohesive platform. This synergy aims to reduce chart clutter while still giving traders a comprehensive look at trend direction, volatility, and volume-based sentiment.
18. Summary
Uptrick: Zero Lag HMA Trend Suite is a specialized trading script designed to highlight potential market trends and reversals with minimal delay. It leverages the Hull Moving Average for an adaptive yet smooth price line, pairs ATR-based thresholds for detecting possible breakouts or dips, and provides VWAP-based ribbons for added volume-weighted context. Traders can further refine their entries and exits by enabling up or down signals and reversal labels (B) where price may revert toward the HMA. Suitable for a wide range of timeframes and instrument types, the script encourages a disciplined approach to trade management and risk control.
19. Disclaimer
This script is provided for informational and educational purposes only. Trading and investing involve significant financial risk, and no indicator can guarantee success under all conditions. Users should practice robust risk management, including the placement of stop losses and position sizing, and should confirm signals with additional analysis tools. The developer of this script assumes no liability for any trading decisions or outcomes resulting from its use.

Fibonacci Snap Tool [TradersPro]
OVERVIEW
The Fibonacci Snap tool automatically snaps to the swing high and swing low of the price data shown on the chart display. Fibonacci retracement levels can be used for entry, exit, or as a confirmation of trend continuation.
If the swing high on the chart comes before the swing low, the price is in a downtrend.If the swing high comes after the swing low, the price is in an uptrend.
We call the 23.60% Fibonacci level the momentum zone of the trend. Price in a solid trend, either up or down, will typically hold the 23.60% Fibonacci level as support (demand) in an uptrend or resistance (supply) in a downtrend.
Deeper Fibonacci levels of 38.20%, 50.00%, and 61.80% are corrective supply/demand zones. As price moves against the found trend, it can move into this range block we call the corrective zone.
Fibonacci retracement levels are used to identify potential supply/demand areas where price could reverse or consolidate. These levels are based on key ratios derived from the Fibonacci sequence, and we only use the core 23.60%, 38.20%, 50.00%, and 61.80% ratios.
CONCEPTS
Price action moves in trend cycles, these retracement levels help traders measure proportional relationships between the high/low swings in the price trend.
When a price trend is moving against the trend, traders can find opportunities to trade with the current trend at key Fibonacci levels. Fibonacci levels can be used to anticipate where price might find supply/demand imbalance and continue moving in the trend direction.
Traders apply the indicator by selecting a window of price they want to analyze in the chart display, and the Fibonacci Snap tool will snap to the high and low of the visible price display.
The Intent and Use of This Tool
The 23.60% level acts as a momentum or continuation of trend. The 38.20% to 61.80% range are corrective zones of the trend.
The 61.80% level, also known as the golden ratio (Google the term “Golden Ratio”; it's fun), can often represent the location of supply/demand imbalance.
In an uptrend, it can represent the area of no more selling supply, and the balance can shift to buying demand. In a downtrend, it can represent the area of no more buying demand and the balance can shift to selling supply.
When used with the Momentum Zones indicator, these two tools create a powerful combination for traders to find, implement, and manage trades.

lib_smcLibrary "lib_smc"
This is an adaptation of LuxAlgo's Smart Money Concepts indicator with numerous changes. Main changes include integration of object based plotting, plenty of performance improvements, live tracking of Order Blocks, integration of volume profiles to refine Order Blocks, and many more.
This is a library for developers, if you want this converted into a working strategy, let me know.
buffer(item, len, force_rotate)
Parameters:
item (float)
len (int)
force_rotate (bool)
buffer(item, len, force_rotate)
Parameters:
item (int)
len (int)
force_rotate (bool)
buffer(item, len, force_rotate)
Parameters:
item (Profile type from robbatt/lib_profile/32)
len (int)
force_rotate (bool)
swings(len)
INTERNAL: detect swing points (HH and LL) in given range
Parameters:
len (simple int) : range to check for new swing points
Returns: values are the price level where and if a new HH or LL was detected, else na
method init(this)
Namespace types: OrderBlockConfig
Parameters:
this (OrderBlockConfig)
method delete(this)
Namespace types: OrderBlock
Parameters:
this (OrderBlock)
method clear_broken(this, broken_buffer)
INTERNAL: delete internal order blocks box coordinates if top/bottom is broken
Namespace types: map
Parameters:
this (map)
broken_buffer (map)
Returns: any_bull_ob_broken, any_bear_ob_broken, broken signals are true if an according order block was broken/mitigated, broken contains the broken block(s)
create_ob(id, mode, start_t, start_i, top, end_t, end_i, bottom, break_price, early_confirmation_price, config, init_plot, force_overlay)
INTERNAL: set internal order block coordinates
Parameters:
id (int)
mode (int) : 1: bullish, -1 bearish block
start_t (int)
start_i (int)
top (float)
end_t (int)
end_i (int)
bottom (float)
break_price (float)
early_confirmation_price (float)
config (OrderBlockConfig)
init_plot (bool)
force_overlay (bool)
Returns: signals are true if an according order block was broken/mitigated
method align_to_profile(block, align_edge, align_break_price)
Namespace types: OrderBlock
Parameters:
block (OrderBlock)
align_edge (bool)
align_break_price (bool)
method create_profile(block, opens, tops, bottoms, closes, values, resolution, vah_pc, val_pc, args, init_calculated, init_plot, force_overlay)
Namespace types: OrderBlock
Parameters:
block (OrderBlock)
opens (array)
tops (array)
bottoms (array)
closes (array)
values (array)
resolution (int)
vah_pc (float)
val_pc (float)
args (ProfileArgs type from robbatt/lib_profile/32)
init_calculated (bool)
init_plot (bool)
force_overlay (bool)
method create_profile(block, resolution, vah_pc, val_pc, args, init_calculated, init_plot, force_overlay)
Namespace types: OrderBlock
Parameters:
block (OrderBlock)
resolution (int)
vah_pc (float)
val_pc (float)
args (ProfileArgs type from robbatt/lib_profile/32)
init_calculated (bool)
init_plot (bool)
force_overlay (bool)
track_obs(swing_len, hh, ll, top, btm, bull_bos_alert, bull_choch_alert, bear_bos_alert, bear_choch_alert, min_block_size, max_block_size, config_bull, config_bear, init_plot, force_overlay, enabled, extend_blocks, clear_broken_buffer_before, align_edge_to_value_area, align_break_price_to_poc, profile_args_bull, profile_args_bear, use_soft_confirm, soft_confirm_offset, use_retracements_with_FVG_out)
Parameters:
swing_len (int)
hh (float)
ll (float)
top (float)
btm (float)
bull_bos_alert (bool)
bull_choch_alert (bool)
bear_bos_alert (bool)
bear_choch_alert (bool)
min_block_size (float)
max_block_size (float)
config_bull (OrderBlockConfig)
config_bear (OrderBlockConfig)
init_plot (bool)
force_overlay (bool)
enabled (bool)
extend_blocks (simple bool)
clear_broken_buffer_before (simple bool)
align_edge_to_value_area (simple bool)
align_break_price_to_poc (simple bool)
profile_args_bull (ProfileArgs type from robbatt/lib_profile/32)
profile_args_bear (ProfileArgs type from robbatt/lib_profile/32)
use_soft_confirm (simple bool)
soft_confirm_offset (float)
use_retracements_with_FVG_out (simple bool)
method draw(this, config, extend_only)
Namespace types: OrderBlock
Parameters:
this (OrderBlock)
config (OrderBlockConfig)
extend_only (bool)
method draw(blocks, config)
INTERNAL: plot order blocks
Namespace types: array
Parameters:
blocks (array)
config (OrderBlockConfig)
method draw(blocks, config)
INTERNAL: plot order blocks
Namespace types: map
Parameters:
blocks (map)
config (OrderBlockConfig)
method cleanup(this, ob_bull, ob_bear)
removes all Profiles that are older than the latest OrderBlock from this profile buffer
Namespace types: array
Parameters:
this (array type from robbatt/lib_profile/32)
ob_bull (OrderBlock)
ob_bear (OrderBlock)
_plot_swing_points(mode, x, y, show_swing_points, linecolor_swings, keep_history, show_latest_swings_levels, trail_x, trail_y, trend)
INTERNAL: plot swing points
Parameters:
mode (int) : 1: bullish, -1 bearish block
x (int) : x-coordingate of swing point to plot (bar_index)
y (float) : y-coordingate of swing point to plot (price)
show_swing_points (bool) : switch to enable/disable plotting of swing point labels
linecolor_swings (color) : color for swing point labels and lates level lines
keep_history (bool) : weater to remove older swing point labels and only keep the most recent
show_latest_swings_levels (bool)
trail_x (int) : x-coordinate for latest swing point (bar_index)
trail_y (float) : y-coordinate for latest swing point (price)
trend (int) : the current trend 1: bullish, -1: bearish, to determine Strong/Weak Low/Highs
_pivot_lvl(mode, trend, hhll_x, hhll, super_hhll, filter_insignificant_internal_breaks)
INTERNAL: detect whether a structural level has been broken and if it was in trend direction (BoS) or against trend direction (ChoCh), also track the latest high and low swing points
Parameters:
mode (simple int) : detect 1: bullish, -1 bearish pivot points
trend (int) : current trend direction
hhll_x (int) : x-coordinate of newly detected hh/ll (bar_index)
hhll (float) : y-coordinate of newly detected hh/ll (price)
super_hhll (float) : level/y-coordinate of superior hhll (if this is an internal structure pivot level)
filter_insignificant_internal_breaks (bool) : if true pivot points / internal structure will be ignored where the wick in trend direction is longer than the opposite (likely to push further in direction of main trend)
Returns: coordinates of internal structure that has been broken (x,y): start of structure, (trail_x, trail_y): tracking hh/ll after structure break, (bos_alert, choch_alert): signal whether a structural level has been broken
_plot_structure(x, y, is_bos, is_choch, line_color, line_style, label_style, label_size, keep_history)
INTERNAL: plot structural breaks (BoS/ChoCh)
Parameters:
x (int) : x-coordinate of newly broken structure (bar_index)
y (float) : y-coordinate of newly broken structure (price)
is_bos (bool) : whether this structural break was in trend direction
is_choch (bool) : whether this structural break was against trend direction
line_color (color) : color for the line connecting the structural level and the breaking candle
line_style (string) : style (line.style_dashed/solid) for the line connecting the structural level and the breaking candle
label_style (string) : style (label.style_label_down/up) for the label above/below the line connecting the structural level and the breaking candle
label_size (string) : size (size.small/tiny) for the label above/below the line connecting the structural level and the breaking candle
keep_history (bool) : weater to remove older swing point labels and only keep the most recent
structure_values(length, super_hh, super_ll, filter_insignificant_internal_breaks)
detect (and plot) structural breaks and the resulting new trend
Parameters:
length (simple int) : lookback period for swing point detection
super_hh (float) : level/y-coordinate of superior hh (for internal structure detection)
super_ll (float) : level/y-coordinate of superior ll (for internal structure detection)
filter_insignificant_internal_breaks (bool) : if true pivot points / internal structure will be ignored where the wick in trend direction is longer than the opposite (likely to push further in direction of main trend)
Returns: trend: direction 1:bullish -1:bearish, (bull_bos_alert, bull_choch_alert, top_x, top_y, trail_up_x, trail_up): whether and which level broke in a bullish direction, trailing high, (bbear_bos_alert, bear_choch_alert, tm_x, btm_y, trail_dn_x, trail_dn): same in bearish direction
structure_plot(trend, bull_bos_alert, bull_choch_alert, top_x, top_y, trail_up_x, trail_up, hh, bear_bos_alert, bear_choch_alert, btm_x, btm_y, trail_dn_x, trail_dn, ll, color_bull, color_bear, show_swing_points, show_latest_swings_levels, show_bos, show_choch, line_style, label_size, keep_history)
detect (and plot) structural breaks and the resulting new trend
Parameters:
trend (int) : crrent trend 1: bullish, -1: bearish
bull_bos_alert (bool) : if there was a bullish bos alert -> plot it
bull_choch_alert (bool) : if there was a bullish choch alert -> plot it
top_x (int) : latest shwing high x
top_y (float) : latest swing high y
trail_up_x (int) : trailing high x
trail_up (float) : trailing high y
hh (float) : if there was a higher high
bear_bos_alert (bool) : if there was a bearish bos alert -> plot it
bear_choch_alert (bool) : if there was a bearish chock alert -> plot it
btm_x (int) : latest swing low x
btm_y (float) : latest swing low y
trail_dn_x (int) : trailing low x
trail_dn (float) : trailing low y
ll (float) : if there was a lower low
color_bull (color) : color for bullish BoS/ChoCh levels
color_bear (color) : color for bearish BoS/ChoCh levels
show_swing_points (bool) : whether to plot swing point labels
show_latest_swings_levels (bool) : whether to track and plot latest swing point levels with lines
show_bos (bool) : whether to plot BoS levels
show_choch (bool) : whether to plot ChoCh levels
line_style (string) : whether to plot BoS levels
label_size (string) : label size of plotted BoS/ChoCh levels
keep_history (bool) : weater to remove older swing point labels and only keep the most recent
structure(length, color_bull, color_bear, super_hh, super_ll, filter_insignificant_internal_breaks, show_swing_points, show_latest_swings_levels, show_bos, show_choch, line_style, label_size, keep_history, enabled)
detect (and plot) structural breaks and the resulting new trend
Parameters:
length (simple int) : lookback period for swing point detection
color_bull (color) : color for bullish BoS/ChoCh levels
color_bear (color) : color for bearish BoS/ChoCh levels
super_hh (float) : level/y-coordinate of superior hh (for internal structure detection)
super_ll (float) : level/y-coordinate of superior ll (for internal structure detection)
filter_insignificant_internal_breaks (bool) : if true pivot points / internal structure will be ignored where the wick in trend direction is longer than the opposite (likely to push further in direction of main trend)
show_swing_points (bool) : whether to plot swing point labels
show_latest_swings_levels (bool) : whether to track and plot latest swing point levels with lines
show_bos (bool) : whether to plot BoS levels
show_choch (bool) : whether to plot ChoCh levels
line_style (string) : whether to plot BoS levels
label_size (string) : label size of plotted BoS/ChoCh levels
keep_history (bool) : weater to remove older swing point labels and only keep the most recent
enabled (bool)
_check_equal_level(mode, len, eq_threshold, enabled)
INTERNAL: detect equal levels (double top/bottom)
Parameters:
mode (int) : detect 1: bullish/high, -1 bearish/low pivot points
len (int) : lookback period for equal level (swing point) detection
eq_threshold (float) : maximum price offset for a level to be considered equal
enabled (bool)
Returns: eq_alert whether an equal level was detected and coordinates of the first and the second level/swing point
_plot_equal_level(show_eq, x1, y1, x2, y2, label_txt, label_style, label_size, line_color, line_style, keep_history)
INTERNAL: plot equal levels (double top/bottom)
Parameters:
show_eq (bool) : whether to plot the level or not
x1 (int) : x-coordinate of the first level / swing point
y1 (float) : y-coordinate of the first level / swing point
x2 (int) : x-coordinate of the second level / swing point
y2 (float) : y-coordinate of the second level / swing point
label_txt (string) : text for the label above/below the line connecting the equal levels
label_style (string) : style (label.style_label_down/up) for the label above/below the line connecting the equal levels
label_size (string) : size (size.tiny) for the label above/below the line connecting the equal levels
line_color (color) : color for the line connecting the equal levels (and it's label)
line_style (string) : style (line.style_dotted) for the line connecting the equal levels
keep_history (bool) : weater to remove older swing point labels and only keep the most recent
equal_levels_values(len, threshold, enabled)
detect (and plot) equal levels (double top/bottom), returns coordinates
Parameters:
len (int) : lookback period for equal level (swing point) detection
threshold (float) : maximum price offset for a level to be considered equal
enabled (bool) : whether detection is enabled
Returns: (eqh_alert, eqh_x1, eqh_y1, eqh_x2, eqh_y2) whether an equal high was detected and coordinates of the first and the second level/swing point, (eql_alert, eql_x1, eql_y1, eql_x2, eql_y2) same for equal lows
equal_levels_plot(eqh_x1, eqh_y1, eqh_x2, eqh_y2, eql_x1, eql_y1, eql_x2, eql_y2, color_eqh, color_eql, show, keep_history)
detect (and plot) equal levels (double top/bottom), returns coordinates
Parameters:
eqh_x1 (int) : coordinates of first point of equal high
eqh_y1 (float) : coordinates of first point of equal high
eqh_x2 (int) : coordinates of second point of equal high
eqh_y2 (float) : coordinates of second point of equal high
eql_x1 (int) : coordinates of first point of equal low
eql_y1 (float) : coordinates of first point of equal low
eql_x2 (int) : coordinates of second point of equal low
eql_y2 (float) : coordinates of second point of equal low
color_eqh (color) : color for the line connecting the equal highs (and it's label)
color_eql (color) : color for the line connecting the equal lows (and it's label)
show (bool) : whether plotting is enabled
keep_history (bool) : weater to remove older swing point labels and only keep the most recent
Returns: (eqh_alert, eqh_x1, eqh_y1, eqh_x2, eqh_y2) whether an equal high was detected and coordinates of the first and the second level/swing point, (eql_alert, eql_x1, eql_y1, eql_x2, eql_y2) same for equal lows
equal_levels(len, threshold, color_eqh, color_eql, enabled, show, keep_history)
detect (and plot) equal levels (double top/bottom)
Parameters:
len (int) : lookback period for equal level (swing point) detection
threshold (float) : maximum price offset for a level to be considered equal
color_eqh (color) : color for the line connecting the equal highs (and it's label)
color_eql (color) : color for the line connecting the equal lows (and it's label)
enabled (bool) : whether detection is enabled
show (bool) : whether plotting is enabled
keep_history (bool) : weater to remove older swing point labels and only keep the most recent
Returns: (eqh_alert) whether an equal high was detected, (eql_alert) same for equal lows
_detect_fvg(mode, enabled, o, h, l, c, filter_insignificant_fvgs, change_tf)
INTERNAL: detect FVG (fair value gap)
Parameters:
mode (int) : detect 1: bullish, -1 bearish gaps
enabled (bool) : whether detection is enabled
o (float) : reference source open
h (float) : reference source high
l (float) : reference source low
c (float) : reference source close
filter_insignificant_fvgs (bool) : whether to calculate and filter small/insignificant gaps
change_tf (bool) : signal when the previous reference timeframe closed, triggers new calculation
Returns: whether a new FVG was detected and its top/mid/bottom levels
_clear_broken_fvg(mode, upper_boxes, lower_boxes)
INTERNAL: clear mitigated FVGs (fair value gaps)
Parameters:
mode (int) : detect 1: bullish, -1 bearish gaps
upper_boxes (array) : array that stores the upper parts of the FVG boxes
lower_boxes (array) : array that stores the lower parts of the FVG boxes
_plot_fvg(mode, show, top, mid, btm, border_color, extend_box)
INTERNAL: plot (and clear broken) FVG (fair value gap)
Parameters:
mode (int) : plot 1: bullish, -1 bearish gap
show (bool) : whether plotting is enabled
top (float) : top level of fvg
mid (float) : center level of fvg
btm (float) : bottom level of fvg
border_color (color) : color for the FVG box
extend_box (int) : how many bars into the future the FVG box should be extended after detection
fvgs_values(o, h, l, c, filter_insignificant_fvgs, change_tf, enabled)
detect (and plot / clear broken) FVGs (fair value gaps), and return alerts and level values
Parameters:
o (float) : reference source open
h (float) : reference source high
l (float) : reference source low
c (float) : reference source close
filter_insignificant_fvgs (bool) : whether to calculate and filter small/insignificant gaps
change_tf (bool) : signal when the previous reference timeframe closed, triggers new calculation
enabled (bool) : whether detection is enabled
Returns: (bullish_fvg_alert, bull_top, bull_mid, bull_btm): whether a new bullish FVG was detected and its top/mid/bottom levels, (bearish_fvg_alert, bear_top, bear_mid, bear_btm): same for bearish FVGs
fvgs_plot(bullish_fvg_alert, bull_top, bull_mid, bull_btm, bearish_fvg_alert, bear_top, bear_mid, bear_btm, color_bull, color_bear, extend_box, show)
Parameters:
bullish_fvg_alert (bool)
bull_top (float)
bull_mid (float)
bull_btm (float)
bearish_fvg_alert (bool)
bear_top (float)
bear_mid (float)
bear_btm (float)
color_bull (color) : color for bullish FVG boxes
color_bear (color) : color for bearish FVG boxes
extend_box (int) : how many bars into the future the FVG box should be extended after detection
show (bool) : whether plotting is enabled
Returns: (bullish_fvg_alert, bull_top, bull_mid, bull_btm): whether a new bullish FVG was detected and its top/mid/bottom levels, (bearish_fvg_alert, bear_top, bear_mid, bear_btm): same for bearish FVGs
fvgs(o, h, l, c, filter_insignificant_fvgs, change_tf, color_bull, color_bear, extend_box, enabled, show)
detect (and plot / clear broken) FVGs (fair value gaps)
Parameters:
o (float) : reference source open
h (float) : reference source high
l (float) : reference source low
c (float) : reference source close
filter_insignificant_fvgs (bool) : whether to calculate and filter small/insignificant gaps
change_tf (bool) : signal when the previous reference timeframe closed, triggers new calculation
color_bull (color) : color for bullish FVG boxes
color_bear (color) : color for bearish FVG boxes
extend_box (int) : how many bars into the future the FVG box should be extended after detection
enabled (bool) : whether detection is enabled
show (bool) : whether plotting is enabled
Returns: (bullish_fvg_alert): whether a new bullish FVG was detected, (bearish_fvg_alert): same for bearish FVGs
OrderBlock
Fields:
id (series int)
dir (series int)
left_top (chart.point)
right_bottom (chart.point)
break_price (series float)
early_confirmation_price (series float)
ltf_high (array)
ltf_low (array)
ltf_volume (array)
plot (Box type from robbatt/lib_plot_objects/49)
profile (Profile type from robbatt/lib_profile/32)
trailing (series bool)
extending (series bool)
awaiting_confirmation (series bool)
touched_break_price_before_confirmation (series bool)
soft_confirmed (series bool)
has_fvg_out (series bool)
hidden (series bool)
broken (series bool)
OrderBlockConfig
Fields:
show (series bool)
show_last (series int)
show_id (series bool)
show_profile (series bool)
args (BoxArgs type from robbatt/lib_plot_objects/49)
txt (series string)
txt_args (BoxTextArgs type from robbatt/lib_plot_objects/49)
delete_when_broken (series bool)
broken_args (BoxArgs type from robbatt/lib_plot_objects/49)
broken_txt (series string)
broken_txt_args (BoxTextArgs type from robbatt/lib_plot_objects/49)
broken_profile_args (ProfileArgs type from robbatt/lib_profile/32)
use_profile (series bool)
profile_args (ProfileArgs type from robbatt/lib_profile/32)

Dynamic Trend Lines-AYNETCode Summary: Dynamic Trend Lines
This code dynamically draws trend lines and labels based on swing highs and lows identified from historical price action.
Key Features
Swing Point Detection:
Uses the ta.pivothigh and ta.pivotlow functions to identify recent swing highs and swing lows based on a customizable lookback period.
Trend Lines:
Uptrend Line:
Draws a line connecting swing low points.
Colored in blue by default.
Downtrend Line:
Draws a line connecting swing high points.
Colored in red by default.
Lines dynamically adjust as new swing points are identified.
Labels:
Adds a circle-style label at each swing high and swing low.
Displays the price value of the swing point.
Labels have:
Green background for uptrends.
Red background for downtrends.
Customizable Inputs:
lookback: Sensitivity of swing point detection (higher value = fewer swings).
line_color_up and line_color_down: Colors for the trend lines.
label_bg_up and label_bg_down: Colors for the label backgrounds.
Auto Updates:
Trend lines and labels update dynamically as the chart progresses, ensuring they reflect the latest market conditions.
How It Works
Identify Swing Points:
Detects local highs and lows within the defined lookback period.
Draw Lines:
Uptrend lines are drawn from the most recent swing lows.
Downtrend lines are drawn from the most recent swing highs.
Add Labels:
Each swing point is labeled with its price value for easy reference.
Visual Output
Trend Lines:
Blue for uptrends, red for downtrends.
Labels:
Circular labels with price values:
Green for swing lows (uptrend points).
Red for swing highs (downtrend points).
Example Use Case
This script is useful for traders who want to:
Visually identify key trend lines based on swing highs and lows.
Understand the critical price points of market reversals.
Use labeled price points for informed trade decisions.
Let me know if you'd like any specific refinements! 😊
The Most Powerful TQQQ EMA Crossover Trend Trading StrategyTQQQ EMA Crossover Strategy Indicator
Meta Title: TQQQ EMA Crossover Strategy - Enhance Your Trading with Effective Signals
Meta Description: Discover the TQQQ EMA Crossover Strategy, designed to optimize trading decisions with fast and slow EMA crossovers. Learn how to effectively use this powerful indicator for better trading results.
Key Features
The TQQQ EMA Crossover Strategy is a powerful trading tool that utilizes Exponential Moving Averages (EMAs) to identify potential entry and exit points in the market. Key features of this indicator include:
**Fast and Slow EMAs:** The strategy incorporates two EMAs, allowing traders to capture short-term trends while filtering out market noise.
**Entry and Exit Signals:** Automated signals for entering and exiting trades based on EMA crossovers, enhancing decision-making efficiency.
**Customizable Parameters:** Users can adjust the lengths of the EMAs, as well as take profit and stop loss multipliers, tailoring the strategy to their trading style.
**Visual Indicators:** Clear visual plots of the EMAs and exit points on the chart for easy interpretation.
How It Works
The TQQQ EMA Crossover Strategy operates by calculating two EMAs: a fast EMA (default length of 20) and a slow EMA (default length of 50). The core concept is based on the crossover of these two moving averages:
- When the fast EMA crosses above the slow EMA, it generates a *buy signal*, indicating a potential upward trend.
- Conversely, when the fast EMA crosses below the slow EMA, it produces a *sell signal*, suggesting a potential downward trend.
This method allows traders to capitalize on momentum shifts in the market, providing timely signals for trade execution.
Trading Ideas and Insights
Traders can leverage the TQQQ EMA Crossover Strategy in various market conditions. Here are some insights:
**Scalping Opportunities:** The strategy is particularly effective for scalping in volatile markets, allowing traders to make quick profits on small price movements.
**Swing Trading:** Longer-term traders can use this strategy to identify significant trend reversals and capitalize on larger price swings.
**Risk Management:** By incorporating customizable stop loss and take profit levels, traders can manage their risk effectively while maximizing potential returns.
How Multiple Indicators Work Together
While this strategy primarily relies on EMAs, it can be enhanced by integrating additional indicators such as:
- **Relative Strength Index (RSI):** To confirm overbought or oversold conditions before entering trades.
- **Volume Indicators:** To validate breakout signals, ensuring that price movements are supported by sufficient trading volume.
Combining these indicators provides a more comprehensive view of market dynamics, increasing the reliability of trade signals generated by the EMA crossover.
Unique Aspects
What sets this indicator apart is its simplicity combined with effectiveness. The reliance on EMAs allows for smoother signals compared to traditional moving averages, reducing false signals often associated with choppy price action. Additionally, the ability to customize parameters ensures that traders can adapt the strategy to fit their unique trading styles and risk tolerance.
How to Use
To effectively utilize the TQQQ EMA Crossover Strategy:
1. **Add the Indicator:** Load the script onto your TradingView chart.
2. **Set Parameters:** Adjust the fast and slow EMA lengths according to your trading preferences.
3. **Monitor Signals:** Watch for crossover points; enter trades based on buy/sell signals generated by the indicator.
4. **Implement Risk Management:** Set your stop loss and take profit levels using the provided multipliers.
Regularly review your trading performance and adjust parameters as necessary to optimize results.
Customization
The TQQQ EMA Crossover Strategy allows for extensive customization:
- **EMA Lengths:** Change the default lengths of both fast and slow EMAs to suit different time frames or market conditions.
- **Take Profit/Stop Loss Multipliers:** Adjust these values to align with your risk management strategy. For instance, increasing the take profit multiplier may yield larger gains but could also increase exposure to market fluctuations.
This flexibility makes it suitable for various trading styles, from aggressive scalpers to conservative swing traders.
Conclusion
The TQQQ EMA Crossover Strategy is an effective tool for traders seeking an edge in their trading endeavors. By utilizing fast and slow EMAs, this indicator provides clear entry and exit signals while allowing for customization to fit individual trading strategies. Whether you are a scalper looking for quick profits or a swing trader aiming for larger moves, this indicator offers valuable insights into market trends.
Incorporate it into your TradingView toolkit today and elevate your trading performance!

Alboncalc: Top and Bottom Detector - Straight Line ContinuityDescription:
The "Alboncalc: Top and Bottom Detector - Straight Line Continuity" is an innovative indicator for identifying key price reversal points (tops and bottoms) with precision. Unlike traditional indicators that focus on abstract data representations like oscillators or momentum-based lines, this indicator directly overlays the price chart. It draws a continuous line connecting highs and lows (tops and bottoms), providing traders with a clear and immediate visual representation of market swings. The lines automatically adjust in real-time, maintaining a straight path during trend continuations and only shifting when a trend reversal is detected.
Originality and Usefulness:
This indicator stands out from other tools available on TradingView due to its unique ability to maintain a continuous line across price swings, preserving accuracy and visual clarity. Most traditional top-and-bottom detectors merely mark points or provide indicators that are disconnected from price action, making it harder for traders to spot patterns. This script takes a different approach by drawing lines directly on the price chart, offering greater precision and better trend visualization. This innovation is particularly useful for traders who rely on visual cues and price action analysis to make decisions. It simplifies the process of identifying reversal points and trends without needing to rely on lagging indicators.
How It Works:
This indicator detects tops and bottoms based on user-defined periods. When the highest point in a given period is detected, it marks it as a top, and similarly, when the lowest point is detected, it marks it as a bottom. As the price moves, the indicator adjusts the lines to connect consecutive tops and bottoms. If the trend continues in the same direction (e.g., an uptrend), the line remains straight and extends. If a reversal is detected, a new line is drawn to connect the previous bottom (or top) to the new reversal point, providing an accurate visual representation of market trends.
How to Use:
1. Load the Indicator: Add the "Alboncalc: Top and Bottom Detector - Straight Line Continuity" to your chart from the TradingView script library.
2. Customize Settings: Adjust the "Top Period" and "Bottom Period" inputs to fine-tune the sensitivity of top and bottom detection based on your preferred timeframe.
3. Observe Price Action: As the price moves, the indicator will draw lines directly over the price chart, connecting tops and bottoms.
4. Interpret the Lines: Use the continuous lines to identify ongoing trends and potential reversal points. The line remains straight during trend continuation, indicating sustained movement in one direction. A new line signifies a reversal in the trend.
This tool is ideal for traders using trend-following strategies, breakout detection, or those who prefer clean, visual price action analysis (Only Tops and Bottons).
Underlying Concepts:
The core of this indicator is based on the highest high and lowest low concept, which is common in technical analysis. The logic is simple:
- A top is detected when the price reaches a high point compared to a user-defined number of prior candles (i.e., the `top_period`).
- A bottom is detected when the price hits a low point compared to the prior candles (i.e., the `bottom_period`).
When the price continues in the same trend, the line is extended without a break. This behavior ensures that trends are represented in a clear and consistent manner, which helps traders better identify trend continuations and reversals.
Code Breakdown:
```pinescript
//@version=5
indicator("Top and Bottom Detector - Straight Line Continuity", overlay=true)
```
- This initializes the indicator and specifies that it will overlay directly on the price chart.
```pinescript
var int top_period = input.int(5, title="Top Period", minval=1)
var int bottom_period = input.int(5, title="Bottom Period", minval=1)
```
- These inputs allow the user to customize the number of candles used to identify tops and bottoms. A higher period results in fewer but more significant top/bottom detections, while a lower period increases sensitivity.
```pinescript
isTop = ta.highest(top_period) == high
isBottom = ta.lowest(bottom_period) == low
```
- These lines check if the current candle has the highest high or the lowest low in the defined period. If true, the current price is either a top or a bottom.
```pinescript
var line currentLine = na
var float last_price = na
var int last_index = na
var bool isUpTrend = na
```
- These variables store the current line being drawn (`currentLine`), the last detected price (`last_price`), and the direction of the trend (`isUpTrend`). `last_index` tracks where the last top or bottom was detected.
```pinescript
if (isTop or isBottom)
if (not na(last_price))
if ((isTop and isUpTrend) or (isBottom and not isUpTrend))
line.set_xy2(currentLine, bar_index, (isTop ? high : low))
else
currentLine := line.new(x1=last_index, y1=last_price, x2=bar_index, y2=(isTop ? high : low), color=color.yellow, width=2)
last_price := (isTop ? high : low)
last_index := bar_index
isUpTrend := isTop
```
- The `if` block handles the logic of drawing the line. If a top or bottom is detected, and the trend continues (either an uptrend for tops or a downtrend for bottoms), the current line is extended using `line.set_xy2`. If a reversal is detected, a new line is drawn using `line.new`.
- The `last_price` and `last_index` variables are updated after each detection, and the `isUpTrend` flag is set based on whether a top or bottom was found.
Conclusion:
This indicator offers a more precise and visually intuitive way of identifying tops and bottoms directly on the price chart, making it an essential tool for traders focused on price action. Its ability to draw continuous lines through ongoing trends and adjust only upon a reversal makes it superior in terms of visual clarity compared to most conventional indicators.
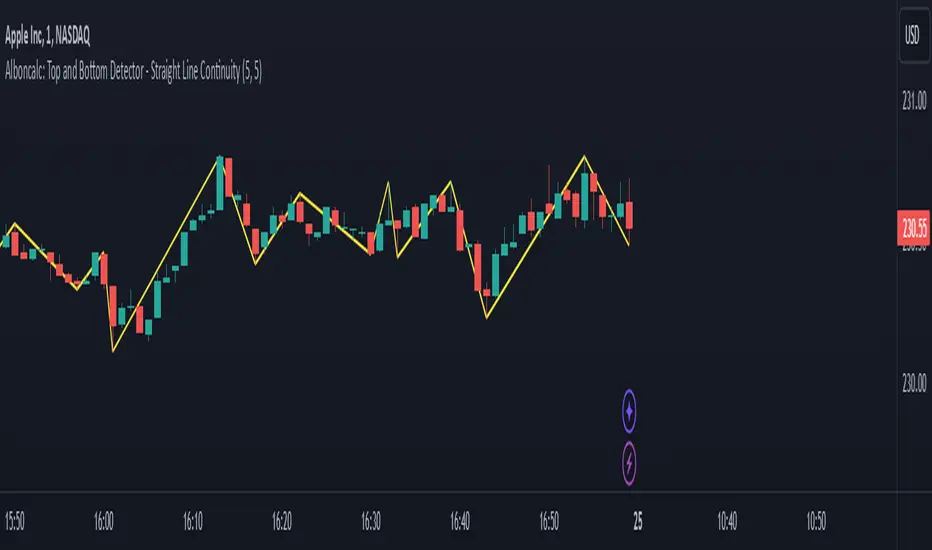
Multi-Average Trend Indicator (MATI)[FibonacciFlux]Multi-Average Trend Indicator (MATI)
Overview
The Multi-Average Trend Indicator (MATI) is a versatile technical analysis tool designed for traders who aim to enhance their market insights and streamline their decision-making processes across various timeframes. By integrating multiple advanced moving averages, this indicator serves as a robust framework for identifying market trends, making it suitable for different trading styles—from scalping to swing trading.
MATI 4-hourly support/resistance
MATI 1-hourly support/resistance
MATI 15 minutes support/resistance
MATI 1 minutes support/resistance
Key Features
1. Diverse Moving Averages
- COVWMA (Coefficient of Variation Weighted Moving Average) :
- Provides insights into price volatility, helping traders identify the strength of trends in fast-moving markets, particularly useful for 1-minute scalping .
- DEMA (Double Exponential Moving Average) :
- Minimizes lag and quickly responds to price changes, making it ideal for capturing short-term price movements during volatile trading sessions .
- EMA (Exponential Moving Average) :
- Focuses on recent price action to indicate the prevailing trend, vital for day traders looking to enter positions based on current momentum.
- KAMA (Kaufman's Adaptive Moving Average) :
- Adapts to market volatility, smoothing out price action and reducing false signals, which is crucial for 4-hour day trading strategies.
- SMA (Simple Moving Average) :
- Provides a foundational view of the market trend, useful for swing traders looking at overall price direction over longer periods.
- VIDYA (Variable Index Dynamic Average) :
- Adjusts based on market conditions, offering a dynamic perspective that can help traders capture emerging trends.
2. Combined Moving Average
- The MATI's combined moving average synthesizes all individual moving averages into a single line, providing a clear and concise summary of market direction. This feature is especially useful for identifying trend continuations or reversals across various timeframes .
3. Dynamic Color Coding
- Each moving average is visually represented with color coding:
- Green indicates bullish conditions, while Red suggests bearish trends.
- This visual feedback allows traders to quickly assess market sentiment, facilitating faster decision-making.
4. Signal Generation and Alerts
- The indicator generates buy signals when the combined moving average crosses above its previous value, indicating a potential upward trend—ideal for quick entries in scalping.
- Conversely, sell signals are triggered when the combined moving average crosses below its previous value, useful for exiting positions or entering short trades.
Insights and Applications
1. Scalping on 1-Minute Charts
- The MATI excels in fast-paced environments, allowing scalpers to identify quick entry and exit points based on short-term trends. With dynamic signals and alerts, traders can react swiftly to price movements, maximizing profit potential in brief price fluctuations.
2. Day Trading on 4-Hour Charts
- For day traders, the MATI provides essential insights into intraday trends. By analyzing the combined moving average and its relation to individual moving averages, traders can make informed decisions on when to enter or exit positions, capitalizing on daily price swings.
3. Swing Trading on Daily Charts
- The MATI also serves as a valuable tool for swing traders. By evaluating longer-term trends through the combined moving average, traders can identify potential swing points and adjust their strategies accordingly. The flexibility of adjusting the lengths of the moving averages allows for tailored approaches based on market volatility.
Benefits
1. Clarity and Insight
- The combination of diverse moving averages offers a clear visual representation of market trends, aiding traders in making informed decisions across multiple timeframes.
2. Flexibility and Customization
- With adjustable parameters, traders can adapt the MATI to their specific strategies, making it suitable for various market conditions and trading styles.
3. Real-Time Alerts and Efficiency
- Built-in alerts minimize response times, allowing traders to capitalize on opportunities as they arise, regardless of their trading style.
Conclusion
The Multi-Average Trend Indicator (MATI) is an essential tool for traders seeking to enhance their technical analysis capabilities. By seamlessly integrating multiple moving averages with dynamic color coding and real-time alerts, this indicator provides a comprehensive approach to understanding market trends. Its versatility makes it an invaluable asset for scalpers, day traders, and swing traders alike.
Important Note
As with any trading tool, thorough analysis and risk management are crucial when using this indicator. Past performance does not guarantee future results, and traders should always be prepared for market fluctuations.

ICT Master Suite [Trading IQ]Hello Traders!
We’re excited to introduce the ICT Master Suite by TradingIQ, a new tool designed to bring together several ICT concepts and strategies in one place.
The Purpose Behind the ICT Master Suite
There are a few challenges traders often face when using ICT-related indicators:
Many available indicators focus on one or two ICT methods, which can limit traders who apply a broader range of ICT related techniques on their charts.
There aren't many indicators for ICT strategy models, and we couldn't find ICT indicators that allow for testing the strategy models and setting alerts.
Many ICT related concepts exist in the public domain as indicators, not strategies! This makes it difficult to verify that the ICT concept has some utility in the market you're trading and if it's worth trading - it's difficult to know if it's working!
Some users might not have enough chart space to apply numerous ICT related indicators, which can be restrictive for those wanting to use multiple ICT techniques simultaneously.
The ICT Master Suite is designed to offer a comprehensive option for traders who want to apply a variety of ICT methods. By combining several ICT techniques and strategy models into one indicator, it helps users maximize their chart space while accessing multiple tools in a single slot.
Additionally, the ICT Master Suite was developed as a strategy . This means users can backtest various ICT strategy models - including deep backtesting. A primary goal of this indicator is to let traders decide for themselves what markets to trade ICT concepts in and give them the capability to figure out if the strategy models are worth trading!
What Makes the ICT Master Suite Different
There are many ICT-related indicators available on TradingView, each offering valuable insights. What the ICT Master Suite aims to do is bring together a wider selection of these techniques into one tool. This includes both key ICT methods and strategy models, allowing traders to test and activate strategies all within one indicator.
Features
The ICT Master Suite offers:
Multiple ICT strategy models, including the 2022 Strategy Model and Unicorn Model, which can be built, tested, and used for live trading.
Calculation and display of key price areas like Breaker Blocks, Rejection Blocks, Order Blocks, Fair Value Gaps, Equal Levels, and more.
The ability to set alerts based on these ICT strategies and key price areas.
A comprehensive, yet practical, all-inclusive ICT indicator for traders.
Customizable Timeframe - Calculate ICT concepts on off-chart timeframes
Unicorn Strategy Model
2022 Strategy Model
Liquidity Raid Strategy Model
OTE (Optimal Trade Entry) Strategy Model
Silver Bullet Strategy Model
Order blocks
Breaker blocks
Rejection blocks
FVG
Strong highs and lows
Displacements
Liquidity sweeps
Power of 3
ICT Macros
HTF previous bar high and low
Break of Structure indications
Market Structure Shift indications
Equal highs and lows
Swings highs and swing lows
Fibonacci TPs and SLs
Swing level TPs and SLs
Previous day high and low TPs and SLs
And much more! An ongoing project!
How To Use
Many traders will already be familiar with the ICT related concepts listed above, and will find using the ICT Master Suite quite intuitive!
Despite this, let's go over the features of the tool in-depth and how to use the tool!
The image above shows the ICT Master Suite with almost all techniques activated.
ICT 2022 Strategy Model
The ICT Master suite provides the ability to test, set alerts for, and live trade the ICT 2022 Strategy Model.
The image above shows an example of a long position being entered following a complete setup for the 2022 ICT model.
A liquidity sweep occurs prior to an upside breakout. During the upside breakout the model looks for the FVG that is nearest 50% of the setup range. A limit order is placed at this FVG for entry.
The target entry percentage for the range is customizable in the settings. For instance, you can select to enter at an FVG nearest 33% of the range, 20%, 66%, etc.
The profit target for the model generally uses the highest high of the range (100%) for longs and the lowest low of the range (100%) for shorts. Stop losses are generally set at 0% of the range.
The image above shows the short model in action!
Whether you decide to follow the 2022 model diligently or not, you can still set alerts when the entry condition is met.
ICT Unicorn Model
The image above shows an example of a long position being entered following a complete setup for the ICT Unicorn model.
A lower swing low followed by a higher swing high precedes the overlap of an FVG and breaker block formed during the sequence.
During the upside breakout the model looks for an FVG and breaker block that formed during the sequence and overlap each other. A limit order is placed at the nearest overlap point to current price.
The profit target for this example trade is set at the swing high and the stop loss at the swing low. However, both the profit target and stop loss for this model are configurable in the settings.
For Longs, the selectable profit targets are:
Swing High
Fib -0.5
Fib -1
Fib -2
For Longs, the selectable stop losses are:
Swing Low
Bottom of FVG or breaker block
The image above shows the short version of the Unicorn Model in action!
For Shorts, the selectable profit targets are:
Swing Low
Fib -0.5
Fib -1
Fib -2
For Shorts, the selectable stop losses are:
Swing High
Top of FVG or breaker block
The image above shows the profit target and stop loss options in the settings for the Unicorn Model.
Optimal Trade Entry (OTE) Model
The image above shows an example of a long position being entered following a complete setup for the OTE model.
Price retraces either 0.62, 0.705, or 0.79 of an upside move and a trade is entered.
The profit target for this example trade is set at the -0.5 fib level. This is also adjustable in the settings.
For Longs, the selectable profit targets are:
Swing High
Fib -0.5
Fib -1
Fib -2
The image above shows the short version of the OTE Model in action!
For Shorts, the selectable profit targets are:
Swing Low
Fib -0.5
Fib -1
Fib -2
Liquidity Raid Model
The image above shows an example of a long position being entered following a complete setup for the Liquidity Raid Modell.
The user must define the session in the settings (for this example it is 13:30-16:00 NY time).
During the session, the indicator will calculate the session high and session low. Following a “raid” of either the session high or session low (after the session has completed) the script will look for an entry at a recently formed breaker block.
If the session high is raided the script will look for short entries at a bearish breaker block. If the session low is raided the script will look for long entries at a bullish breaker block.
For Longs, the profit target options are:
Swing high
User inputted Lib level
For Longs, the stop loss options are:
Swing low
User inputted Lib level
Breaker block bottom
The image above shows the short version of the Liquidity Raid Model in action!
For Shorts, the profit target options are:
Swing Low
User inputted Lib level
For Shorts, the stop loss options are:
Swing High
User inputted Lib level
Breaker block top
Silver Bullet Model
The image above shows an example of a long position being entered following a complete setup for the Silver Bullet Modell.
During the session, the indicator will determine the higher timeframe bias. If the higher timeframe bias is bullish the strategy will look to enter long at an FVG that forms during the session. If the higher timeframe bias is bearish the indicator will look to enter short at an FVG that forms during the session.
For Longs, the profit target options are:
Nearest Swing High Above Entry
Previous Day High
For Longs, the stop loss options are:
Nearest Swing Low
Previous Day Low
The image above shows the short version of the Silver Bullet Model in action!
For Shorts, the profit target options are:
Nearest Swing Low Below Entry
Previous Day Low
For Shorts, the stop loss options are:
Nearest Swing High
Previous Day High
Order blocks
The image above shows indicator identifying and labeling order blocks.
The color of the order blocks, and how many should be shown, are configurable in the settings!
Breaker Blocks
The image above shows indicator identifying and labeling order blocks.
The color of the breaker blocks, and how many should be shown, are configurable in the settings!
Rejection Blocks
The image above shows indicator identifying and labeling rejection blocks.
The color of the rejection blocks, and how many should be shown, are configurable in the settings!
Fair Value Gaps
The image above shows indicator identifying and labeling fair value gaps.
The color of the fair value gaps, and how many should be shown, are configurable in the settings!
Additionally, you can select to only show fair values gaps that form after a liquidity sweep. Doing so reduces "noisy" FVGs and focuses on identifying FVGs that form after a significant trading event.
The image above shows the feature enabled. A fair value gap that occurred after a liquidity sweep is shown.
Market Structure
The image above shows the ICT Master Suite calculating market structure shots and break of structures!
The color of MSS and BoS, and whether they should be displayed, are configurable in the settings.
Displacements
The images above show indicator identifying and labeling displacements.
The color of the displacements, and how many should be shown, are configurable in the settings!
Equal Price Points
The image above shows the indicator identifying and labeling equal highs and equal lows.
The color of the equal levels, and how many should be shown, are configurable in the settings!
Previous Custom TF High/Low
The image above shows the ICT Master Suite calculating the high and low price for a user-defined timeframe. In this case the previous day’s high and low are calculated.
To illustrate the customizable timeframe function, the image above shows the indicator calculating the previous 4 hour high and low.
Liquidity Sweeps
The image above shows the indicator identifying a liquidity sweep prior to an upside breakout.
The image above shows the indicator identifying a liquidity sweep prior to a downside breakout.
The color and aggressiveness of liquidity sweep identification are adjustable in the settings!
Power Of Three
The image above shows the indicator calculating Po3 for two user-defined higher timeframes!
Macros
The image above shows the ICT Master Suite identifying the ICT macros!
ICT Macros are only displayable on the 5 minute timeframe or less.
Strategy Performance Table
In addition to a full-fledged TradingView backtest for any of the ICT strategy models the indicator offers, a quick-and-easy strategy table exists for the indicator!
The image above shows the strategy performance table in action.
Keep in mind that, because the ICT Master Suite is a strategy script, you can perform fully automatic backtests, deep backtests, easily add commission and portfolio balance and look at pertinent metrics for the ICT strategies you are testing!
Lite Mode
Traders who want the cleanest chart possible can toggle on “Lite Mode”!
In Lite Mode, any neon or “glow” like effects are removed and key levels are marked as strict border boxes. You can also select to remove box borders if that’s what you prefer!
Settings Used For Backtest
For the displayed backtest, a starting balance of $1000 USD was used. A commission of 0.02%, slippage of 2 ticks, a verify price for limit orders of 2 ticks, and 5% of capital investment per order.
A commission of 0.02% was used due to the backtested asset being a perpetual future contract for a crypto currency. The highest commission (lowest-tier VIP) for maker orders on many exchanges is 0.02%. All entered positions take place as maker orders and so do profit target exits. Stop orders exist as stop-market orders.
A slippage of 2 ticks was used to simulate more realistic stop-market orders. A verify limit order settings of 2 ticks was also used. Even though BTCUSDT.P on Binance is liquid, we just want the backtest to be on the safe side. Additionally, the backtest traded 100+ trades over the period. The higher the sample size the better; however, this example test can serve as a starting point for traders interested in ICT concepts.
Community Assistance And Feedback
Given the complexity and idiosyncratic applications of ICT concepts amongst its proponents, the ICT Master Suite’s built-in strategies and level identification methods might not align with everyone's interpretation.
That said, the best we can do is precisely define ICT strategy rules and concepts to a repeatable process, test, and apply them! Whether or not an ICT strategy is trading precisely how you would trade it, seeing the model in action, taking trades, and with performance statistics is immensely helpful in assessing predictive utility.
If you think we missed something, you notice a bug, have an idea for strategy model improvement, please let us know! The ICT Master Suite is an ongoing project that will, ideally, be shaped by the community.
A big thank you to the @PineCoders for their Time Library!
Thank you!

Indicator 10**Indicator 10** is a sophisticated technical analysis tool designed for use on trading platforms that support Pine Script (version 5). This indicator is primarily focused on analyzing price movements over different timeframes, incorporating elements of ZigZag analysis, Fibonacci levels, and historical price range calculations. Below is a detailed description of its features and functionalities:
#### Key Features:
1. **Input Variables:**
- **Year_calc:** Specifies the number of years to consider for historical price range calculations.
- **Size_fibo:** Defines the size of the Fibonacci levels in points.
- **Dig:** Represents the minimum tick size for the instrument being analyzed.
- **ZigZag Parameters:**
- **Period (zigzag_len):** The length of the ZigZag indicator.
- **Depth (zigzag_depth):** The depth percentage for the ZigZag indicator.
- **Display Count (zigzag_hist):** The number of ZigZag points to display.
- **Font Size (font_size):** The size of the font used for labels.
2. **Historical Price Range Calculation:**
- The indicator calculates the average weekly and monthly price ranges over the specified number of years (`Year_calc`).
- These ranges are used to adjust the Fibonacci levels dynamically based on historical volatility.
3. **ZigZag Analysis:**
- The indicator employs a custom ZigZag function to identify significant price swings on different timeframes (H4, D1, W1).
- The ZigZag points are stored in arrays, allowing for the visualization of recent price swings.
4. **Fibonacci Adjustment:**
- The Fibonacci levels are adjusted based on the historical price ranges (`W1_Val`, `MN1_Val`, `D1_Val`).
- These adjusted levels are used to draw support and resistance lines on the chart.
5. **Visualization:**
- The indicator draws lines and labels on the chart to represent the ZigZag points and adjusted Fibonacci levels.
- Different colors are used to distinguish between upward and downward trends.
6. **Dynamic Updates:**
- The indicator continuously updates the ZigZag points and Fibonacci levels as new price data becomes available.
- It ensures that only the most recent ZigZag points are displayed, maintaining a clean and relevant chart.
#### How It Works:
1. **Initialization:**
- The indicator initializes variables for storing historical price ranges and ZigZag points.
- It sets the start date for historical calculations based on the current year minus the specified number of years (`Year_calc`).
2. **Historical Data Retrieval:**
- The indicator retrieves weekly and monthly high and low prices for the specified period.
- It calculates the total price range and the average range for each timeframe.
3. **ZigZag Calculation:**
- The custom ZigZag function identifies local highs and lows based on the specified period and depth.
- These points are stored in arrays for later visualization.
4. **Fibonacci Adjustment:**
- The Fibonacci levels are adjusted based on the historical price ranges and the specified Fibonacci size.
- These adjusted levels are used to draw lines on the chart.
5. **Visualization:**
- The indicator draws lines connecting ZigZag points and labels indicating the direction of the trend.
- It ensures that only the most recent ZigZag points are displayed, maintaining a clean and relevant chart.
6. **Continuous Updates:**
- The indicator continuously updates the ZigZag points and Fibonacci levels as new price data becomes available.
- It ensures that only the most recent ZigZag points are displayed, maintaining a clean and relevant chart.
#### Conclusion:
**Indicator 10** is a powerful tool for traders who rely on historical price analysis, ZigZag patterns, and Fibonacci levels to make trading decisions. Its dynamic and adaptive nature ensures that the chart remains relevant and useful, providing traders with a clear view of recent price movements and potential support/resistance levels.

Relative volume zone + Smart Order Flow Dynamic S/ROverview:
The Relative Volume Zone + Smart Order Flow with Dynamic S/R indicator is designed to help traders identify key trading opportunities by combining multiple technical components. This script integrates relative volume analysis, order flow detection, VWAP, RSI filtering, and dynamic support and resistance levels to offer a comprehensive view of the market conditions. It is particularly effective on shorter timeframes (M5, M15), making it suitable for scalping and day trading strategies.
Key Components:
1. Relative Volume Zones:
• The script calculates the relative volume by comparing the current volume with the average volume over a defined lookback period (volLookback). When the relative volume exceeds a specified multiplier (volMultiplier), it indicates a high volume zone, signaling potential accumulation or distribution areas.
• Purpose: Identifies high-volume trading zones that may act as significant support or resistance, indicating possible entry or exit points.
2. Smart Order Flow Analysis:
• The indicator uses Volume Delta (the difference between buying and selling volume) and a Cumulative Delta to detect order imbalances in the market.
• Order Imbalance is identified using a moving average of the Volume Delta (orderImbalance), which helps highlight hidden buying or selling pressure.
• Purpose: Reveals market sentiment by showing whether buyers or sellers dominate the market, aiding in the identification of trend reversals or continuations.
3. VWAP (Volume Weighted Average Price):
• VWAP is calculated over a default daily length (vwapLength) to show the average price a security has traded at throughout the day, based on both volume and price.
• Purpose: Provides insight into the fair value of the asset, indicating whether the market is in an accumulation or distribution phase.
4. RSI (Relative Strength Index) Filter:
• RSI is used to filter buy and sell signals, preventing trades in overbought or oversold conditions. It is calculated using a specified period (rsiPeriod).
• Purpose: Reduces false signals and improves trade accuracy by only allowing trades when RSI conditions align with volume and order flow signals.
5. Dynamic Support and Resistance Levels:
• The script dynamically plots support and resistance levels based on recent swing highs and lows (swingLookback).
• Purpose: Identifies potential reversal zones where price action may change direction, allowing for more precise entry and exit points.
How It Works:
• Buy Signal:
A buy signal is generated when:
• The price enters a high-volume zone.
• The price crosses above a 5-period moving average.
• The cumulative delta shows more buying pressure (cumulativeDelta > SMA of cumulativeDelta).
• The RSI is below 70 (not in overbought conditions).
• Sell Signal:
A sell signal is generated when:
• The price enters a high-volume zone.
• The price crosses below a 5-period moving average.
• The cumulative delta shows more selling pressure (cumulativeDelta < SMA of cumulativeDelta).
• The RSI is above 30 (not in oversold conditions).
• Dynamic Support and Resistance Lines:
Drawn based on recent swing highs and lows, these lines provide context for potential price reversals or breakouts.
• VWAP and Order Imbalance Lines:
Plotted to show the average traded price and highlight order flow shifts, helping to validate buy/sell signals.
How to Use:
1. Apply the Indicator:
Add the script to your chart and adjust the settings to match your trading style and preferred timeframe (optimized for M5/M15).
2. Interpret the Signals:
Use the buy and sell signals in conjunction with dynamic support/resistance, VWAP, and order imbalance lines to identify high-probability trade setups.
3. Monitor Alerts:
Set alerts for significant order flow events to receive notifications when there is a positive or negative order imbalance, indicating potential market shifts.
What Makes It Unique:
This script is unique because it combines multiple market analysis tools — relative volume zones, smart order flow, VWAP, RSI filtering, and dynamic support/resistance — to provide a well-rounded, multi-dimensional view of the market. This integration allows traders to make more informed decisions by validating signals across various indicators, enhancing overall trading accuracy and effectiveness.

[DarkTrader] Range Level ProbabilityThis indicator calculates and visualizes significant price levels, such as swing highs, swing lows, and mid-price levels, using advanced mathematical functions and statistical methods. It aims to provide traders with insights into potential support and resistance areas by analyzing past price swings and their statistical properties.
Usage :
Identifying Support and Resistance: The projected swing high and swing low levels can act as potential support and resistance zones. Traders can use these levels to anticipate where the price might reverse or experience a pause in its movement.
Trend Analysis: By analyzing the mid-price level and its relationship to the swing high and low, traders can gain insights into the current market trend and potential price direction.
Customizing for Different Periods: Traders can adjust the input parameters, such as the period for calculating the mean and standard deviation, to tailor the indicator to different timeframes and market conditions.
Enhancing Trading Decisions: The indicator provides additional context for trading decisions by combining statistical analysis with visual projections, helping traders make more informed choices and manage risk effectively.
Key Features :
Statistical Analysis: The indicator utilizes statistical techniques to estimate the probability of future price movements. It calculates the likelihood of price reaching certain levels based on historical data, providing a probabilistic view of potential price targets.
Dynamic Range Calculation: It dynamically calculates important price levels based on a defined period. This period is adjustable, allowing traders to customize the indicator to fit different market conditions and trading strategies.
Customizable Appearance: Traders can customize the colors of the projected lines and labels, making it easier to distinguish between different levels and adjust the visual representation to their preferences.
Real-Time Updates: The indicator updates in real time with each new price bar, ensuring that the projected levels reflect the most current market conditions.
The indicator projects key price levels on the chart, including :
Swing High: The highest price level within a specified period.
Swing Low: The lowest price level within the same period.
Mid-Price: The average price between the swing high and swing low.
These levels are drawn as horizontal lines on the chart, extending into the future, which helps traders anticipate potential support and resistance zones.

Price Action Volumetric Order Blocks [UAlgo]"Price Action Volumetric Order Blocks" indicator aims to identify significant price zones in the market based on a combination of price action and volume analysis. It utilizes the concept of "Order Blocks," which are areas on the chart where large orders are believed to have been placed, influencing price behavior. By analyzing price swings and volume activity, the indicator attempts to highlight potential support and resistance levels.
🔶 Key Features
Swing Length: This input allows you to adjust the timeframe used to identify price swings for order block detection. A longer swing length will focus on larger timeframes and potentially capture stronger order blocks.
Show Last X Order Blocks: This controls the number of order blocks displayed on the chart. You can choose to visualize a specific number of the most recent order blocks.
Violation Check: This setting determines how the indicator identifies potential order block violations. You can choose between "Wick" or "Close" violations. A "Wick" violation occurs when the price (wick) extends beyond the order block boundaries, while a "Close" violation signifies that the closing price breaches the order block.
Hide Overlap: This option allows you to manage the display of overlapping order blocks. If set to "True," only non-overlapping order blocks will be shown, potentially offering a clearer visualization.
Colors: You can customize the color scheme for bullish (upward) and bearish (downward) order blocks to enhance visual clarity on the chart.
🔶 Interpreting the Indicator
Order Blocks: The teal-colored boxes represent bullish order blocks, indicating areas of demand where buying pressure is likely to be strong. Red-colored boxes represent bearish order blocks, indicating areas of supply where selling pressure is likely to be dominant. These zones often signal potential reversal points or consolidation areas.
Strength Calculations: The indicator calculates the relative strength of bullish and bearish blocks based on volume. A higher bullish strength indicates stronger buying pressure, while higher bearish strength suggests more selling pressure. Traders can use this information to gauge the strength of a price level and predict future price movements.
Market Structure Lines: The indicator displays horizontal lines to depict the current market structure, labeled as "MSB" (Market Sell Balance) or "BOS" (Break of Structure). These lines can help visualize the prevailing trend direction.
Order Block Violations: When a price wick or close breaches an order block (depending on the chosen violation type), the corresponding order block visualization is removed from the chart. This can signify a potential weakening of the identified support or resistance zone.
🔶 Disclaimer
Use with Caution: This indicator is provided for educational and informational purposes only and should not be considered as financial advice. Users should exercise caution and perform their own analysis before making trading decisions based on the indicator's signals.
Not Financial Advice: The information provided by this indicator does not constitute financial advice, and the creator (UAlgo) shall not be held responsible for any trading losses incurred as a result of using this indicator.
Backtesting Recommended: Traders are encouraged to backtest the indicator thoroughly on historical data before using it in live trading to assess its performance and suitability for their trading strategies.
Risk Management: Trading involves inherent risks, and users should implement proper risk management strategies, including but not limited to stop-loss orders and position sizing, to mitigate potential losses.
No Guarantees: The accuracy and reliability of the indicator's signals cannot be guaranteed, as they are based on historical price data and past performance may not be indicative of future results.

Median Standard Deviation | viResearchMedian Standard Deviation | viResearch
The "Median Standard Deviation" indicator, developed by viResearch, introduces a unique combination of median smoothing and standard deviation to detect trends and volatility in market data. This tool provides traders with a stable and accurate measure of price trends by integrating median smoothing with a customized calculation of the standard deviation. This innovative approach allows for enhanced sensitivity to market fluctuations while filtering out short-term price noise.
Technical Composition and Calculation:
The "Median Standard Deviation" indicator incorporates median smoothing and dynamic standard deviation calculations to build upon traditional volatility measures.
Median Smoothing:
DEMA Calculation (len_dema): The script applies a Double Exponential Moving Average (DEMA) to smooth the price data over a user-defined period, reducing noise and helping traders focus on broader market trends.
Median Calculation (median_len): The smoothed DEMA data is further refined by calculating the 50th percentile (median) over a specified length, ensuring that the central tendency of price data is captured more accurately than with a simple moving average.
Volatility Measurement:
ATR Calculation (atr_len, atr_mul): The script incorporates the Average True Range (ATR) to measure market volatility. The user-defined ATR multiplier is applied to this value to calculate upper and lower trend bands around the median, providing a dynamic measure of potential price movement based on recent volatility.
Standard Deviation Analysis:
Standard Deviation Calculation (len_sd): The script calculates the standard deviation of the median over a user-defined length, providing another layer of volatility measurement. The upper and lower standard deviation bands (sdd, sdl) act as additional indicators of price extremes.
Trend Detection:
Trend Logic: The indicator uses the calculated bands to identify whether the price is moving within or outside the standard deviation and ATR bands. Crosses above or below these bands are used to signal potential uptrends or downtrends, offering traders a clear view of market direction.
Features and User Inputs:
The "Median Standard Deviation" script offers a variety of user inputs to customize the indicator to suit traders' styles and market conditions:
DEMA Length: Allows traders to adjust the sensitivity of the DEMA smoothing to control the amount of noise filtered from the price data.
Median Length: Users can define the length over which the median price is calculated, providing flexibility in capturing short-term or long-term trends.
ATR Length and Multiplier: These inputs let traders fine-tune the ATR calculation, affecting the size of the dynamic upper and lower bands.
Standard Deviation Length: Controls how the standard deviation is calculated, allowing for further customization in detecting price volatility.
Practical Applications:
The "Median Standard Deviation" indicator is particularly effective in volatile markets where price swings can lead to false signals using traditional methods. By combining median smoothing and standard deviation, this tool provides a more robust analysis of trends and price movements.
Key Uses:
Trend Following: The upper and lower bands provide clear signals for entering and exiting trades based on whether the price is moving outside the calculated ranges.
Volatility Detection: The integration of ATR and standard deviation bands allows traders to assess market volatility in real time, enabling more informed trading decisions.
Noise Reduction: The use of median smoothing ensures that short-term price fluctuations do not interfere with broader trend analysis, making this indicator ideal for traders looking to avoid whipsaws in volatile markets.
Advantages and Strategic Value:
The "Median Standard Deviation" indicator offers several key advantages:
Precision in Trend Detection: The combination of median smoothing and standard deviation allows traders to detect trends with greater accuracy, reducing the risk of false signals.
Customization: With several adjustable parameters, traders can fine-tune the indicator to suit different timeframes and trading strategies.
Volatility Sensitivity: By incorporating ATR and standard deviation, this indicator provides an adaptive measure of market volatility, ensuring that traders are always aware of potential price swings.
Summary and Usage Tips:
The "Median Standard Deviation" indicator is a powerful tool for traders looking to refine their analysis of market trends and volatility. Its combination of median smoothing and standard deviation provides a nuanced view of market movements, helping traders make better-informed decisions. It's recommended to experiment with the various input parameters to optimize the indicator for specific needs, whether used for trend detection, volatility analysis, or noise reduction. The "Median Standard Deviation" offers a reliable and adaptable solution for modern trading strategies.
Please keep in mind the following text: Backtests are based on past results and are not indicative of future performance.

Uptrick: SMA Pivot Marker### Uptrick: SMA Pivot Marker (SPM) — Extensive Guide
#### Introduction
The **Uptrick: SMA Pivot Marker (SPM)** is a sophisticated technical analysis tool crafted by Uptrick to help traders interpret market trends and identify key price levels where significant reversals might occur. By integrating the principles of the Simple Moving Average (SMA) with pivot point analysis, the SPM offers a comprehensive approach to understanding market dynamics. This extensive guide explores the purpose, functionality, and practical applications of the SPM, providing an in-depth analysis of its features, settings, and usage across various trading strategies.
#### Purpose of the SPM
The **SMA Pivot Marker (SPM)** aims to enhance trading strategies by offering a dual approach to market analysis:
1. **Trend Identification**:
- **Objective**: To discern the prevailing market direction and guide trading decisions based on the overall trend.
- **Method**: Utilizes the SMA to smooth out price fluctuations, providing a clearer picture of the trend. This helps traders align their trades with the market's direction, increasing the probability of successful trades.
2. **Pivot Point Detection**:
- **Objective**: To identify key levels where the price is likely to reverse, providing potential support and resistance zones.
- **Method**: Calculates and marks pivot highs and lows, which are significant price points where previous trends have reversed. These levels are used to predict future price movements and establish trading strategies.
3. **Trend Change Alerts**:
- **Objective**: To notify traders of potential shifts in market direction, enabling timely adjustments to trading positions.
- **Method**: Detects and highlights crossover and crossunder points of the smoothed line, indicating possible trend changes. This helps traders react promptly to changing market conditions.
#### Detailed Functionality
1. **Smoothing Line Calculation**:
- **Simple Moving Average (SMA)**:
- **Definition**: The SMA is a type of moving average that calculates the average of a security’s price over a specified number of periods. It smooths out price data to filter out short-term fluctuations and highlight the longer-term trend.
- **Calculation**: The SMA is computed by summing the closing prices of the chosen number of periods and then dividing by the number of periods. For example, a 20-period SMA adds the closing prices for the past 20 periods and divides by 20.
- **Purpose**: The SMA helps in identifying the direction of the trend. A rising SMA indicates an uptrend, while a falling SMA indicates a downtrend. This smoothing helps traders to avoid being misled by short-term price noise.
2. **Pivot Points Calculation**:
- **Pivot Highs and Lows**:
- **Definition**: Pivot points are significant price levels where a market trend is likely to reverse. A pivot high is the highest price over a certain period, surrounded by lower prices on both sides, while a pivot low is the lowest price surrounded by higher prices.
- **Calculation**: The SPM calculates pivot points based on a user-defined lookback period. For instance, if the lookback period is set to 3, the indicator will find the highest and lowest prices within the past 3 periods and mark these points.
- **Purpose**: Pivot points are used to identify potential support and resistance levels. Traders often use these levels to set entry and exit points, stop-loss orders, and to gauge market sentiment.
3. **Visualization**:
- **Smoothed Line Plot**:
- **Description**: The smoothed line, calculated using the SMA, is plotted on the chart to provide a visual representation of the trend. This line adjusts its color based on the trend direction, helping traders quickly assess the market condition.
- **Color Coding**: The smoothed line is colored green (upColor) when it is rising, indicating a bullish trend, and red (downColor) when it is falling, indicating a bearish trend. This color-coding helps traders visually differentiate between uptrends and downtrends.
- **Line Width**: The width of the line can be adjusted to improve visibility. A thicker line may be more noticeable, while a thinner line might provide a cleaner look on the chart.
- **Pivot Markers**:
- **Description**: Pivot highs and lows are marked on the chart with lines and labels. These markers help in visually identifying significant price levels.
- **Color and Labels**: Pivot highs are represented with green lines and labels ("H"), while pivot lows are marked with red lines and labels ("L"). This color scheme and labeling make it easy to distinguish between resistance (highs) and support (lows).
4. **Trend Change Detection**:
- **Trend Up**:
- **Detection**: The indicator identifies an upward trend change when the smoothed line crosses above its previous value. This crossover suggests a potential shift from a downtrend to an uptrend.
- **Usage**: Traders can interpret this signal as a potential buying opportunity or an indication to review and possibly adjust their trading positions to align with the new uptrend.
- **Trend Down**:
- **Detection**: A downward trend change is detected when the smoothed line crosses below its previous value. This crossunder indicates a potential shift from an uptrend to a downtrend.
- **Usage**: This signal can be used to consider selling opportunities or to reassess long positions in light of the emerging downtrend.
#### User Inputs
1. **Smoothing Period**:
- **Description**: This input determines the number of periods over which the SMA is calculated. It directly affects the smoothness of the line and the sensitivity of trend detection.
- **Range**: The smoothing period can be set to any integer value greater than or equal to 1. There is no specified upper limit, offering flexibility for various trading styles.
- **Default Value**: The default smoothing period is 20, which is a common choice for medium-term trend analysis.
- **Impact**: A longer smoothing period results in a smoother line, filtering out more noise and highlighting long-term trends. A shorter period makes the line more responsive to recent price changes, which can be useful for short-term trading strategies.
2. **Pivot Lookback**:
- **Description**: This input specifies the number of periods used to calculate the pivot highs and lows. It influences the sensitivity of pivot point detection and the relevance of the identified levels.
- **Range**: The pivot lookback period can be set to any integer value greater than or equal to 1, with no upper limit. Traders can adjust this parameter based on their trading timeframe and preferences.
- **Default Value**: The default lookback period is 3, which provides a balance between detecting significant pivots and avoiding excessive noise.
- **Impact**: A longer lookback period generates more stable pivot points, suitable for identifying long-term support and resistance levels. A shorter lookback period results in more frequent and recent pivot points, useful for intraday trading and quick responses to price changes.
#### Applications for Different Traders
1. **Trend Followers**:
- **Using the SMA**: Trend followers utilize the smoothed line to gauge the direction of the market. By aligning trades with the direction of the SMA, traders can capitalize on sustained trends and improve their chances of success.
- **Trend Change Alerts**: The trend change markers alert trend followers to potential shifts in market direction. These alerts help traders make timely decisions to enter or exit positions, ensuring they stay aligned with the prevailing trend.
2. **Reversal Traders**:
- **Pivot Points**: Reversal traders focus on pivot highs and lows to identify potential reversal points in the market. These points indicate where the market has previously reversed direction, providing potential entry and exit levels for trades.
- **Pivot Markers**: The visual markers for pivot highs and lows serve as clear signals for reversal traders. By monitoring these levels, traders can anticipate price reversals and plan their trades to exploit these opportunities.
3. **Swing Traders**:
- **Combining SMA and Pivot Points**: Swing traders can use the combination of the smoothed line and pivot points to identify medium-term trading opportunities. The smoothed line helps in understanding the broader trend, while pivot points provide specific levels for potential swings.
- **Trend Change Alerts**: Trend change markers help swing traders spot new swing opportunities as the market shifts direction. These markers provide potential entry points for swing trades and help traders adjust their strategies to capitalize on market movements.
4. **Scalpers**:
- **Short-Term Analysis**: Scalpers benefit from the short-term signals provided by the SPM. The smoothed line and pivot points offer insights into rapid price movements, while the trend change markers highlight quick trading opportunities.
- **Pivot Points**: For scalpers, pivot points are particularly useful in identifying key levels where price may reverse within a short time frame. By focusing on these levels, scalpers can plan trades with tight stop-loss orders and capitalize on quick price changes.
#### Implementation and Best Practices
1. **Setting Parameters**:
- **Smoothing Period**: Adjust the smoothing period according to your trading strategy and market conditions. For long-term analysis, use a longer period to filter out noise and highlight broader trends. For short-term trading, a shorter period provides more immediate insights into price movements.
- **Pivot Lookback**: Choose a lookback period that matches your trading timeframe. For intraday trading, a shorter lookback period offers quick identification of recent price levels. For swing trading or long-term strategies, a longer lookback period provides more stable pivot points.
2. **Combining with Other Indicators**:
- **Integration with Technical Tools**: The SPM can be used in conjunction with other technical indicators to enhance trading decisions. For instance, combining the
SPM with indicators like RSI (Relative Strength Index) or MACD (Moving Average Convergence Divergence) can provide additional confirmation for trend signals and pivot points.
- **Support and Resistance**: Integrate the SPM’s pivot points with other support and resistance levels to gain a comprehensive view of market conditions. This combined approach helps in identifying stronger levels of support and resistance, improving trade accuracy.
3. **Backtesting**:
- **Historical Performance**: Conduct backtesting with historical data to evaluate the effectiveness of the SPM. Analyze past performance to fine-tune the smoothing period and pivot lookback settings, ensuring they align with your trading style and market conditions.
- **Scenario Analysis**: Test the SPM under various market scenarios to understand its performance in different conditions. This analysis helps in assessing the reliability of the indicator and making necessary adjustments for diverse market environments.
4. **Customization**:
- **Visual Adjustments**: Customize the appearance of the smoothed line and pivot markers to enhance chart readability and match personal preferences. Clear visual representation of these elements improves the effectiveness of the indicator.
- **Alert Configuration**: Set up alerts for trend changes to receive timely notifications. Alerts help traders act quickly on potential market shifts without constant monitoring, allowing for more efficient trading decisions.
#### Conclusion
The **Uptrick: SMA Pivot Marker (SPM)** is a versatile and powerful technical analysis tool that combines the benefits of the Simple Moving Average with pivot point analysis. By providing insights into market trends, identifying key reversal points, and detecting trend changes, the SPM caters to a wide range of trading strategies, including trend following, reversal trading, swing trading, and scalping.
With its customizable inputs, visual markers, and trend change alerts, the SPM offers traders the flexibility to adapt the indicator to different market conditions and trading styles. Whether used independently or in conjunction with other technical tools, the SPM is designed to enhance trading decision-making and improve overall trading performance. By mastering the use of the SPM, traders can gain a valuable edge in navigating the complexities of financial markets and making more informed trading decisions.

Uptrick: Dynamic AMA RSI Indicator### **Uptrick: Dynamic AMA RSI Indicator**
**Overview:**
The **Uptrick: Dynamic AMA RSI Indicator** is an advanced technical analysis tool designed for traders who seek to optimize their trading strategies by combining adaptive moving averages with the Relative Strength Index (RSI). This indicator dynamically adjusts to market conditions, offering a nuanced approach to trend detection and momentum analysis. By leveraging the Adaptive Moving Average (AMA) and Fast Adaptive Moving Average (FAMA), along with RSI-based overbought and oversold signals, traders can better identify entry and exit points with higher precision and reduced noise.
**Key Components:**
1. **Source Input:**
- The source input is the price data that forms the basis of all calculations. Typically set to the closing price, traders can customize this to other price metrics such as open, high, low, or even the output of another indicator. This flexibility allows the **Uptrick** indicator to be tailored to a wide range of trading strategies.
2. **Adaptive Moving Average (AMA):**
- The AMA is a moving average that adapts its sensitivity based on the dominant market cycle. This adaptation allows the AMA to respond swiftly to significant price movements while smoothing out minor fluctuations, making it particularly effective in trending markets. The AMA adjusts its responsiveness dynamically using a calculated phase adjustment from the dominant cycle, ensuring it remains responsive to the current market environment without being overly reactive to market noise.
3. **Fast Adaptive Moving Average (FAMA):**
- The FAMA is a more sensitive version of the AMA, designed to react faster to price changes. It serves as a signal line in the crossover strategy, highlighting shorter-term trends. The interaction between the AMA and FAMA forms the core of the signal generation, with crossovers between these lines indicating potential buy or sell opportunities.
4. **Relative Strength Index (RSI):**
- The RSI is a momentum oscillator that measures the speed and change of price movements, providing insights into whether an asset is overbought or oversold. In the **Uptrick** indicator, the RSI is used to confirm the validity of crossover signals between the AMA and FAMA, adding an additional layer of reliability to the trading signals.
**Indicator Logic:**
1. **Dominant Cycle Calculation:**
- The indicator starts by calculating the dominant market cycle using a smoothed price series. This involves applying exponential moving averages to a series of price differences, extracting cycle components, and determining the instantaneous phase of the cycle. This phase is then adjusted to provide a phase adjustment factor, which plays a critical role in determining the adaptive alpha.
2. **Adaptive Alpha Calculation:**
- The adaptive alpha, a key feature of the AMA, is computed based on the fast and slow limits set by the trader. This alpha is clamped within these limits to ensure the AMA remains appropriately sensitive to market conditions. The dynamic adjustment of alpha allows the AMA to be highly responsive in volatile markets and more conservative in stable markets.
3. **Crossover Detection:**
- The indicator generates trading signals based on crossovers between the AMA and FAMA:
- **CrossUp:** When the AMA crosses above the FAMA, it indicates a potential bullish trend, suggesting a buy opportunity.
- **CrossDown:** When the AMA crosses below the FAMA, it signals a potential bearish trend, indicating a sell opportunity.
4. **RSI Confirmation:**
- To enhance the reliability of these crossover signals, the indicator uses the RSI to confirm overbought and oversold conditions:
- **Buy Signal:** A buy signal is generated only when the AMA crosses above the FAMA and the RSI confirms an oversold condition, ensuring that the signal aligns with a momentum reversal from a low point.
- **Sell Signal:** A sell signal is triggered when the AMA crosses below the FAMA and the RSI confirms an overbought condition, indicating a momentum reversal from a high point.
5. **Signal Management:**
- To prevent signal redundancy during strong trends, the indicator tracks the last generated signal (buy or sell) and ensures that the next signal is only issued when there is a genuine reversal in trend direction.
6. **Signal Visualization:**
- **Buy Signals:** The indicator plots a "BUY" label below the bar when a buy signal is generated, using a green color to clearly mark the entry point.
- **Sell Signals:** A "SELL" label is plotted above the bar when a sell signal is detected, marked in red to indicate an exit or shorting opportunity.
- **Bar Coloring (Optional):** Traders have the option to enable bar coloring, where green bars indicate a bullish trend (AMA above FAMA) and red bars indicate a bearish trend (AMA below FAMA), providing a visual representation of the market’s direction.
**Customization Options:**
- **Source:** Traders can select the price data input that best suits their strategy (e.g., close, open, high, low, or custom indicators).
- **Fast Limit:** Adjustable sensitivity for the fast response of the AMA, allowing traders to tailor the indicator to different market conditions.
- **Slow Limit:** Sets the slower boundary for the AMA’s sensitivity, providing stability in less volatile markets.
- **RSI Length:** The period for the RSI calculation can be adjusted to fit different trading timeframes.
- **Overbought/Oversold Levels:** These thresholds can be customized to define the RSI levels that trigger buy or sell confirmations.
- **Enable Bar Colors:** Traders can choose whether to enable bar coloring based on the AMA/FAMA relationship, enhancing visual clarity.
**How Different Traders Can Use the Indicator:**
1. **Day Traders:**
- **Uptrick: Dynamic AMA RSI Indicator** is highly effective for day traders who need to make quick decisions in fast-moving markets. The adaptive nature of the AMA and FAMA allows the indicator to respond rapidly to intraday price swings. Day traders can use the buy and sell signals generated by the crossover and RSI confirmation to time their entries and exits with greater precision, minimizing exposure to false signals often prevalent in high-frequency trading environments.
2. **Swing Traders:**
- Swing traders can benefit from the indicator’s ability to identify and confirm trend reversals over several days or weeks. By adjusting the RSI length and sensitivity limits, swing traders can fine-tune the indicator to catch longer-term price movements, helping them to ride trends and maximize profits over medium-term trades. The dual confirmation of crossovers with RSI ensures that swing traders enter trades that have a higher probability of success.
3. **Position Traders:**
- For position traders who hold trades over longer periods, the **Uptrick** indicator offers a reliable method to stay in trades that align with the dominant trend while avoiding premature exits. By adjusting the slow limit and extending the RSI length, position traders can smooth out the indicator’s sensitivity, allowing them to focus on major market shifts rather than short-term volatility. The bar coloring feature also provides a clear visual indication of the overall trend, aiding in trade management decisions.
4. **Scalpers:**
- Scalpers, who seek to profit from small price movements, can use the fast responsiveness of the FAMA in conjunction with the RSI to identify micro-trends within larger market moves. The indicator’s ability to adapt quickly to changing conditions makes it a valuable tool for scalpers looking to execute numerous trades in a short period, capturing profits from minor price fluctuations while avoiding prolonged exposure.
5. **Algorithmic Traders:**
- Algorithmic traders can incorporate the **Uptrick** indicator into automated trading systems. The precise crossover signals combined with RSI confirmation provide clear and actionable rules that can be coded into algorithms. The adaptive nature of the indicator ensures that it can be used across different market conditions and timeframes, making it a versatile component of algorithmic strategies.
**Usage:**
The **Uptrick: Dynamic AMA RSI Indicator** is a versatile tool that can be integrated into various trading strategies, from short-term day trading to long-term investing. Its ability to adapt to changing market conditions and provide clear buy and sell signals makes it an invaluable asset for traders seeking to improve their trading performance. Whether used as a standalone indicator or in conjunction with other technical tools, **Uptrick** offers a dynamic approach to market analysis, helping traders to navigate the complexities of financial markets with greater confidence.
**Conclusion:**
The **Uptrick: Dynamic AMA RSI Indicator** offers a comprehensive and adaptable solution for traders across different styles and timeframes. By combining the strengths of adaptive moving averages with RSI confirmation, it delivers robust signals that help traders capitalize on market trends while minimizing the risk of false signals. This indicator is a powerful addition to any trader’s toolkit, enabling them to make informed decisions with greater precision and confidence. Whether you're a day trader, swing trader, or long-term investor, the **Uptrick** indicator can enhance your trading strategy and improve your market outcomes.

ICT IPDA Liquidity Matrix By AlgoCadosThe ICT IPDA Liquidity Matrix by AlgoCados is a sophisticated trading tool that integrates the principles of the Interbank Price Delivery Algorithm (IPDA), as taught by The Inner Circle Trader (ICT). This indicator is meticulously designed to support traders in identifying key institutional levels and liquidity zones, enhancing their trading strategies with data-driven insights. Suitable for both day traders and swing traders, the tool is optimized for high-frequency and positional trading, providing a robust framework for analyzing market dynamics across multiple time horizons.
# Key Features
Multi-Time Frame Analysis
High Time Frame (HTF) Levels : The indicator tracks critical trading levels over multiple days, specifically at 20, 40, and 60-day intervals. This functionality is essential for identifying long-term trends and significant support and resistance levels that aid in strategic decision-making for swing traders and positional traders.
Low Time Frame (LTF) Levels : It monitors price movements within 20, 40, and 60-hour intervals on lower time frames. This granularity provides a detailed view of intraday price actions, which is crucial for scalping and short-term trading strategies favored by day traders.
Daily Open Integration : The indicator includes the daily opening price, providing a crucial reference point that reflects the market's initial sentiment. This feature helps traders assess the market's direction and volatility, enabling them to make informed decisions based on the day's early movements, which is particularly useful for day trading strategies.
IPDA Reference Points : By leveraging IPDA's 20, 40, and 60-period lookbacks, the tool identifies Key Highs and Lows, which are used by IPDA as Draw On Liquidity. IPDA is an electronic and algorithmic system engineered for achieving price delivery efficiency, as taught by ICT. These reference points serve as benchmarks for understanding institutional trading behavior, allowing traders to align their strategies with the dominant market forces and recognize institutional key levels.
Dynamic Updates and Overlap Management : The indicator is updated daily at the beginning of a new daily candle with the latest market data, ensuring that traders operate with the most current information. It also features intelligent overlap management that prioritizes the most relevant levels based on the timeframe hierarchy, reducing visual clutter and enhancing chart readability.
Comprehensive Customization Options : Traders can tailor the indicator to their specific needs through an extensive input menu. This includes toggles for visibility, line styles, color selections, and label display preferences. These customization options ensure that the tool can adapt to various trading styles and preferences, enhancing user experience and analytical capabilities.
User-Friendly Interface : The tool is designed with a user-friendly interface that includes clear, concise labels for all significant levels. It supports various font families and sizes, making it easier to interpret and act upon the displayed data, ensuring that traders can focus on making informed trading decisions without being overwhelmed by unnecessary information.
# Usage Note
The indicator is segmented into two key functionalities:
LTF Displays : The Low Time Frame (LTF) settings are exclusive to timeframes up to 1 hour, providing detailed analysis for intraday traders. This is crucial for traders who need precise and timely data to make quick decisions within the trading day.
HTF Displays : The High Time Frame (HTF) settings apply to the daily timeframe and any shorter intervals, allowing for comprehensive analysis over extended periods. This is beneficial for swing traders looking to identify broader trends and market directions.
# Inputs and Configurations
BINANCE:BTCUSDT
Offset: Adjustable setting to shift displayed data horizontally for better visibility, allowing traders to view past levels and make informed decisions based on historical data.
Label Styles: Choose between compact or verbose label formats for different levels, offering flexibility in how much detail is displayed on the chart.
Daily Open Line: Customizable line style and color for the daily opening price, providing a clear visual reference for the start of the trading day.
HTF Levels: Configurable high and low lines for HTF with options for style and color customization, allowing traders to highlight significant levels in a way that suits their trading style.
LTF Levels: Similar customization options for LTF levels, ensuring flexibility in how data is presented, making it easier for traders to focus on the most relevant intraday levels.
Text Utils: Settings for font family, size, and text color, allowing for personalized display preferences and ensuring that the chart is both informative and aesthetically pleasing.
# Advanced Features
Overlap Management : The script intelligently handles overlapping levels, particularly where multiple timeframes intersect, by prioritizing the more significant levels and removing redundant ones. This ensures that the charts remain clear and focused on the most critical data points, allowing traders to concentrate on the most relevant market information.
Real-Time Updates : The indicator updates its calculations at the start of each new daily bar, incorporating the latest market data to provide timely and accurate trading signals. This real-time updating is crucial for traders who rely on up-to-date information to execute their strategies effectively and make informed trading decisions.
# Example Use Cases
Scalpers/Day traders: Can utilize the LTF features to make rapid decisions based on hourly market movements, identifying short-term trading opportunities with precision.
Swing Traders: Will benefit from the HTF analysis to identify broader trends and key levels that influence longer-term market movements, enabling them to capture significant market swings.
By providing a clear, detailed view of key market dynamics, the ICT IPDA Liquidity Matrix by AlgoCados empowers traders to make more informed and effective trading decisions, aligning with institutional trading methodologies and enhancing their market understanding.
# Usage Disclaimer
This tool is designed to assist in trading decisions, but it should be used in conjunction with other analysis methods and risk management strategies. Trading involves significant risk, and it is essential to understand the market conditions thoroughly before making trading decisions.

Delta ZigZag [LuxAlgo]The Delta ZigZag indicator is focused on volume analysis during the development of ZigZag lines. Volume data can be retrieved from a Lower timeframe (LTF) or real-time Tick data.
Our Delta ZigZag publication can be helpful in detecting indications of a trend reversal or potential weakening/strengthening of the trend.
This indicator by its very nature backpaints, meaning that the displayed components are offset in the past.
🔶 USAGE
The ZigZag line is formed by connecting Swings , which can be set by adjusting the Left and Right settings.
Left is the number of bars for evaluation at the left of the evaluated point.
Right is the number of bars for evaluation at the right of the evaluated point.
A valid Swing is a value higher or lower than the bars at the left/right .
A higher Left or Right set number will generally create broader ZigZag ( ZZ ) lines, while the drawing of the ZZ line will be delayed (especially when Right is set higher). On the other hand, when Right is set at 0, ZZ line are drawn quickly. However, this results in a hyperactive switching of the ZZ direction.
To ensure maximum visibility of values, we recommend using " Bars " from the " Bar's style " menu.
🔹 Volume examination
The script provides two options for Volume examination :
Examination per ZigZag line
Examination per bar
Bullish Volume is volume associated with a green bar ( close > open )
Bearish Volume is volume associated with a red bar ( close < open )
Neutral Volume (volume on a " close == open" bar) is not included in this publication.
🔹 Examination per ZigZag line
As long as the price moves in the same direction, the present ZZ line will continue. When the direction of the price changes, the bull/bear volume of the previous ZZ line is evaluated and drawn on the chart.
The ZZ line is divided into two parts: a bullish green line and a bearish red line.
The intercept of these two lines will depend on the ratio of bullish/bearish volume
This ratio is displayed at the intercept as % bullish volume (Settings -> Show % Bullish Volume)
* Note that we cannot draw between 2 bars. Therefore, if a ZZ line is only 1 bar long, the intercept will be at one of those 2 bars and not in between. The percentage can be helpful in interpreting bull/bear volume.
In the example above (2 most right labels), you can see that an overlap of 2 labels is prevented, ensuring the ability to evaluate the bullish % volume of the ZZ line .
The percentage will be colored green when more than 50%, red otherwise. The color will fade when the direction is contradictory; for example, 40% when the ZZ line goes up or 70% when the ZZ line falls.
More details can be visualized by enabling " Show " and choosing 1 of 3 options:
Average Volume Delta/bar
Average Volume/bar
Normalised Volume Delta
For both 'averages', the sum of " Volume "/" Volume Delta " of every bar on the ZZ line is divided by the number of bars (per ZZ line ).
The " Normalised Volume Delta " is calculated by dividing the sum of " Delta Volume " by the sum of " Volume " (neutral volume not included), which is displayed as a percentage.
All three options will display a label at the last point of the ZZ line and be coloured similarly: green when the ratio bullish/bearish volume of the ZZ line is bullish and red otherwise. Here, the colour also fades when it is bullish, but the ZZ line falls or when it is bearish with a rising ZZ line .
A tooltip at each label hints at the chosen option.
You can pick one of the options or combine them together.
🔹 Examination per bar
Besides information about what's happening during the ZZ line , information per bar can be visualized by enabling " Show Details " in Settings .
Split Volume per bar : show the sum of bullish (upV) and bearish (dnV) volume per bar
Volume (bar) : Total Volume per bar (bullish + bearish volume, neutral volume not included)
Δ Volume (bar) : Show Delta Volume (bullish - bearish volume)
🔹 Using Lower Timeframe Data
The ZigZag lines using LTF data are colored brighter. Also note the vertical line where the LTF data starts and the gap between ZZ lines with LTF data and without.
When " LTF " is chosen for the " Data from: " option in Settings , data is retrieved from Lower Timeframe bars (default 1 minute). When the LTF setting is higher than the current chart timeframe, the LTF period will automatically be adjusted to the current timeframe to prevent errors.
As there is a 100K limit to the number of LTF intrabars that can be analyzed by a script, this implies the higher the difference between LTF and current TF; the fewer ZZ lines will be seen.
🔹 Using real-time tick data
The principles are mostly the same as those of LTF data. However, in contrast with LTF data, where you already have LTF ZZ lines when loading the script, real-time tick data-based ZZ lines will only start after loading the chart.
Changing the settings of a ticker will reset everything. However, returning to the same settings/ticker would show the cached data again.
Here, you can see that changing settings reset everything, but returning after 2 minutes to the initial settings shows the cached data. Don't expect it to be cached for hours or days, though.
🔶 DETAILS
The timeframe used for LTF data should always be the same or lower than the current TF; otherwise, an error occurs. This snippet prevents the error and adjusts the LTF to the current TF when LTF is too high:
res = input.timeframe('1')
res := timeframe.from_seconds( math.min( timeframe.in_seconds(timeframe.period), timeframe.in_seconds(res) ) )
🔶 SETTINGS
Data from: LTF (Lower TimeFrame) or Ticks (Real-time ticks)
Res: Lower TimeFrame (only applicable when choosing LTF )
Option: choose " high/low " or " close " for Swing detection
🔹 ZigZag
Left: Lookback period for Swings
Right: Confirmation period after potential Swing
🔹 ZigZag Delta
Show % Bullish Volume : % bullish volume against total volume during the ZZ line
Show:
Average Volume Delta/bar
Average Volume/bar
Normalised Volume Delta
See USAGE for more information
🔹 Bar Data
Split Volume per bar: shows the sum of bullish ( upV ) and bearish ( dnV ) volume per bar
Volume (bar): Total Volume per bar (bullish + bearish volume, neutral volume not included)
Δ Volume (bar): Show Volume Delta (bullish - bearish volume)
