ICT Sweep + FVG Entry (v6) • Pro Pack 📌 ICT Sweep + FVG Entry Pro Pack
This indicator combines key ICT price action concepts with practical execution tools to help traders spot high-probability setups faster and more objectively. It’s designed for scalpers and intraday traders who want to keep their chart clean but never miss critical market structure events.
🔑 Features
Liquidity Pools (HTF)
• Auto-detects recent swing highs/lows from higher timeframes (5m/15m).
• Draws both lines and optional rectangles/zones for clear liquidity areas.
Liquidity Sweeps (BSL/SSL)
• Identifies when price sweeps above/below liquidity pools and rejects back.
• Optional Grade-A sweep filter (wick size + strong re-entry).
Fair Value Gaps (FVGs)
• Highlights bullish/bearish imbalances.
• Optional midline (50%) entry for precision.
• Auto-invalidation when price fully closes inside the gap.
Killzones (New York)
• Highlights AM (9:30–11:30) and PM (14:00–15:30) killzones.
• Option to block signals outside killzones for higher strike rate.
Bias Badge (DR50)
• Displays if price is trading in a Bull, Bear, or Range context based on displacement range midpoint.
SMT Assist (NQ vs ES)
• Detects simple divergences between indices:
Bearish SMT → NQ makes HH while ES doesn’t.
Bullish SMT → NQ makes LL while ES doesn’t.
SL/TP Helper & R:R Label
• Automatically draws stop loss (at sweep extreme) and target (opposite pool or recent swing).
• Displays expected Risk:Reward ratio and blocks entries if below your chosen minimum.
Filters
• ATR filter ensures signals only appear in sufficient volatility.
• Sweep quality filter avoids weak wicks and fake-outs.
🎯 How to Use
Start on HTF (5m/15m) → Identify liquidity zones and bias.
Drop to LTF (1m) → Wait for a liquidity sweep confirmation.
Check for FVG in the sweep’s direction → Look for retest entry.
Use the SL/TP helper to validate your risk/reward before taking the trade.
Focus entries during NY Killzones for maximum effectiveness.
✅ Why this helps
This tool reduces screen time and hesitation by automating repetitive ICT concepts:
Liquidity pools, sweeps, and FVGs are marked automatically.
Killzone timing and SMT divergence are simplified.
Clear visual signals for entries with built-in RR filter help keep your trading mechanical.
⚠️ Disclaimer: This script is for educational purposes only. It does not provide financial advice or guarantee results. Always use proper risk management.
Cari skrip untuk "swing high low"

ICT Sweep + FVG Entry (v6) • Antoine📌 ICT Sweep + FVG Entry (Antoine)
This indicator is designed for price action traders who follow ICT concepts and want a mechanical tool to spot liquidity sweeps, fair value gaps (FVGs), and precise entry signals.
🔎 Key Features
Liquidity Pools (HTF)
• Automatically plots recent swing highs/lows from a higher timeframe (5m/15m).
• These act as Buy Side Liquidity (BSL) and Sell Side Liquidity (SSL) levels where stop orders accumulate.
Sweep Detection
• Identifies when price breaks a pool (BSL/SSL) but closes back inside → a classic liquidity grab.
• Plots a triangle on the chart when a sweep is confirmed.
Fair Value Gap (FVG) Highlighting
• Detects bullish and bearish FVGs on the execution timeframe (ideal for 1m).
• Option to display active FVG zones with shaded boxes.
Entry Signals
• A signal (cross) appears when:
A liquidity sweep occurs.
An FVG forms in the direction of the rejection.
Price retests the FVG (entry at the 50% mid-level or edge).
Alerts Ready
• Get alerted for sweeps (bullish/bearish) and for entry confirmations (long/short FVG retests).
🎯 How to Use
Choose your HTF (5m or 15m) → The indicator maps major liquidity pools.
Drop to LTF (1m) → Wait for a sweep signal at one of the pools.
Confirm with FVG → If an FVG appears in the sweep’s direction, the indicator waits for a retest.
Entry → Enter on the retest of the FVG (edge or 50%).
Risk Management
Stop loss: just beyond the sweep’s wick.
Target: opposite liquidity pool.
Minimum recommended R:R: 1:2.
✅ Why this helps
This tool makes it easier to trade ICT-style setups without missing opportunities:
No need to manually draw every swing high/low.
Automatic FVG detection saves time.
Clear sweep + FVG + retest logic keeps your entries mechanical and disciplined.
⚠️ Disclaimer: This script is for educational purposes only. It does not guarantee profits. Always use proper risk management.

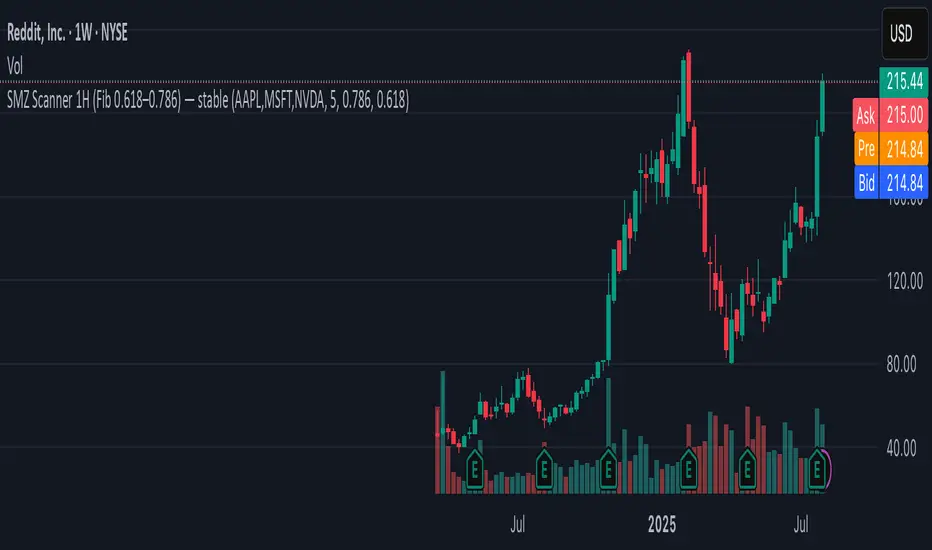
SMZ Scanner 1H (Fib 0.618–0.786) — stableQuickly spot when your watchlist tickers enter high-probability Smart Money Zones. This scanner checks up to 40 symbols on 1-hour candles, using the 0.618–0.786 Fibonacci retracement of the latest impulse leg (based on swing highs/lows).
What it does:
• Scans your custom list of tickers (up to 40 at once).
• Identifies fresh bullish or bearish impulses.
• Marks when price enters the key Fib retracement zone.
• Sends one clean alert per bar with all tickers that just hit.
Perfect for:
Swing traders and intraday traders tracking Smart Money Zone re-entries without flipping through dozens of charts.
Fractal Suite: MTF Fractals + BOS/CHOCH + OB + FVG + Targets Kese Way
Fractals (Multi-Timeframe): Automatically detects both current-timeframe and higher-timeframe Bill Williams fractals, with customizable left/right bar settings.
Break of Structure (BOS) & CHoCH: Marks structural breaks and changes of character in real time.
Liquidity Sweeps: Identifies sweep patterns where price takes out a previous swing high/low but closes back within range.
Order Blocks (OB): Highlights the last opposite candle before a BOS, with customizable extension bars.
Fair Value Gaps (FVG): Finds 3-bar inefficiencies with a minimum size filter.
Confluence Zones: Optionally require OB–FVG overlap for high-probability setups.
Entry, Stop, and Targets: Automatically calculates entry price, stop loss, and up to three take-profit targets based on risk-reward ratios.
Visual Dashboard: Mini on-chart table summarizing structure, last swing points, and settings.
Alerts: Set alerts for new fractals, BOS events, and confluence-based trade setups.

Breakout + Retest StrategyThe Breakout + Retest Strategy is a proven price action approach used by professional traders to catch high-probability market moves after key levels are broken. This strategy aims to enter the market after confirmation — reducing false breakouts and improving entry accuracy.
🔍 Strategy Logic:
Identify a Key Support or Resistance Level
These could be recent swing highs/lows, consolidation zones, or session highs.
Wait for a Clean Breakout
Price must decisively break above resistance or below support with strong momentum.
Watch for the Retest
After the breakout, wait for the price to pull back to the broken level (now flipped support/resistance).
Enter on Retest Confirmation
Look for signs like rejection wicks, bullish/bearish engulfing candles, or strong volume on the retest.
Set Risk-Managed Stops and Targets
Stop loss goes below (for long) or above (for short) the retested level.
Target is usually set at a 1:2 or higher risk-to-reward ratio, or based on structure.
✅ Why It Works:
Filters out fake breakouts
Uses market structure and liquidity traps to your advantage
Combines both momentum and confirmation
⚙️ Best Timeframes:
15-minute to 1-hour for intraday setups
4-hour and daily for swing trades
📊 Ideal for:
Futures (NQ, ES, Gold)
Forex pairs
Crypto
Stocks near key earnings or breakout zones

Whale Psychology Insights
### 🧠 Whale Psychology Insights – Unmasking Smart Money Moves
**Understand the mind games behind every candle.**
This advanced indicator is designed to reveal the psychological warfare played by whales and market manipulators in the crypto space. Stop trading blind—start trading with the insights of the smart money.
#### 🔍 What It Does:
- **Liquidity Zone Detection** – Automatically identifies key **swing highs/lows** where stop hunts are likely.
- **Volume Spike Alerts** – Spot **suspicious activity** where big players enter or exit.
- **Order Block Zones** – Highlights **bullish/bearish engulfing patterns** used by institutions.
- **Fair Value Gaps (FVG)** – Marks price inefficiencies where price may return.
- **Fakeout Detection** – Finds **manipulative wicks** designed to trap retail traders.
#### 💡 Use Cases:
- Avoid getting stopped out by **liquidity grabs**
- Enter after the **whales have made their move**
- Identify **high-probability reversal zones**
- Trade **with smart money**, not against it
Perfect for scalpers, intraday traders, and swing traders looking to understand *why* price moves—not just *where*.
> 🧠 **Trade the psychology, not just the chart.**

Trend ScalperThe Trend Scalper is a simple EMA-based trend-following and scalping indicator designed to help traders identify potential long and short trading opportunities on any timeframe. It uses a three-EMA strategy to filter trades in the direction of the prevailing trend while refining entry signals based on price reactions to the EMAs.
Here’s how it works:
It calculates three Exponential Moving Averages (EMA) with customizable lengths (default: 9, 21, and 89).
A long signal is generated when the EMAs align in bullish order (EMA1 > EMA2 > EMA3) and the price low dips into the zone between EMA1 and EMA2. This indicates a pullback into short-term support while the broader trend remains bullish.
A short signal is generated when the EMAs align in bearish order (EMA1 < EMA2 < EMA3) and the price high rises into the zone between EMA1 and EMA2. This indicates a pullback into resistance within a bearish trend.
The EMAs are plotted on the chart for visual guidance, while buy and sell signals are displayed as up and down triangles directly on price bars.
Best use practices:
The indicator works best as a trend continuation scalping tool, aiming to join established market direction after minor pullbacks.
It is most effective on liquid assets and in trending market conditions. Avoid relying on signals during sideways or choppy markets.
For confirmation, combine with volume, momentum oscillators, or higher timeframe trend analysis.
Risk management is critical: consider setting stop losses beyond EMA zones or recent swing highs/lows, and use take profits that match your risk-reward plan.
This indicator provides clean, rule-based signals that help traders time entries within the broader context of the trend. It is not a standalone strategy but a tool to assist in disciplined trade execution.

MSS BoxesWhat it is
The MSS Boxes indicator finds Market Structure Shifts (a decisive break in structure with displacement) and draws actionable zones (“boxes”) from the candle that caused the shift. Those boxes then act as mitigation / continuation areas for the rest of the session (or until they’re invalidated). It’s designed to be clean, non-repainting, and to work as a confluence layer with your SD and ATR Trigger grids.
What you’ll see on the chart
Green boxes for bullish MSS (demand); red boxes for bearish MSS (supply).
A compact label at the box origin (e.g., BOS↑ / BOS↓, or CHOCH) with the time-frame tag if you enable MTF.
Optional status badge on the right edge:
active (untouched), mitigated (tapped and respected), invalid (closed through), expired.
Clean behavior: once a box is printed it does not slide; coordinates are fixed to the confirmed signal candle.
Inputs (quick guide)
Swing detection
Swing length (for swing highs/lows), lookback for break validity, strict wick rule on/off.
Displacement factor (0 = off; typical 1.2–2.0).
Box recipe
Use full wick vs. use body for top/bottom.
Minimum box height (ticks), auto-merge overlapping (joins adjacent boxes of the same side).
Max lifetime (bars), session reset (e.g., clear on NY 18:00).
MTF alignment
Toggle H1 / M15 filters; choose “Plot only when aligned” vs “Plot all but alert only when aligned.”
Visuals
Fill/outline colors, opacity, label size, extend style (full-width vs to last bar).

Canuck Trading Projection IndicatorCanuck Trading Projection Indicator
Overview
The Canuck Trading Projection Indicator is a powerful PineScript v6 tool designed for TradingView to project potential bullish and bearish price trajectories based on historical price and volume movements. It provides traders with actionable insights by estimating future price targets and assigning confidence levels to each outlook, helping to identify probable market directions across any timeframe. Ideal for both short-term and long-term traders, this indicator combines momentum analysis, RSI filtering, support/resistance detection, and time-weighted trend analysis to deliver robust projections.
Features
Bullish and Bearish Projections: Forecasts price targets for upward (bullish) and downward (bearish) movements over a user-defined projection period (default 20 bars).
Confidence Levels: Assigns percentage confidence scores to each outlook, reflecting the likelihood of the projected price based on historical trends, volatility, and volume.
RSI Filter: Incorporates a 14-period Relative Strength Index (RSI) to validate trends, requiring RSI > 50 for bullish and RSI < 50 for bearish signals.
Support/Resistance Detection: Adjusts confidence levels when projections are near key swing highs/lows (within 2% of average price), boosting confidence by 5% for alignments.
Time-Based Weighting: Prioritizes recent price movements in trend analysis, giving more weight to newer bars for improved relevance.
Customizable Inputs: Allows users to tailor lookback period, projection bars, RSI period, confidence threshold, colors, and label positioning.
Forced Label Spacing: Prevents overlap of bullish and bearish text labels, even for tight projections, using fixed vertical slots when price differences are small (<2% of average price).
Timeframe Flexibility: Works seamlessly across all TradingView timeframes (e.g., 30-minute, hourly, daily, weekly, monthly), adapting projections to the chart’s resolution.
Clean Visualization: Displays projections as green (bullish) and red (bearish) dashed lines, with non-overlapping text labels at the projection endpoints showing price targets and confidence levels.
How It Works
The indicator analyzes historical price and volume data over a user-defined lookback period (default 50 bars) to calculate:
Momentum: Combines price changes and volume to assess trend strength, using a weighted moving average (WMA) for directional bias.
Trend Analysis: Counts bullish (price up, volume above average, RSI > 50) and bearish (price down, volume above average, RSI < 50) trends, weighting recent bars more heavily.
Projections:
Bullish Slope: Positive or flat when momentum is upward, scaled by price change and momentum intensity.
Bearish Slope: Negative or flat when momentum is downward, amplified by bearish confidence for stronger projections.
Projects prices forward by 20 bars (default) using current close plus slope times projection bars.
Confidence Levels:
Base confidence derived from the proportion of bullish/bearish trends, with a 5% minimum to avoid zero confidence.
Adjusted by volatility (lower volatility increases confidence), volume trends, and proximity to support/resistance levels.
Visualization:
Draws projection lines from the current close to the 20-bar future target.
Places text labels at line endpoints, showing price targets and confidence percentages, with forced spacing for readability.
Input Parameters
Lookback Period (default: 50): Number of bars for historical analysis (minimum 10).
Projection Bars (default: 20): Number of bars to project forward (minimum 5).
Confidence Threshold (default: 0.6): Minimum confidence for strong trend indication (0.1 to 1.0).
Bullish Projection Line Color (default: Green): Color for bullish projection line and label.
Bearish Projection Line Color (default: Red): Color for bearish projection line and label.
RSI Period (default: 14): Period for RSI momentum filter (minimum 5).
Label Vertical Offset (%) (default: 1.0): Base offset for labels as a percentage of price range (0.1% to 5.0%).
Minimum Label Spacing (%) (default: 2.0): Minimum vertical spacing between labels for tight projections (0.5% to 10.0%).
Usage Instructions
Add to Chart: Copy the script into TradingView’s Pine Editor, save, and add the indicator to your chart.
Select Timeframe: Apply to any timeframe (e.g., 30-minute, hourly, daily, weekly, monthly) to match your trading strategy.
Interpret Outputs:
Green Line/Label: Bullish price target and confidence (e.g., "Bullish: 414.37, Confidence: 35%").
Red Line/Label: Bearish price target and confidence (e.g., "Bearish: 279.08, Confidence: 41.3%").
Higher confidence indicates a stronger likelihood of the projected outcome.
Adjust Inputs:
Modify Lookback Period to focus on shorter/longer historical trends (e.g., 20 for short-term, 100 for long-term).
Change Projection Bars to adjust forecast horizon (e.g., 10 for shorter, 50 for longer).
Tweak RSI Period or Confidence Threshold for sensitivity to momentum or trend strength.
Customize Colors for visual preference.
Increase Minimum Label Spacing if labels overlap in volatile markets.
Combine with Analysis: Use alongside other indicators (e.g., moving averages, Bollinger Bands) or fundamental analysis to confirm signals, as projections are probabilistic.
Example: TSLA Across Timeframes
Using live TSLA data (close ~346.46 USD, May 31, 2025), the indicator produces:
30-Minute: Bullish 341.93 (13.3%), Bearish 327.96 (86.7%) – Strong bearish sentiment due to intraday volatility.
1-Hour: Bullish 342.00 (33.9%), Bearish 327.50 (62.3%) – Bearish but less intense, reflecting hourly swings.
4-Hour: Bullish 345.52 (73.4%), Bearish 344.44 (19.0%) – Flat outlook, indicating consolidation.
Daily: Bullish 391.26 (68.8%), Bearish 302.22 (31.2%) – Bullish bias from recent uptrend, bearish tempered by longer lookback.
Weekly: Bullish 414.37 (35.0%), Bearish 279.08 (41.3%) – Wide range, reflecting annual volatility.
Monthly: Bullish 396.70 (54.9%), Bearish 296.93 (10.2%) – Long-term bullish optimism.
These results align with market dynamics: short-term intervals capture volatility, while longer intervals smooth trends, providing balanced outlooks.
Notes
Accuracy: Projections are estimates based on historical data and should be used with other analysis tools. Confidence levels indicate likelihood, not certainty.
Timeframe Sensitivity: Short-term intervals (e.g., 30-minute) show larger price swings and higher confidence due to volatility, while longer intervals (e.g., monthly) are more stable.
Customization: Adjust inputs to match your trading style (e.g., shorter lookback for day trading, longer for swing trading).
Performance: Tested on volatile stocks like TSLA, NVIDIA, and others, ensuring robust performance across markets.
Limitations: May produce conservative bearish projections in strong uptrends due to momentum weighting. Adjust lookback or projection_bars for sensitivity.
Feedback
If you encounter issues (e.g., label overlap, projection mismatches), please share your timeframe, settings, or a screenshot. Suggestions for enhancements (e.g., additional filters, visual tweaks) are welcome!
Disclaimer
The Canuck Trading Projection Indicator is provided for educational and informational purposes only. It is not financial advice. Trading involves significant risks, and past performance is not indicative of future results. Always perform your own due diligence and consult a qualified financial advisor before making trading decisions.

DTFX Algo Zones [LuxAlgo]DTFX Algo Zones are auto-generated Fibonacci Retracements based on market structure shifts.
These retracement levels are intended to be used as support and resistance levels to look for price to bounce off of to confirm direction.
🔶 USAGE
Due to the retracement levels only being generated from identified market structure shifts, the retracements are confined to only draw from areas considered more important due to the technical Break of Structure (BOS) or Change of Character (CHoCH).
The simple action that causes a market structure shift occurs is price breaking above or below a specific swing point. When a market structure shift happens, a retracement is drawn from the point of break to the highest or lowest point since that point. Due to the price action necessary for a market structure shift, these retracements will not always be immediately actionable.
These retracement levels are intended to be used as points to watch for price to retrace to and bounce from, confirming the current direction of price.
In the example below, after the retracement is initiated, by bouncing off of the retracement levels formed from the previous market structure shift it would further confirm the bias of the market structure shift. A break going through these levels would display a weakness from the current market structure shift, implying that it could simply be noise.
🔶 DETAILS
The script uses standard SMC Market structure identification to determine Break of Structures (BOS) and Change of Characters (CHoCH). The specific swing points can be identified by the shapes placed above or below the specific swing high/low candle.
By unchecking the "Display All Zones" setting, users are able to specify the exact number of retracement zones to display using the "Show Last" parameter. This is handy for cleaning up the chart to stay focused on the most recent retracements.
Additionally, when displaying multiple zones, the "Clean-Up Level Overlap" setting may be helpful for decluttering as well. This option optimizes the display of retracement levels to minimize their overlap on other adjacent zones.
The script allows for up to 5 Fib levels to be displayed from each zone, with options for display, value, line style, and color for each of the 5.
The calculation for Fib Levels changes depending on the direction of market structure shifts. When an upwards (Bullish) zone is generated, the retracement is drawn with the bottom of the zone being 0 and the top of the zone being 1. This is reversed for downwards (Bearish) zones.
🔶 SETTINGS
Structure Length: Sets the SMC structure length to use for finding MMS.
Show Last: Displays this number of retracement zones. (Display All Zones Must be Unchecked)
Display All Zones: Ignores "Show Last" number and displays all historical MMS Retracement Zones.
Zone Display: Choose which zones to display, only bearish, only bullish, or both.
Clean-Up Level Overlap: Minimizes overlap between adjacent zones and levels.
Fib Levels: Settings to display and customize up to 5 Fib levels for each zone.

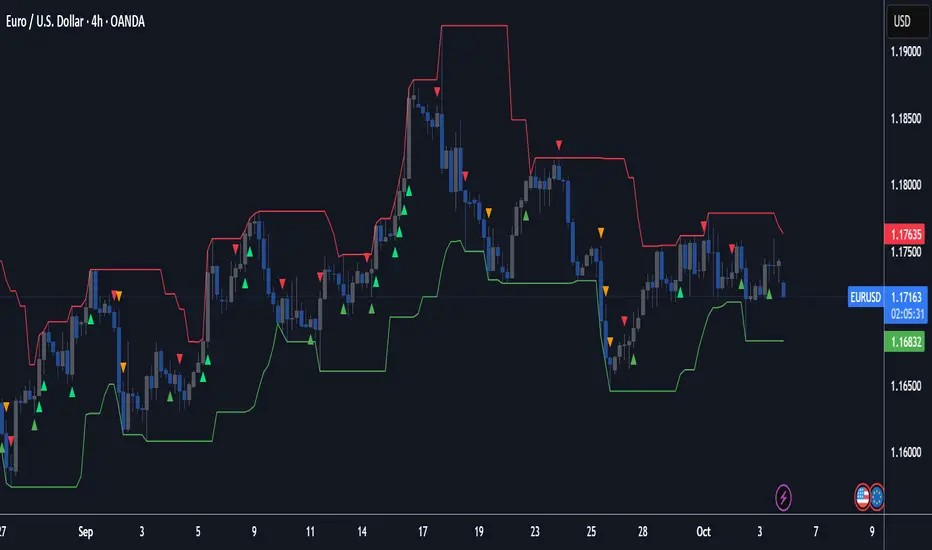
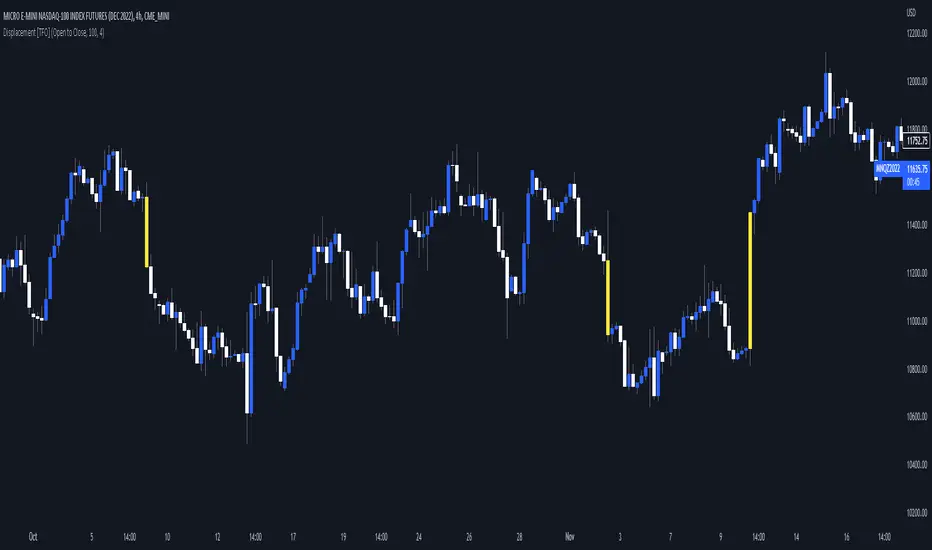
Visualizing Displacement [TFO]An easy and basic way to visualize displacement (energetic moves) in single bars/candles. This is determined by comparing the bar range (either from high to low, or from open to close) to its standard deviation over some specified length. The strength parameter applies some multiple to the standard deviation, which can help to filter out only the strongest indications of potential displacement.
Displacement is a key concept in Inner Circle Trader (ICT) concepts, especially when anticipating potential changes in trend. Although it's fairly easy to see "displacement candles" with large ranges, the bar coloring in this script can help remind us of who is in control (buyers or sellers) based on what side is creating those energetic moves most recently. Once we see signs of displacement, we can then apply concepts like premium/discount, order blocks, optimal trade entries, etc. to look for reasonable trade opportunities in the direction of the current trend.
A lack of displacement can be just as telling - if an effort to displace through a key swing high/low has failed, it's possible that a reversal may be underway.
Strategy Myth-Busting #20 - HalfTrend+HullButterfly - [MYN]#20 on the Myth-Busting bench, we are automating the " I Found Super Easy 1 Minute Scalping System And Backtest It 100 Times " strategy from " Jessy Trading " who claims 30.58% net profit over 100 trades in a couple of weeks with a 51% win rate and profit factor of 1.56 on EURUSD .
This one surprised us quite a bit. Despite the title of this strategy indicating this is on the 1 min timeframe, the author demonstrates the backtesting manually on the 5 minute timeframe. Given the simplicity of this strategy only incorporating a couple of indicators, it's robustness being able to be profitable in both low and high timeframes and on multiple symbols was quite refreshing.
The 3 settings which we need to pay most attention to here is the Hull Butterfly length, HalfTrend amplitude and the Max Number Of Bars Between Hull and HalfTrend Trigger. Depending on the timeframe and symbol, these settings greatly impact the performance outcomes of the strategy. I've listed a couple of these below.
And as always, If you know of or have a strategy you want to see myth-busted or just have an idea for one, please feel free to message me.
This strategy uses a combination of 3 open-source public indicators:
Hull Butterfly Oscillator by LuxAlgo
HalfTrend by Everget
Trading Rules
5 min candles but higher / lower candles work too.
Stop loss at swing high/low
Take Profit 1.5x the risk
Long
Hull Butterfly gives us green column, Wait for HalfTrend to present an up arrow and enter trade.
Short
Hull Butterfly gives us a red column , Wait for HalfTrend to present a down arrow and enter trade.
Alternative Trading Settings for different time frames
1 Minute Timeframe
Move the Hull Butterfly length from the default 11 to 9
Move the HalfTrend Amplitude from the default 2 to 1
Enabling ADX Filter with a 25 threshold
2 Hour Timeframe
Move the HalfTrend Amplitude from the default 2 to 1
Laddered Take Profits from 14.5% to 19% with an 8% SL

Strategy Myth-Busting #11 - TrendMagic+SqzMom+CDV - [MYN]This is part of a new series we are calling "Strategy Myth-Busting" where we take open public manual trading strategies and automate them. The goal is to not only validate the authenticity of the claims but to provide an automated version for traders who wish to trade autonomously.
Our 11th one is an automated version of the "Magic Trading Strategy : Most Profitable Indicator : 1 Minute Scalping Strategy Crypto" strategy from "Fx MENTOR US" who doesn't make any official claims but given the indicators he was using, it looked like on the surface that this might actually work. The strategy author uses this on the 1 minute and 3 minute timeframes on mostly FOREX and Heiken Ashi candles but as the title of his strategy indicates is designed for Crypto. So who knows..
To backtest this accurately and get a better picture we resolved the Heiken Ashi bars to standard candlesticks . Even so, I was unable to sustain any consistency in my results on either the 1 or 3 min time frames and both FOREX and Crypto. 10000% Busted.
This strategy uses a combination of 3 open-source public indicators:
Trend Magic by KivancOzbilgic
Squeeze Momentum by LazyBear
Cumulative Delta Volume by LonesomeTheBlue
Trend Magic consists of two main indicators to validate momentum and volatility. It uses an ATR like a trailing Stop to determine the overarching momentum and CCI as a means to validate volatility. Together these are used as the primary indicator in this strategy. When the CCI is above 0 this is confirmation of a volatility event is occurring with affirmation based upon current momentum (ATR).
The CCI volatility indicator gets confirmation by the the Cumulative Delta Volume indicator which calculates the difference between buying and selling pressure. Volume Delta is calculated by taking the difference of the volume that traded at the offer price and the volume that traded at the bid price. The more volume that is traded at the bid price, the more likely there is momentum in the market.
And lastly the Squeeze Momentum indicator which uses a combination of Bollinger Bands, Keltner Channels and Momentum are used to again confirm momentum and volatility. During periods of low volatility, Bollinger bands narrow and trade inside Keltner channels. They can only contract so much before it can’t contain the energy it’s been building. When the Bollinger bands come back out, it explodes higher. When we see the histogram bar exploding into green above 0 that is a clear confirmation of increased momentum and volatile. The opposite (red) below 0 is true when there are low periods. This indicator is used as a means to really determine when there is premium selling plays going on leading to big directional movements again confirming the positive or negative momentum and volatility direction.
If you know of or have a strategy you want to see myth-busted or just have an idea for one, please feel free to message me.
Trading Rules
1 - 3 min candles
FOREX or Crypto
Stop loss at swing high/low | 1.5 risk/ratio
Long Condition
Trend Magic line is Blue ( CCI is above 0) and above the current close on the bar
Squeeze Momentum's histogram bar is green/lime
Cumulative Delta Volume line is green
Short Condition
Trend Magic line is Red ( CCI is below 0) and below the current close on the bar
Squeeze Momentum's histogram bar is red/maroon
Cumulative Delta Volume line is peach

Institutional RSI Trendline Breakout StrategyKey Features:
1. RSI Trendline Detection
Automatically identifies RSI resistance (bearish) and support (bullish) trendlines
Requires minimum touch points for validation
Dynamic trendline calculation with configurable pivot lookback
2. Market Structure Analysis
Detects swing highs/lows to identify uptrends and downtrends
Combines multiple trend confirmation methods (swing structure + moving averages)
Visual background highlighting for trend confirmation
3. Breakout Signals
Buy Signal: RSI breaks above resistance trendline + bullish market structure
Sell Signal: RSI breaks below support trendline + bearish market structure
Configurable breakout threshold to avoid false signals
4. ATR-Based Stop Loss
Dynamic stop loss placement based on market volatility
Multiplier-adjustable for different risk profiles
Visual plotting of stop loss levels
5. Signal Filters
Volume filter to confirm breakout validity
RSI level filters to avoid extreme conditions
Multiple validation layers for institutional-grade accuracy
6. Professional Visualization
Clear buy/sell signal markers on chart
Information dashboard with real-time metrics
Trend background highlighting
Stop loss level indicators
7. Alert System
Ready-to-use alerts for both buy and sell signals
Includes entry price and stop loss in alert messages
This script provides institutional-grade signal quality with multiple confirmation layers, optimal risk management, and comprehensive market analysis.

Dynamic EMA Stack Support & ResistanceEvery trader needs reliable support and resistance — but static zones and lagging indicators won't cut it in fast-moving markets. This script combines a Fibonacci-based 5-EMA stacking system and left/right pivots that create dynamic support & resistance logic to uncover real-time structural shifts & momentum zones that actually adapt to price action. This isn’t just a mashup — it’s a complete built-from-the-ground-up support & resistance engine designed for scalpers, intraday traders, and trend followers alike.
🧠 🧠 🧠What It Does🧠 🧠 🧠
This script uses two powerful engines working in sync:
1️⃣ EMA Stack (5-EMA Framework)
Built on Fibonacci-based lengths: 5, 8, 13, 21, 34, (configurable) this stack identifies:
🔹 Bullish Stack: EMAs aligned from fastest to slowest (uptrend confirmation)
🔹 Bearish Stack: EMAs aligned inversely (downtrend confirmation)
🟡 Narrowing Zones: When EMAs compress within ATR thresholds → possible breakout or reversal zone
🎯 Labels identify key transitions like:
✅"Begin Bear Trend?"
✅"Uptrend SPRT"
✅"RES?" (resistance test)
2️⃣ Pivot-Based Projection Engine
Using classic Left/Right Bar pivot logic, the script:
📌 Detects early-stage swing highs/lows before full confirmation
📈 Projects horizontal S/R lines that adapt to market structure
🔁 Keeps lines active until a new pivot replaces them
🧩 Syncs beautifully with EMA stack for confluence zones
🎯🎯🎯Key Features for Traders🎯🎯🎯
✅ Trend Detection
→ EMA order reveals real-time bias (bullish, bearish, compression)
✅ Dynamic S/R Zones
→ Historical support/resistance levels auto-draw and extend
✅ Smart Labeling
→ “SPRT”, “RES”, and “Trend?” labels for live context + testing logic
✅ Custom Candle Coloring
→ Choose from Bar Color or Full Candle Overlay modes
✅ Scalper & Swing Compatible
→ Use fast confirmations for scalping or stack consistency for longer trends
⚙️⚙️⚙️How to Use⚙️⚙️⚙️
✅Use Top/Bottom (trend state) Line Colors to quickly read trend conditions.
✅Use Pivot-based support/resistance projections to anticipate where price might pause or reverse.
✅Watch for yellow/blue zones to prepare for volatility shifts/reversals.
✅Combine with volume or momentum indicators for added confirmation.
📐📐📐Customization Options📐📐📐
✅EMA lengths (5, 8, 13, 21, 34) — fully configurable - try 21,34,55, 89, 144 for longer term trend states
✅Left/Right bar pivot settings (default: 21/5)
✅Label size, visibility, and color themes
✅Toggle line and label visibility for clean layouts
✅“Max Bars Back” to control how deep history is scanned safely
🛠🛠🛠Built-In Safeguards🛠🛠🛠
✅ATR-based filters to stabilize compression logic
✅Guarded lookback (max_bars_back) to avoid runtime errors
✅Works on any asset, any timeframe
🏁🏁🏁Final Word🏁🏁🏁
This script is not just a visual tool, it’s a complete trend and structure framework. Whether you're looking for clean trend alignment, dynamic support/resistance, or early warning labels, this system is tuned to help you react with confidence — not hindsight.
Rembember, no single indicator should be used in isolation. For best results, combine it with price action analysis, higher-timeframe context, and complementary tools like trendlines, moving averages etc Use it as part of a well-rounded trading approach to confirm setups — not to define them alone.
💡💡💡Turn logic into clarity. Structure into trades. And uncertainty into confidence.💡💡💡

ICT FVG Buy/Sell SignalsThis bot is built on ICT (Inner Circle Trader) concepts such as:
Fair Value Gaps (FVGs) – imbalance zones between candles.
Consequent Encroachment (CE) – the midpoint of a gap.
Premium / Discount Arrays – dealing ranges split into premium (sell-side) and discount (buy-side) zones.
Displacement candles – strong impulsive moves that confirm intent.
The bot scans for FVGs, marks CE levels, and waits for price to return to these levels.
When price revisits a valid FVG zone with displacement confirmation and in the correct PD array, the bot generates a BUY or SELL signal.
✅ Signal Rules
Buy Signal
Price trades back into a Bullish FVG.
Current bar shows bullish displacement (large bullish body relative to ATR).
Price is in discount territory of the current dealing range (if PD filter is enabled).
Close is above the CE line of the FVG.
Sell Signal
Price trades back into a Bearish FVG.
Current bar shows bearish displacement.
Price is in premium territory of the current dealing range.
Close is below the CE line of the FVG.
🎯 What You’ll See on the Chart
Green “BUY” labels below candles when long signals trigger.
Red “SELL” labels above candles when short signals trigger.
Shaded background:
Red = Premium zone (sell side).
Teal = Discount zone (buy side).
Yellow line = dealing range midpoint (equilibrium).
Dots on CE lines = midpoints of the latest bullish/bearish FVG.
🔔 Alerts
ICT Buy → Triggers when a bullish setup confirms.
ICT Sell → Triggers when a bearish setup confirms.
You can connect these alerts to:
TradingView notifications.
Webhooks (for brokers or bots like MetaTrader, NinjaTrader, or Discord).
⚙️ Settings
Swing length – how many bars to use when detecting swing highs/lows for the dealing range.
Use PD filter – toggle ON/OFF for requiring discount/premium alignment.
Displacement ATR multiple – how strong the candle body must be compared to ATR to count as a displacement.
ATR length – used for displacement filter.
📈 Supported Markets
Works on all symbols and timeframes.
Commonly applied to:
NASDAQ (NQ, QQQ)
S&P500 (ES, SPX, SPY)
Forex pairs
Crypto (BTC, ETH, etc.)
⚠️ Disclaimer
This bot is for educational purposes only. It does not guarantee profits and should be tested on demo accounts first.
Always apply proper risk management before trading live.

ICT Liquidity Sweep MAX RETRI (ALERT)Strategy Description: SMC + ICT Reversal Sniper | 5-Min | R2 TP
This strategy applies Smart Money Concepts (SMC) and ICT methodology to identify high-probability reversal trades using a clean, rule-based system designed for the 5-minute timeframe.
⸻
Core Logic:
• Liquidity Sweep: Identifies stop hunts beyond recent swing highs/lows using a configurable lookback window.
• Break of Structure (BOS): Validates a directional shift after the sweep.
• Fixed R2 Risk-Reward: Entry is followed by a 2:1 take-profit target. Stop loss is set at the sweep candle’s high/low.
• No Entry Between 8 PM–12 AM NY Time: Avoids the manipulation-prone and illiquid zone.
• Discreet SL Handling: SL hits close trades silently — no labels or visuals.
⸻
Entry Precision & Timing Notes:
• The strategy may occasionally fire before a confirmed liquidity sweep — this is expected. If a sweep occurs later, you may still re-enter toward equilibrium, with take profit also targeted at equilibrium.
• Alerts or trades that trigger near 9:30 AM NY often align with real direction, but this time can be volatile.
• For more reliable and lower-risk entries, focus on the 1:30 PM to 2:00 PM silver bullet window, which tends to produce cleaner setups with more favorable flow. 🖤

Custom Pattern DetectionOverview
Chart Patterns is a major tool for many traders. Pattern formation at specific location on the chart is used for investment/trading decisions.
This indicator is designed in a way to allow investors/traders to define patterns of their choice based on certain input parameters and then detect defined pattern on the chart.
Investors/traders can use their own creativity to create and detect patterns.
This indicator works in 2 modes
Create Pattern: One can define a pattern and verify sample pattern formation visually
Detect Pattern: Detect and mark patterns on the chart
Settings
Create Custom Pattern:
Show Custom Pattern – This will mark the pattern lines on the chart so that one can verify how pattern appears based on the input’s parameters provided for lines XA, AB, BC, CD, DE, EF
Offset – Used while pattern creation. Offset is horizonal distance between 2 lines.
XA Points – Used to draw XA line when sample pattern is drawn. XA points can be a negative or position number.
XA line is drawn based on Offset and XA Points. E.g. Offset = 5 and XA Points = -20. In this line would be drawn from last candle high to high – 20 (these are y1 and y2 points of a line). While drawing line distance of 5 candles would be placed between 2 line points (these are x1 and x2 points of a line). In XA line X forms start point and A forms end point of the line.
Line AB – Line AB is drawn from point X. To derive the end point of AB, average Fib% is derived based on From Fib% and To Fib% parameters. Finally end point is derived by applying Fib Retracement on Line XA based on average Fib%.
Line AB to Line EF – These points are derived as explained in Line AB.
The indicator can be used to define/create patterns up to 6 legs/lines. The line would be named as XA -> AB -> BC -> CD -> DE -> EF.
If one wish to create pattern consisting 3 legs then it can be achieved by unchecking/deselecting Line CD, DE and EF or by checking only Line AB and BC.
Based on the parameters above indicator draws a sample pattern after last candle/bar on the chart. Sample pattern helps to visually see how pattern will appear on the chart.
Pattern Identification
Indicator derive the swing high/low points based on the Pivot lookback and use as reference points while detecting patterns.
Use of From Fib% and To Fib% - While detecting pattern, retracement price points are derived for From Fib% and To Fib%. Price points between from Fib% and To Fib% are treated as valid retracement points.
How to configure and use indicator for detecting patterns
Sample Pattern 1
Sample Pattern 2
Sample Pattern 3
Sample Pattern 4

TM_INTRADAY_LEVELTM_INTRADAY_LEVEL tool shows overall market price structure of market for Intraday Position. It can be used with TM_GANN_LEVELS tool
Terminology Use ==> Price Line, Price Level name and Price level
Timeframe ==> Use proper Signal with swing trend on 15 Min. or lower time frame (Best if Use with 15 Minutes chart or 5 Min. chart).
What to Identify ==> Overall market price structure for the Intraday Period
How to Use ==>
There are Many Line in price level chart
Green/red with Solid for important area of support or resistance
Other dotted lines are for retracement or extension of prices.
Important Structure==> Price behaviors on all lines of possible support and resistance
Use market structure, chart pattern, trend lines for more support..
Entry ==>
Let’s wait the proper area of support or resistance (Area of Value in case of trend pattern use)
Exit ==>
SL of swing high/low out of market structure with proper risk management and target with proper Risk/ Reward Ratio
Use the Below Contacts to Access this Indicator

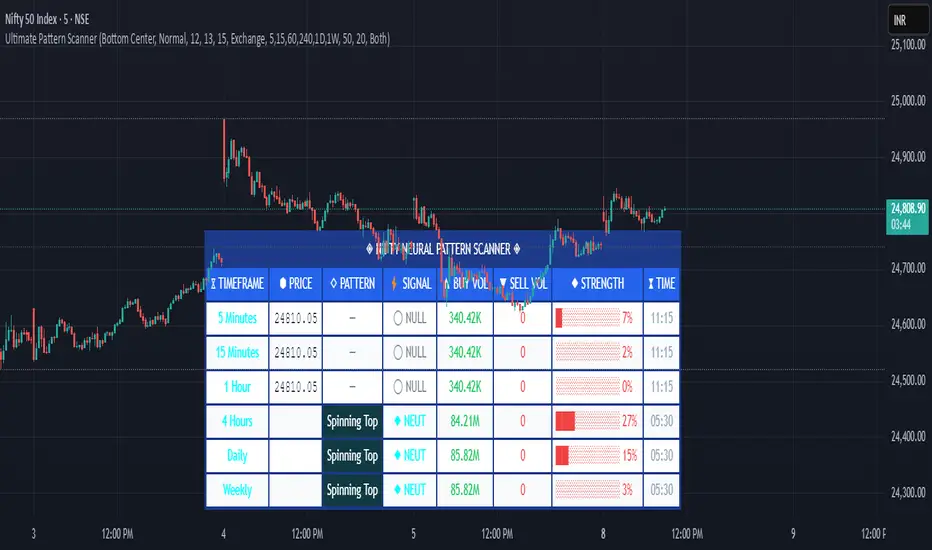
Pattern ScannerUltimate Pattern Scanner — multi-timeframe candlestick discovery tool (educational use only).
Purpose: This script scans user-selected timeframes for classical candlestick patterns (for example: engulfing, morning/evening stars, hammers, dojis, tasuki gaps, three soldiers/crows, tweezers, marubozu, and others) and reports pattern name, detection price, directional signal (Bull / Bear / Neutral), and a simple volume participation metric. It is intended as an idea-generation and training tool to help traders learn pattern mechanics, not as an automated trading system.
Main modules and rationale: 1) Pattern engine — applies classical candle structure rules to detect formations; 2) SMA trend filter (configurable length) — provides a directional bias to favor trade-with-trend setups; 3) Volume heuristic — approximates participation by separating candles into buy-like and sell-like volume and comparing total volume to a moving average; 4) Multi-timeframe aggregator — collects and presents pattern results from multiple timeframes; 5) Alerts — optional alerts list detected patterns and TFs. Combining these modules is intentional: patterns provide structure, SMA provides context, and volume supplies participation confirmation. Together they improve the educational value and practical relevance of each detected pattern.
How to use: Choose timeframes and SMA length that match your trading horizon. Use the scanner to locate pattern candidates, then confirm with higher-timeframe agreement and volume ratio before considering trade entry. Use structural stops (recent swing highs/lows or ATR-based stops) and define risk:reward rules. For learning, replay alerted bars and record outcomes over fixed horizons to build empirical statistics.
Limitations: Volume classification (close>open) is a heuristic and not a true bid/ask tape. SMA is a lagging trend proxy. Multi-timeframe agreement reduces but does not eliminate false signals, especially around news or in low-liquidity instruments. Use demo accounts and backtesting before live trading.
Inputs you can adjust: timeframe list, SMA length, volume MA length, which patterns to enable/disable, display options.
Compliance notes: This description explains why modules are combined and what the script does without exposing source code logic; it is non-promotional and contains no contact links. Remove any trademark symbols unless registration details are provided.
Risk Disclaimer: This tool is provided for education and analysis only. It is not financial advice and does not guarantee returns. Users assume all risk for trades made based on this script. Backtest thoroughly and use proper risk management.
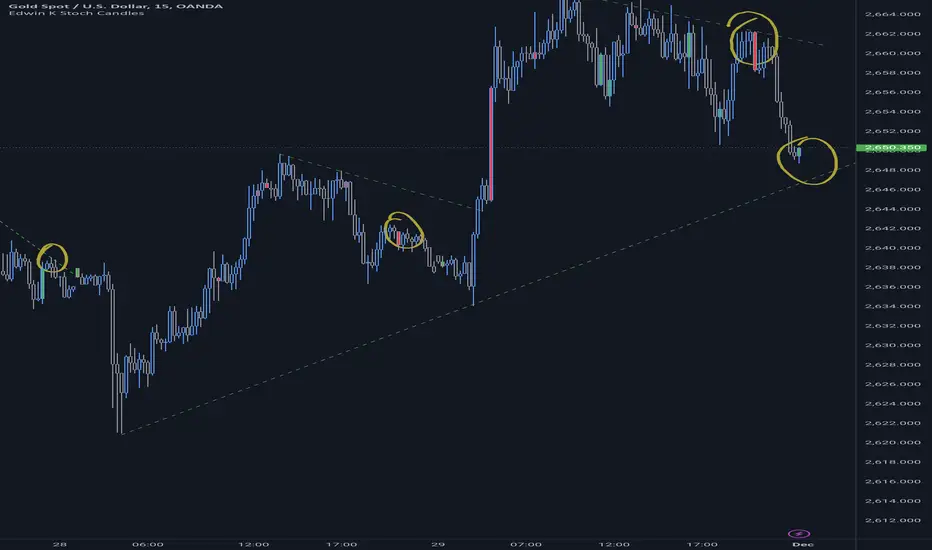
Edwin K Stochastic Candle ColorsThe Stochastic Candle Colors indicator highlights price action using candle colors based on signals from the stochastic oscillator. Here's how to use it:
1. Indicator Purpose
This indicator overlays on your price chart and changes candle colors based on stochastic oscillator signals:
Green candles: Indicate a bullish signal when the %K line crosses above the %D line in an oversold area (below 20).
Red candles: Indicate a bearish signal when the %K line crosses below the %D line in an overbought area (above 80).
2. How to Use the Inputs
K (periodK): The lookback period for calculating the %K line of the stochastic oscillator. A smaller value makes the indicator more sensitive to price changes.
D (periodD): The period for smoothing the %K line to get the %D line. A larger value creates smoother signals but may result in delays.
Smooth (smoothK): The additional smoothing applied to the %K line before calculating the %D line. This helps reduce noise.
3. How to Interpret the Candle Colors
Green Candle:
Occurs when the %K line crosses above the %D line in the oversold zone (below 20).
Signals a potential bullish reversal.
Red Candle:
Occurs when the %K line crosses below the %D line in the overbought zone (above 80).
Signals a potential bearish reversal.
No Color:
No crossover occurs, or the crossover doesn't happen in overbought/oversold zones.
4. Application in Trading
Entry Points:
Buy when you see a green candle and confirm with other indicators or chart patterns.
Sell when you see a red candle and confirm with additional signals.
Trend Context:
Combine this indicator with trend-following tools like moving averages or support/resistance levels to improve accuracy.
Stop Loss/Take Profit:
Use nearby swing highs/lows for stop-loss placement.
Set profit targets based on risk-reward ratios or key levels.
5. Customization
Adjust the input parameters (K, D, and Smooth) to align the indicator's sensitivity with your trading style:
Short-term traders might prefer lower values for quicker signals.
Long-term traders might opt for higher values for smoother, more reliable signals.
6. Limitations
Signals in isolation might not be reliable. Always use this indicator in conjunction with other tools.
Avoid using during low volatility or sideways markets as stochastic oscillators can produce false signals.
FVG Zones with Signals█ OVERVIEW
"FVG Zones with Signals" is a technical analysis tool that identifies Fair Value Gaps (FVG) on the chart and draws customizable zones in the form of boxes. It is ideal for traders using price action and market structure strategies, helping to identify potential imbalance zones and trading opportunities based on breakout and exit signals. With flexible size filter settings, box styles, and signal options, the indicator ensures clarity and precision on the chart.
█ CONCEPTS
The indicator is designed to identify potential entry points for trades based on FVG breakouts or retests. For chart clarity, a size filter for FVGs is included, based on a multiplier of the average candle size over a specified period.
Why are FVGs important? FVG zones represent areas of market imbalance, often attracting price back to "fill" the gap. Larger gaps (with a higher size multiplier) have a greater chance of being retested, as they indicate deeper imbalances—leaving more unexecuted orders in those zones, which attracts liquidity. Market makers and institutions often return to these levels to "refresh" liquidity before further moves. However, not every large FVG is retested quickly—in strong trends, smaller imbalances may be ignored, and the location (e.g., near swing highs/lows) is critical for retest probability.
█ FEATURES
- FVG Detection: Identifies bullish and bearish FVGs based on size filters (Candle Size Period and FVG Size Multiplier), with automatic initialization of historical gaps up to 500 candles back.
- Customizable Boxes: Draws FVG boxes with adjustable border colors, background gradients, border styles (solid, dashed, dotted), border widths, and transparency for both the background and the 50% FVG midline.
- Breakout and Exit Signals: Generates "Break" signals (green upward triangle for breakouts above bearish FVG, red downward triangle for breakouts below bullish FVG) and "Exit" signals (circles for exiting the zone), with options to select signal types (Break, Exit, or Both). A break signal causes the box to disappear, leaving a triangle as a trace of the breakout, which may serve as a signal to open a position. Exit signals (circles) may also indicate entry opportunities but require additional confirmation, such as alignment with the main trend.
- Midline: Automatically draws a dashed line at the 50% FVG level with adjustable transparency, aiding in assessing price reactions within the zone.
- Box Limitation: Automatically removes old or inactive FVGs after 500 candles to avoid chart clutter.
- Alerts: Built-in alerts for all signal types, including price and FVG type descriptions.
█ HOW TO USE
Add to Chart: Apply the indicator to your TradingView chart via the Pine Editor or Indicators menu.
Configure Settings:
- FVG Settings: Adjust Candle Size Period (default 20) and FVG Size Multiplier (default 1) to filter out small gaps—higher values generate fewer but more significant FVGs.
- Box Settings: Configure colors and styles for bullish (green) and bearish (red) boxes, including background transparency (default 80) and midline transparency.
- Signal Settings: Select signal types (Break, Exit, or Both) in Signal Type. Breakout signals appear after a candle closes outside the zone, while exit signals appear when exiting an FVG without a full breakout.
- Styling: Customize signal colors (green for buy/up, red for sell/down) and shape sizes.
Interpreting Signals:
- Break Up Signal: A green triangle below the bar indicates a breakout above a bearish FVG, suggesting potential continuation of an uptrend.
- Break Down Signal: A red triangle above the bar indicates a breakout below a bullish FVG, suggesting potential continuation of a downtrend.
- Exit Up/Down Signal: A green/red circle indicates an exit from an FVG without a full breakout, which may signal the end of a correction or preparation for a reversal.
- FVG Zones: If the price returns to an FVG and fills the gap, it may indicate equilibrium; an unfilled gap often leads to a retest.
- Use signals in conjunction with other technical analysis tools for confirmation, such as RSI (to identify overbought/oversold conditions) or MACD (to confirm momentum). Analyze FVGs from higher timeframes—these zones act as stronger imbalance levels and carry greater structural significance.
Exit signals (retests without breakouts) tend to be most effective when traded in line with the current trend.
█ APPLICATIONS
- Price Action Trading: Use FVG zones as dynamic support and resistance levels. In an uptrend, look for buying opportunities in bullish FVGs, where price often tests the gap before continuing. Combining with RSI, MACD, or Fibonacci levels enhances the significance of zones.
- Breakout Strategies: Trade based on breakout signals from FVGs. A buy signal after breaking a bearish FVG may indicate a strong upward impulse, especially when supported by a rising MACD or RSI exiting oversold conditions.
Larger FVG gaps (higher multiplier) have a greater chance of retest, as they indicate deeper imbalances.
█ NOTES
- Test the indicator across different timeframes and markets (stocks, forex, crypto) to optimize size filters for your trading style.
- The indicator initializes historical FVGs up to 500 candles back, which may slow loading on longer charts.
- For best results, use on high-liquidity markets where FVGs are more frequently retested.
- In consolidation zones, the indicator may generate more false signals, so additional confirmation is recommended.

4H Sell Signals at Swing Highs/LowsThis shows only zones where a 4H FVG and a 4H OB overlap (i.e., true HPZ).
Uses strict filters (FVG size vs avg body, OB body multiplier) to reduce noise and show very few, high-quality zones.
Each HPZ is drawn once (box deleted/created only when the zone changes) to avoid chart spam.
Optional label appears when price is currently inside the HPZ so you can spot active opportunities quickly.