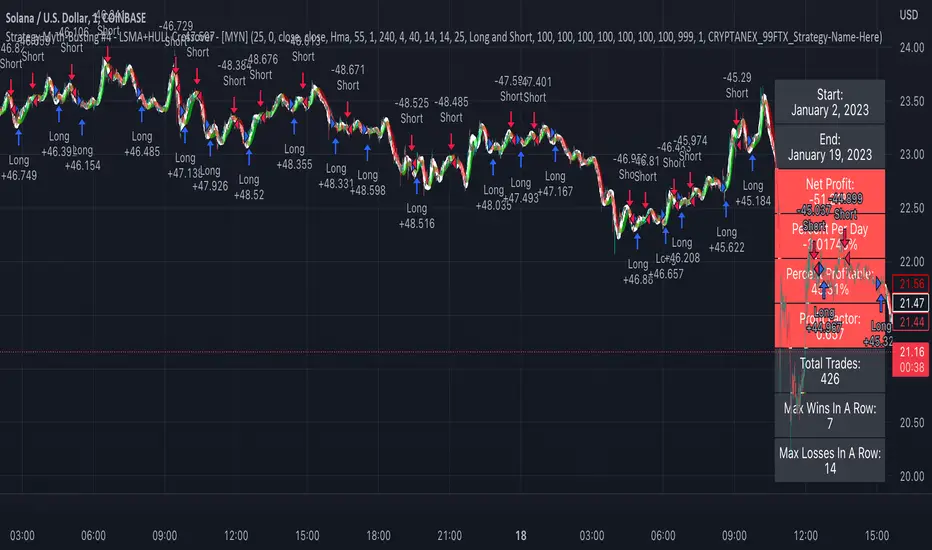
Strategy Myth-Busting #4 - LSMA+HULL Crossover - [MYN]This is part of a new series we are calling "Strategy Myth-Busting" where we take open public manual trading strategies and automate them. The goal is to not only validate the authenticity of the claims but to provide an automated version for traders who wish to trade autonomously.
Our fourth one we are automating is one of the strategies from "I Found The Best 1 Minute Scalping Strategy That Actually Works! ( Beginner Friendly )" from "Trade Domination" who claims to have made 366% profit on the 1 min chart of Solona despite having a 31% win rate in just a few weeks. As you can see from the backtest results below, I was unable to substantiate anything close to that that claim on the same symbol ( SOLUSD ), timeframe (1m) with identical instrument settings that "Trade Domination" was demonstrating with. Strategy Busted.
If you know of or have a strategy you want to see myth-busted or just have an idea for one, please feel free to message me.
This strategy uses a combination of 2 open-source public indicators:
LSMA
Hull Suite by InSilico
Trading Rules
1 min candles
Stop Loss on recent swing High/Low
1:5 Risk Ratio
Enter Long
LSMA cross above Red Hull Suite line
Price has to be above Hull Suite Line
Enter Short
LSMA crosses under green Hull Suite Line
Price has to be below Hull Suite Line
Cari skrip untuk "swing high low"
Trailing Stop AlertsThis script is designed as an ATR-based trailing stop tool to assist in managing open positions.
Once you're involved in a profitable trade, if you add this script to your chart you'll be prompted to select a bar to begin trailing from.
You can then adjust the candle lookback distance for swing high/lows (7 by default), the ATR multiplier (1.0 by default), and the direction to trail (Long/Short).
You can also adjust the ATR period in the settings menu if you want to (14 period by default).
Once the script is added to your chart, it will begin drawing your trailing stop and you can then set up alerts.
Alert Options:
Any alert() function call : Will trigger an alert for both conditions (trailing stop updated, trailing stop hit)
Alert Conditions : Trailing Stop Update will trigger whenever the stop is updated, Trailing Stop Hit will trigger whenever the stop is hit.
Note: the alerts will only fire once per bar close and the trailing stop will not update on realtime bars.

Bjorgum AutoTrailOne Time Trade Risk Management
Incorporating the new interactive feature, this script is meant as a one time trailing stop for the active trader to manage positional risk of an ongoing trade. As a crypto trader or Fx trader, many may find themselves in a position late into the evening, or perhaps daily life is calling while a trade progresses in their favor. Adding a trailing stop to a position thats trending can help to keep you in the trade and lock in gains if things turn around when you are unable to react.
To use the trail, the user would add the script to the chart. Once added, a set of crosshairs will appear allowing the user to choose a point to begin. Often choosing to start a trail from a swing high/ low can be an ideal option. This tends to provide some protection for a stop by placing it under support for a long trade or above resistance for a short trade.
Price based trail
The trail will automatically plot and the offset is a factor of the distance from price action selected by the crosshairs. If placed above price action the script will plot a short trail, if placed below it will trail for a long position.
Additionally, there are several other trail types other than price based. There is also percent based, which offsets the trail as a percent from close. A hard stop is placed at the cross hair value, then once the distance is exceeded by the percentage specified, the trail begins.
There are 2 more volatility based trails. There is a PSAR trail which can provide quicker and tighter stops that accelerate with the trend locking in gains faster, and an ATR trail that keeps a distance from price action as a function of volatility. Volatility levels can be adjusted from the menu.
Volatility based trail (ATR)
Volatility based trail (PSAR)
Lastly, within the code for more the more technical savvy, is some starting setups for string alerts to be sent to exchanges via 3rd party or custom API applications. Some string manipulation is required for specific providers to meet their requirements, but there is some building block alerts that will take the ticker symbol, recognize the asset your trading (Fx, Crypto, etc) and take input quantity or exchange names from the settings via inputs.
Complex strings can be built to perform almost any trade related task when to comes to alerts via web hook. A little setup this way with some technology to back your system can mean a semi-automated half man, half machine setup that actually manages your trail stop while you cannot. For those that don’t go this far, there is some basic alert functionality that well trigger when a trail is hit so you can react and make a decision.
Please note that for now, interactive mode is engaged only when the script is added to the chart. Additional stops, or for adjustments to be made it is best to add a new version. Also as real trades could be at play managing an actual position, alerts are designed to go off only once to ensure no duplicate orders are sent meaning alerts are not reoccurring. Once an alert is triggered, a new trail is to be set up.
A modified version of the TradingView built in SAR equation was used in this script. To provide the value of the SAR on the stop candle, it was necessary to alter the equation to extract this value as the regular SAR “flips” at this point. Thank you to TradingView for supplying access to the built in formula so that this SAR could behave the same as the built-in function outside of these alterations
Example of SAR value maintained in trigger candle
Cheers and happy trading.

Auto Fib Time Zones and Trend-Based Fib Time by DGTFibonacci time zones, based on the Fibonacci number sequence, are vertical lines that represent potential areas where a swing high, low, or reversal could occur.
Trend-Based Fib Time shows probable price corrections in an existing trend. A useful tool to use in addition to Elliot Wave counting, Fib Time helps to identify how far the wave is likely to travel
Please note, Time zones aren't concerned with price, only time
Disclaimer :
Trading success is all about following your trading strategy and the indicators should fit within your trading strategy, and not to be traded upon solely
The script is for informational and educational purposes only. Use of the script does not constitute professional and/or financial advice. You alone have the sole responsibility of evaluating the script output and risks associated with the use of the script. In exchange for using the script, you agree not to hold dgtrd TradingView user liable for any possible claim for damages arising from any decision you make based on use of the script

TB_Harmonic_Pro_TrendThis indicator is NOT meant to be used as a standalone trading system.
It has been designed to produce signals for potential up or down moves in the market subject to certain critreria being met.
The indicator measures several independent concepts that line up and when congruent produces a signal.
The concepts used are based on the Awesome Oscillator, the Directional Movement Index, Stochastic and the McGinley moving average.
An UP signal is produced when trend has potentially changed to up.
The McGinley MA provides the inital trigger which is followed by supporting oscillators which must move to the upside also indicating a possible change in trend. When the oscillators and MA conditions are met and are 'Congruent' an UP signal is produced to dispaly a potential change in trend for the interim period.
A secondary UP signal is also produced after the initial UP signal. This is as a result of a trend being detected (after the first entry) and the cross of secondary MA with different inputs. This usually occurs after a retarcement and potential continuation of trend. All components must line up to support the idea that trend has changed for the interim.
The combination of several positive trend indicators and confirmation of price assists in the trend change confirmation.
An alert system has been added for convenience.
The opposite occurs for a Down Signal.
The indicator is often useful after a significant swing HIGH/LOW when price is potentially changing direction. The overall concept is to be able to set alerts for such potetnial entries after you have completed your own market analysis. A particularly good reference point is after the 'D' point has formed on a Harmonic Scan (your Own anaysis) and awaiting an entry zone for a change in trend and as price moves away.
This can also be used with significan support and resistence levels and pull-backs in trend direction. Pitchforks applied to Harmonic scans provide numerous potential entry points for this type of indicator which often constitutes a good scalping strategy. Heiken ashi candles can also be used for additonal trend confirmation 'BUT' entry decisions 'SHOULD NOT' be made based on those candles
It works across all time frames.
If you would like to enquire about access to this invite only script please send me a private message on trading view and I will be happy to assist. Thank you.

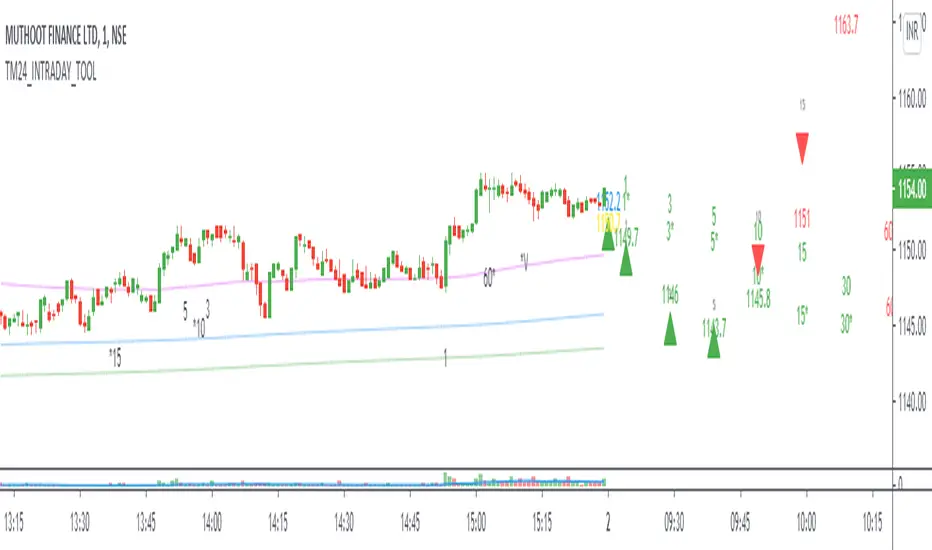
TM24_INTRADAY_TOOLTM24_INTRADAY_TOOL helps to identify following Things for Intraday Position on 1-3-5-10-15-30-60 Minutes and Daily timeframe along with Buy or sell signal.
1. Market Trend (Different Timeframe)
2. Price Direction
3. Area of Support & Resistance
4. Price Momentum
5. Volume Based Breakouts
Terminology Use ==> Black from Bottom for - Buy, Red from Top for - Sale Signal, and Numbers are to show time frame indication there is presence of buyer or seller like 1 for buy signal on 1 minute time frame etc.
Display and Interpretation ==> Buy Sale Signal in Digit with 1-3-5-10-15-30-60-D for different time frames.
any value signal ending with * shows breakout of support/ resistance and value signal starting with * shows entry to a momentum zone.
Green Mark with Triangle Up shows trend of that timeframe in positive and value shows upside possible direction on that timeframe vice versa for red signal with down triangle
T1 stand for trend change in 1 Minute timeframe and T3 stand for trend change in 3 Minute timeframe
Use market structure, chart pattern, trend lines for more support..
Time frame ==> Use proper Signal with 1 minute, 3 minute time frame
What to Identify ==> Overall Trend for the intraday
How to Use ==>
See how and order buildup is seen and current order position. Also area for volatility and expected movement in price direction
Note: - Use market structure, chart pattern, trend lines and price action parameter for more confirmation.
Entry ==>
Let’s wait the proper area of support or resistance ( Area of Value in case of trend pattern use)
Exit ==>
SL of swing high/low out of market structure with proper risk management and target with proper Risk/ Reward Ratio
Use the Below Contacts to Access this Indicator
TM_INTRADAY_TOOLTM_INTRADAY_TOOL helps to identify following Things for Intraday Position on 1-3-5-10-15-30-60 Minutes and Daily timeframe along with Buy or sell signal.
1. Market Trend (Different Timeframe)
2. Price Direction
3. Area of Support & Resistance
4. Price Momentum
5. Volume Based Breakouts
Terminology Use ==> Black from Bottom for - Buy, Red from Top for - Sale Signal, and Numbers are to show time frame indication there is presence of buyer or seller like 1 for buy signal on 1 minute time frame etc.
Display and Interpretation ==> Buy Sale Signal in Digit with 1-3-5-10-15-30-60-D for different time frames.
any value signal ending with * shows breakout of support/ resistance and value signal starting with * shows entry to a momentum zone.
Green Mark with Triangle Up shows trend of that timeframe in positive and value shows upside possible direction on that timeframe vice versa for red signal with down triangle
T1 stand for trend change in 1 Minute timeframe and T3 stand for trend change in 3 Minute timeframe
Use market structure, chart pattern, trend lines for more support..
Time frame ==> Use proper Signal with 1 minute, 3 minute time frame
What to Identify ==> Overall Trend for the intraday
How to Use ==>
See how and order buildup is seen and current order position. Also area for volatility and expected movement in price direction
Note: - Use market structure, chart pattern, trend lines and price action parameter for more confirmation.
Entry ==>
Let’s wait the proper area of support or resistance ( Area of Value in case of trend pattern use)
Exit ==>
SL of swing high/low out of market structure with proper risk management and target with proper Risk/ Reward Ratio
Use the Below Contacts to Access this Indicator

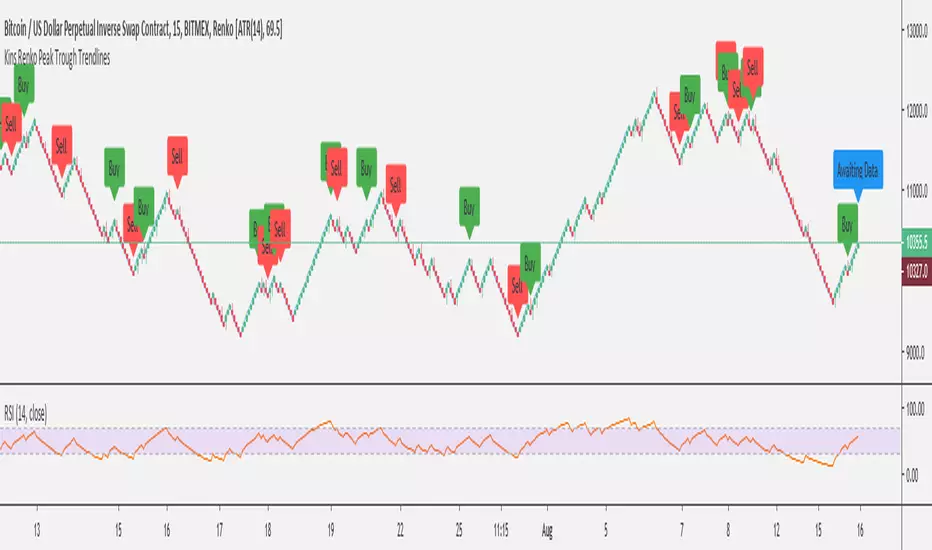
Kins Renko Peak Trough TrendlinesScript is built on the Renko Chart for Bitmex XBT. Looks for swing high/low and RSI divergences as well as some other bits.
This is my first week with Pine Script so there's probably some terrible coding practices in here but the functionality seems acceptable.
MoT - ZigZag Fibonacci + Ext./Ret. (Extended Ver.)The Indicator plots ZigZags and then overlays Fibonacci Levels (With Extension and Retracement Levels).
W have also programmed the indicator to search for Bullish/Bearish chart patterns in the form of ABC's, ABCD's, 3 Drives , BAT etc etc.
We have also added multiple time frame (MTF) options so the script will search for swing Highs/Lows over a larger period.
Please Note - This Version is with Extended lines of the most current Fib Levels. Which can make the charts look very busy. The other Indicator (No Extensions - Cleaner) is here:

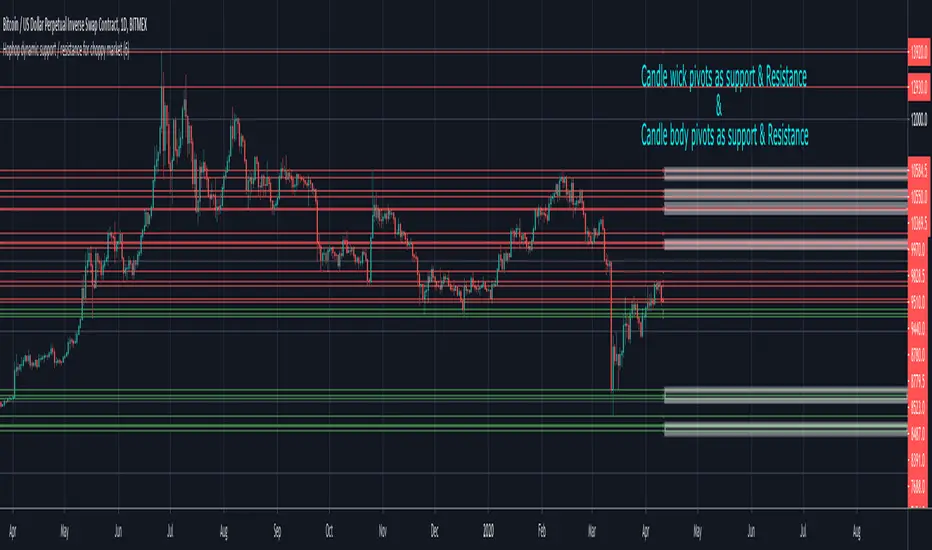
Dynamic support / resistance for choppy market - HophopThis indicator is intended to highlight potential support and resistance lines (zones if they are close to each other),
you can both configure how far you would like to check the confluence and enable the recent swing (high/low) to anticipate the future support / resistance.
Potential usage:
On a trending market, it can highlight take profit and stop loss zones.
On a sideways market, long on green lines / short on red lines.
PS: better to get confluence at least with 2 different timeframes.
Eg:
4 Hour XRPBTC
1 Day XRPBTC
If you benefit from this indicator and you would like to see more of these, please support me by your tips
BTC Tip: 39bwXN1chms1yHskBaYwz76UhDakc7grJ7
LTC Tip: MGD3U9dBCBVctwnoCa1grU8ompxG6hUhMk
ETH Tip: 0xEE9684a5aceE85036527aB48E596DeE4627bD84b
Bu indikator potansiyel destek ve direnc bolglerini belirlemek amaciyla gelistirilmistir,
Birbirine yakin olan kirmizi cizgiler direnc bolgesi, yesil cizgiler ise destek bolgesi olarak yorunlanabilir
Girdiler sekmesinde ne kadar gecmis dataya bakilacagini ayarlayabilir ve ayni zamanda potansiyel destek/direnc olabilecek en yakin dip/tepeyi gosterip gostermemesini secebilirsiniz
Potansiyel olarak:
Trend egilimi gosteren paritelerde, kar alma ya da stop belirleme amacli kullanilabilir.
Yatay seyreden paritelerde, yesil cizgi de long, kirmizi cizgide short yapilacak sekilde kullanilabilir.
Not: Islem yaptiginiz zaman dilimi ve ust zaman dilimleri ile ortusen bolgeler bulmak cok daha guvenli sonuclar veriyor ornegin:
Eg:
4 Saat XRPBTC
1 Gun XRPBTC
Bu indikatorden faydalaniyor ve benzerleri uzerinde calismam icin destek olmak isterseniz
BTC Tip: 39bwXN1chms1yHskBaYwz76UhDakc7grJ7
LTC Tip: MGD3U9dBCBVctwnoCa1grU8ompxG6hUhMk
ETH Tip: 0xEE9684a5aceE85036527aB48E596DeE4627bD84b

CM_Gann_Swing_HighLowCustom Indicator - Gann Swing High Low
Uses New Plot Types
Inputs Tab Options:
Use Up/Down Arrows - Or Circles!
Turn Up/Down Arrows at Top and Bottom of Screen On/Off
New Top/Bottom of Screen Plot Types
New Up/Down Arrow Plot Types
Full Credit Goes to Glaz for Creating Code.
Created By Request for @dvk1970
