Spring & Upthrust Trap (Zeiierman)█ Overview
Spring & Upthrust Trap (Zeiierman) is a Wyckoff-style “range sweep” indicator that highlights liquidity traps using a simple ZigZag pivot structure. It’s designed to catch the moment price briefly breaks a range boundary to trigger stops, then quickly snaps back into the range (rejection).
⚪ What It Detects
A Spring (Bull) is a downside fakeout. Price sweeps below the range boundary (taking liquidity), then rejects and returns back above the opposite boundary. In other words, it looks bearish for a moment, then flips bullish as the sweep fails.
An Upthrust (Bear) is the upside version. Price sweeps above the range boundary, then rejects and falls back through the opposite boundary. It looks bullish briefly, then flips bearish when that breakout fails.
█ How It Works
⚪ 1) Pivot Extraction (ZigZag Structure)
The script first compresses price into a small set of swing pivots using a ZigZag-style method driven by ZigZag Length. A bar becomes a pivot when it is the highest/lowest point inside the lookback window.
⚪ 2) Pattern Framing (X → A → B → C)
When there are at least four pivots available, the script maps the most recent pivot sequence into four labeled points:
X and A define the range boundaries (the box height is based on |A − X|)
B is the sweep pivot (the “fakeout” that breaks a boundary)
C is the rejection/snapback pivot that confirms the sweep failed
This is the minimum structure needed to define a trap without overfitting.
⚪ 3) Sweep Sizing (Filtering Noise vs Real Sweeps)
Not all boundary breaks are meaningful. The script measures sweep magnitude relative to the range size:
Sweep Fraction: |B − X| / |A − X|
This does two things:
Filters tiny pokes through a boundary (often random noise)
Filters extremely large breaks that are more likely to be true trend continuation rather than a trap
This is controlled by:
Min Sweep (minimum required violation)
Max Sweep (maximum allowed violation)
⚪ 4) Spring vs Upthrust Logic (Directional Trap Detection)
The script then decides which trap is forming:
Spring (Bull)
A downside sweep that fails: price breaks below the boundary, then returns strongly back through the opposite side.
Upthrust (Bear)
An upside sweep that fails: price breaks above the boundary, then returns strongly back through the opposite side.
█ How to Use
⚪ Interpreting a Spring (Bull)
A Spring is best treated as a failed breakdown. The sweep suggests stops were taken under the range, but the snapback implies that the market rejected lower prices.
Common behaviors after a good Spring:
fast reclaim back into the range
retest of the boundary from above (acceptance test)
continuation away from the sweep area if buyers remain in control
⚪ Interpreting an Upthrust (Bear)
An Upthrust is a failed breakout. Stops get taken above the range, but the price cannot hold outside and collapses back into/through the structure.
Common behaviors after a good Upthrust:
rejection wick and rapid return
retest of the boundary from below
continuation downward if sellers remain in control
█ Settings
ZigZag Length – pivot sensitivity. Higher = smoother, fewer signals. Lower = more pivots, more traps.
Show Patterns – detect Springs only, Upthrusts only, or both.
Min Sweep – minimum sweep size relative to range height (filters micro sweeps).
Max Sweep – maximum sweep size relative to range height (filters “real breaks”).
Confirm Pad – extra snapback requirement beyond the boundary (adds confirmation).
-----------------
Disclaimer
The content provided in my scripts, indicators, ideas, algorithms, and systems is for educational and informational purposes only. It does not constitute financial advice, investment recommendations, or a solicitation to buy or sell any financial instruments. I will not accept liability for any loss or damage, including without limitation any loss of profit, which may arise directly or indirectly from the use of or reliance on such information.
All investments involve risk, and the past performance of a security, industry, sector, market, financial product, trading strategy, backtest, or individual's trading does not guarantee future results or returns. Investors are fully responsible for any investment decisions they make. Such decisions should be based solely on an evaluation of their financial circumstances, investment objectives, risk tolerance, and liquidity needs.
Cari skrip untuk "sweep"

Session SFPThis script is a powerful, multi-timeframe tool designed to identify high-probability Swing Failure Patterns (SFPs) at key historical levels.
Instead of looking for traditional "pivots" (like a 3-bar swing), this indicator finds the actual high and low of a previous higher-timeframe (HTF) bar (e.g., the previous weekly high/low) and waits for a lower-timeframe (LTF) candle to sweep that level and fail.
This allows you to spot liquidity sweeps and potential reversals at significant, structural price points.
How It Works
The indicator's logic is based on a simple, two-timeframe process:
Level Detection: First, it finds the high and low of the previous bar on your chosen "Level Timeframe" (e.g., W for Weekly, D for Daily). It plots these as small 'x' markers on your chart.
SFP Identification: Second, it watches price action on a lower "SFP Timeframe" (e.g., 240 for 4H). A potential SFP is identified when a candle's wick sweeps above a key high or below a key low.
Confirmation: The SFP is only confirmed after the SFP candle closes back below the high (for a bearish SFP) or above the low (for a bullish SFP). It then waits for a set number of "Confirmation Bars" to pass. If price does not close back over the level during this window, the signal is locked in, and a label is printed.
How to Use (Key Settings)
Level Timeframe (Most Important): This is the timeframe for the levels you want to trade. Set this to W to find SFPs of the previous weekly high/low. Set it to D to find SFPs of the previous daily high/low.
SFP Timeframe: This is the timeframe you want to use to find the SFP candle itself. This should be lower than your Level Timeframe (e.g., 240 or 60).
Level Lookback: This controls how many old levels the script will track. A value of 10 on a W Level Timeframe will track the highs and lows of the last 10 weeks.
Confirmation Bars: This is your "patience" filter. It's the number of SFP Timeframe bars that must close without reclaiming the level after the SFP. A value of 0 will confirm the SFP immediately on the candle's close.
Enable Wick % Filter: A quality filter. If checked, this ensures the SFP candle's rejection wick is a significant percentage of the candle's total range.
Chart Visuals
'x' Markers: These are the historical highs and lows from your "Level Timeframe". You can turn these on or off in the settings.
SFP Label: When an SFP is fully confirmed, a label (Bearish SFP or Bullish SFP) will appear, detailing the level that was swept and the timeframes used.
SFP Line: A solid horizontal line is drawn from the 'x' marker to the SFP candle to highlight the sweep.
Colored Boxes (Optional): If you are viewing a chart timeframe lower than your "SFP Timeframe", you can enable background boxes to highlight the exact SFP candle and its confirmation bars.

SMC Clean: Structure + LiquidityThis indicator provides Smart Money Concepts (SMC) tools designed to help traders analyze market structure, liquidity pools, and institutional trading zones. It combines several popular SMC methods into one powerful, customizable tool, with a clean and controlled chart display.
Features and How it Works:
Swing Highs and Lows: The indicator identifies confirmed swing highs and swing lows using a lookback period (default: 15 bars). These points form the basis for market structure analysis.
Equal Highs/Equal Lows (EQH/EQL): When price action creates repeated swing highs or lows within a defined tolerance, the tool automatically marks these areas as potential liquidity pools. These are levels where multiple stop orders may accumulate, sometimes leading to significant market moves.
Liquidity Lines & Sweeps: Liquidity lines highlight unswept highs and lows, making it easy to see where price may hunt liquidity. When price crosses a swing high/low and closes back, a sweep label is shown (optional).
BOS/CHOCH Detection:
Break of Structure (BOS): Signals a continuation of the current trend if price closes beyond the previous swing point.
Change of Character (CHOCH): Highlights when price reverses and breaks a key swing from the opposite direction, hinting at a potential trend change or shift in market regime.
Only confirmed swing points are considered to avoid repainting.
Premium & Discount Zones Explained:
After a new confirmed swing high and swing low, the area between them forms a “range.”
The premium zone is the upper half (from midpoint to swing high): this is typically considered where price is “expensive” or overvalued for the current swing, and is often watched for potential sell setups.
The discount zone is the lower half (from swing low to midpoint): this is where price is “cheap” or undervalued for the current swing, commonly monitored for potential buy setups.
Colored boxes mark these zones on your chart for instant reference.
Dashboard (Movable Position):
A visually enhanced dark-themed dashboard shows the current market structure (Bullish/Bearish), liquidity bias (Buy-Side, Sell-Side, or Balanced, based on unswept levels), and last swept side (i.e., which liquidity pool was last taken by price).
Dashboard position can be set anywhere on your chart for best visibility.
Customization Options:
Enable/disable any feature individually for a cleaner chart.
Control colors, transparency, and swing sensitivity via user settings.
How to Use:
Add the indicator to your chart and adjust settings to fit your trading style.
Use swing lines and dashboard to determine current market structure and bias.
Watch equal highs/lows and liquidity lines for possible sweep events.
Use the premium/discount zones to locate optimal areas for trade entries—with institutional logic, buy when price reaches the discount (lower) zone, and look for sales in the premium (upper) zone.
Use BOS/CHOCH signals as objective confirmations of trend or regime changes. Always interpret signals in context of broader price action.
Important Notes:
This indicator is educational and analytical—NO signals are guaranteed.
All calculations are non-repainting and use only confirmed price data (no lookahead).
No claims of predicting future price movement or performance are made.
Disclaimer:
This tool is for technical analysis education only. It is not a financial advice nor a guaranteed trading system. Please test all signals and concepts before using in live markets.

Trading Macro Windows by BW v2
Trading Macros by BW: Integrating ICT Concepts for Session Analysis
This indicator combines two key Inner Circle Trader (ICT) concepts—Change in State of Delivery (CISD) or Inverted Fair Value Gap (IFVG) signals with Macro Time Windows—to provide a unified tool for analyzing intraday price action, particularly during Pacific Time (PT) sessions. Rather than simply merging existing scripts, this integration creates a cohesive visual framework that highlights how macro consolidation periods interact with potential reversal or continuation signals like CISD or IFVG. By overlaying macro candle styling and borders on the chart alongside selectable signal lines, traders can better contextualize setups within ICT's macro narrative, where price often manipulates liquidity during these windows before displacing toward higher-timeframe objectives.
Core Components and How They Work Together:
Macro Time Windows (Inspired by ICT's Macro Periods):
ICT emphasizes "macro" as 30-minute windows (e.g., 06:45–07:15 PT, 07:45–08:15 PT, up to 11:45–12:15 PT) where price tends to consolidate, sweep liquidity, or form key structures like Fair Value Gaps (FVGs). These periods set the stage for the session's directional bias.
The indicator styles candles within these windows using a user-defined color for wicks, borders, and bodies (translucent for visibility). This visual emphasis helps traders focus on activity inside macros, where reversals or continuations often originate.
Borders are drawn as vertical lines at the start and end of each window (with a +5 minute buffer to capture related activity), using a dotted style by default. This creates a "study zone" that encapsulates macro events, allowing traders to assess if price is respecting or violating these zones in alignment with broader ICT models like the Power of 3 (AMD cycle).
Toggle: "Macro Candles Enabled" (default: true) – Turn off to disable styling and borders if focusing solely on signals.
CISD or IFVG Signals (Selectable Mode):
Mode Selection: Choose between "Change in the State of Delivery" (CISD) or "IFVG" (default: IFVG). Both detect shifts in market delivery during specific 30-minute slices (15–45 or 17–45 minutes past the hour in PT sessions).
CISD Mode: Based on ICT's definition of a sudden directional shift, this identifies aggressive displacements after sweeping recent highs/lows. It uses a rolling reference high/low over 6 bars, checks for sweeps (penetrating by at least 2 ticks in the last 2-3 bars), reclamation (closing beyond the reference with at least 50% body), and displacement (50% of prior range or an immediate FVG of 6+ ticks). Signals plot a horizontal line from the close, extending 24 bars right, labeled "CISD."
IFVG Mode: Focuses on Inverted Fair Value Gaps, where a bullish FVG (low > high by 13+ ticks) forms but is inverted (closed below) in the same slice, signaling bearish intent (or vice versa). This targets violations against opposing liquidity, often leading to raids on external ranges. Signals plot similarly, labeled "IFVG."
Shared Logic: Both modes enforce a 55-bar cooldown to prevent clustering, operate only during PT sessions (06:30–13:00), and use tick-based thresholds for precision across instruments. The integration with macros allows traders to see if signals occur within or at the edges of macro windows, enhancing confirmation—for example, a CISD inside a macro might indicate a manipulated reversal toward the session's true objective.
Toggle: "Signals Enabled" (default: true) – Turn off to hide all signal lines and labels, isolating the macro visualization.
How Components Interact:
Macro windows provide the "narrative context" (consolidation/manipulation), while CISD/IFVG signals detect the "delivery shift" (displacement). Together, they form a mashup that justifies publication: isolated signals can be noisy, but when filtered by macro periods, they align with ICT's session model. For instance, an IFVG inversion during a macro might confirm a liquidity sweep before targeting PD arrays or order blocks.
No external dependencies; all calculations are self-contained using Pine's built-in functions like ta.highest/lowest for references and time-based sessions for windows.
Usage Guidelines:
Apply to intraday charts (e.g., 1-5 min) or stocks during PT hours.
Look for confluence: A bull IFVG signal post-macro low sweep might target the next macro high or daily bias.
Customize colors/styles for signals (solid/dashed/dotted lines) and macros to suit your chart.
Backtest in replay mode to observe how macros frame signals—e.g., price often respects macro borders as S/R.
Limitations: Timezone-fixed to PT (America/Los_Angeles); signals are directional hints, not trade entries. Combine with ICT tools like order blocks or liquidity pools for full setups.
This script draws from community ICT implementations but refines them into a single, purpose-built tool for macro-driven trading, reducing chart clutter while emphasizing interconnected concepts. Feedback welcome!

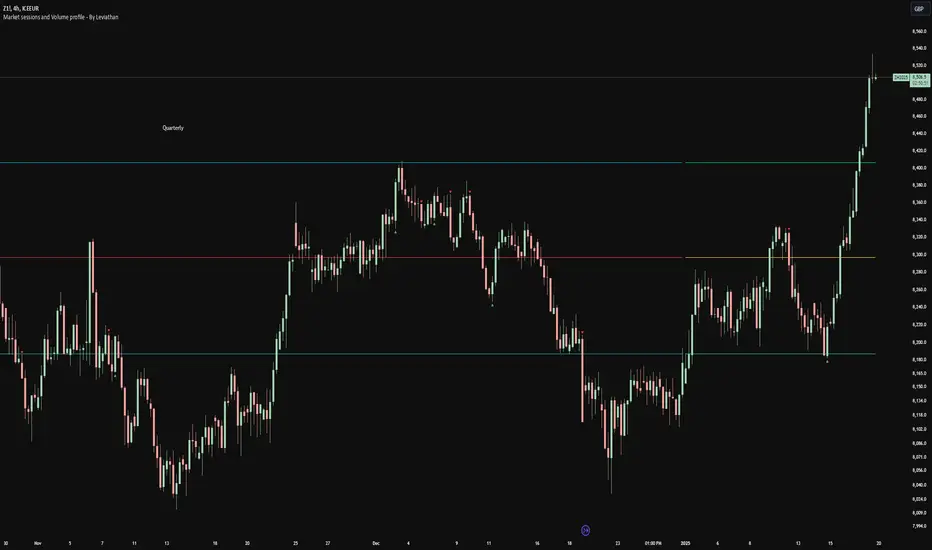
Volume profile [Signals] - By Leviathan [Mindyourbuisness]Market Sessions and Volume Profile with Sweep Signals - Based on Leviathan's Volume Profile
This indicator is an enhanced version of Leviathan's Volume Profile indicator, adding session-based value area analysis and sweep detection signals. It combines volume profile analysis with market structure concepts to identify potential reversal opportunities.
Features
- Session-based volume profiles (Daily, Weekly, Monthly, Quarterly, Yearly)
- Forex sessions support (Tokyo, London, New York)
- Value Area analysis with POC, VAH, and VAL levels
- Extended level visualization for the last completed session
- Sweep detection signals for key value area levels
Sweep Signals Explanation
The indicator detects two types of sweeps at VAH, VAL, and POC levels:
Bearish Sweeps (Red Triangle Down)
Conditions:
- Price makes a high above the level (VAH/VAL/POC)
- Closes below the level
- Closes below the previous candle's low
- Previous candle must be bullish
Trading Implication: Suggests a failed breakout and potential reversal to the downside. These sweeps often indicate stop-loss hunting above key levels followed by institutional selling.
Bullish Sweeps (Green Triangle Up)
Conditions:
- Price makes a low below the level (VAH/VAL/POC)
- Closes above the level
- Closes above the previous candle's high
- Previous candle must be bearish
Trading Implication: Suggests a failed breakdown and potential reversal to the upside. These sweeps often indicate stop-loss hunting below key levels followed by institutional buying.
Trading Guidelines
1. Use sweep signals in conjunction with the overall trend
2. Look for additional confirmation like:
- Volume surge during the sweep
- Price action patterns
- Support/resistance levels
3. Consider the session's volatility and time of day
4. More reliable signals often occur at VAH and VAL levels
5. POC sweeps might indicate stronger reversals due to their significance as fair value levels
Notes
- The indicator works best on higher timeframes (1H and above)
- Sweep signals are more reliable during active market hours
- Consider using multiple timeframe analysis for better confirmation
- Past performance is not indicative of future results
Credits: Original Volume Profile indicator by Leviathan
Sunmool's NY Lunch Model BacktestingICT NY Lunch Model Backtesting (12:00–13:00 NY) 🗽🍔
This research indicator tests an ICT narrative using the New York lunch window (12:00–13:00 America/New_York). It records that hour’s high/low and measures, during the post-lunch session (default 13:00–16:00), how often:
⬆️ If the afternoon trends up, the Lunch Low gets swept first.
⬇️ If the afternoon trends down, the Lunch High gets swept first.
It reports these as conditional probabilities, not trade signals. 📈
👀 What it shows
🟦 Lunch Range box (toggle): high/low from 12:00–13:00 NY
🔻🔺 Sweep signals (bar-anchored)
Low sweep: triangle below bar + optional “L”
High sweep: triangle above bar + optional “H”
🧱 Optional small box wrapping the swept candle
📊 Stats table (top-right)
P(L-swept | Up) — % of Up-days where Lunch Low was swept
P(H-swept | Down) — % of Down-days where Lunch High was swept
🔁 Contradictions + sample sizes (Up-days / Down-days)
🎯 Direction logic (Up/Down)
Anchor: 13:00 open (pmOpen) ⏰
Threshold: ATR × multiple or % from 13:00
Close ≥ pmOpen + threshold → Up-day
Close ≤ pmOpen − threshold → Down-day
Tiny moves under the threshold are ignored to reduce noise 🧹
⚙️ Inputs
🌐 Timezone: America/New_York (DST handled)
🍽️ Lunch window: 1200–1300
🕓 Post-lunch window: default 1300–1600 (try 17:00/20:00 for sensitivity)
📐 Trend threshold: ATR / Percent (with length/multiple or % level)
📅 Weekdays-only toggle (FX/Equities style)
👁️ Display toggles: Lunch box / sweep arrows / sweep text / sweep candle box / stats table
🔔 TF hint when chart TF > 15m
🧭 How to use
Use 5–15m charts for accurate lunch range capture.
Scroll ~1 year for meaningful samples.
Run sensitivity checks: vary ATR/% thresholds and the post-lunch end time.
For crypto, compare with vs without weekends. 🚀
🧠 Reading the results
High P(L-swept | Up) with a solid Up-day count ⇒ on up afternoons, lunch low is often swept.
High P(H-swept | Down) ⇒ on down afternoons, lunch high is often swept.
Lower Contradictions = cleaner tendency.
Remember: this is a probabilistic tendency, not a rule. 🎲
📝 Notes & limits
All markers (arrows, text, sweep boxes) are bar-anchored; the lunch range box is a research overlay you can toggle.
Real-time vs historical bar building can differ—interpret on bar close. 🔒

FU + SMI Validator (Proper FU, 30m)Overview
The FU + SMI Validator is a sophisticated technical analysis indicator designed to detect Proper FU (Fakeouts or Liquidity Sweeps) on the 30-minute timeframe. This tool aims to help traders identify high-probability reversal setups that occur when price briefly breaks key levels (sweeping liquidity), then reverses with momentum confirmation.
Fakeouts are common market events where price action “hunts stops” before reversing direction. Correctly identifying these events can offer excellent entry points with defined risk. This indicator combines price action logic with momentum and volatility filters to provide reliable signals.
Core Concepts
Proper FU (Fakeout) Detection
At its core, the script identifies proper fakeouts by checking if the current bar’s price:
For bullish fakeouts: dips below the previous bar’s low (sweeping stops) and then closes above the previous bar’s high
For bearish fakeouts: spikes above the previous bar’s high and then closes below the previous bar’s low
This ensures that the breakout is a true sweep rather than just a one-sided close.
Optionally, the script can require one additional confirmation bar after the FU, ensuring that the momentum is sustained and reducing false signals.
SMI-style Momentum Validation
To improve the quality of signals, the indicator uses a proxy for the Stochastic Momentum Index (SMI) by calculating the difference between current and past linear regression slopes of price. This momentum check helps ensure that fakeouts occur alongside actual directional strength.
Key points:
Momentum must be increasing in the direction of the FU signal.
Momentum filters can be enabled or disabled based on user preference.
Squeeze Condition to Avoid Low-Volatility Traps
The script includes a volatility filter based on a squeeze-like condition:
It compares Bollinger Bands (BB) and Keltner Channels (KC).
When BB bands contract inside KC bands, the market is in a squeeze state, signaling low volatility.
Fakeouts during squeeze conditions are often unreliable; the script can filter these out to reduce false alarms.
Killzone Session Timing Filter
Recognizing that liquidity and volatility vary by session, this tool supports optional filtering for:
London Killzone: 09:00 to 10:30 (UK time)
New York Killzone: 13:00 to 14:30 (UK time)
Signals only trigger during these high-activity windows if enabled, helping traders focus on periods with the best liquidity and market participation.
Note: For Killzone filtering to work accurately, your TradingView chart must be set to the UK timezone.
Features & Benefits
Robust FU detection ensures the breakout price action is meaningful, reducing noise.
Momentum filter via linear regression slope captures trend strength in a smooth, mathematically sound way.
Low-volatility squeeze avoidance helps reduce false signals in choppy or range-bound markets.
Killzone timing filter focuses your attention on the most liquid and active market hours.
Optional confirmation bar increases signal reliability.
Raw FU markers allow visualization of all detected fakeouts for pattern recognition and manual analysis.
Alerts built-in for both valid buy and sell FU setups, enabling real-time notification and quicker decision-making.
Customization Options
Killzone usage: Enable or disable the session timing filter.
Sessions: Configure London and New York killzone time ranges.
Momentum alignment: Enable or disable momentum filter based on SMI proxy.
Volatility filter: Avoid signals during squeeze or low-volatility conditions.
FU confirmation: Option to require one additional confirming candle after the initial FU.
Squeeze and momentum parameters: Adjust Bollinger Bands length and multiplier, Keltner Channel length and ATR multiplier.
Raw FU markers: Show or hide all detected fakeouts regardless of filters.
How to Use This Indicator
Apply to 30-minute charts for forex pairs, indices, cryptocurrencies, or other instruments.
Set your chart timezone to UK time if using Killzone filters.
Adjust input parameters based on your preferred sessions and risk tolerance.
Look for green “VALID BUY FU” labels below bars for bullish fakeout entries.
Look for red “VALID SELL FU” labels above bars for bearish fakeout entries.
Use the alert system to receive notifications on setups.
Combine with your existing analysis or risk management strategy for entries, stops, and profit targets.
Why Use FU + SMI Validator?
Fakeouts are some of the most lucrative but tricky setups for many traders. Without proper filters, they can lead to false entries and losses. This script integrates price action, momentum, volatility, and session timing into one package, providing a robust tool to spot high-quality fakeout opportunities and improve trading confidence.
Limitations
Requires chart to be set to UK timezone for session filters.
Designed specifically for 30-minute timeframe — performance on other timeframes may vary.
Momentum is a proxy, not a direct SMI calculation.
Like all indicators, best used in conjunction with sound risk management and other analysis tools.
Potential Enhancements
Conversion into a full strategy script for backtesting entries and exits.
Addition of other momentum indicators (RSI, MACD) or volume filters.
Customizable time zones or auto time zone detection.
Multi-timeframe analysis capabilities.
Visual dashboard for summary of signal stats.

Market Structure Trailing Stop [BigBeluga]The Market Structure Trailing Stop indicator is an advanced tool for identifying market structure shifts, liquidity sweeps, and potential trend reversals using comprehensive volume analysis. This indicator combines the analysis of market structure pivots (CHoCH - Change of Character) with a sophisticated volume-based trailing stop logic. By evaluating delta volume at key structural points, it allows traders to identify high-probability trend continuations or reversals and manage their trades more effectively.
🔵 KEY FEATURES
● Market Structure Analysis
Pivot-Based Market Structure : The indicator identifies high and lows using user-defined periods, allowing traders to spot key market structure shifts.
Change of Character (CHoCH) : The first significant break of a market structure is marked as a CHoCH, indicating a potential trend reversal.
Break of Structure (BoS) : The indicator highlights subsequent breaks of structure after CHoCH, providing traders with crucial insights into trend strength.
● Advanced Volume Analysis
Delta Volume Evaluation : The indicator calculates delta volume (difference between up and down volume) at each ChoCh or BoS market structure point to assess the strength of the move. Identify Delta Volume from break point back to Pivot
● Trailing Stop Logic
Volume-Validated Trailing Stop : The indicator automatically plots a trailing stop if the delta volume at the UP CHoCH is positive and above the defined threshold and vice versa for Down CHoCH , allowing traders to protect their profits while riding the trend.
Trend Weakness Detection : If a subsequent BoS occurs with negative delta volume or lower volume than the input threshold, the trailing stop disappears, indicating potential trend exhaustion or reversal.
Dynamic Stop Placement : The trailing stop is dynamically adjusted based on market structure and volume, providing traders with a more adaptive stop-loss strategy.
Up Trend Trailing Stop:
Down Trend Trailing Stop:
● Liquidity Sweep Detection
Liquidity Sweep (X) Labels : The indicator identifies liquidity sweeps—points where the price temporarily reverses to sweep liquidity above or below a key level—marked with an “X” label.
Potential Reversal Zones : These liquidity sweeps are potential reversal zones, especially when accompanied by significant delta volume changes, providing traders with early warnings of potential trend reversals.
🔵 HOW TO USE
● Identifying Market Structure Shifts
Change of Character (CHoCH) : When a CHoCH occurs, the indicator calculates the total volume from the high point to the break point. If the delta volume is positive and exceeds the input threshold, a trailing stop is plotted, signaling potential trend continuation.
Break of Structure (BoS) : If BoS is enabled, subsequent breaks of structure are highlighted. If these BoS points show weaker volume or negative delta volume, the trailing stop will disappear, indicating that the trend may be losing strength.
● Using the Trailing Stop Feature
Protecting Profits : Once a CHoCH occurs and the delta volume validates the trend, the trailing stop will be plotted below (or above) the price to protect profits while allowing the trend to run.
Trend Reversal Signals : If the trailing stop disappears due to weak volume at subsequent BoS points, it may signal that the trend is losing momentum, and traders may consider closing their positions or tightening their stops manually.
● Liquidity Sweep Interpretation
Spotting Reversal Zones : Liquidity sweeps, marked with an “X” label, indicate zones where the price has swept liquidity. These areas can serve as potential reversal zones, especially when significant delta volume is observed at these points.
Early Reversal Warnings : Traders can use these liquidity sweep labels as early warnings for potential trend reversals, particularly in conjunction with other technical analysis methods.
🔵 CUSTOMIZATION
Highs and Lows Calculation : Customize the number of bars to the left and right for identifying pivots and market structure shifts.
Volume Threshold : Define the volume threshold to filter out weaker moves and focus on significant market structure shifts.
BoS and Liquidity Sweep Labels : Toggle on or off the BoS and Liquidity Sweep labels to tailor the indicator to your trading style.
Trend Color : Enable or disable trend coloring for candles to visually highlight uptrends and downtrends on the chart.
🔵 CONCLUSION
The Market Structure Trailing Stop indicator combines advanced volume analysis with market structure detection to provide traders with a powerful tool for identifying and managing trends. By leveraging delta volume at key structure points, it helps traders validate trend strength and manage their positions with a dynamic trailing stop strategy. The addition of liquidity sweep detection further enhances its utility, offering early warnings of potential trend reversals. This indicator is ideal for traders who want to gain a deeper understanding of market structure while incorporating volume-based insights into their trading strategies.

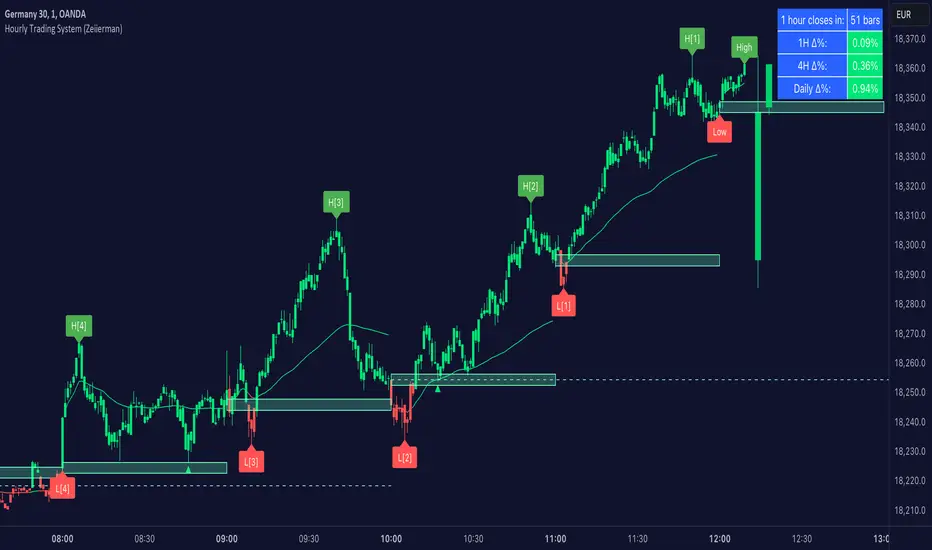
Hourly Trading System (Zeiierman)█ Overview
The Hourly Trading System (Zeiierman) is designed to enhance your trading by highlighting critical price levels and trends on an hourly basis. This indicator plots the open prices of hourly and 4-hour candles, visualizes retests, displays average price lines, and overlays higher timeframe candlesticks. It is particularly beneficial for intraday traders seeking to capitalize on short-term price movements and volume patterns.
█ How It Works
This indicator works by plotting significant price levels and zones based on hourly and 4-hour candle opens. It also includes functionalities for identifying retests of these levels, calculating and displaying average prices, and showing high and low labels for each hour.
█ Timeframe
The Hourly Trading System is designed to be used on the 1-minute or 5-minute timeframe. This system is tailored for intraday trading, allowing traders to find optimal entries around hourly opening levels and providing an easy method to identify the hourly trend. It works effectively on any market.
█ How to Use
Trend Analysis
Quickly gauge where the current price stands relative to key hourly and 4-hour levels. The plotted lines and zones serve as potential support and resistance areas, helping traders identify crucial points for entry or exit.
Utilize the 1-hour average and higher timeframe candles to understand the overall market trend. Aligning intraday strategies with larger trends can enhance trading decisions.
Use the bar coloring to quickly gauge the 1-hour trend on a lower timeframe. The bar colors indicate whether the hourly trend is bullish (green) or bearish (red), helping traders make quicker decisions in alignment with the overall trend.
Retest Identification
Enable retest signals to see where the price retested the hourly open levels. These retest points often signal strong price reactions, offering opportunities for trades based on support/resistance flips.
One effective strategy to incorporate is looking for price flips when a new hour starts. This approach involves monitoring price action at the beginning of each hour. If the price breaks and retests the hourly open level with strong momentum, it could indicate a potential trend reversal or continuation. This strategy is effective in volatile markets where price movements are significant at the start of each new hour.
Liquidity Sweep Strategy
Another common and effective strategy is the liquidity sweep. This involves identifying key levels where liquidity is likely to accumulate, such as previous hour highs and lows, and observing how the price interacts with these price levels. When the price sweeps through these levels, triggering stop-loss orders or pending orders, it often results in a sharp price movement followed by a reversal. Traders can capitalize on these movements by entering trades in the direction of the reversal once the liquidity sweep has occurred.
Equal Highs and Lows Strategy
The Equal Highs and Lows strategy leverages the concept of identifying levels where the price forms multiple highs or lows at the same level over different hourly periods. These equal highs and lows often indicate strong support or resistance levels where liquidity is accumulated. When the price approaches these levels, it is likely to trigger stop-loss orders and lead to significant price movements. Traders can look for breakouts or reversals around these levels to enter trades with higher probability setups.
█ Settings
Zone Width: Specifies the width of the zone around the 1-Hour Open as a percentage. Adjust this to widen or narrow the zone.
Show Retests: Enables or disables the display of retest markers. Retest markers show where the price has retested the 1-Hour Open line.
Number of Retests: Sets the number of retests to display. Adjust this to see more or fewer retest markers.
Volume Filter: Enables or disables the volume filter for retests. Use this to highlight retests with significant volume.
Volume Filter Length: Sets the length of the volume filter, smoothing the volume data to reduce noise.
1-Hour Average Line: Enables or disables the 1-hour average price line. This line shows the average price over the past hour.
Hourly High & Low Labels: Enables or disables the display of hourly high and low labels, marking the highest and lowest prices within each hour.
Candlesticks: Enables or disables the display of candlesticks on the chart, providing a detailed view of price action.
Bar Color: Enables or disables bar coloring based on price direction, with up bars in green and down bars in red.
Timeframe: Sets the timeframe for higher timeframe candles. Adjust this to match the period you want to analyze.
Number of Candles: Sets the number of higher timeframe candles to display. Increase this to see more candles on the chart.
Location: Sets the location for higher timeframe candles, allowing you to position them left or right on the chart.
-----------------
Disclaimer
The information contained in my Scripts/Indicators/Ideas/Algos/Systems does not constitute financial advice or a solicitation to buy or sell any securities of any type. I will not accept liability for any loss or damage, including without limitation any loss of profit, which may arise directly or indirectly from the use of or reliance on such information.
All investments involve risk, and the past performance of a security, industry, sector, market, financial product, trading strategy, backtest, or individual's trading does not guarantee future results or returns. Investors are fully responsible for any investment decisions they make. Such decisions should be based solely on an evaluation of their financial circumstances, investment objectives, risk tolerance, and liquidity needs.
My Scripts/Indicators/Ideas/Algos/Systems are only for educational purposes!
Multi-Timeframe SFP (Swing Failure Pattern)How to Use
1. Set Pivot Timeframe: Choose the timeframe for identifying major swing points (e.g., 'D' for Daily pivots).
2. Set SFP Timeframe: Choose the timeframe to find the SFP candle (e.g., '240' for the 4-Hour chart).
3. Set Confirmation Bars: Set how many SFP Timeframe bars must pass without invalidating the level. A value of '0' confirms immediately on the SFP bar's close. A value of '1' waits for one more bar to close.
4. Adjust Filters (Optional): Enable the 'Wick % Filter' to add a quality check for strong rejections.
5. Watch & Wait: The indicator will draw lines and labels and fire alerts for fully confirmed signals.
In-Depth Explanation
1. Overview
The Dynamic Pivot SFP Engine is a multi-timeframe tool designed to identify and validate Swing Failure Patterns (SFPs) at significant price levels.
An SFP is a common price action pattern where price briefly trades beyond a previous swing high or low (sweeping liquidity) but then fails to hold those new prices, closing back inside the previous range. This "failure" often signals a reversal.
This indicator enhances SFP detection by separating the Pivot (Liquidity) from the SFP (Rejection), allowing you to monitor them on different timeframes.
2. The Core Multi-Timeframe Logic
The indicator's power comes from two key inputs:
• Pivot Timeframe (Pivot Timeframe)
This is the "high timeframe" used to establish significant support and resistance levels. The script finds standard pivots (swing highs and lows) on this timeframe based on the Pivot Left Strength and Pivot Right Strength inputs. These pivots are the "liquidity" levels the SFP will target. The Pivot Lookback input controls how long (in Pivot Timeframe bars) a pivot remains active and monitored.
• SFP Timeframe (SFP Timeframe)
This is the "execution timeframe" where the script looks for the actual SFP. On every new bar of this timeframe, the script checks if price has swept and rejected any of the active pivots.
Example Setup:
You might set Pivot Timeframe to 'D' (Daily) to find major daily swing points. You then set SFP Timeframe to '240' (4-Hour) to find a 4-hour candle that sweeps a daily pivot and closes back below/above it.
3. The SFP Confirmation Process
An SFP is not confirmed instantly. It must pass a rigorous, multi-step validation process.
Step 1: The SFP Candle (The Sweep)
A potential SFP is identified when an SFP Timeframe bar does the following:
• Bearish SFP: The bar's high trades above an active pivot high, but the bar closes below that same pivot high.
• Bullish SFP: The bar's low trades below an active pivot low, but the bar closes above that same pivot low.
Step 2: The Wick Filter (Optional Quality Check)
If Enable Wick % Filter is checked, the SFP candle from Step 1 is also measured.
• For a bearish SFP, the upper wick (from the high to the open/close) must be at least Min. Wick % of the entire candle's range (high-to-low).
• For a bullish SFP, the lower wick (from the low to the open/close) must meet the same percentage requirement.
If the SFP candle fails this test, it is discarded, even if it met the sweep/close criteria.
Step 3: The Validation Window (The Confirmation)
This is the most critical feature, controlled by Confirmation Bars.
• If Confirmation Bars = 0: The SFP is confirmed immediately on the SFP candle's close (assuming it passed the optional wick check). The label, line, and alert are triggered at this moment.
• If Confirmation Bars > 0: The SFP enters a "pending" state. The script will wait for $N$ more SFP Timeframe bars to close.
o Invalidation: If, during this waiting period, any bar closes back across the pivot (e.g., a close above the pivot for a bearish SFP), the SFP is considered failed and invalidated. All pending plots are deleted.
o Confirmation: If the $N$ confirmation bars all complete without invalidating the level, the SFP is finally confirmed. The label, line, and alert are only triggered after this entire process is complete. This adds a significant layer of robustness, ensuring the rejection holds for a period of time.
4. Visuals & Alerts
• Lines: A horizontal line is drawn from the original pivot to the SFP bar, showing which level was targeted. Note: These lines will only be drawn on chart timeframes equal to or lower than the 'SFP Timeframe'.
• Labels: A label is placed at the SFP's extreme (the high/low of the SFP bar). The label text conveniently includes the Ticker, Pivot TF, SFP TF, and Confirmation bar settings (e.g., "Bearish SFP BTCUSD / Pivot: 1D / SFP: 4H | Conf: 1").
• MTF Boxes (Show SFP Box, Show Conf. Boxes): These boxes highlight the SFP and confirmation bars. Crucially, they are only visible when your chart timeframe is lower than the SFP Timeframe. For example, if your SFP Timeframe is '240' (4H), you will only see these boxes on the 1H, 15M, 5M, etc., charts. This allows you to see the higher-timeframe SFP unfolding on your lower-timeframe chart.
• Alerts (Enable Alerts): An alert is fired only when an SFP is fully confirmed (i.e., after the Confirmation Bars have passed successfully). For efficient, real-time monitoring, it is highly recommended to run this indicator server-side by creating an alert on TradingView set to trigger on "Any alert() function call".

ICT Venom Trading Model [TradingFinder] SMC NY Session 2025SetupIntroduction
The ICT Venom Model is one of the most advanced strategies in the ICT framework, designed for intraday trading on major US indices such as US100, US30, and US500. This model is rooted in liquidity theory, time and price dynamics, and institutional order flow.
The Venom Model focuses on detecting Liquidity Sweeps, identifying Fair Value Gaps (FVG), and analyzing Market Structure Shifts (MSS). By combining these ICT core concepts, traders can filter false breakouts, capture sharp reversals, and align their entries with the real institutional liquidity flow during the New York Session.
Key Highlights of ICT Venom Model :
Intraday focus : Optimized for US indices (US100, US30, US500).
Time element : Critical window is 08:00–09:30 AM (Venom Box).
Liquidity sweep logic : Price grabs liquidity at 09:30 AM open.
Confirmation tools : MSS, CISD, FVG, and Order Blocks.
Dual setups : Works in both Bullish Venom and Bearish Venom conditions.
At its core, the ICT Venom Strategy is a framework that explains how institutional players manipulate liquidity pools by engineering false breakouts around the initial range of the market. Between 08:00 and 09:30 AM New York time, a range called the “Venom Box” is formed.
This range acts as a trap for retail traders, and once the 09:30 AM market open occurs, price usually sweeps either the high or the low of this box to collect stop-loss liquidity. After this liquidity grab, the market often reverses sharply, giving birth to a classic Bullish Venom Setup or Bearish Venom Setup
The Venom Model (ICT Venom Trading Strategy) is not just a pattern recognition tool but a precise institutional trading model based on time, liquidity, and market structure. By understanding the Initial Balance Range, watching for Liquidity Sweeps, and entering trades from FVG zones or Order Blocks, traders can anticipate market reversals with high accuracy. This strategy is widely respected among ICT followers because it offers both risk management discipline and clear entry/exit conditions. In short, the Venom Model transforms liquidity manipulation into actionable trading opportunities.
Bullish Setup :
Bearish Setup :
🔵 How to Use
The ICT Venom Model is applied by observing price behavior during the early hours of the New York session. The first step is to define the Initial Range, also called the Venom Box, which is formed between 08:00 and 09:30 AM EST. This range marks the high and low points where institutional traders often create traps for retail participants. Once the official market opens at 09:30 AM, price usually sweeps either the top or bottom of this box to collect liquidity.
After this liquidity grab, the market tends to reverse in alignment with the true directional bias. To confirm the setup, traders look for signals such as a Market Structure Shift (MSS), Change in State of Delivery (CISD), or the appearance of a Fair Value Gap (FVG). These elements validate the reversal and provide precise levels for trade execution.
🟣 Bullish Setup
In a Bullish Venom Setup, the market first sweeps the low of the Venom Box after 09:30 AM, triggering sell-side liquidity collection. This downward move is often sharp and deceptive, designed to stop out retail long positions and attract new sellers. Once liquidity is taken, the market typically shifts direction, forming an MSS or CISD that signals a reversal to the upside.
Traders then wait for price to retrace into a Fair Value Gap or a demand-side Order Block created during the reversal leg. This retracement offers the ideal entry point for long positions. Stop-loss placement should be just below the liquidity sweep low, while profit targets are set at the Venom Box high and, if momentum continues, at higher session or daily highs.
🟣 Bearish Setup
In a Bearish Venom Setup, the process is similar but reversed. After the Initial Range is defined, if price breaks above the Venom Box high following the 09:30 AM open, it signals a false breakout designed to collect buy-side liquidity. This move usually traps eager buyers and clears out stop-losses above the high.
After the liquidity sweep, confirmation comes through an MSS or CISD pointing to a reversal downward. At this stage, traders anticipate a retracement into a Fair Value Gap or a supply-side Order Block formed during the reversal. Short entries are taken within this zone, with stop-loss positioned just above the liquidity sweep high. The logical profit targets include the Venom Box low and, in stronger bearish momentum, deeper session or daily lows.
🔵 Settings
Refine Order Block : Enables finer adjustments to Order Block levels for more accurate price responses.
Mitigation Level OB : Allows users to set specific reaction points within an Order Block, including: Proximal: Closest level to the current price. 50% OB: Midpoint of the Order Block. Distal: Farthest level from the current price.
FVG Filter : The Judas Swing indicator includes a filter for Fair Value Gap (FVG), allowing different filtering based on FVG width: FVG Filter Type: Can be set to "Very Aggressive," "Aggressive," "Defensive," or "Very Defensive." Higher defensiveness narrows the FVG width, focusing on narrower gaps.
Mitigation Level FVG : Like the Order Block, you can set price reaction levels for FVG with options such as Proximal, 50% OB, and Distal.
CISD : The Bar Back Check option enables traders to specify the number of past candles checked for identifying the CISD Level, enhancing CISD Level accuracy on the chart.
🔵 Conclusion
The ICT Venom Model is more than just a reversal setup; it is a complete intraday trading framework that blends liquidity theory, time precision, and market structure analysis. By focusing on the Initial Range between 08:00 and 09:30 AM New York time and observing how price reacts at the 09:30 AM open, traders can identify liquidity sweeps that reveal institutional intentions.
Whether in a Bullish Venom Setup or a Bearish Venom Setup, the model allows for precise entries through Fair Value Gaps (FVGs) and Order Blocks, while maintaining clear risk management with well-defined stop-loss and target levels.
Ultimately, the ICT Venom Model provides traders with a structured way to filter false moves and align their trades with institutional order flow. Its strength lies in transforming liquidity manipulation into actionable opportunities, giving intraday traders an edge in timing, accuracy, and consistency. For those who master its logic, the Venom Model becomes not only a strategy for entry and exit, but also a deeper framework for understanding how liquidity truly drives price in the New York session.

Asian Stop Hunt ModelSTOP HUNT MODEL – STRATEGY DESCRIPTION
The Stop Hunt Model is designed to capture high-probability trades by targeting stop-loss liquidity from retail traders at buy-side and sell-side liquidity zones. The strategy focuses on identifying where liquidity is taken during the Asian session, waiting for a Change of Character (CHoCH), and then entering from unfilled orders (Balanced Price Range / Imbalance) in the direction of the dominant IPDA bias. The objective is to trade from engineered liquidity sweeps toward the next logical liquidity pool, while maintaining strict risk control.
The model operates primarily on the 5-minute chart, with early confirmation on the 3-minute chart. The Asian Killzone is used to define the initial range, plotting its high and low. Higher-timeframe liquidity from Daily, 4H, and 1H charts is marked in advance to provide directional context. IPDA direction is determined using macro alignment such as global interest rate bias and long-term trend behavior.
Once the Asian session concludes, price is expected to sweep either the high or low of the Asian range or the previous day’s high/low. After the liquidity sweep, the market must show a valid CHoCH, confirming a shift in internal structure. Entries are taken only after the formation and retest of a Balanced Price Range (BPR) created by overlapping imbalances. Trades are executed from these imbalance zones, targeting the next liquidity area, with stop loss placed at the most recent swing high or low.
This model prioritizes precision over frequency, aiming for fewer trades with higher reward-to-risk ratios, typically 1:3 or better, and a strict daily risk cap.
CHECKLIST – STOP HUNT MODEL
1.Mark Asian Killzone High and Low
2.Identify IPDA directional bias for the pair
3.Mark Buy-side and Sell-side liquidity from Daily, 4H, and 1H
4.Wait for a liquidity sweep (Asian High/Low or Previous Day High/Low)
5.Confirm a valid CHoCH
6.Identify a valid BPR (overlapping imbalance)
7.Enter trade from the BPR zone
8.Target the next liquidity pool
9.Place stop loss at the last swing high or low
RULES – STOP HUNT MODEL STRATEGY
> Always pre-mark Buy-side and Sell-side liquidity on 1D, 4H, and 1H
> Asian Killzone must complete by 10:30 AM IST
> After Asian close, mark 15-minute timeframe liquidity
> Trade only after the market sweeps the Asian session high or low
> Align trades with IPDA direction:
> Bullish IPDA → Prefer sweep of Asian Low
> Bearish IPDA → Prefer sweep of Asian High
> CHoCH confirmation is mandatory:
> Green CHoCH for bullish setups
> Red CHoCH for bearish setups
Setup conditions:
1. Bullish: CHoCH above price + BPR below price
2. Bearish: CHoCH below price + BPR above price
3.BPR must be formed by overlapping imbalances:
4.Red → Green for bullish
5.Green → Red for bearish
6.Look for V-shaped (bullish) or A-shaped (bearish) candle behavior
7.Entry only on imbalance retest — no chase entries
8.Targets must be killzone extremes or next liquidity zone
9.Stop loss must always be at the last swing high or low
10.No manual exits if aiming for 1:3 RR
11.If price sweeps both sides or no clean sweep occurs → No Trade
12.Trade less, execute cleaner setups
13.Daily target: 1% maximum

BuLLzEyE_MNQ FVG/IFVG SystemFVG Boxes
These are the main trading zones. The indicator automatically detects Fair Value Gaps and draws boxes on your chart:
• GREEN boxes = Bullish FVG (potential buy zone)
• RED boxes = Bearish FVG (potential sell zone)
• YELLOW boxes = IFVG (Inverse FVG - filled gaps that now act as support/resistance)
• GRAY boxes = Mitigated FVG (gap has been filled)
• WHITE dashed line = 50% level (optimal entry point within the FVG)
Session Boxes
Session boxes show you the high/low range of each major trading session. This helps identify where liquidity sits:
• PURPLE = Asia Session (6:00 PM - 3:00 AM ET)
• BLUE = London Session (3:00 AM - 12:00 PM ET)
• ORANGE = New York Session (9:30 AM - 4:00 PM ET)
• TEAL = Sydney Session (5:00 PM - 2:00 AM ET)
• LIME GREEN = Kill Zone / London-NY Overlap (8:00 AM - 11:00 AM ET) - BEST TRADING TIME
Entry Signals
• GREEN triangle pointing UP = Long entry signal at a Bullish FVG (not 100% reliable)
• RED triangle pointing DOWN = Short entry signal at a Bearish FVG (not 100% reliable)
Liquidity Sweeps
• RED X with 'SWEEP' = Previous Day High (PDH) was swept
• GREEN X with 'SWEEP' = Previous Day Low (PDL) was swept
• Dotted lines = PDH (red) and PDL (green) levels
Information Tables
HTF Bias Table (Top Right): Shows whether the higher timeframe (default 15m) is bullish or bearish, the number of active FVGs, and whether you're in the trading session.
Risk Calculator Table (Bottom Right): Shows your risk amount and calculates how many contracts you can trade for different stop loss sizes (5pt, 10pt, 15pt).
How It Works
What is a Fair Value Gap?
A Fair Value Gap (FVG) is a 3-candle pattern where aggressive buying or selling creates a price void. Specifically, it's when the wick of the first candle doesn't overlap with the wick of the third candle, leaving a gap in between. Price tends to return to these gaps to 'rebalance' before continuing in the original direction.
What is an Inverse FVG?
When an FVG gets filled (price returns and closes through the gap), it becomes an Inverse FVG (IFVG). These zones flip their polarity - a filled Bullish FVG becomes resistance, and a filled Bearish FVG becomes support. The indicator automatically converts mitigated FVGs to yellow IFVG boxes.
The 50% Entry Level
The dashed white line in each FVG represents the 50% level (also called Consequent Encroachment). This is considered the optimal entry point - it's the middle of the imbalance where price is most likely to react.
Suggested Trading Strategy
1. Check HTF Bias (top right table) - only trade in that direction
2. Wait for a liquidity sweep (SWEEP label appears)
3. Look for an FVG to form AFTER the sweep
4. Enter when price returns to the 50% level (dashed line)
5. Place stop loss below/above the FVG (add 2 ticks buffer)
6. Take profit at 1:2 or 1:3 risk-to-reward ratio
Settings Explained
FVG Settings
• Min FVG Size: Minimum gap size in points to be considered valid (default: 2.0)
• Max FVG Age: How many bars until an FVG is removed from chart (default: 50)
• Show 50% Entry Level: Toggle the dashed entry line on/off
Session Settings
• Show Session Boxes: Toggle all session boxes on/off
• Max Sessions to Show: How many historical sessions to display (default: 5)
• Individual Session Toggles: Turn each session (Asia/London/NY/Sydney/Kill Zone) on or off
Risk Calculator Settings
• Account Size: Your trading account balance
• Risk Per Trade: Percentage of account to risk per trade (default: 0.5%)
• Tick Value/Size: Contract specifications for MNQ ($0.50 per tick, 0.25 point tick size)
Tips for Best Results
1. Trade during the Kill Zone (8:00-11:00 AM ET) for best volatility and liquidity
2. Always align trades with HTF bias - don't fight the trend
3. Wait for liquidity sweeps before entering - this confirms smart money activity
4. Use the 50% level for entries - it offers the best risk-to-reward
5. Watch for IFVG zones as additional confluence for entries
6. Use the risk calculator to size positions properly - never risk more than you can afford
7. Session boxes help identify where stops are clustered - sweeps of these levels often precede reversals
Available Alerts
• New FVG Formed (Bullish or Bearish)
• Price Touching 50% Entry Level
• FVG Mitigated (gap filled)
• Long Entry Signal
• Short Entry Signal
• PDH/PDL Liquidity Sweep
─────────────────────────────────────
Created by BullyTrading
Designed for MNQ Prop Firm Trading

Apex Edge – Wolfe Wave HunterApex Edge – Wolfe Wave Hunter
The modern Wolfe Wave, rebuilt for the algo era
This isn’t just another Wolfe Wave indicator. Classic Wolfe detection is rigid, outdated, and rarely tradable. Apex Edge – Wolfe Wave Hunter re-engineers the pattern into a modern, SMC-driven model that adapts to today’s liquidity-dominated markets. It’s not about drawing pretty shapes – it’s about extracting precision entries with asymmetric risk-to-reward potential.
🔎 What it does
Automatic Wolfe Wave Detection
Identifies bullish and bearish Wolfe Wave structures using pivot-based logic, symmetry filters, and slope tolerances.
Channel Glow Zones
Highlights the Wolfe channel and projects it forward into the future (bars are user-defined). This allows you to see the full potential of the trade before price even begins its move.
Stop Loss (SL) & Entry Arrow
At the completion of Wave 5, the algo prints a Stop Loss line and a tiny entry arrow (green for bullish, red for bearish). but the colours can be changed in user settings. This is the “execution point” — where the Wolfe setup becomes tradable.
Target Projection Lines
TP1 (EPA): Derived from the traditional 1–4 line projection.
TP2 (1.272 Fib): Optional secondary profit target.
TP3 (1.618 Fib): Optional extended target for large runners.
All TP lines extend into the future, so you can track them as price evolves.
Volume Confirmation (optional)
A relative volume filter ensures Wave 5 is formed with meaningful market participation before a setup is confirmed.
Alerts (ready out of the box)
Custom alerts can be fired whenever a bullish or bearish Wolfe Wave is confirmed. No need to babysit the charts — let the script notify you.
⚙️ Customisation & User Control
Every trader’s market and style is different. That’s why Wolfe Wave Hunter is fully customisable:
Arrow Colours & Size
Works on both light and dark charts. Choose your own bullish/bearish entry arrow colours for maximum visibility.
Tolerance Levels
Adjust symmetry and slope tolerance to refine how strict the channel rules are.
Tighter settings = fewer but cleaner zones.
Looser settings = more frequent setups, but with slightly lower structural quality.
Channel Glow Projection
Define how many bars forward the channel is drawn. This controls how far into the future your Wolfe zones are extended.
Stop Loss Line Length
Keep the SL visible without it extending infinitely across your chart.
Take Profit Line Colors
Each TP projection can be styled to your preference, allowing you to clearly separate TP1, TP2, and TP3.
This isn’t a one-size-fits-all tool. You can shape Wolfe detection logic to match the pairs, timeframes, and market conditions you trade most.
🚀 Why it’s different
Classic Wolfe waves are rare — this script adapts the model into something practical and tradeable in modern markets.
Liquidity-aligned — many setups align with structural sweeps of Wave 3 liquidity before driving into profit.
Entry built-in — most Wolfe scripts only draw the structure. Wolfe Wave Hunter gives you a precise entry point, SL, and projected TPs.
Backtest-friendly — you’ll quickly discover which assets respect Wolfe waves and which don’t, creating your own high-probability Wolfe watchlist.
⚠️ Limitations & Disclaimer
Not all markets respect Wolfe Waves. Some FX pairs, metals, and indices respect the structure beautifully; others do not. Backtest and create your own shortlist.
No guaranteed sweeps. Many entries occur after a liquidity sweep of Wave 3, but not all. The algo is designed to detect Wolfe completion, not enforce textbook liquidity rules.
Probabilistic, not predictive. Wolfe setups don’t win every time. Always use risk management.
High-RR focus. This is not a high-frequency tool. It’s designed for precision, asymmetric setups where risk is small and reward potential is large.
✅ The Bottom Line
Apex Edge – Wolfe Wave Hunter is a modern reimagination of the Wolfe Wave. It blends structural geometry, liquidity dynamics, and algo-driven execution into a single tool that:
Detects the pattern automatically
Provides SL, entry, and TP levels
Offers alerts for hands-off trading
Allows deep customisation for different markets
When it hits, it delivers outstanding risk-to-reward. Backtest, refine your tolerances, and build your watchlist of assets where Wolfe structures consistently pay.
This isn’t just Wolfe detection — it’s Wolfe trading, rebuilt for the modern trader.
Developer Notes - As always with the Apex Edge Brand, user feedback and recommendations will always be respected. Simply drop us a message with your comments and we will endeavour to address your needs in future version updates.

Candle Range Detector by TradeTech AnalysisCandle Range Detector by TradeTech Analysis
This advanced indicator identifies and visualizes price compression zones based on inside bar formations, then tracks how price behaves around those zones — offering valuable insights into liquidity sweeps, range expansions, and trap/mitigation behavior.
The script builds upon the foundational concept of range-based price action, commonly used by institutional traders, and adds automation, mitigation tracking, and sweep detection to map how price reacts around these critical ranges.
🔍 How It Works:
• Range Formation: A new range is detected when the current candle forms entirely within the high and low of the previous candle (i.e., an inside bar). This behavior often indicates price compression and potential breakout zones.
• Range Extension: Once a range is confirmed, the script projects upper and lower boundaries (using either a percentage-based multiplier or Fibonacci log extension), providing context for expected breakout zones.
• Mitigation Tracking: The script continuously monitors whether price breaks above or below the projected extensions, marking that range as mitigated — useful for confirming whether liquidity was absorbed.
• Sweep Detection: If price re-visits a mitigated zone and shows signs of a liquidity sweep (via wick + close behavior), the indicator triggers visual sweep labels and optional alerts.
🧠 Optional Visual Enhancements:
• Highlight range-forming candles with light blue background (toggle on/off)
• Midpoint dotted line for symmetry analysis
• Labels for “Range High” and “Range Low” for visual clarity
• Dynamic box drawing that adapts upon mitigation or continuation
⚙️ Customizable Features:
• Choose between Normal and Fibonacci-based detection modes
• Toggle visibility of range boxes, extension lines, and sweep markers
• Configure sweep alerts, mitigation window size, and visual transparency
⸻
🧪 Use Cases
• Identify consolidation zones before major price moves
• Confirm liquidity sweeps for entry/exit traps
• Visualize and test mitigation behavior of past zones
• Combine with Order Flow or Volume Profile tools to enhance context
⸻
⚠️ This is a fully original implementation that goes beyond classical inside-bar scanners by incorporating mitigation, extension projection, and liquidity sweeps — making it a powerful tool for intraday, swing, and even Smart Money-based trading setups.

ICT Macro Zone Boxes w/ Individual H/L Tracking v3.1ICT Macro Zones (Grey Box Version
This indicator dynamically highlights key intraday time-based macro sessions using a clean, minimalistic grey box overlay, helping traders align with institutional trading cycles. Inspired by ICT (Inner Circle Trader) concepts, it tracks real-time highs and lows for each session and optionally extends the zone box after the session ends — making it a precision tool for intraday setups, order flow analysis, and macro-level liquidity sweeps.
### 🔍 **What It Does**
- Plots **six predefined macro sessions** used in Smart Money Concepts:
- AM Macro (09:50–10:10)
- London Close (10:50–11:10)
- Lunch Macro (11:30–13:30)
- PM Macro (14:50–15:10)
- London SB (03:00–04:00)
- PM SB (15:00–16:00)
- Each zone:
- **Tracks high and low dynamically** throughout the session.
- **Draws a consistent grey shaded box** to visualize price boundaries.
- **Displays a label** at the first bar of the session (optional).
- **Optionally extends** the box to the right after the session closes.
### 🧠 **How It Works**
- Uses Pine Script arrays to define each session’s time window, label, and color.
- Detects session entry using `time()` within a New York timezone context.
- High/Low values are updated per bar inside the session window.
- Once a session ends, the box is optionally closed and fixed in place.
- All visual zones use a standardized grey tone for clarity and consistency across charts.
### 🛠️ **Settings**
- **Shade Zone High→Low:** Enable/disable the grey macro box.
- **Extend Box After Session:** Keep the zone visible after it ends.
- **Show Entry Label:** Display a label at the start of each session.
### 🎯 **Why This Script is Unique**
Unlike basic session markers or colored backgrounds, this tool:
- Focuses on **macro moments of liquidity and reversal**, not just open/close times.
- Uses **per-session logic** to individually track price behavior inside key time windows.
- Supports **real-time high/low tracking and clean zone drawing**, ideal for Smart Money and ICT-style strategies.
Perfect — based on your list, here's a **bundle-style description** that not only explains the function of each script but also shows how they **work together** in a Smart Money/ICT workflow. This kind of cross-script explanation is exactly what TradingView wants to see to justify closed-source mashups or interdependent tools.
---
📚 ICT SMC Toolkit — Script Integration Guide
This set of advanced Smart Money Concept (SMC) tools is designed for traders who follow ICT-based methodologies, combining liquidity theory, time-based precision, and engineered confluences for high-probability trades. Each indicator is optimized to work both independently and synergistically, forming a comprehensive trading framework.
---
First FVG Custom Time Range
**Purpose:**
Plots the **first Fair Value Gap (FVG)** that appears within a defined session (e.g., NY Kill Zone, Custom range). Includes optional retest alerts.
**Best Used With:**
- Use with **ICT Macro Zones (Grey Box Version)** to isolate FVGs during high-probability times like AM Macro or PM SB.
- Combine with **Liquidity Levels** to assess whether FVGs form near swing points or liquidity voids.
---
ICT SMC Liquidity Grabs and OB s
**Purpose:**
Detects **liquidity grabs** (stop hunts above/below swing highs/lows) and **bullish/bearish order blocks**. Includes optional Fibonacci OTE levels for sniper entries.
**Best Used With:**
- Use with **ICT Turtle Soup (Reversal)** for confirmation after a liquidity grab.
- Combine with **Macro Zones** to catch order blocks forming inside timed macro windows.
- Match with **Smart Swing Levels** to confirm structure breaks before entry.
ICT SMC Liquidity Levels (Smart Swing Lows)
**Purpose:**
Automatically marks swing highs/lows based on user-defined lookbacks. Tracks whether those levels have been breached or respected.
**Best Used With:**
- Combine with **Turtle Soup** to detect if a swing level was swept, then reversed.
- Use with **Liquidity Grabs** to confirm a grab occurred at a meaningful structural point.
- Align with **Macro Zones** to understand when liquidity events occur within macro session timing.
ICT Turtle Soup (Liquidity Reversal)
**Purpose:**
Implements the classic ICT Turtle Soup model. Looks for swing failure and quick reversals after a liquidity sweep — ideal for catching traps.
Best Used With:
- Confirm with **Liquidity Grabs + OBs** to identify institutional activity at the reversal point.
- Use **Liquidity Levels** to ensure the reversal is happening at valid previous swing highs/lows.
- Amplify probability when pattern appears during **Macro Zones** or near the **First FVG**.
ICT Turtle Soup Ultimate V2
**Purpose:**
An enhanced, multi-layer version of the Turtle Soup setup that includes built-in liquidity checks, OTE levels, structure validation, and customizable visual output.
**Best Used With:**
- Use as an **entry signal generator** when other indicators (e.g., OBs, liquidity grabs) are aligned.
- Pair with **Macro Zones** for high-precision timing.
- Combine with **First FVG** to anticipate price rebalancing before explosive moves.
---
## 🧠 Workflow Example:
1. **Start with Macro Zones** to focus only on institutional trading windows.
2. Look for **Liquidity Grabs or Swing Sweeps** around key highs/lows.
3. Check for a **Turtle Soup Reversal** or **Order Block Reaction** near that level.
4. Confirm confluence with a **Fair Value Gap**.
5. Execute using the **OTE level** from the Liquidity Grabs + OB script.
---
Let me know which script you want to publish first — I’ll tailor its **individual TradingView description** and flag its ideal **“Best Used With” partners** to help users see the value in your ecosystem.

Scalping trading system based on 4 ema linesScalping Trading System Based on 4 EMA Lines
Overview:
This is a scalping trading strategy built on signals from 4 EMA moving averages: EMA(8), EMA(12), EMA(24) and EMA(72).
Conditions:
- Time frame: H1 (1 hour).
- Trading assets: Applicable to major currency pairs with high volatility
- Risk management: Use a maximum of 1-2% of capital for each transaction. The order holding time can be from a few hours to a few days, depending on the price fluctuation amplitude.
Trading rules:
Determine the main trend:
Uptrend: EMA(8), EMA(12) and EMA(24) are above EMA(72).
Downtrend: EMA(8), EMA(12) and EMA(24) are below EMA(72).
Trade in the direction of the main trend** (buy in an uptrend and sell in a downtrend).
Entry conditions:
- Only trade in a clearly trending market.
Uptrend:
- Wait for the price to correct to the EMA(24).
- Enter a buy order when the price closes above the EMA(24).
- Place a stop loss below the bottom of the EMA(24) candle that has just been swept.
Downtrend:
- Wait for the price to correct to the EMA(24).
- Enter a sell order when the price closes below the EMA(24).
- Place a stop loss above the top of the EMA(24) candle that has just been swept.
Take profit and order management:
- Take profit when the price moves 20 to 40 pips in the direction of the trade.
Use Trailing Stop to optimize profits instead of setting a fixed Take Profit.
Note:
- Do not trade within 30 minutes before and after the announcement of important economic news, as the price may fluctuate abnormally.
Additional filters:
To increase the success rate and reduce noise, this strategy uses additional conditions:
1. The price is calculated only when the candle closes (no repaint).
2. When sweeping through EMA(24), the price needs to close above EMA(24).
3. The closing price must be higher than 50% of the candle's length.
4. **The bottom of the candle sweeping through EMA(24) must be lower than the bottom of the previous candle (liquidity sweep).
---
Alert function:
When the EMA(24) sweep conditions are met, the system will trigger an alert if you have set it up.
- Entry point: The closing price of the candle sweeping through EMA(24).
- Stop Loss:
- Buy Order: Place at the bottom of the sweep candle.
- Sell Order: Place at the top of the sweep candle.
---
Note:
This strategy is designed to help traders identify profitable trading opportunities based on trends. However, no strategy is 100% guaranteed to be successful. Please test it thoroughly on a demo account before using it.

Mean Reversion Indictor, Based on Standard Deviations Description:
The Reversal Candle Mean Reversion Indicator is designed for traders seeking to identify potential reversal points in the market based on key price action and volatility. This indicator combines price action analysis (sweeping prior highs or lows) with mean reversion theory, highlighting opportunities where the price tests or touches a moving average's standard deviation bands.
By focusing on these moments of price extremes, the indicator helps traders spot bullish and bearish reversal signals when the price retraces from volatile movements. These conditions often signal a return to the mean—an ideal setup for reversal traders who thrive on fading exaggerated price moves.
How It Works:
1. Price Action Reversal Signal:
* Bullish Reversal: The indicator flags a bullish signal when the current candle's low sweeps the prior candle's low, and the candle closes higher than the prior candle's close.
* Bearish Reversal: The indicator flags a bearish signal when the current candle's high sweeps the prior candle's high, and the candle closes lower than the prior candle's close.
2. Mean Reversion Confirmation:
* Mean Reversion Signal is triggered when the price touches or tests the upper or lower bands, calculated using a user-selected moving average (SMA, EMA, WMA, VWMA, or Hull MA) and standard deviation.
* The indicator combines price action and volatility, providing stronger reversal signals when the price reaches an extreme distance from the moving average.
3. Customization Options:
* Moving Average Type: Choose from SMA, EMA, WMA, VWMA, or Hull MA.
* Moving Average Length: Adjust the length of the moving average (default: 20).
* Standard Deviation Multiplier: Set the number of standard deviations for the volatility bands (default: 2.0).
* Custom Candle Colors: Choose custom colors for bullish and bearish reversal candles to easily spot signals.
How to Use for Trading Reversals:
1. Identify Extremes:
* Watch for candles where the price tests or touches the standard deviation bands. These are key moments when the price has moved significantly from the moving average, indicating a potential overbought or oversold condition.
2. Look for Reversals:
* When the price tests a band and simultaneously forms a bullish reversal pattern (sweeping the prior low and closing higher), it signals a potential mean reversion to the upside.
* When the price tests a band and forms a bearish reversal pattern (sweeping the prior high and closing lower), it signals a potential mean reversion to the downside.
3. Entry Points:
* Long Trades: Enter a long trade after a bullish signal appears (green candle) near the lower band, indicating a likely price reversal back towards the mean.
* Short Trades: Enter a short trade after a bearish signal appears (red candle) near the upper band, indicating a likely price pullback.
4. Exit Strategy:
* Set a profit target at the moving average (the mean) or a specific price level based on your strategy.
* Consider using a trailing stop to capture additional profit in case of a stronger reversal beyond the mean.
5. Risk Management:
* Place stops just below the low of the bullish reversal candle or just above the high of the bearish reversal candle to manage risk efficiently.

Witch-Fire ALMA signals: Dynamic Liquidity & Trend GlowThe Witch-Fire ALMA is a high-precision trend bias and liquidity mapping tool designed for price action traders and Smart Money practitioners. Unlike traditional indicators that clutter your chart with lagging signals, this script provides a "clean-yet-powerful" visual anchor to help you stay on the right side of the market while identifying key Points of Interest (POIs).
At its core, the script utilizes an optimized Arnaud Legoux Moving Average (ALMA). Known for its superior ability to balance smoothness and responsiveness, the ALMA effectively filters out market noise and "whipsaws" that often plague standard EMAs.
Key Features:
The Witch-Fire Glow: A neon-styled ALMA line that shifts between Bullish Green and Bearish Red. The white core provides surgical precision for price intersection, while the outer glow visualizes the strength and dominance of the current trend.
Scaled Liquidity Levels: Automatically maps Buy Side Liquidity (BSL) and Sell Side Liquidity (SSL). These levels are dynamic—they scale proportionally with your ALMA settings. This ensures that the liquidity zones you see are always relevant to the trend cycle you are analyzing.
Strategic Bias Background: A subtle background tint provides an instant psychological filter. Only look for Longs in the green zone and Shorts in the red zone to maintain a high-probability strike rate.
How to Trade with Witch-Fire:
Identify the Bias: Look at the Fire ALMA. If the "fire" is red and the price is below the line, your bias is strictly bearish.
Watch the Sweeps: Wait for the price to "sweep" (pierce with a wick) the horizontal SSL (Green) or BSL (Red) lines.
Execution: Look for a strong rejection candle (long wick, small body) at these levels that closes back towards the ALMA line.
Best Used On: 15m, 1H, and 4H timeframes. Works exceptionally well for Crypto, Forex, and Indices.

Cnagda Liquidit Trading SystemCnagda Liquidit Trading System helps spot where price is likely to trap traders and reverse, then gives simple, actionable Level to entry, place SL, and take profits with confidence. It blends imbalance zones, trend bias, order blocks, liquidity pools, high-probability fake Signal, and context-aware candle patterns into one clean workflow.
🟩🟥 Imbalance boxes: “Crowd rushed, gaps left”
What it is: Green/red boxes mark fast, one-sided moves where price “skipped” orders—think FVG-like zones that often get revisited.
Why it helps: Price frequently pulls back to “fill” these zones, creating clean retest entries with logical stops.
⏩How to use:
Green box = potential demand retest; Red box = potential supply retest. Enter on pullback into box, not on first impulse. Put stop on far side of box and aim first targets at recent swing points.
↕️ Swing bias (HH/HL vs LH/LL): “Which way is the road?”
What it is: Higher-highs/higher-lows = up-bias; Lower-highs/lower-lows = down-bias. system plots Buy/Sell OB levels aligned with that bias.
Why it helps: Trading with the broader flow reduces “hero trades” against institutions. Bias gives clearer entries and cleaner drawdowns.
⏩How to use:
Up-bias: look for long on Buy OB retests. Down-bias: look for short on Sell OB retests. Wait for a small rejection/engulfing to confirm before triggering.
🧱Order blocks: “Where big players remember”
What it is: last opposite-colored candle before an impulsive move—these zones often hold memory and reaction. system plots these as Buy/Sell OB lines.
Why it helps: Many breakouts pull back to the origin. Good entries often happen on retest, not on the breakout chase.
⏩ How to use:
Let price return into the OB, show wick rejection, and decent volume. Enter with stop beyond OB; define risk-reward before entry.
📊Volume coloring: “How Volume is move?”
What it is: Bar color reflects relative volume; inside bars are black. The dashboard also shows Volume and “Volume vs Prev.”
Why it helps: Patterns without volume often fade; volume validates strength and intent of moves.
⏩ How to use:
Favor entries where imbalance/OB/liquidity-grab coincide with higher volume. If volume is weak, reduce size or skip.
🧲 BSL/SSL liquidity pools: “Fishing for stops”
What it is: Equal highs cluster stops above (BSL); equal lows cluster stops below (SSL). system plots these and highlights the nearest one (“magnet”).
Why it helps: Price often sweeps these pools to trigger stops before reversing. This is a prime trap-reversal location.
⏩ How to use:
Watch nearest BSL/SSL. If price wicks through and closes back inside, anticipate a reversal. Trade reaction, not first poke. When price closes beyond, consider that pool mitigated and move on.
🟢🔴 Advanced liquidity grab: “Catch fakeout”
What it is: Bullish grab = makes a new low beyond a prior low but closes back above it, with a long lower wick, small body, and higher volume. Bearish is mirror. Labeled automatically.
Why it helps: It exposes trap moves (stop hunts) and often precedes true direction.
⏩ How to use:
Best when it aligns with a nearby imbalance/OB and supportive volume. Enter on reversal candle break or on retest. Stop goes beyond sweep wick.
🧠 Smart candlestick patterns (only in right place)
What it is: Engulfing, Hammer, Shooting Star, Hanging Man, Doji (with high volume), Morning/Evening Star, Piercing—but marked “effective” only if context (swing/trend/location) agrees.
Why it helps: same pattern in the wrong place is noise; in the right place, it’s signal.
⏩ How to use:
Location first (BSL/SSL/OB/imbalance), then pattern. Treat pattern as trigger/confirmation—one fresh label shows to keep chart clean.
🧭 Dashboard: “Context in a glance”
⏩ Reversal Level: current swing anchor—expect turns or reactions nearby; great for alerts and planning.
⏩ Volume vs Prev + Volume: Strength meter for signal candle—higher adds conviction.
⏩ Nearest Pool: next “magnet” area—look for sweeps/rejections there.
🧩Step-by-step trading flow (with mindset)
⏩ Set bias: HH/HL = long bias, LH/LL = short bias. Counter-trend only on clean sweeps with strong confirmation.
⏩ Find magnet: Check Nearest Pool (BSL/SSL). Focus attention there; it saves screen time.
⏩ Wait for event: Look for a sweep/grab label, or sharp rejection at pool/OB/imbalance. Avoid FOMO.
⏩ Add confluence: Stack 2–3 of these—imbalance box, OB, contextual pattern, supportive volume.
⏩Plan entry: Bullish: trigger above reversal candle high or take retest of FVG/OB. Stop below sweep wick/zone. Target at least 1:1.5–1:2.
Bearish: mirror above.
⏩Manage smartly: Take partials, move to breakeven or trail thoughtfully. Don’t drag stops inside zone out of emotion.
🎛️ Parameter tuning (to reduce human error)
⏩ swingLen: Smaller = faster but noisier; larger = cleaner but slower. Backtest first, then go live.
⏩ Tolerance (ATR or percent): ATR tolerance adapts to volatility (good for fast markets and lower TFs). Start around 0.15–0.30. In calm markets, try percent 0.05–0.15%.
⏩ minBarsGap: Start with 3–5 so equal highs/lows are truly equal—reduces false pools.
❌Common mistakes → ✅ Better habits
⏩Chasing every breakout → Wait for sweep/rejection, then confirm.
⏩Ignoring volume → Validate strength; cut size or skip on weak volume.
⏩Losing history of pools → If reviewing/backtesting, keep mitigated pools visible (dashed/faded).
⏩Over-tight tolerance/too small swingLen → Increases false signals; backtest to find balance.
📝 checklist (before entry)
⏩ Is there a nearby BSL/SSL and did a sweep/grab happen there?
⏩ Is there a close imbalance/OB that price can retest?
⏩ Do we have an effective pattern plus supportive volume?
⏩Is the stop beyond the wick/zone and RR ≥ 1:1.5?
•?((¯°·._.• 🎀 𝐻𝒶𝓅𝓅𝓎 𝒯𝓇𝒶𝒹𝒾𝓃𝑔 🎀 •._.·°¯((?•

Fractal Suite: MTF Fractals + BOS/CHOCH + OB + FVG + Targets Kese Way
Fractals (Multi-Timeframe): Automatically detects both current-timeframe and higher-timeframe Bill Williams fractals, with customizable left/right bar settings.
Break of Structure (BOS) & CHoCH: Marks structural breaks and changes of character in real time.
Liquidity Sweeps: Identifies sweep patterns where price takes out a previous swing high/low but closes back within range.
Order Blocks (OB): Highlights the last opposite candle before a BOS, with customizable extension bars.
Fair Value Gaps (FVG): Finds 3-bar inefficiencies with a minimum size filter.
Confluence Zones: Optionally require OB–FVG overlap for high-probability setups.
Entry, Stop, and Targets: Automatically calculates entry price, stop loss, and up to three take-profit targets based on risk-reward ratios.
Visual Dashboard: Mini on-chart table summarizing structure, last swing points, and settings.
Alerts: Set alerts for new fractals, BOS events, and confluence-based trade setups.

Liquidations Levels [RunRox]📈 Liquidation Levels is an indicator designed to visualize key price levels on the chart, highlighting potential reversal points where liquidity may trigger significant price movements.
Liquidity is essential in trading - price action consistently moves from one liquidity area to another. We’ve created this free indicator to help traders easily identify and visualize these liquidity zones on their charts.
📌 HOW IT WORKS
The indicator works by marking visible highs and lows, points widely recognized by traders. Because many traders commonly place their stop-loss orders beyond these visible extremes, significant liquidity accumulates behind these points. By analyzing trading volume and visible extremes, the indicator estimates areas where clusters of stop-loss orders (liquidity pools) are likely positioned, giving traders valuable insights into potential market moves.
As shown in the screenshot above, the price aggressively moved toward Sell-Side liquidity. After sweeping this liquidity level for the second time, it reversed and began targeting Buy-Side liquidity. This clearly demonstrates how price moves from one liquidity pool to another, continually seeking out liquidity to fuel its next directional move.
As shown in the screenshot, price levels with fewer anticipated trader stop-losses are indicated by less vibrant, faded colors. When the lines become more saturated and vivid, it signals that sufficient liquidity - in the form of clustered stop-losses has accumulated, potentially attracting price movement toward these areas.
⚙️ SETTINGS
🔹 Period – Increasing this setting makes the marked highs and lows more significant, filtering out minor price swings.
🔹 Low Volume – Select the color displayed for low-liquidity levels.
🔹 High Volume – Select the color displayed for high-liquidity levels.
🔹 Levels to Display – Choose between 1 and 15 nearest liquidity levels to be shown on the chart.
🔹 Volume Sensitivity – Adjust the sensitivity of the indicator to volume data on the chart.
🔹 Show Volume – Enable or disable the display of volume values next to each liquidity level.
🔹 Max Age – Limits displayed liquidity levels to those not older than the specified number of bars.
✅ HOW TO USE
One method of using this indicator is demonstrated in the screenshot above.
Price reached a high-liquidity level and showed an initial reaction. We then waited for a second confirmation - a liquidity sweep followed by a clear market structure break - to enter the trade.
Our target is set at the liquidity accumulated below, with the stop-loss placed behind the manipulation high responsible for the liquidity sweep.
By following this approach, you can effectively identify trading opportunities using this indicator.
🔶 We’ve made every effort to create an indicator that’s as simple and user-friendly as possible. We’ll continue to improve and enhance it based on your feedback and suggestions in the future.

Liquidity Trend Horizon [Pineify]Pineify - Liquidity Trend Horizon
The Liquidity Trend Horizon is a sophisticated trend-following indicator designed to identify potential liquidity sweep zones while providing clear visual trend direction. It combines adaptive volatility bands with smart liquidity detection to help traders spot high-probability reversal points where institutional activity may be occurring.
Key Features
Dynamic trend baseline using WMA and EMA smoothing
ATR-based volatility bands that adapt to market conditions
Automatic liquidity sweep detection with visual alerts
Gradient-filled channels for intuitive trend visualization
Real-time candle coloring based on trend direction
How It Works
The indicator calculates a weighted moving average (WMA) of the closing price, then applies exponential smoothing (EMA) to create a responsive yet stable baseline. This dual-smoothing approach filters out market noise while maintaining sensitivity to genuine trend changes.
Volatility bands are constructed using a 200-period Average True Range (ATR) multiplied by a user-defined factor. This creates dynamic support and resistance zones that automatically widen during volatile periods and contract during consolidation.
How Multiple Indicators Work Together
The synergy between WMA, EMA, and ATR creates a comprehensive trend analysis system:
The WMA provides the initial trend estimation with emphasis on recent price action
The EMA layer adds smoothness to reduce false signals
The ATR bands define probabilistic boundaries where price is likely to find support or resistance
Trading Ideas and Insights
Liquidity sweeps occur when price wicks beyond the volatility bands but closes back within the channel. These events often indicate:
Stop-loss hunting by larger market participants
False breakouts that may lead to reversals
Areas of accumulated liquidity being absorbed
A bullish sweep (wick below lower band, close above) suggests potential buying opportunity. A bearish sweep (wick above upper band, close below) may signal selling pressure.
Unique Aspects
Unlike traditional channel indicators, the Liquidity Trend Horizon specifically identifies sweep events where price temporarily breaks boundaries before reverting. This behavior is commonly associated with institutional order flow and smart money concepts.
How to Use
Observe the baseline color for overall trend direction (cyan for bullish, purple for bearish)
Watch for sweep markers (🚀 BULL / 📉 BEAR) at band extremes
Use background flashes as immediate alerts for sweep events
Consider entries when sweeps align with the prevailing trend direction
Customization
Trend Period - Adjust baseline sensitivity (default: 24)
Channel Width Multiplier - Control band distance from baseline (default: 2.0)
Smoothness - Fine-tune signal responsiveness (default: 5)
Color Settings - Personalize bullish/bearish colors and transparency
Conclusion
The Liquidity Trend Horizon bridges technical analysis with liquidity concepts, offering traders a unique perspective on market structure. By highlighting potential sweep zones within an adaptive trend framework, it helps identify areas where reversals are statistically more likely to occur.
