Macros+AMD [NW]Macros + AMD - Daily & Weekly Time-Based Analysis
Multi-timeframe AMD (Accumulation, Manipulation, Distribution) visualization with ICT Macro timing windows for time-based market analysis.
Overview
This indicator visualizes the AMD (Accumulation, Manipulation, Distribution) framework on both daily and weekly timeframes, combined with ICT Macro timing windows. It is designed as an educational tool to help traders study time-based market structure and algorithmic price delivery concepts.
The AMD model is based on the idea that markets move through distinct phases within each trading period:
Accumulation (A) - Initial range formation, liquidity building
Manipulation (M) - False moves to trap traders, liquidity sweeps
Distribution (D) - True directional move, price delivery to targets
What This Indicator Displays
Daily AMD Phases
Displays the intraday AMD cycle based on New York trading hours:
A Phase (Blue): 4:00 AM - 8:35 AM EST — Morning accumulation, Asian/London overlap
M Phase (Red): 8:35 AM - 11:25 AM EST — NY session manipulation, news events
D Phase (Green): 11:25 AM - 4:00 PM EST — Afternoon distribution and price delivery
Weekly AMD Phases
Displays the weekly AMD cycle from Monday to Monday:
A Phase: Monday 00:00 - Tuesday 21:56 EST — Weekly high/low formation begins
M Phase: Tuesday 21:56 - Thursday 02:04 EST — Mid-week reversal zone
D Phase: Thursday 02:04 - Monday 00:00 EST — Weekly price delivery
Inner M Phase Fibs
When enabled, subdivides the M (Manipulation) phase using Fibonacci levels:
0.382 level — Inner accumulation ends
0.500 level — Mid-point of manipulation
0.618 level — Inner distribution begins
This helps identify potential reversal points within the manipulation phase.
ICT Macro Windows
Horizontal lines marking the XX:42 to XX:15 macro periods (33-minute windows):
2:42 - 3:15 AM
3:42 - 4:15 AM (London)
7:42 - 8:15 AM
8:42 - 9:15 AM
9:42 - 10:15 AM (Prime AM session)
10:42 - 11:15 AM
11:42 - 12:15 PM
12:42 - 1:15 PM
1:42 - 2:15 PM
2:42 - 3:15 PM
These windows represent times when algorithmic price delivery is more likely to occur.
How To Use
Understanding the AMD Framework
During the A Phase:
Observe range formation and initial liquidity pools
Note the high and low established during this phase
Wait for manipulation before committing to direction
During the M Phase:
Watch for false breakouts and stop hunts
Look for reversal patterns after liquidity sweeps
The inner fibs (0.382, 0.5, 0.618) can help time entries within this phase
Mid-week (Wednesday) often sees key reversals on weekly AMD
During the D Phase:
This is typically when the true move occurs
Price tends to deliver toward draw on liquidity targets
The direction is often opposite to the manipulation move
Using the Macro Windows
The XX:42 to XX:15 windows are times to pay attention to price action:
These 33-minute periods often see increased algorithmic activity
Look for displacement, fair value gaps, or order blocks forming
The 9:42-10:15 AM window is considered particularly significant for NY session
Weekly Day Labels
Monday/Tuesday: "H/L of Week" — Watch for weekly high or low formation
Wednesday: "Reversal Day" — Mid-week reversal probability increases
Thursday/Friday: "Reversal Day" — Continuation or secondary reversal
Settings Guide
Main Settings
Timezone: Set to your broker's timezone or preferred timezone
Macros On Top: Toggle macro lines above or below AMD boxes
Show All Text Labels: Master toggle for all text (turn off for clean charts on HTF)
Daily/Weekly AMD
Show: Enable/disable the AMD visualization
Opacity: Adjust transparency of the phase boxes (higher = more transparent)
AMD Colors
Customize colors for each phase (A, M, D)
Default: Blue (A), Red (M), Green (D)
Inner M Style
Customize the inner M phase fib lines and text colors
Default: Black lines for clean visibility
Macro Settings
Adjust macro line color and thickness
Toggle individual macro windows on/off
Important Notes
This indicator is for educational purposes and time-based analysis
It does not provide buy/sell signals
Always use in conjunction with proper price action analysis
Past price behavior during these time windows does not guarantee future results
The AMD framework is one lens for viewing market structure — use it as part of a complete methodology
Credits
This indicator is based on concepts taught by ICT (Inner Circle Trader) and the broader Smart Money Concepts community. The AMD framework, macro timing windows, and weekly profile concepts are derived from this educational methodology.
Timeframe Recommendations
Best viewed on 1-minute to 15-minute charts
Text labels automatically hide on 9-minute and higher timeframes for cleaner visualization
Indicator hides completely on 1-hour and higher timeframes
Changelog
v1.0 - Initial release
Daily AMD phases (4am-4pm EST)
Weekly AMD phases (Monday-Monday)
Inner M phase Fibonacci subdivisions
10 ICT Macro timing windows
Full customization options
Automatic 9-day cleanup
Cari skrip untuk "sweep"

Prime-Time × Vortex (3/6/9) — Ace (clean v3)1️⃣ Prime-Time Index (PT)
A bar becomes Prime-Time when the count satisfies the formula:
4·n − 3 is a perfect square
This generates the sequence:
1, 3, 7, 13, 21, 31, 43, 57, 73, 91, …
These are time windows where price is more likely to form:
Shifts in market structure
Impulses
Reversals
Liquidity expansions
These PT bars are drawn as small circles above the candle.
If labels are enabled, the counter value (n) is also shown.
2️⃣ Vortex 3/6/9 Digital-Root Timing
Every bar also has a digital root, calculated from the counter:
If n → digitalRoot(n) = 3, 6, or 9,
the bar is considered a Vortex bar.
These moments often align with:
Swing highs / swing lows
Micro shifts
Mini-reversals
Minor liquidity grabs
When a Prime-Time bar is also a 3/6/9 bar → high-probability timing.
These bars are highlighted in green by default.
3️⃣ Filters & Display
You can customize:
Anchor time → when counting begins
Reset daily → restart counter each new trading day
Show only 3/6/9 → hides normal PT hits
Label offset → distance above the candle
Color themes
This makes the indicator usable on:
1Min
5Min
15Min
1H
Any timeframe you want
4️⃣ How To Apply It in Trading
Use it as a time confluence tool, not a signal generator.
✔ Best ways to use:
Look for MSS, sweeps, OB retests, FVG reactions when
they occur on or near a Prime-Time or 3/6/9 bar
Expect volatility increases after PT bars
Use 3/6/9 hits to anticipate internal turning points
Combine with:
Session High/Low
Killzones (London, NYO, PM)
Purge Protocol
MMXM Execution
✔ Example:
If price sweeps a level and prints a 3/6/9 vortex bar inside a PT window →
you have a very strong timing alignment for reversal.
5️⃣ Simple Summary
Feature Meaning
Prime-Time Hit (PT) Major time window where price often shifts
3/6/9 Vortex Bar Micro-timing for internal swings
PT + 3/6/9 together High-probability timing for entries
Reset Daily Perfect for intraday models like NYO & London
Anchor Time Defines the entire cycle structure

SCOB Pattern with ERC & AlertsSingle Candle Block (SC0B) consists of a single candle appearing at a significant price level, indicating a confirmed reversal in price direction from that particular area of interest.
SCOB is primarily used to confirm and execute trades.
Using a single candle block to enter a trade minimizes risk and maximizes reward.
Single bullish candle block?
1st candle closes at bullish point of interest with a short or long wick.
2nd candle sweeps the low of previous(1st) candle and closes above the low of previous candle.
3rd candle closes above the high of 2nd candle.
How to trade with Scob bullish.
To Trade using Bullish SCOB you have to wait for price to come down and test the single candle order block.
When price tests the SCOB you can directly execute a buy trade or for a precise entry you can wait for a market structure shift in lower time frame.
Scob discount is the opposite of price increase.
This strategy should only be used when price "sweeps through key lever, liquidity, imbalance, poi htf areas.
This indicator will add a filter to help you reduce signal noise.
Use the "Use engulfing candle to test" function to filter the 3rd candle.
Only search for Scob if the 3rd candle is an Engulfing candle.
The logic for finding Engulfing candles can be changed based on the "% maximum wick length" option. The default is that the candle wick is 25% of the total candle wick length.
You can also use the alert function when Scob appears
With Smart money concept, no strategy is perfect in trading, so you should not risk too much of your capital on this strategy.
To be safer, always remember to use stop loss for every trade.

3 day look backThis script is designed to help traders visually compare daily liquidity behavior between two correlated assets — for example, the Nasdaq (NQ) and the S&P500 (ES).
It plots each day’s High and Low, aligned from Midnight to Midnight, with a clean session structure. This makes it easier to identify:
SMT (Smart Money Technique) divergences
liquidity grabs
daily highs/lows sweeps
relative strength/weakness between assets
intraday bias shifts based on daily structure
What the script does
Reconstructs each trading day from 00:00 to 00:00, regardless of session irregularities.
Plots the High and Low of every completed day.
Allows users to display as many past days as they want (custom “look-back” parameter).
Automatically merges the weekend with Friday for assets where Saturday/Sunday sessions are fragmented.
Includes a manual midnight offset (–12h to +12h) to fix timezone inconsistencies on TradingView charts (common on futures).
Optional real-time lines for the current day.
No excessive right-side extensions for clean intraday reading.
Why this is useful
When comparing paired assets (e.g., NQ vs ES), liquidity behavior is often different.
This script makes it easy to spot:
when one asset makes a new daily high while the other doesn’t
asymmetrical liquidity sweeps
SMT-based divergence setups
liquidity grabs at daily levels
intraday directional bias shifts
About the other indicators shown on the chart
In the example chart, two additional indicators are used only for clarity and structure:
Day of the Week — displays the weekday on each session for easier orientation.
Vertical Line Timeline — draws a clean separator line between days.
These indicators are not required for this High/Low script to work.
They simply help visually organize sessions and make daily structure easier to read when comparing two assets side by side.
How to use
Open two assets (e.g., NQ1! and ES1!) side by side.
Apply this script on both charts.
Set the same timeframe.
Choose how many days back you want to visualize (look-back parameter).
Observe how each asset interacts with its daily High/Low.
Look for SMT divergences and liquidity-based setups.
Main features
Midnight-to-Midnight alignment
Weekend fusion
Manual offset for perfect timing
Adjustable daily look-back
Clean daily liquidity
Optional dynamic daily levels
Ideal for SMT/liquidity-based intraday trading

Volume-Confirmed FTR Zones [AlgoPoint]FTR Zone Indicator — Fail To Return Zones (With Volume Confirmation)
Advanced Smart Money Zone Detection for Institutional Orderflow
The FTR Zone Indicator is a professional-grade tool designed for traders who follow Smart Money Concepts (SMC), ICT methodologies, or institutional orderflow. It automatically detects Fail To Return Zones (FTR) — high-probability supply and demand areas formed after strong displacement moves.
By combining impulse detection, base identification, and volume confirmation, this indicator highlights zones where price is most likely to react, reverse, or mitigate shortly after structure breaks.
⸻
⭐ What Are FTR Zones?
FTR zones (Fail To Return zones) are price areas where:
1. A strong displacement / impulse candle is formed
2. That impulse originates from a small consolidation (base)
3. Price moves away aggressively
4. AND fails to return immediately to the origin area
These zones often indicate:
• Institutional orders
• Imbalance
• Hidden liquidity
• Origin of a trend leg
• High-probability mitigation points
This indicator fully automates the detection and visualization of such areas.
🔍 How the Indicator Works
1. Impulse Detection
The indicator identifies a valid impulse candle using:
• ATR-based bar range filter
• Trend-aligned candle body direction
• Optional volume confirmation
Only large, meaningful institutional candles qualify — filtering out noise.
2. Base Zone Identification
Before every impulse, the tool finds the micro-consolidation base using:
• Highest high of the last X bars
• Lowest low of the last X bars
This base becomes the potential FTR zone.
3. FTR Zone Creation
When a valid impulse is detected:
• Bullish impulse → Demand FTR zone
• Bearish impulse → Supply FTR zone
The zone is immediately drawn on the chart using box.new().
4. Zone Extension
Every zone continuously extends to the right as price evolves, allowing you to track:
• Mitigation
• Retests
• Reaction points
• Liquidity sweeps
5. Invalidation Logic
Zones automatically delete when violated:
• Demand zone invalid if close < zone low
• Supply zone invalid if close > zone high
This keeps the chart clean and helps focus only on active, high-value areas.
🎛️ Key Features
✔ Automatic FTR Zone Detection
Instantly identifies institutional origin zones based on real impulse and displacement.
✔ Volume-Based Filtering
Ensures only high-volume impulses (true institutional orders) create zones.
✔ Supply & Demand Coloring
• Bullish FTR → Demand Zone (Teal tone)
• Bearish FTR → Supply Zone (Red tone)
✔ Safe Zone Storage
Fault-tolerant logic ensures no array errors, invalid zones, or broken visuals.
✔ Auto-Extending Boxes
Real-time zone updates with precise historical mapping.
✔ Smart Invalidation
Zone is removed only when fully broken, preventing false signals.
✔ Clean, Non-Repainting Logic
Impulse detection and zone placement are confirmed only on bar close.
📈 How to Use It (Example Schenarios)
For Reversals or Continuations
• Look for price reacting or mitigating inside a zone
• Use as entry confirmation in trend continuations
• Combine with FVG, BOS/CHOCH, liquidity sweeps, or premium/discount zones
For Scalping or Intraday Trading
• High-probability countertrend entries
• Reaction-based setups at institutional footprints
For Swing Traders
• Identify weekly/daily origin zones
• Plan entries around large displacement points

Friday & Monday HighlighterFriday & Monday Institutional Range Marker — Know Where Big Firms Set the Trap!
🧠 Description
This indicator automatically highlights Friday and Monday sessions on your chart — days when institutional players and algorithmic firms (like Citadel, Jane Street, or Tower Research) quietly shape the upcoming week’s price structure.
🔍 Why Friday & Monday matter
Friday : Large institutions often book profits or hedge into the weekend. Their final-hour moves reveal the next week’s bias.
Monday : Big players rebuild positions, absorbing liquidity left behind by retail traders.
Together, these two days define the range traps and breakout zones that often control price action until midweek.
> In short, the Friday–Monday high and low often act as invisible walls — guiding scalpers, option sellers, and swing traders alike.
🧩 What this tool does
✅ Highlights Friday (red) and Monday (green) sessions
✅ Adds optional day labels above bars
✅ Works across all timeframes (best on 15min to 1hr charts)
✅ Helps you visually identify where institutions likely built their positions
Use it to quickly spot:
* Range boundaries that trap traders
* Gap zones likely to get filled
* High–low sweeps before reversals
⚙️ Recommended Use
1. Mark Friday’s high–low → Watch for liquidity sweeps on Monday.
2. When Monday holds above Friday’s high , breakout continuation is likely.
3. When Monday fails below Friday’s low , expect a reversal or trap.
4. Combine this with OI shifts, IV crush, and FII–DII flow data for confirmation.
⚠️ Disclaimer
This indicator is for **educational and analytical purposes only**.
It does **not constitute financial advice** or a trading signal.
Markets are dynamic — always perform your own research before trading or investing.

NS ND - EVR - Daily Bias - TRFxVolume & Price Action Signals
What It Does
Combines three proven trading methodologies: Effort vs Result (EVR), No Supply/No Demand (NS/ND), and Daily Bias tracking for intraday traders.
Features
Effort vs Result (EVR)
- **Bullish**: Green triangle below bar when price sweeps previous low with high volume and significant wick
- **Bearish**: Red triangle above bar when price sweeps previous high with high volume and significant wick
- Identifies potential reversals where volume doesn't match price movement
No Supply / No Demand (NS/ND)
- **No Demand (Red dot)**: Up-candle with declining volume - buyers weakening
- **No Supply (Green dot)**: Down-candle with declining volume - sellers weakening
- Grey dots = unconfirmed, colored dots = confirmed within lookahead period
- Based on Volume Spread Analysis (VSA) principles
Daily Bias Label
Top-right corner shows market direction:
- **BULLISH ↑** - Closed above Previous Day High
- **BEARISH ↓** - Closed below Previous Day Low
- **BULLISH/BEARISH REV** - Swept level but closed back inside
- **RANGE ↔** - Trading between PDH/PDL
## Settings
- **EVR**: Toggle on/off, volume multiplier, wick %, inside bars, transparency
- **NS/ND**: Toggle on/off, lookahead bars (default: 10)
- **Daily Bias**: Toggle label display
## Best For
✓ Intraday trading (1m-1h timeframes)
✓ Reversal setups
✓ Volume analysis
✓ Confluence trading (all signals align)
How to Use
1. Enable components you want (all can be toggled independently)
2. Trade EVR signals in direction of Daily Bias
3. Look for NS/ND confirmation at key levels
4. Wait for colored dots (confirmed signals) over grey (unconfirmed)
**Note**: Works on intraday timeframes only. NS/ND signals may repaint during confirmation period.

CNagda-MomentumX - Institutional FlowMomentumX is designed to empower traders with a deeper understanding of market movements by focusing on Institutional Flow and advanced market structure analytics. The core goal is to identify and visualize where major market participants are operating, and to translate these complex footprints into clear, actionable trading signals — all in real time.
Real-time institutional activity mapping
Actionable entry and exit signals based on live market structure
Intuitive dashboard and dynamic chart visuals
Fully customizable modules for trend, liquidity, and order blocks
Core Logic Design
At the heart of MomentumX lies a robust algorithmic engine built to capture and surface institutional trading behavior. By leveraging advanced mathematical models, the indicator calculates institutional volume ratios and price momentum to pinpoint aggressive moves from large participants.
Institutional Volume & Price Momentum:
Utilizes custom volume indicators and price change analysis to detect strong buying or selling pressure, filtering out retail noise.
Liquidity Grab Detection & Activity Zones:
The script identifies liquidity grabs by monitoring abrupt price sweeps at major support/resistance levels—often where institutions trigger stop hunts or reversals. All critical activity zones are automatically color-coded on the chart for instant recognition.
Dashboard Visualization:
A fully dynamic dashboard table overlays live scores for accumulation, distribution, strength, and weakness—giving traders a real-time scan of market health.
Trendline & Order Block Architecture:
The logic auto-detects pivot highs/lows to draw smart trendlines, while the order block system highlights key reversal areas and breaker zones—making market structure clear and actionable.
MomentumX is packed with high-performance modules, each engineered to simplify complex market behavior and enhance decision-making for traders:
Institutional Flow Signals:
Instantly identifies spots where institutional players drive momentum, using unique volume and price activity analytics.
Bullish/Bearish Liquidity Grab Detection:
Marks abrupt price moves that signal stop hunts or reversals, letting traders anticipate snap-backs or trend shifts.
Trendline Auto-Detection:
Smartly draws trendlines based on significant swing highs and lows, automatically adjusting as price evolves.
Order Block System (Rejection/Breaker):
Spots and highlights key reversal zones with order block rectangles, confirming rejections or breakouts at strategic levels.
Dashboard and Bar Coloring:
A clean dashboard overlay presents live market scores, while dynamic bar coloring makes trend, strength, and high-activity periods instantly visible.
User Input Toggles for Each Module:
Every major feature is fully customizable—enable or disable modules to match individual trading setups or preferences.
Scripting/Development
MomentumX’s scripting process is modular, enabling clarity, scalability, and fast optimization throughout development:
Initialization & Inputs:
Start by defining all user input options, module toggles, color settings, and calculation parameters—ensuring maximum flexibility early on.
Core Calculation Functions:
Script advanced institutional volume and price momentum algorithms. Build out swing length logic, market state filters, and activity scoring methods.
Detection Engines:
Develop and integrate engines for liquidity grabs, automated trendline detection, and order block identification—each with dedicated functions for speed and precision.
Visual Overlays & Plotting:
Implement powerful plotting logic for colored bars, score dashboards, trendlines, reversal zones, and liquidity markers—making every data point clear and actionable on the chart.
Testing Handlers:
Add diagnostic panels and debug outputs to refine calculations and assure accuracy in every market environment.
Sample Trade Setups (Usage)
Cnagda MomentumX delivers clarity for multiple trading styles by providing timely, actionable setups grounded in institutional behavior and market structure. Here’s how traders can leverage the indicator for confident decision-making:
Liquidity Grab Reversal
Enter trades around detected liquidity grabs when price sweeps major support/resistance and the dashboard signals a momentum shift.
Example: Wait for a bullish/Bearish grab near market lows/high, with institutional flow turning positive/negative—enter long/short for potential mean reversion.
Order Block Breakout
Trade breakouts when price cleanly rejects or flips key order block zones highlighted on the chart.
Example: Short at a marked breaker block after a rejection signal, confirmed by a downward institutional activity spike.
Trendline Continuation
Ride established market moves by entering on trendline confirmations plotted by the auto-detect system.
Example: Go long after a trendline retest, confirmed by a green bar color and dashboard strength score.
Dashboard Confirmation
Combine dashboard metrics (strength, accumulation, distribution) with bar color overlays for multi-factor entries.
Example: Enter trades only when all market signals align in real time for maximum probability.
For Short Entry check -- Weakness : For Long Entry Check - Strength With Other Indications
MomentumX is not just another indicator – it’s your edge for reading the market like an insider. By transparently mapping institutional flow, uncovering hidden liquidity zones, and color-coding every major structure shift, MomentumX transforms complexity into actionable clarity. Whether you’re scalping, swing trading, or investing, you’ll gain a decisive, real-time advantage on every chart.
Embrace smarter decisions, adapt to changing market conditions instantly, and join a new generation of technically empowered traders.
Customize, observe, and let the market reveal opportunities in a way you’ve never experienced before.
Happy Trading

Effort vs Result TRFxThe Effort vs Result (EVR) indicator is designed to identify high-probability reversal signals based on volume and price action dynamics. It highlights points where the market “effort” (high volume) does not correspond to an immediate “result” (price continuation), providing actionable trade setups for both bullish and bearish scenarios.
Features:
Detects bullish EVR signals when a previous high-volume sell candle is followed by a strong bullish candle that sweeps the previous low.
Detects bearish EVR signals when a previous high-volume buy candle is followed by a strong bearish candle that sweeps the previous high.
Sticky arrows plot automatically above or below the candle, ensuring the signal moves with the price bar.
Considers inside bars, wick size, and relative volume to filter low-quality setups.
Fully compatible with multiple timeframes.
Inputs:
Volume Multiplier: Sets how much higher the current candle’s volume should be compared to the previous candle to count as high volume.
Min Wick % of Candle: Minimum wick size relative to the candle body to filter insignificant bars.
Max Inside Bars to Ignore: Number of inside bars between the previous candle and the EVR candle to ignore minor consolidations.
Usage:
(Green Arrow): Enter long when a green arrow appears below the candle. Place stop-loss slightly below the previous swing low.
(Red Arrow): Enter short when a red arrow appears above the candle. Place stop-loss slightly above the previous swing high.
Can be combined with support/resistance levels, trendlines, or other technical indicators for higher accuracy.
Benefits:
Simple and clean visual signals with tiny arrows that move with candles.
Helps traders identify high-probability reversal points based on volume and price action.
Ideal for intraday and swing trading strategies.

Valid Monthly LevelsValid Monthly Levels (No Sweeps) + Smart Labels
This tool automatically plots the highs and lows of each completed monthly candle and tracks their validity in real time. A level is considered valid until it has been swept (price trades strictly beyond that high or low). Once swept, the line and label can either be removed or dimmed depending on your settings.
Key features:
Monthly highs and lows: Each month’s range is marked with horizontal levels that extend forward.
Valid vs. swept logic: Levels are only valid until breached; swept levels can be hidden or kept as dotted/grey lines.
Smart labels: Each level is labeled with the month and year (e.g., Sep ’25 H/L). On higher timeframes, labels sit at the candle; on lower timeframes, labels automatically shift to the right edge so they don’t disappear off-screen.
Customizable appearance: Choose colors for highs, lows, and swept levels; adjust line styles; and limit how many past months are shown.
Clutter control: Cap the maximum number of labels, so your chart stays readable even on small intraday timeframes.
This indicator is useful for traders who track monthly supply/demand extremes, liquidity sweeps, and higher-timeframe context when executing on lower timeframes.

Sunset Zones by PDVDescription
Sunset Zones by PDV is an intraday reference indicator that plots key horizontal levels based on selected “root candles” throughout the trading day. At each programmed time, the indicator identifies the high and low of the corresponding candle and projects those levels forward with extended lines, providing traders with a clean visual framework of potential intraday reaction zones.
These zones serve as reference levels for support, resistance, liquidity grabs, and session context, allowing traders to analyze how price reacts around time-specific structures. Unlike lagging indicators, Sunset Zones gives traders real-time, rule-based levels tied directly to the price action of specific moments in the session.
Key Features
Predefined Time Codes
The script comes with a curated list of intraday timestamps (in HHMM format). Each represents a “root candle” from which levels are generated. Examples include 03:12, 06:47, 07:41, 08:51, etc. These time codes can reflect historically important market moments such as session opens, liquidity sweeps, or volatility inflection points.
Automatic Zone Plotting
At each root time, the script captures the candle’s high and low and instantly extends those levels forward across the chart. This provides consistent, objective reference points for intraday trading.
Extended Lines
Levels are projected far into the future (default: 500 bars) so traders can easily track how price interacts with those zones throughout the day.
Color-Coded Levels
Each root time is assigned a distinct color for fast identification. For example:
03:12 → Fuchsia
06:47 → Purple
07:41 → Teal
08:51 → White
09:53 → White
10:20 → Orange
11:10 → Green
11:49 → Red
12:05 → White
13:05 → Teal
14:09 → Aqua
This helps traders quickly recognize which time-of-day level price is interacting with.
Lightweight & Visual
The indicator focuses purely on price and time, avoiding complexity or lagging signals. It can be layered with other analysis tools, order flow charts, or session-based studies.
Practical Use Cases
Intraday Bias:
Observe whether price respects, rejects, or consolidates around these reference levels to form a bias.
Liquidity Zones:
High/low sweeps of the root candle can act as liquidity pools where institutions might trigger stops or reversals.
Support & Resistance:
Extended lines create intraday S/R zones without the need to manually draw levels.
Confluence Finder:
Combine Sunset Zones with VWAP, session ranges, Fibonacci levels, or higher-timeframe structure for layered confluence.
Important Notes
This is a visual reference tool only. It does not generate buy or sell signals.
Default times are provided, but the concept is flexible — traders can adapt it by modifying or expanding the list of time codes.
Works best on intraday timeframes where session structure is most relevant (e.g., 1-minute to 15-minute charts).
✅ In short: Sunset Zones by PDV gives intraday traders a systematic way to anchor their charts to important time-based highs and lows, creating a consistent framework for analyzing price reactions across the day.

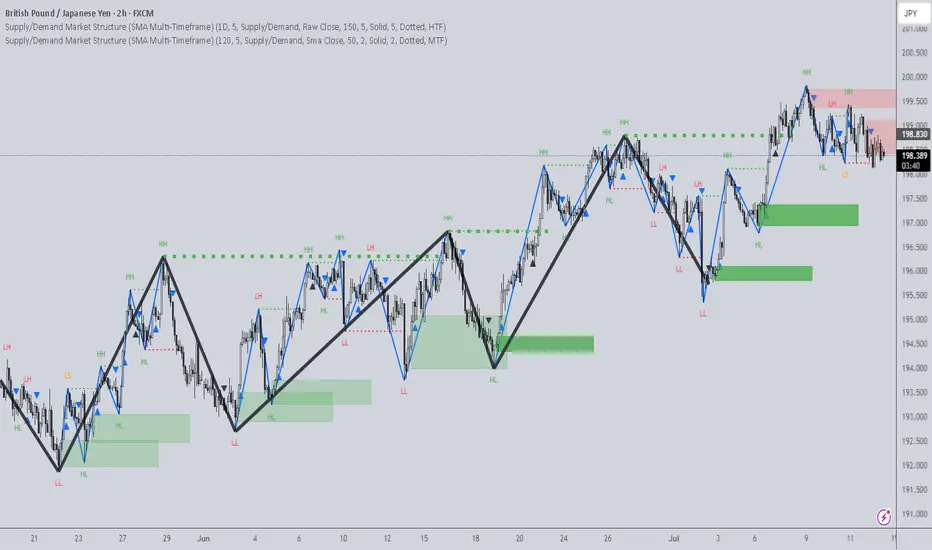
Supply/Demand Market Structure (SMA Multi-Timeframe)Supply/Demand Based Market Structure
Structure + Order Blocks from Synthetic SMA Candles
Overview:
The SMA Supply/Demand Market Structure indicator combines market structure analysis with supply/demand logic, powered by SMA-based synthetic candles . Instead of relying on raw candle data, this tool generates smoothed higher-timeframe candles using simple moving averages to identify more stable zones and cleaner structure shifts.
It detects bullish and bearish breaks of structure (BoS) , highlights swing points like HH, HL, LH, LL , and plots institutional-style supply and demand zones formed from aggressive rallies or drops. The result is a precise and noise-filtered view of market intent, perfect for trend-following or smart money strategies.
How It Works:
- Synthetic candles are created using SMA of OHLC values on your selected timeframe (HTF).
- A bullish break occurs when price closes above the high of the last bearish synthetic candle.
- A bearish break occurs when price closes below the low of the last bullish synthetic candle.
- Upon break confirmation:
- A demand zone is drawn using the last bearish candle.
- A supply zone is drawn using the last bullish candle.
- Each zone is extended forward for a user-defined number of bars and optionally deleted upon mitigation.
- Zigzag-based internal structure connects valid swing points and classifies them as HH, HL, LH, LL , including Liquidity Sweeps (LS) .
- BoS levels are highlighted with lines that automatically reset when new structure forms.
Key Features:
- Synthetic SMA Candles : Smooth and reliable structure from average-based HTF candles
- Break Modes : Choose between raw HTF closes or SMA closes for break logic
- Custom Timeframe Selection : Analyze structure across any HTF you choose
- Dynamic Supply/Demand Zones : Auto-plot boxes from valid rallies/drops
- Mitigation Detection : Optionally fade or delete zones when price trades through
- Zigzag Structure Mapping : Automatically connect structural highs/lows
- BoS Detection : Real-time breakout of swing points with visual confirmation
- Smart Labels : Marks HH, HL, LH, LL, and LS directly on the chart
- Multi-timeframe Alert System : Notify for all structural changes, BoS, and new zones
How to Use:
- Set your desired HTF and SMA Length for synthetic candle smoothing.
- Use SMA=1 for raw candles
- Select a Break Mode :
- Raw Close : Uses standard HTF close values
- SMA Close : Uses smoothed closes from SMA
- Watch for bullish or bearish breaks — zones are plotted when price confirms breakout structure.
- Use demand zones as long entry areas and supply zones as short setups on retests.
- Rely on internal shifts and zigzag swings to monitor structure continuity.
- Enable alerts for swing formations, BoS, and liquidity sweeps to trade hands-free.
Recommended Strategies:
- Smart Money & ICT Models : Use synthetic demand/supply + BoS for mitigation or continuation plays
- Swing Trading : Align with higher timeframe structure and use zones for entry triggers
- Trend Trading : Confirm structure alignment and wait for pullbacks into zones
- Reversal Entries : Trade structure breaks when zones fail and a BoS confirms the shift
Customization Options:
- Timeframe input for custom HTF control
- SMA Length to adjust candle smoothing
- Zone Style : Control zone color, transparency, and duration
- Structure Display : Toggle swing labels and zigzag visuals
- Alert Mode : Choose between LTF, MTF, or HTF alerts
Summary:
SMA Supply/Demand Market Structure provides a clean, flexible view of price structure and institutional intent by fusing market structure with SMA-based synthetic candles. It’s ideal for anyone seeking reduced noise, visually guided entries, and rule-based trading based on structural shifts and real-time demand/supply dynamics.
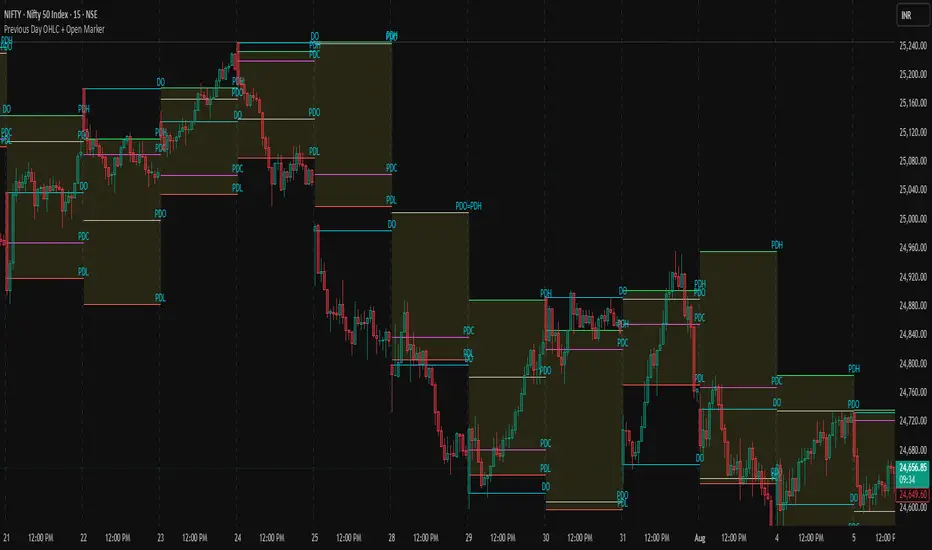
Previous Day OHLC + Open MarkerPrevious Day OHLC + Open Marker
This indicator is designed to help traders quickly identify the most important price levels from the previous trading session and today’s open. It provides a clean and configurable overlay of the previous day’s OHLC (Open, High, Low, Close) along with the current day's opening price, making it easy to spot price reactions, liquidity sweeps, and confluence zones.
📌 Key Features
✅ Previous Day OHLC Lines
Plots horizontal lines for High (H), Low (L), Open (O), and Close (C) from the previous session
Each line is independently toggleable
Fully customizable in color, transparency, and thickness
✅ Today's Session Open (DO)
Marks the current day's opening price
Helps identify directional bias, trend/momentum shifts, or mean-reversion points
✅ Minimalist Labels for Clarity
Text-only labels like H, L, O, C, and DO — no bulky label boxes
Color-matched to each line for visual simplicity
Optional display to keep charts clean
✅ Session-Based Highlight Zone
Optionally highlights the area between the previous day’s High and Low with a shaded box
Useful for identifying the day’s value area or range breakouts
✅ Smart Alerts
Receive alerts when price crosses any of the levels: PDH, PDL, PDO, PDC, or Today’s Open
Helps you catch key interactions without watching the chart constantly
🧠 Ideal For
Intraday traders using VWAP, order blocks, or liquidity concepts
Swing traders who want to see how current price relates to prior structure
Scalpers looking for clean levels to enter fades, reversals, or breakouts
Anyone applying institutional trading concepts (PDH/PDL sweeps, FVGs, BPRs, etc.)
⚙️ Customization Options
Toggle each level (H/L/O/C/DO) individually
Show or hide labels and highlight zone
Customize color, line thickness, and transparency
Clean layout — no line extensions across the entire chart
🧼 Design Philosophy
This script was created for clarity, speed, and minimalism. It avoids clutter while preserving all the crucial context price action traders need. Labels are informative but unobtrusive, and alerts help automate level tracking.
🛠 Built with Pine Script v5
🔔 Alerts Included
📊 Optimized for both intraday and swing trading
📦 Lightweight and modular by design
Session Range ProjectionsSession Range Projections
Purpose & Concept:
Session Range Projections is a comprehensive trading tool that identifies and analyzes price ranges during user-defined time periods. The indicator visualizes high-probability reversal zones and profit targets by projecting Fibonacci levels from custom session ranges, making it ideal for traders who focus on time-based market structure analysis.
Key Features & Calculations:
1. Custom Time Range Analysis
- Define any time period for range calculation - from traditional sessions (Asian, London, NY) to custom periods like opening ranges, hourly ranges, or 4-hour blocks
- Automatically captures the highest and lowest prices within your specified timeframe
- Supports multiple timezone selections for global market analysis
- Flexible enough for intraday scalping ranges or longer-term swing trading setups
2. Premium & Discount Zones
- Automatically divides the range into premium (above 50%) and discount (below 50%) zones
- Visual differentiation helps identify institutional buying and selling areas
- Color-coded boxes clearly mark these critical price zones
3. Optimal Trade Entry (OTE) Zones
- Highlights the 79-89% retracement zone in premium territory
- Highlights the 11-21% retracement zone in discount territory
- These zones represent high-probability reversal areas based on institutional order flow concepts
4. Fibonacci Projections
- Projects 11 customizable Fibonacci extension levels from the range extremes
- Levels extend both above and below the range for symmetrical analysis
- Each level can be individually toggled and color-customized
- Default levels include common retracement ratios: -0.5, -1.0, -2.0, -2.33, -2.5, -3.0, -4.0, -4.5, -6.0, -7.0, -8.0
How to Use:
Set Your Time Range: Input your desired session start and end times (24-hour format)
Select Timezone: Choose the appropriate timezone for your trading session
Customize Display: Toggle various visual elements based on your preferences
Monitor Price Action: Watch for reactions at projected levels and OTE zones
Set Alerts: Configure sweep alerts for when price breaks above/below range extremes
Input Parameters Explained:
Time Range Settings
Range Start/End Hour & Minute: Define your analysis period
Time Zone: Ensure accurate session timing across different markets
Visual Settings
Range Box: Toggle the premium/discount zone visualization
Horizontal Lines: Customize high/low line appearance
Internal Range Levels: Show/hide equilibrium and OTE zones
Labels: Configure text display for key levels
Fibonacci Projections: Enable/disable extension levels
Display Settings
Historical Ranges: Show up to 10 previous session ranges
Alert Type: Choose between high sweep, low sweep, or both
Trading Applications:
Session-Based Trading: Analyze specific market sessions (Asian, London, New York, opening ranges, hourly ranges)
Reversal Trading: Identify high-probability reversal zones at OTE levels
Breakout/Reversal Trading: Monitor range breaks/reversals with built-in sweep alerts
Risk Management: Use Fibonacci projections as profit targets or rejection areas
Multi-Timeframe Analysis: Apply to any timeframe for various trading styles
Important Notes:
This indicator is for educational purposes only and should not be considered financial advice
Past performance does not guarantee future results
Always use proper risk management when trading
The indicator automatically manages historical data to maintain chart performance

Math by Thomas Liquidity PoolDescription
Math by Thomas Liquidity Pool is a TradingView indicator designed to visually identify potential liquidity pools on the chart by detecting areas where price forms clusters of equal highs or equal lows.
Bullish Liquidity Pools (Green Boxes): Marked below price where two adjacent candles have similar lows within a specified difference, indicating potential demand zones or stop loss clusters below support.
Bearish Liquidity Pools (Red Boxes): Marked above price where two adjacent candles have similar highs within the difference threshold, indicating potential supply zones or stop loss clusters above resistance.
This tool helps traders spot areas where smart money might hunt stop losses or where price is likely to react, providing valuable insight for trade entries, exits, and risk management.
Features:
Adjustable box height (vertical range) in points.
Adjustable maximum difference threshold between candle highs/lows to consider them equal.
Boxes automatically extend forward for visibility and delete when price sweeps through or after a defined lifetime.
Separate visual zones for bullish and bearish liquidity with customizable colors.
How to Use
Add the Indicator to your chart (preferably on instruments like Nifty where point-based thresholds are meaningful).
Adjust Inputs:
Box Height: Set the vertical size of the liquidity zones (default 15 points).
Max Difference Between Highs/Lows: Set the max price difference to consider two candle highs or lows as “equal” (default 10 points).
Box Lifetime: How many bars the box stays visible if not swept (default 120 bars).
Interpret Boxes:
Green Boxes (Bullish Liquidity Pools): Areas of potential demand and stop loss clusters below price. Watch for price bounces or accumulation near these zones.
Red Boxes (Bearish Liquidity Pools): Areas of potential supply and stop loss clusters above price. Watch for price rejections or distribution near these zones.
Trading Strategy Tips:
Use these zones to anticipate where stop loss hunting or liquidity sweeps may occur.
Combine with your Order Block, Fair Value Gap, and Market Structure tools for higher probability setups.
Manage risk by avoiding entries into price regions just before large liquidity pools get swept.
Automatic Cleanup:
Boxes delete automatically once price breaks above (for bearish zones) or below (for bullish zones) the zone or after the set lifetime.

Velez Price Action Signals (with 20 & 200 SMA)Velez Price Action Signals – With 20 & 200 SMA Overlay
This TradingView Pine Script is a clean and powerful reversal signal tool inspired by Oliver Velez’s price action philosophy, enhanced with trend context via two Simple Moving Averages.
🔍 Signal Logic
Buy Signal:
Current candle sweeps below the previous 5-bar low (liquidity grab).
Candle is bullish (close > open).
The lower wick is significantly larger than the body (e.g. ratio > 1.5).
Sell Signal:
Current candle sweeps above the previous 5-bar high.
Candle is bearish (close < open).
The upper wick is significantly larger than the body.
Signals appear as BUY/SELL labels on the chart (non-repainting).

ICT SMC Liquidity Grabs and OBsICT SMC Liquidity Grabs + Order Blocks + Fibonacci OTE Levels
A High-Probability Entry Engine for Smart Money Concept Traders
This script combines three powerful Smart Money Concepts (SMC) into a single tool: Liquidity Grabs, Order Block Zones, and Fibonacci OTE Levels, allowing traders to identify institutional entry models with clean, rule-based visual signals.
It’s designed to simplify SMC trading by highlighting confluence zones where price is likely to reverse or continue — with clear visual zones, entry arrows, and take profit projections.
🔍 What This Script Does:
Detects Liquidity Grabs
Identifies when price sweeps above/below the highest high or lowest low within a user-defined lookback period and closes back inside.
Plots orange labels on the chart to signal potential liquidity events (LG-H / LG-L).
Plots Order Blocks After Liquidity Grabs
After a liquidity grab, the script looks for displacement candles (strong bullish or bearish moves) and draws highlighted OB zones extending several bars to the right.
These zones represent potential institutional footprints for price reversals.
Draws Fibonacci OTE Levels (Optimal Trade Entry)
Uses recent swing high and low pivots to automatically calculate OTE zones (default: 62% and 75% retracement levels).
Draws these retracement zones for both bullish and bearish setups.
Marks Valid OTE Entry Zones
Buy/Sell zones only trigger when:
A liquidity grab occurs,
Price enters the OTE zone,
And a strong confirming candle is present.
Plots green/red arrows for valid buy/sell OTE entries.
Auto-Draws Take Profit Zones
TP1 = Previous swing high/low
TP2 = Risk-based R-multiplied extension (e.g., 1.5R — customizable)
Alerts
Triggers alerts when valid buy or sell OTE setups are detected.
⚙️ Customization Features:
Toggle each feature: Liquidity Grabs, Order Blocks, Fibonacci OTE levels
Set Fibonacci retracement percentages (e.g., 0.62 / 0.75)
Adjust lookback window for liquidity detection
Customize the take-profit multiplier (R-based)
Full control over visuals: colors, labels, and lines
💡 How to Use:
Use this script to scan for high-confluence trade setups based on Smart Money principles.
Combine with session timing (e.g., New York open), major swing structure, or Kill Zone windows for maximum edge.
Look for arrows inside OB zones or OTE levels following liquidity sweeps for cleaner entries.
🔗 Works Best With:
✅ First FVG — Opening Range Fair Value Gap Detector: Identify early inefficiencies to set the narrative for the day.
✅ Liquidity Levels — Smart Swing Lows: Spot key structural lows that can fuel stop hunts and reversals.
✅ ICT Turtle Soup — Liquidity Reversal: Add a classic reversal pattern to your toolkit to catch fakeouts cleanly.
Together, these tools build a complete Smart Money ecosystem for entry precision, risk management, and price behavior forecasting.

ICT Turtle Soup (Liquidity Reversal)ICT Turtle Soup — Liquidity Reversal Detection
Trap the Trap: A Precision Reversal Strategy from the Inner Circle Trader Playbook
This indicator implements the Turtle Soup liquidity reversal setup — a widely used ICT (Inner Circle Trader) concept that targets false breakouts beyond recent swing highs or lows. These patterns typically occur when price grabs liquidity above or below a known level, then snaps back, trapping retail traders and creating a high-probability reversal scenario.
🔍 What This Script Does:
Detects Liquidity Sweeps Above/Below Key Swing Levels
Uses a customizable swing lookback to identify recent swing highs and lows.
Triggers a Bearish Turtle Soup when price runs above a previous swing high and closes back below.
Triggers a Bullish Turtle Soup when price sweeps below a prior swing low and closes back above.
Plots Clear Visual Signals
Reversal signals appear as 🐢🔻 (Bearish) or 🐢🔺 (Bullish) markers directly on your chart.
Optional labels can be enabled for enhanced journaling and review.
Real-Time Alerts
Receive alert notifications when a Turtle Soup setup is detected — ideal for scalpers or intraday traders watching for reversals around liquidity pools.
⚙️ Customization Options:
Set the swing lookback sensitivity (default: 5)
Enable or disable labels
Choose label font size
Customize colors for bullish and bearish signals
💡 How to Use:
Deploy on intraday timeframes (e.g. 5m–15m) for high-resolution liquidity analysis.
Watch for signals at key highs/lows, session extremes, or zones where liquidity is likely resting.
Combine with tools like FVGs, Order Blocks, and OTE zones for layered confirmation.
🔗 Combine With These Tools for a Complete SMC Edge:
✅ First FVG — Opening Range Fair Value Gap Detector
✅ ICT SMC Liquidity Grabs + OB + Fibonacci OTE Levels
✅ Liquidity Levels — Smart Swing Lows
Together, these tools form a high-precision Smart Money toolkit — helping traders map, anticipate, and act on institutional-level liquidity events with clarity and confidence.

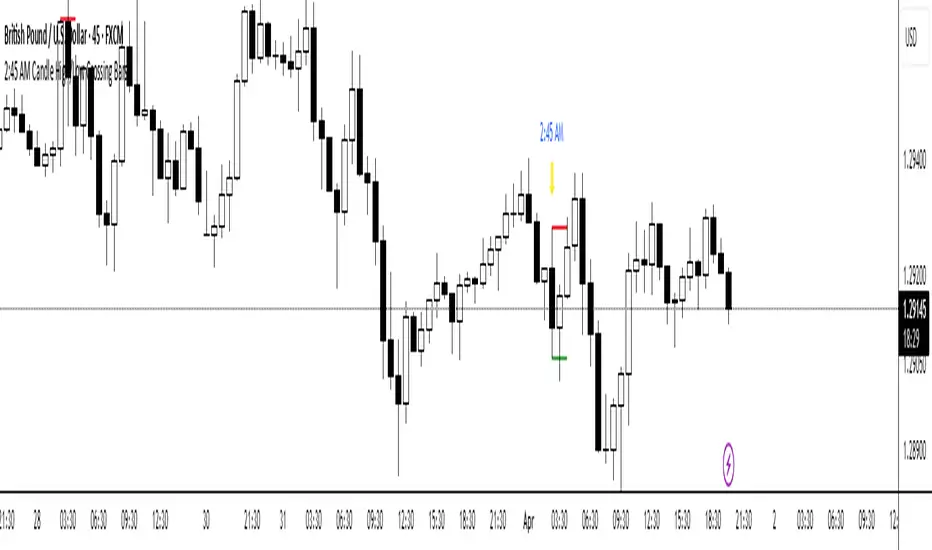
2:45 AM Candle High/Low Crossing Bars2:45 AM Candle High/Low Crossing Bars is an indicator that focuses on the trading view 2:45am NY TIME high and low indicating green for buy and red bars for sell, with the 2:45am new york time highlight/ If the next candle sweeps the low we buy while if it sweeps the high we sell, all time zoon must be the new York UTC time.
Edufx AMD~Accumulation, Manipulation, DistributionEdufx AMD Indicator
This indicator visualizes the market cycles using distinct phases: Accumulation, Manipulation, Distribution, and Reversal. It is designed to assist traders in identifying potential entry points and understanding price behavior during these phases.
Key Features:
1. Phases and Logic:
-Accumulation Phase: Highlights the price range where market accumulation occurs.
-Manipulation Phase:
- If the price sweeps below the accumulation low, it signals a potential "Buy Zone."
- If the price sweeps above the accumulation high, it signals a potential "Sell Zone."
-Distribution Phase: Highlights where price is expected to expand and establish trends.
-Reversal Phase: Marks areas where the price may either continue or reverse.
2. Weekly and Daily Cycles:
- Toggle the visibility of Weekly Cycles and Daily Cycles independently through the settings.
- These cycles are predefined with precise timings for each phase, based on your selected on UTC-5 timezone.
3. Customizable Appearance:
- Adjust the colors for each phase directly in the settings to suit your preferences.
- The indicator uses semi-transparent boxes to represent the phases, allowing easy visualization without obstructing the chart.
4. Static Boxes:
- Boxes representing the phases are drawn only once for the visible chart range and do not dynamically delete, ensuring important consistent reference points.

Previous Key Levels (fadi)Previous Key Levels indicator is a highly configurable OHLC levels tool designed to provide traders with the ability to plot multiple levels while minimizing screen clutter. This indicator is perfect for those who want to monitor various timeframes simultaneously without overloading their charts with unnecessary information.
How to Use It
This indicator offers traders the flexibility to track up to 6 higher timeframes (HTFs) and multiple candles for each timeframe. For example, a trader can choose to monitor the OHLC of the last four 4-hour candles, providing a comprehensive view of significant price levels over different periods.
Key Features
Highly Configurable: Customize the number of timeframes and candles to suit your trading strategy.
Minimal Screen Clutter: Efficiently plot multiple levels without overwhelming your chart.
Flexible Application: Ideal for identifying support and resistance levels, liquidity sweeps, target levels, and more, adapting to various trading styles.
Traders have diverse trading styles and preferences. Some may use these levels to identify support and resistance zones, while others might look for liquidity sweeps or set target levels. By offering a high degree of customization, the Previous Key Levels indicator caters to the unique needs of individual traders, helping them make informed decisions based on historical price action across multiple timeframes.
Timeframe Settings
Toggle to track 6 HTF settings and the number of candles to track for each.
Limit to next HTFs only can be used to limit the HTF levels displayed based on the current timeframe.
Hide Above will disable the indicator above the specified interval.
Offset to Left and Right are used to specify where the level line starts and ends based on the current candle.
Offset between HTFs extends HTF levels to become more readable.
HTF Settings
Choice of the OHLC levels to track.
Specify the color, line style, and line width for each level.
Mark the start of that level, for example, draw a vertical line where the 4H candle has started.
Trace back to draw optional lines to track back to the origin of the level.
Label Settings
Highly configurable labels that allow traders to customize the labels to their liking.
Label color, background, and size.
Customize using up to 9 configurable parts.
Fading Levels
To prevent clutter, the indicator offers the option to change the transparency of the levels based on their distance from the current price. The distance is calculated based on a configurable Average True Range (ATR).
Change Transparency to a percentage of its current color.
Range should be within X candles will fade any level that is X candles length away from the current price.
ATR length used in calculation will calculate the average size of candles in the calculation.

OutofOptionsHelperLibraryLibrary "OutofOptionsHelperLibrary"
Helper library for my indicators/strategies
isUp(i)
is Up candle
Parameters:
i (int)
Returns: bool
isDown(i)
is Down candle
Parameters:
i (int)
Returns: bool
TF(t)
format time into date/time string
Parameters:
t (int)
Returns: string
S(s)
format data to string
Parameters:
s (float)
Returns: string
S(s)
format data to string
Parameters:
s (int)
Returns: string
S(s)
format data to string
Parameters:
s (bool)
Returns: string
barClose(price, up, strict)
Determine if candle closed above/below price
Parameters:
price (float)
up (bool)
strict (bool) : bool if close over is required or if close at the price is good enough
Returns: bool
processSweep(L, price, up, leftB)
Determine how many liquidity sweeps were made
Parameters:
L (array)
price (float)
up (bool)
leftB (int)
Returns: int
liquidity
Fields:
price (series float)
time (series int)
oprice (series float)
otime (series int)
sweeps (series int)
bars_swept (series int)

Price Action Toolkit Lite [UAlgo]The Price Action Toolkit Lite is a comprehensive indicator designed to enhance your chart analysis with advanced price action tools. This powerful toolkit combines multiple technical analysis concepts to provide traders with a clear visualization of market structure, liquidity levels, order blocks, and trend lines. By integrating these elements, the indicator aims to offer a holistic view of price action, helping traders identify potential entry and exit points, as well as key levels of interest in the market.
🔶 Key Features
Market Structure Analysis: The indicator includes a ZigZag feature to highlight significant market highs and lows, aiding in the visualization of market structure changes and trends.
Liquidity Sweeps Detection: It identifies and displays liquidity sweeps, which are crucial for recognizing potential market reversals and areas of interest where significant price action is likely to occur.
Order Blocks: Automatically detects and draws order blocks, highlighting areas of institutional buying and selling pressure, which can serve as key support and resistance levels.
Trend Lines: The toolkit can draw and extend trend lines based on pivot points, providing a clear view of prevailing market trends and potential breakout points.
Customizable Settings: Users can adjust various settings, including the length of the ZigZag, liquidity detection sensitivity, the number of order blocks to display, and trend line detection parameters, allowing for a tailored analysis experience.
🔶 Disclaimer
The "Price Action Toolkit Lite " is intended for educational and informational purposes only.
It is not financial advice and should not be construed as such. Trading in financial markets involves substantial risk, including the risk of loss.
Past performance is not indicative of future results.
🔷 Similar Scripts
