RSI-EMA-Crossing with Donchian-Stop-LossThe Donchian RSI Indicator is a visual tool that combines momentum and trend analysis to identify high-quality long opportunities based on RSI crossovers, price action, and Donchian channel dynamics.
How It Works
Momentum Signal: A bullish RSI crossover is detected when the RSI crosses above its moving average.
Trend Filter: A signal is only valid if the crossover occurs while the price is above its moving average – filtering out entries against the prevailing trend.
Signal Candle: The high of the crossover candle is stored.
Entry Trigger: A valid signal occurs when a later candle closes above that signal high.
Stop-Loss (Visual Only)
The lower band of the Donchian Channel acts as a visual reference for a dynamic stop-loss level.
Features
Customizable RSI, Donchian Channel, and moving average lengths
Selectable MA types: SMA, EMA, WMA, VWMA, HMA
Signal candle highlighted (yellow background)
Entry points labeled on the chart
Price MA and Donchian Channel plotted
Trend filter improves signal quality by confirming upward bias
Use Case
Designed for swing and position traders
Optimized for use on daily or 4H charts
Cari skrip untuk "stop loss"

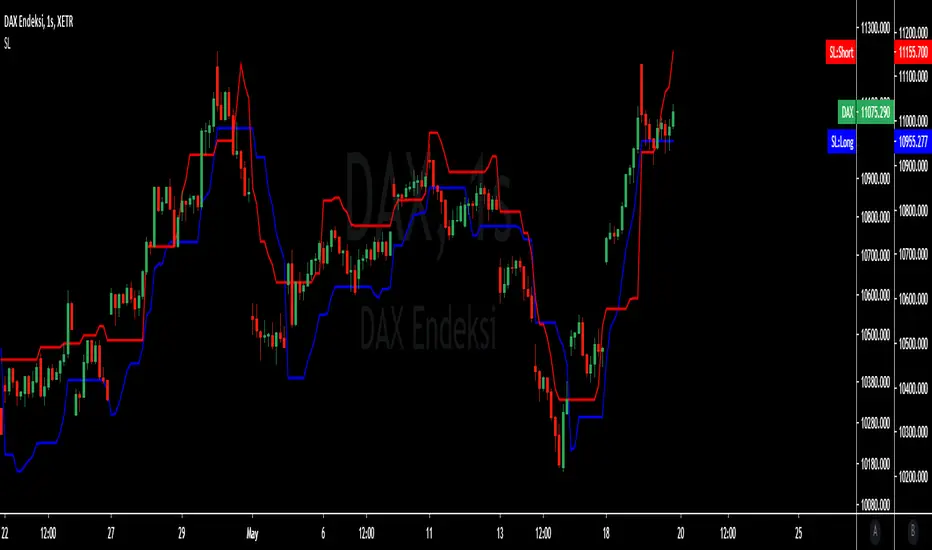
Smart Breakout with ATR Stop-LossThe Smart Breakout indicator combines a classic 20-day Donchian channel breakout with a tight trailing stop, drawing green lines and “ENTRY” labels at the bar after a valid breakout, and red lines and “EXIT” label at the bar after a stop-loss breach.
By default it uses the chart’s timeframe to compute ATR and stops, but you can flip on Daily lock to freeze both ATR and price reads at the daily resolution—so your stops stay the same whether you view at 1s, 15 m, 4h or lower frequency bars.
Key features:
20-day Donchian breakout: entry when price closes above the highest high of the previous 20 bars
2 × ATR(14) trailing stop: initialized at entry and raised only when the new (close – 2 × ATR) exceeds the prior stop
Daily lock option: Ensures all ATR and close values are calculated on the daily timeframe, keeping stop levels consistent across resolutions

TRP Stop-Loss and Position SizingScript is based on TRP to see both Long Stop Loss and Short Stop Loss, You can Also adjust the position size based on your capital and percentage risk.

Prepare Targets, Stop Loss, Position Size and calculate PnL You are watching the price action of your favorite coin. Then the price changes quickly and you know you could start a good trade now.
But how much should you buy, where should you set your Target for Profit Taking and your Stop Loss? How much money do you want to risk, how much money would you win if the trade is succesfull?
This indicator helps you to set up your trade in a quick way, no need to do some calculations by hand.
How does it work?
Just enter the prices where you want to take Profit and where your Stopp Loss should be.
Enter the number of coins and wether you buy or sell/go long or short.
These targets are then shown in the chart, move them around to see if your stopp loss is positioned well. See directly what your profit or loss would be.
See some Screenshots with more explanations for what is possible and how to set up everything.
General Overview:
How to set up the Trade:
Formatting and Extras:
Let me know if you like it!

ORB With Buffer, Target & Stop LossThe "ORB With Buffer" is a comprehensive technical analysis tool designed to identify, plot, and visualize key levels associated with price breakouts. It offers a dynamic representation of breakout zones, buffer areas, target levels, and stop-loss levels on both sides of the market.
Key Features:
ORB Levels (Opening Range Breakout):
The indicator identifies and plots the Opening Range Breakout levels, marking the high and low points of the initial trading period. In our case the ORB range is locked to 15 Minutes irrespective of the chart's timeframe.
Buffer Areas for Breakout:
Buffer zones are displayed around the ORB levels, representing a range where traders cant wait to join the direction to counter fake ORB breakouts
Targets:
The indicator calculates and visualizes target levels. Approximately 1% of instrument's price from entry point
Stop Loss Levels:
Stop-loss levels are indicated on both sides of the market, offering traders a clear reference point to manage risk.

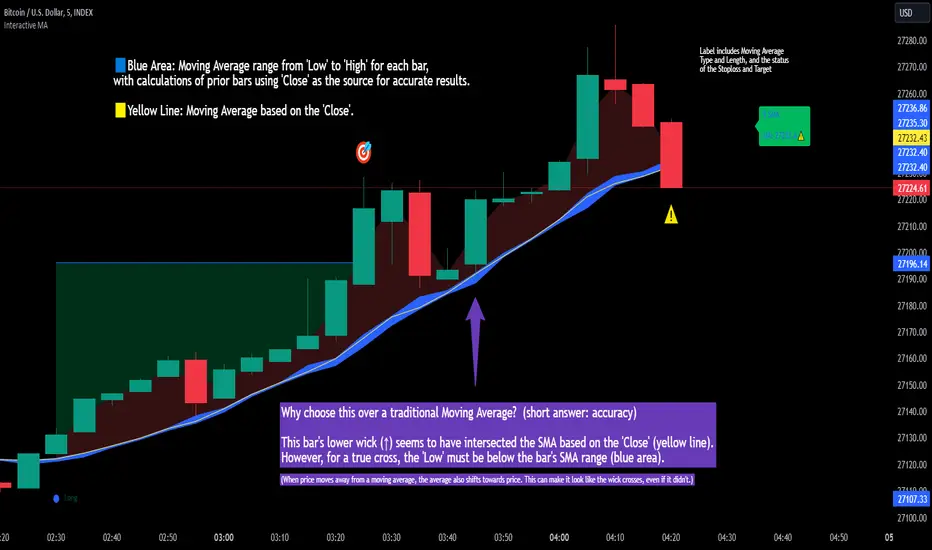
Interactive MA Stop Loss [TANHEF]This indicator is "Interactive." Once added to the chart, you need to click the start point for the moving average stoploss. Dragging it afterward will modify its position.
Why choose this indicator over a traditional Moving Average?
To accurately determine that a wick has crossed a moving average, you must examine the moving average's range on that bar (blue area on this indicator) and ensure the wick fully traverses this area.
When the price moves away from a moving average, the average also shifts towards the price. This can make it look like the wick crossed the average, even if it didn't.
How is the moving average area calculated?
For each bar, the moving average calculation is standard, but when the current bar is involved, its high or low is used instead of the close. For precise results, simply setting the source in a typical moving average calculation to 'Low' or 'High' is not sufficient in calculating the moving average area on a current bar.
Moving Average Options:
Simple Moving Average
Exponential Moving Average
Relative Moving Average
Weighted Moving Average
Indicator Explanation
After adding indicator to chart, you must click on a location to begin an entry.
The moving average type can be set and length modified to adjust the stoploss. An optional profit target may be added.
A symbol is display when the stoploss and profit target are hit. If a position is create that is not valid, "Overlapping MA and Bar" is displayed.
Alerts
'Check' alerts to use within indicator settings (stop hit and/or profit target hit).
Select 'Create Alert'
Set the condition to 'Interactive MA''
Select create.
Alert messages can have additional details using these words in between two Curly (Brace) Brackets:
{{stop}} = MA stop-loss (price)
{{upper}} = Upper MA band (price)
{{lower}} = Lower MA band (price)
{{band}} = Lower or Upper stoploss (word)
{{type}} = Long or Short stop-loss (word)
{{stopdistance}} = Stoploss Distance (%)
{{targetdistance}} = Target Distance (%)
{{starttime}} = Start time of stoploss (day:hour:minute)
{{maLength}} = MA Length (input)
{{maType}} = MA Type (input)
{{target}} = Price target (price)
{{trigger}} = Wick or Close Trigger input (input)
{{ticker}} = Ticker of chart (word)
{{exchange}} = Exchange of chart (word)
{{description}} = Description of ticker (words)
{{close}} = Bar close (price)
{{open}} = Bar open (price)
{{high}} = Bar high (price)
{{low}} = Bar low (price)
{{hl2}} = Bar HL2 (price)
{{volume}} = Bar volume (value)
{{time}} = Current time (day:hour:minute)
{{interval}} = Chart timeframe
{{newline}} = New line for text
I will add further moving averages types in the future. If you suggestions post them below.
[TTI] ATR Trailing Stop Alerts––––HISTORY & CREDITS 🏦
The Trailing Stop Alert is a TradingView indicator developed by TintinTrading, which is designed to help traders manage their positions by updating and alerting them about their trailing stop levels. This tool is a valuable addition to a trader's arsenal, as it automates the process of maintaining trailing stop levels and alerts the user when they are updated or hit.
––––WHAT IT DOES 💡
The Trailing Stop Alert indicator calculates trailing stop levels based on the Average True Range (ATR) of an asset over a specified lookback period. It takes user inputs for trail type (Long or Short), lookback period, ATR length, ATR multiplier, and bar time. The indicator can be applied to any financial instrument and will dynamically update the trailing stop level based on price action. When the trailing stop level is updated or hit, the indicator generates alerts to inform the user of these events.
––––HOW TO USE IT 🔧
1. Add the Trailing Stop Alert indicator to your TradingView chart.
2. Configure the settings according to your preferred parameters:
👉Trail Type: Choose between "Long" or "Short" based on your trading position.
👉Lookback: Set the number of bars to look back for determining the highest high or lowest low.
👉ATR Length: Set the period for calculating the Average True Range.
👉ATR Multiplier: Set the multiplier to adjust the trailing stop distance.
👉Bar Time: Set the time at which the indicator starts updating the trailing stop levels.
3. The indicator will plot the trailing stop level on the chart, and update it as the price action unfolds.
4. When the trailing stop level is updated or hit, you will receive an alert in the form of a message with the new level or a notification that the stop has been hit.
5. Adjust your stop loss orders accordingly based on the trailing stop levels provided by the indicator.
By using the Trailing Stop Alert indicator, you can effectively manage your positions and reduce the risk of giving back profits in a trade.

kaptanFantastik[Take Profit and Stop Loss Finder]Hello all,
It's ATR based active take profit & stop loss finder.
You can set multipliers for taking profit and stop losing and you can change the price source for the calculation. Also, you can change the ATR level.
Defaults are my best settings. 2.2x for taking profit and 1.5x for stop losing. Open price is the source. Also, I think 5 ATR is the best for day and swing trade.
Levels are determined according to the open prices (This is because we can enter the position after our other indicators give the signal following the close price. Yet, you can change it). Since it's active and based on my calculation with ATR values, percentages for the taking profits and stop losing may change. Because of this, you need to note the take profit and stop lose prices after your entry price level is determined by the other indicators for the best success rates.
It can be used in any time frame with the other indicators to determine the best entry points. For example, 3 EMA levels with 5,8 and 13 is good option for the entry. You can enter the position when 5 crosses up 8 and both are above the 13. You can also use custom more advanced buy/sell indicators with this one for entry points.
It can be used with any asset from cryptocurrency to the stocks, from forex to gold etc.
Hint: You can set your levels lower than the take profit prices to maximize the success rate.
Note: Market should be open for the positions.
Example trade on the 5-minute timeline.
The below chart has both my custom indicator and the 3 EMAs mentioned above.
Trade 1: Entry price: 19191, Take Profit: 19276. Profit 0.44%
Trade 2: Entry price: 19189, Take Profit: 193009. Profit 0.625%
Türkçe bilen kullanıcılar için açıklama
Herkese merhabalar,
ATR tabanlı aktif kar al ve zararı durdur bulucu.
Kar almak ve zararı kesmek için çarpanlar belirleyebilir ve hesaplama için fiyat kaynağı değiştirebilirsiniz. Ayrıca, ATR seviyesini de değiştirebilirsiniz.
Varsayılanlar benim en iyi ayarlarım. Kar almak için 2,2 kat ve zararı durdurmak için 1,5 kat. Açılış, fiyat kaynağıdır. Ayrıca, 5 ATR'nin günlük ve kısa vade (swing trade) için en iyisi olduğunu düşünüyorum.
Seviyeler açılış fiyatına göre belirlenir (Çünkü diğer göstergelerimiz kapanış fiyatının ardından sinyal verdikten sonra pozisyona girebiliyoruz. Yine de bunu değiştirebilirsiniz). Aktif olduğu için ve ATR değerleri ile yaptığım hesaplamaya göre kar alma ve zarar kes yüzdeleri değişebilir. Bu nedenle, en iyi başarı oranları için; giriş fiyat seviyeniz diğer göstergeler tarafından belirlendikten sonra kar al ve zararı durdur fiyatlarını not etmeniz gerekir.
En iyi giriş noktalarını belirlemek için diğer göstergelerle herhangi bir zaman diliminde kullanılabilir. Örneğin, 5,8 ve 13 ile 3 EMA seviyesi giriş için iyi bir seçenektir. 5, 8'i geçtiğinde ve her ikisi de 13'ün üzerinde olduğunda pozisyona girebilirsiniz. Giriş noktaları için bununla birlikte daha gelişmiş özel al/sat göstergelerini de kullanabilirsiniz.
Kripto paradan hisse senetlerine, forexten altına vb. her türlü varlıkla kullanılabilir.
İpucu: Başarı oranını en üst düzeye çıkarmak için seviyelerinizi kar alma fiyatlarından daha düşük ayarlayabilirsiniz.
Not: Pozisyonlar için piyasa açık olmalıdır.
5 dakikalık zaman çizilgesinde örnek işlem.
Yukarıdaki örnek grafikte hem özel indikatörüm hem de yukrıda belirtilen 3 EMA var.
İşlem 1: Giriş fiyatı: 19191, Kazanç Al: 19276. Kar %0.44
İşlem 2: Giriş fiyatı: 19189, Kazanç Al: 193009. Kar %0.625

PluePhantom's Trailing Stop Loss Multiple of ATRThis is a simple trailing stop loss line for long and short positions, made by Bluephantom using PS v2. I converted it onto v5
It is calculated as a multiple of the ATR instead of a percentage.
You are able to change the multiple and the ATR length.
It can be used as a guide to where you should consider putting in your stop loss on a trade and to where you should move your stop loss to as the days go by.
This indicator is experimental. Use at your own risk.

Manual Stop Loss / Risk Management PanelHere is a panel where you enter the desired stop-loss price, the amount you would like to risk and it spits out what you should trade to only lose that amount if the stop-loss is hit.

EMA 200 + Parabolic SAR + RSI + Take Profit Stop Loss By NussaraThe Parabolic SAR is a technical indicator developed by J. Welles Wilder to determine the direction that an asset is moving. The indicator is also referred to as a stop and reverse system, which is abbreviated as SAR . It aims to identify potential reversals in the price movement of traded assets.
EMA 200 ( Exponential Moving Average ) is important because it determines the overall trend, filters a trading system, and reacts faster than the 200 MA.
The relative strength index ( RSI ) is a technical indicator used in the analysis of financial markets. It is intended to chart the current and historical strength or weakness of a stock or market based on the closing prices of a recent trading period. RSI movement above 50 indicates that more traders are buying assets than selling, and are driving the price up. If the RSI moves below 50, it shows that more traders are selling than buying, and are driving the price down.
This indicator uses EMA 200, RSI and parabolic SARS.
The order will be entered when 3 conditions are true
1. First reverse point uptrend of Parabolic SAR
2. The price is close above EMA 200
3. RSI is over 50.
This indicator has a function to take profit and stop loss level.
Stop loss level = First reverse point uptrend of Parabolic SAR .
Take profit level = 1:1.5
This indicator is just a tool for technical analysis . It shouldn't be used as the only indication of trade because it causes you to lose your money. You should use other indicators to analyze together.

TBT Stop Loss Hunting AlertPurpose:
The TBT Stop Loss Hunting Alert is a simple early warning system that indicates when Bitcoin could have unexpected volatility (in either direction) within a 24 to 48 hour time frame as you can see above (indicated by the red bar/column in the indicator lane). By knowing when there could be possible upcoming volatility for the price of Bitcoin, traders can take preventative measures to protect open positions to preserve profits.
Time Frame:
While you can view this indicator on any time frame, it was originally created with the 6-hour time frame in mind. Because of this, the indicator can be set to "same as symbol" (the indicator will adapt to any time frame you use) or "6 hours" (the original and intended time frame). Please understand that the alert will show "noise" (false positive signals) on faster (lower) time frames. This is another reason to keep the indicator on the 6-hour time frame in its settings.
Metrics:
The TBT Stop Loss Hunting Alert looks at sudden/unexpected changes in price action, volatility, and volume.
Realistic Expectations:
While this indicator is effective in alerting users when there could be sudden volatility for Bitcoin, note that there is no way to know which way Bitcoin will move after the alert is triggered. The frequency of alerts is few and far between, but in a way this is a good thing. When the signal is triggered, it is a great early warning system to remember to be careful for the next 24 to 48 hours.

OHO Trend Finder and Trailing Stop LossStudies Used:
We have used different type of moving averages and average true ranges in this indicator.
Usage:
It can be used for scalping and Intra-day trading. It works on all time frames and Scripts.
It provides easy to visualize multiple information:
1) It gives the correct Entry on Time.
2) Fake trends are shown on purple color of trend line .
3) It gives proper Exit on time. or Exit as per your own Risk Reward Ratio.
4) Easy Trailing Stop Loss as per trend line .
How to read OHO® Trend Finder and Trailing Stop Loss Indicator?
Trend line color:
Red = Sell side trailing
Green = Buy side trailing
Purple = No trade zone or Cautious Trade Zone
How to find Sideways?
If Price is above the UpTrend and it's showing a Red color, then it might be a sideways script.
And vice versa If Price is below the DownTrend and it's showing a Green color, then it might be a sideways script.
Recommendations:
Trade is recommended to be closed when price is below UpTrend line (in case of buy side trade) or it is above DownTrend line (in case of sell side trade)
What time frame should I use?
15 Minutes time-frame for Intraday and 1 Hour Time Frame for Swing Trading, But you can check different time-frames and scripts as per your requirements.
Disclaimer:
For any type of queries and suggesions kindly send us personal message.

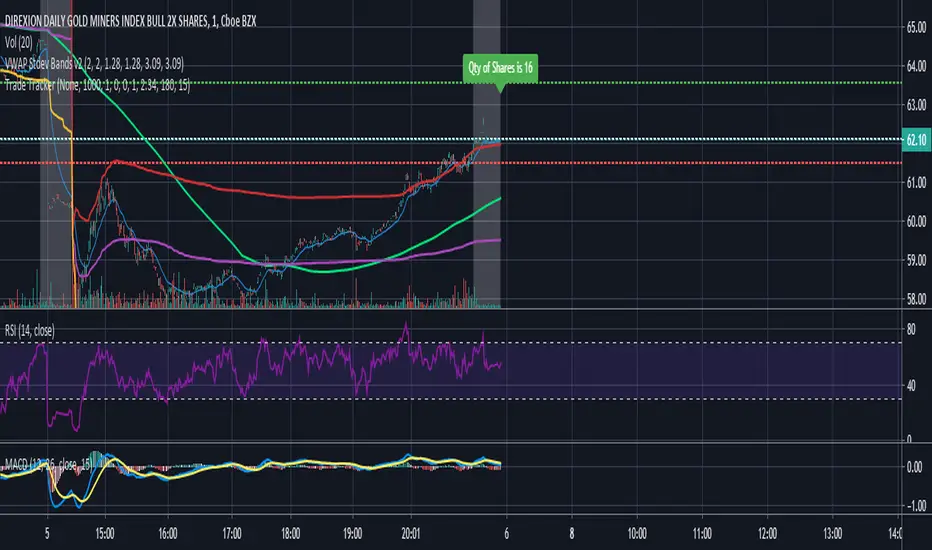
Trade Tracker - Real time stop loss and take profitTrade Tracker;
Key features
- Real time tracking of stop loss
- Real time tracking of Take Profit
- Real time tracking of break even point
- SMA integration
- EMA integration
Break even point calculated by doubling the single fee cost and adding stamp duty percentage.
Stop loss calculated by the customized percentage.
Take Profit calculated by the customized percentage.
Visually see how many shares you can buy. In the settings tab add your account balance. E.G 1000. You can then also add a portion size if you only want to trade with half your account. For this simply add 2 in the portion field. Alternatively add any multiplier you like.
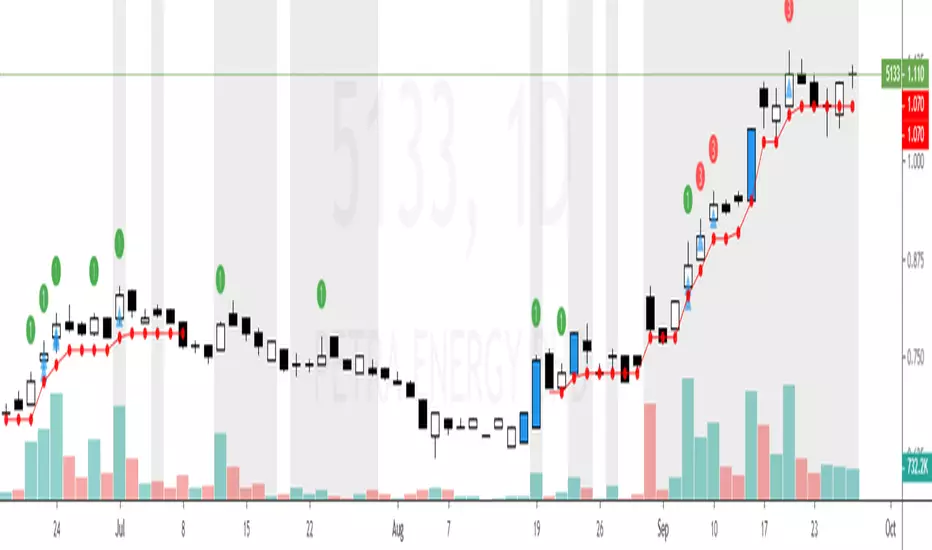
Flexta PVA Entry & Stop Loss V2This indicator used together with the result generated from FLEXTA PVA Alerts.
Upgrade to Version 2 with more user-friendly features.
It is a guideline to decide entry or exit position based on FLEXTA PVA trading rules.
User will easily understand each stock trend based on PVA phases, and it will help to improve the decision making before entry or exit.
Detail Indicator Description :
1. Green Circle with number 1 (Above Candle)
- PVA Stage 2 Priority 1
2. Orange Circle with number 2 (Above Candle)
- PVA Stage 2 Priority 2
3. Red Circle with number 3 (Above Candle)
- PVA Stage 3
4. Blue Candle Color (Candle Body)
- TPVA Top Stock
5. Red Circle with number 4 + Red Inverted Triangle (Below Candle)
- PVA Stage 4
6. Grey Background Pillar (Background)
- Momentum Detected
7. Red Circle (Below Candle)
- Redefined Stop Loss Suggestion
8. Red Line (Below Candle)
- Stop Loss Line reference
9. Cyan circle with star (Below Candle)
- PVA + RSI Oversold
10. Navy Blue Triangle (Below Candle)
- Swing Signal ( Follow the early signal )
11. Risk and Reward Panel (Above Candle)
- Cyan Color Panel - Low Risk
- Yellow Color Panel - Medium Risk
- Red Color Panel - High Risk
12. T Play Panel (Below Candle)
- T1 up to T9 Marking
13. S1 Top Stock Panel (Above Candle)
- Grey Color Panel with Remark

Stop Loss_Traders StreamHello Guys we created another tool to calculate your Risk / Stop Loss per Trade. This will automatically calculates the DATR and as per your Risk Input it will calculate and show Stop Loss Price and even it will draw a Red coloured Horizontal line for your reference. Before changing stock don't forget to make Zero @ "Distal Line of DZ / SZ". Please post if any recommendations.........

Flexta PVA Entry & Stop Loss V1Flexta PVA Entry Stop Loss V1
This indicator used together with result generated from Flexta PVA Scanner.
It is a guideline to decide entry or exit position based on Flexta PVA trading rules.
User will easily understand each stock trend based on PVA phases and it will help to improve the decision making before entry or exit.
How to Use :
1. Green Circle with number 1 (Above Candle)
- PVA Stage 2 Priority 1
2. Orange Circle with number 2 (Above Candle)
- PVA Stage 2 Priority 2
3. Red Circle with number 3 (Above Candle)
- PVA Stage 3
4. Blue Candle Color
- Top TPVA
5. Grey Background Pillar
- Momentum Detected
6. Red Circle (Below Candle)
- Stop Loss Suggestion
7. Red Line (Below Candle)
- Stop Loss trailing
8. Cyan circle with star (Below Candle)
- PVA + RSI Oversold
9. Blue Triangle (Below Candle)
- Entry Suggestion
10. Trading Guideline Panel
- Check list before making final decision to entry
ATR ChannelsATR Channels help you to identify where to place your stop-loss or trailing stop-loss based on price volatility, according to the Average True Range (ATR).

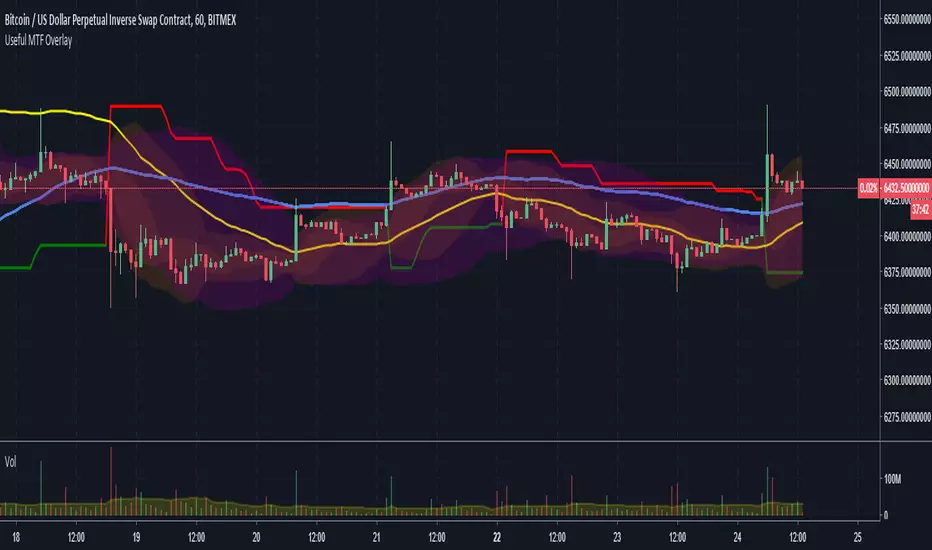
MTF Bollinger Bands, SuperTrend, TEMA Wave and ATR Stop LossThis script is a combination of useful overlay indicators that can be used for day trading or swing trading. You can use it for long term positions as well, but some tweaking may be required. I also added the multi time frame possibility for the majority of settings. This indicator gives you a lot of opportunities and trade setups. Default settings are made for day trading, using intraday time frames.
This script can display the following:
4 independent Bollinger Bands (MTF)
4 independent SuperTrends (MTF)
6 independent TEMAs (MTF)
ATR Stop loss for longs / shorts
Default settings display 3 Bollinger Bands, 2 TEMAs(I have found these two TEMAs particullarly useful, see screenshots below) and a signle SuperTrend.
Do not forget to always use a proper stop loss and risk management.
Here you can see the script in action in different markets:
BTC - BitMex - Setup before the drop from 7400 USD
BTC - BitMex - Setup before the drop from 8400 USD
BTC - BitMex - Setup before the pump to 7800 USD
BTC - BitMex - Setup before the pump to 6800 USD
All-in-One Solutions - Stop Loss Position CalculatorHello,
This indicator will calculate and plot your stop loss, according to your wallet size, order size, entry price, leverage and the pourcentage of risk that you want to consider.
Here is screenshot of the menu of the indicator :
imgur.com
The alert are also available if you desire to know if your stop loss is reached :
imgur.com
Please contact me in order to get access to this indicator. Please note that by subscribing to my offer, you will have access to all indicators I made and and the futur indicators I will develop according to the demand of the community.
Messages are welcome also in order to improve my indicators.
After subscribing, all indicators will be added into your under invitation indicators list or you can have a look on my Tradingview page :https://fr.tradingview.com/u/KenLeShim/#published-scripts
I hope my indicators will help you !

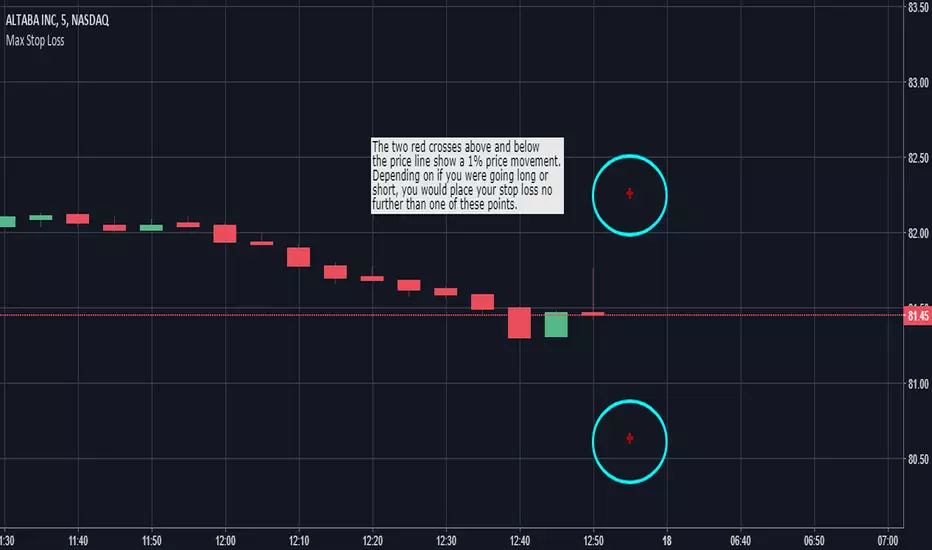
Max Stop Loss - Risk Management VisualizerThis indicator helps traders implement proper risk management in their trading. For example, let's say that you were trading a $1,000 account and didn't want to risk more than 1% of your account on any one trade. If you were placing $100 positions, you wouldn't want the price to move more than 10% against you (10% of $100 is $10, which is 1% of $1,000). So, assuming you were trading without any leverage, you would put "1000" into the "Max Stop Loss %" field in the format box and the indicator would display red crosses 10% above and below the current price of the market you are looking at. If you were going to take that same trade with 10x leverage, you would want to enter "100" into the indicator's format box and the red crosses would then plot themselves 1% above and below the current price.
"Max Stop Loss - Risk Management Visualizer" is able to show all the way down to a 0.01% price variation with no upper limit.
MavilimW and Stop Loss IndicatorMavlimW and Stop Loss Indicator scripts which have prepared by kivancfr3762, are merged .
kivancfr3762 hocanın önemli çalışmaları, mavilimW ve Stop Loss Indicator betiklerinin birleştirilmiş halidir.
