Quarterly Theory ICT 02 [TradingFinder] True Open Session 90 Min🔵 Introduction
The Quarterly Theory ICT indicator is an advanced analytical system built on ICT (Inner Circle Trader) concepts and fractal time. It divides time into four quarters (Q1, Q2, Q3, Q4), and is designed based on the consistent repetition of these phases across all trading timeframes (annual, monthly, weekly, daily, and even shorter trading sessions).
Each cycle consists of four distinct phases: the first phase (Q1) is the Accumulation phase, characterized by price consolidation; the second phase (Q2), known as Manipulation or Judas Swing, is marked by initial false movements indicating a potential shift; the third phase (Q3) is Distribution, where price volatility peaks; and the fourth phase (Q4) is Continuation/Reversal, determining whether the previous trend continues or reverses.
🔵 How to Use
The central concept of this strategy is the "True Open," which refers to the actual starting point of each time cycle. The True Open is typically defined at the beginning of the second phase (Q2) of each cycle. Prices trading above or below the True Open serve as a benchmark for predicting the market's potential direction and guiding trading decisions.
The practical application of the Quarterly Theory strategy relies on accurately identifying True Open points across various timeframes.
True Open points are defined as follows :
Yearly Cycle :
Q1: January, February, March
Q2: April, May, June (True Open: April Monthly Open)
Q3: July, August, September
Q4: October, November, December
Monthly Cycle :
Q1: First Monday of the month
Q2: Second Monday of the month (True Open: Daily Candle Open price on the second Monday)
Q3: Third Monday of the month
Q4: Fourth Monday of the month
Weekly Cycle :
Q1: Monday
Q2: Tuesday (True Open: Daily Candle Open Price on Tuesday)
Q3: Wednesday
Q4: Thursday
Daily Cycle :
Q1: 18:00 - 00:00 (Asian session)
Q2: 00:00 - 06:00 (True Open: Start of London Session)
Q3: 06:00 - 12:00 (NY AM)
Q4: 12:00 - 18:00 (NY PM)
90 Min Asian Session :
Q1: 18:00 - 19:30
Q2: 19:30 - 21:00 (True Open at 19:30)
Q3: 21:00 - 22:30
Q4: 22:30 - 00:00
90 Min London Session :
Q1: 00:00 - 01:30
Q2: 01:30 - 03:00 (True Open at 01:30)
Q3: 03:00 - 04:30
Q4: 04:30 - 06:00
90 Min New York AM Session :
Q1: 06:00 - 07:30
Q2: 07:30 - 09:00 (True Open at 07:30)
Q3: 09:00 - 10:30
Q4: 10:30 - 12:00
90 Min New York PM Session :
Q1: 12:00 - 13:30
Q2: 13:30 - 15:00 (True Open at 13:30)
Q3: 15:00 - 16:30
Q4: 16:30 - 18:00
Micro Cycle (22.5-Minute Quarters) : Each 90-minute quarter is further divided into four 22.5-minute sub-segments (Micro Sessions).
True Opens in these sessions are defined as follows :
Asian Micro Session :
True Session Open : 19:30 - 19:52:30
London Micro Session :
T rue Session Open : 01:30 - 01:52:30
New York AM Micro Session :
True Session Open : 07:30 - 07:52:30
New York PM Micro Session :
True Session Open : 13:30 - 13:52:30
By accurately identifying these True Open points across various timeframes, traders can effectively forecast the market direction, analyze price movements in detail, and optimize their trading positions. Prices trading above or below these key levels serve as critical benchmarks for determining market direction and making informed trading decisions.
🔵 Setting
Show True Range : Enable or disable the display of the True Range on the chart, including the option to customize the color.
Extend True Range Line : Choose how to extend the True Range line on the chart, with the following options:
None: No line extension
Right: Extend the line to the right
Left: Extend the line to the left
Both: Extend the line in both directions (left and right)
Show Table : Determines whether the table—which summarizes the phases (Q1 to Q4)—is displayed.
Show More Info : Adds additional details to the table, such as the name of the phase (Accumulation, Manipulation, Distribution, or Continuation/Reversal) or further specifics about each cycle.
🔵 Conclusion
The Quarterly Theory ICT, by dividing time into four distinct quarters (Q1, Q2, Q3, and Q4) and emphasizing the concept of the True Open, provides a structured and repeatable framework for analyzing price action across multiple time frames.
The consistent repetition of phases—Accumulation, Manipulation (Judas Swing), Distribution, and Continuation/Reversal—allows traders to effectively identify recurring price patterns and critical market turning points. Utilizing the True Open as a benchmark, traders can more accurately determine potential directional bias, optimize trade entries and exits, and manage risk effectively.
By incorporating principles of ICT (Inner Circle Trader) and fractal time, this strategy enhances market forecasting accuracy across annual, monthly, weekly, daily, and shorter trading sessions. This systematic approach helps traders gain deeper insight into market structure and confidently execute informed trading decisions.
Cari skrip untuk "smc"

Crystal Order BlockThe Crystal Order Block Indicator is a powerful tool designed to help traders identify key institutional order blocks with high precision. This indicator is ideal for traders following Smart Money Concepts (SMC) and Institutional Trading Strategies, providing clear insights into potential high-probability trade setups.
🔹 Key Features:
✔ Automatic Order Block Detection: Identifies valid bullish & bearish order blocks.
✔ Unmitigated Order Blocks Highlighted: Focuses on fresh order blocks for improved trade opportunities.
✔ Trend-Focused Trading: Works best when combined with market structure analysis.
✔ Multi-Timeframe Support: Suitable for scalping, swing trading, and intraday trading.
✔ Risk Management Enhancement: Helps traders refine entries and exits based on institutional price movements.
📈 How to Use the Crystal Order Block Indicator:
🔹 Identifying Order Blocks:
➡ The indicator automatically detects order blocks formed by institutional trading activity.
➡ Unmitigated order blocks are highlighted, indicating areas where price may react.
🔹 High-Probability Trade Setups:
➡ Buy Setup: Look for a bullish order block in an uptrend, confirming strength.
➡ Sell Setup: Identify a bearish order block in a downtrend for potential short trades.
🔹 Order Block Mitigation:
➡ The updated version filters out mitigated order blocks, allowing traders to focus on fresh trading opportunities.
📊 Best Practices & Timeframes:
🔸 Works on all timeframes, but higher accuracy is observed on M30 and above.
🔸 Best suited for Smart Money Trading, Institutional Trading, and Price Action Strategies.
🔸 Should be used with liquidity concepts and market structure analysis for enhanced precision.
⚠ Important Note:
This indicator is a technical tool designed to assist traders in market analysis. It does not guarantee success and should be used alongside proper risk management and trading discipline.

Multi-Timeframe Open LinesThe Multi-Timeframe Open Lines indicator is designed to help traders visualize key price levels at the open of specific time intervals. It draws horizontal lines at the open of 5-minute, 15-minute, 30-minute, and hourly candles, extending these lines to the start of the next respective interval. Traders can now control which timeframes are displayed and how many past opening lines are shown, ensuring a clean and organized chart.
Key Features:
Customizable Lines:
5-Minute Lines: Highlight the open of every 5-minute candle, ending at the start of the next 5-minute candle.
15-Minute Lines: Highlight the open of every 15-minute candle, ending at the start of the next 15-minute candle.
30-Minute Lines: Highlight the open of every 30-minute candle, ending at the start of the next 30-minute candle.
Hourly Lines: Highlight the open of every hourly candle, ending at the start of the next hourly candle.
Each timeframe's lines can be customized in terms of color, line style, and thickness.
Toggle Options:
Easily turn on or off the display of lines for each timeframe (5m, 15m, 30m, 1h) using checkboxes in the settings.
User-Defined Limits:
Control the number of past opening lines displayed for each timeframe (5m, 15m, 30m, 1h).
Prevents chart clutter by limiting the number of visible lines.
Multi-Timeframe Analysis:
Enables traders to analyze price action across multiple timeframes simultaneously, providing a clearer picture of market structure and key levels.
User-Friendly Inputs:
Easy-to-use settings for customizing line appearance and behavior, ensuring the indicator fits seamlessly into any trading strategy.
How to Use:
Apply the indicator to your chart to visualize the open price levels for 5-minute, 15-minute, 30-minute, and hourly candles.
Use the lines as dynamic support/resistance levels or to identify potential breakout/breakdown points.
Customize the colors, styles, and the number of visible lines to match your chart theme or trading preferences.
Toggle specific timeframes on or off to focus on the most relevant price levels.
Ideal For:
Traders who use multi-timeframe analysis.
Those who rely on key price levels for decision-making.
Anyone looking to enhance their chart with clear, customizable reference lines while avoiding clutter.

Peak Reaction Zones [BigBeluga]Peak Reaction Zones is an advanced Smart Money Concept (SMC) indicator that identifies the most recent swing high and swing low zones, helping traders determine premium and discount areas for optimal trade positioning.
🔵 Key Features:
Swing High & Low Zones:
Automatically detects the latest swing high and swing low levels.
Helps traders identify key reaction points where price is likely to respond.
Premium & Discount Concept:
The high zone represents a premium area, where price is overextended and may reverse.
The low zone represents a discount area, where price is undervalued and may bounce.
The midline dynamically marks the equilibrium of the range.
Adjustable Zone Width:
Users can fine-tune the width of the zones to match their trading style.
Wider zones capture broader reaction ranges, while narrower zones focus on precise levels.
Zone Retest Signals:
Blue markers appear when price retests the lower reaction zone, signaling potential support.
Orange markers appear when price retests the upper reaction zone, indicating possible resistance.
Price Labels for Key Levels:
Displays the price value of the swing high, swing low, and midline for quick reference.
Helps traders recognize major reaction points at a glance.
🔵 Usage:
Smart Money Trading: Utilize the premium and discount concept to align trades with institutional order flow.
Zone Reactions: Watch for price tests of reaction zones and use the retest signals to confirm potential reversals.
Midline Confirmation: If price holds above or below the midline, it can indicate directional bias.
Scalping & Swing Trading: Short-term traders can look for zone rejections, while swing traders can use the levels for trend continuation setups.
Peak Reaction Zones is a must-have tool for traders looking to trade with Smart Money Concepts, allowing for precise entries and exits based on key liquidity areas and market structure.

Trading ChecklistTrading Checklist Indicator - Your Trading Plan Companion
A clean and efficient visual checklist to maintain trading discipline and consistency. This indicator helps traders follow their trading plan systematically by providing an easy-to-use checklist of key confirmation points.
Features:
- Visual checklist with clear green/red status indicators
- Clean, non-intrusive interface
- Real-time status updates
- Easy toggle controls for each item
Key Checkpoints:
1. HTF Structure Analysis
2. Order Flow Confirmation
3. SD/OB/FVG (HTF POI) Identification
4. Liquidity Grab Verification
5. Reversal Alignment Check
Final Confirmations:
- Trade Validity Check
- POI & Stop Loss Safety
- Set and Forget Status
How to Use:
1. Add the indicator to your chart
2. Use the Settings panel to toggle each condition
3. Green dots indicate confirmed conditions
4. Red dots show pending confirmations
5. Verify all conditions before executing trades
Note: This indicator helps maintain trading discipline but should be used alongside proper technical and fundamental analysis.
Tags: #TradingChecklist #RiskManagement #TradingPlan #Trading #Technical #Strategy #Discipline

Midnight Opening Ranges[TDL]Midnight Opening Range Indicator for TradingView
Description:
The Midnight Opening Range Indicator as taught by Micheal J. Huddleston is a powerful tool designed for traders who want to analyze price action during the critical midnight to 00:30 timeframe. This indicator highlights the opening range for both the current day and previous days, providing valuable insights into market behavior during this specific period. It also calculates and displays deviations from the opening range, as well as allows for custom opening prices to be set, making it highly adaptable to your trading strategy.
Key Features:
Today's Opening Range (00:00 - 00:30):
The indicator plots the high and low of the price range between 00:00 and 00:30 for the current day.
This range is highlighted on the chart, making it easy to identify the initial market movement and potential support/resistance levels.
Previous Days' Opening Ranges:
The indicator also displays the opening ranges for previous days, allowing you to how price reacts off of previous days ranges not just todays.
This feature helps in identifying patterns or recurring behaviors in the market in which price uses this range and previous days ranges throughout the trading day.
Deviations from the Opening Range:
The indicator calculates and plots deviations from the opening range, both above and below the high and low of the range.
These deviations can be used to identify potential breakout or reversal points, giving you an edge in anticipating market moves.
Custom Opening Prices:
The indicator allows you to set custom opening prices, which can be useful if you want to analyze the market based on a specific reference point rather than the default midnight opening.
This feature is particularly useful for traders who follow alternative trading sessions or have specific entry criteria.
Customizable Visuals:
The indicator offers customizable colors and styles for the opening range, deviations, and custom opening prices, allowing you to tailor the visual representation to your preferences.
How to Use:
Identify Key Levels: Use the highlighted opening range to identify key support and resistance levels for the day.
Monitor Deviations: Watch for price movements beyond the opening range deviations to spot potential breakouts or reversals.
Previous Range Data: Use previous days to identify areas of potential AMD.
Set Custom Prices: Adjust the custom opening price to align with your trading strategy or session preferences.
Ideal For:
Day Traders: Perfect for traders who focus on the early hours of the market to capture initial momentum.
Swing Traders: Useful for identifying key levels that could influence price action over several days.
Algorithmic Traders: Can be integrated into automated trading systems to trigger trades based on the opening range and deviations.
Conclusion:
The Midnight Opening Range Indicator is an essential tool for any trader looking to gain an edge in the market by focusing on the critical midnight to 00:30 timeframe. With its ability to highlight opening ranges, calculate deviations, and accommodate custom opening prices, this indicator provides a comprehensive view of market behavior during this pivotal period. Whether you're a day trader, swing trader, or algorithmic trader, this indicator will help you make more informed trading decisions.

One Trading Setup for Life ICT [TradingFinder] Sweep Session FVG🔵 Introduction
ICT One Trading Setup for Life is a trading strategy based on liquidity and market structure shifts, utilizing the PM Session Sweep to determine price direction. In this strategy, the market first forms a price range during the PM Session (from 13:30 to 16:00 EST), which includes the highest high (PM Session High) and lowest low (PM Session Low).
In the next session, the price first touches one of these levels to trigger a Liquidity Hunt before confirming its trend by breaking the Change in State of Delivery (CISD) Level. After this confirmation, the price retraces toward a Fair Value Gap (FVG) or Order Block (OB), which serve as the best entry points in alignment with liquidity.
In financial markets, liquidity is the primary driver of price movement, and major market participants such as institutional investors and banks are constantly seeking liquidity at key levels. This process, known as Liquidity Hunt or Liquidity Sweep, occurs when the price reaches an area with a high concentration of orders, absorbs liquidity, and then reverses direction.
In this setup, the PM Session range acts as a trading framework, where its highs and lows function as key liquidity zones that influence the next session’s price movement. After the New York market opens at 9:30 EST, the price initially breaks one of these levels to capture liquidity.
However, for a trend shift to be confirmed, the CISD Level must be broken.
Once the CISD Level is breached, the price retraces toward an FVG or OB, which serve as optimal trade entry points.
Bullish Setup :
Bearish Setup :
🔵 How to Use
In this strategy, the PM Session range is first identified, which includes the highest high (PM Session High) and lowest low (PM Session Low) between 13:30 and 16:00 EST. In the following session, the price touches one of these levels for a Liquidity Hunt, followed by a break of the Change in State of Delivery (CISD) Level. The price then retraces toward a Fair Value Gap (FVG) or Order Block (OB), creating a trading opportunity.
This process can occur in two scenarios : bearish and bullish setups.
🟣 Bullish Setup
In a bullish scenario, the PM Session High and PM Session Low are identified. In the following session, the price first breaks the PM Session Low, absorbing liquidity. This process results in a Fake Breakout to the downside, misleading retail traders into taking short positions.
After the Liquidity Hunt, the CISD Level is broken, confirming a trend reversal. The price then retraces toward an FVG or OB, offering an optimal long entry opportunity.
The initial take-profit target is the PM Session High, but if higher timeframe liquidity levels exist, extended targets can be set.
The stop-loss should be placed below the Fake Breakout low or the first candle of the FVG.
🟣 Bearish Setup
In a bearish scenario, the market first defines its PM Session High and PM Session Low. In the next session, the price initially breaks the PM Session High, triggering a Liquidity Hunt. This movement often causes a Fake Breakout, misleading retail traders into taking incorrect positions.
After absorbing liquidity, the CISD Level breaks, indicating a shift in market structure. The price then retraces toward an FVG or OB, offering the best short entry opportunity.
The initial take-profit target is the PM Session Low, but if additional liquidity exists on higher timeframes, lower targets can be considered.
The stop-loss should be placed above the Fake Breakout high or the first candle of the FVG.
🔵 Setting
CISD Bar Back Check : The Bar Back Check option enables traders to specify the number of past candles checked for identifying the CISD Level, enhancing CISD Level accuracy on the chart.
Order Block Validity : The number of candles that determine the validity of an Order Block.
FVG Validity : The duration for which a Fair Value Gap remains valid.
CISD Level Validity : The duration for which a CISD Level remains valid after being broken.
New York PM Session : Defines the PM Session range from 13:30 to 16:00 EST.
New York AM Session : Defines the AM Session range from 9:30 to 16:00 EST.
Refine Order Block : Enables finer adjustments to Order Block levels for more accurate price responses.
Mitigation Level OB : Allows users to set specific reaction points within an Order Block, including: Proximal: Closest level to the current price. 50% OB: Midpoint of the Order Block. Distal: Farthest level from the current price.
FVG Filter : The Judas Swing indicator includes a filter for Fair Value Gap (FVG), allowing different filtering based on FVG width: FVG Filter Type: Can be set to "Very Aggressive," "Aggressive," "Defensive," or "Very Defensive." Higher defensiveness narrows the FVG width, focusing on narrower gaps.
Mitigation Level FVG : Like the Order Block, you can set price reaction levels for FVG with options such as Proximal, 50% OB, and Distal.
Demand Order Block : Enables or disables bullish Order Block.
Supply Order Block : Enables or disables bearish Order Blocks.
Demand FVG : Enables or disables bullish FVG.
Supply FVG : Enables or disables bearish FVGs.
Show All CISD : Enables or disables the display of all CISD Levels.
Show High CISD : Enables or disables high CISD levels.
Show Low CISD : Enables or disables low CISD levels.
🔵 Conclusion
The ICT One Trading Setup for Life is a liquidity-based strategy that leverages market structure shifts and precise entry points to identify high-probability trade opportunities. By focusing on PM Session High and PM Session Low, this setup first captures liquidity at these levels and then confirms trend shifts with a break of the Change in State of Delivery (CISD) Level.
Entering a trade after a retracement to an FVG or OB allows traders to position themselves at optimal liquidity levels, ensuring high reward-to-risk trades. When used in conjunction with higher timeframe bias, order flow, and liquidity analysis, this strategy can become one of the most effective trading methods within the ICT Concept framework.
Successful execution of this setup requires risk management, patience, and a deep understanding of liquidity dynamics. Traders can enhance their confidence in this strategy by conducting extensive backtesting and analyzing past market data to optimize their approach for different assets.

Scalping trading system based on 4 ema linesScalping Trading System Based on 4 EMA Lines
Overview:
This is a scalping trading strategy built on signals from 4 EMA moving averages: EMA(8), EMA(12), EMA(24) and EMA(72).
Conditions:
- Time frame: H1 (1 hour).
- Trading assets: Applicable to major currency pairs with high volatility
- Risk management: Use a maximum of 1-2% of capital for each transaction. The order holding time can be from a few hours to a few days, depending on the price fluctuation amplitude.
Trading rules:
Determine the main trend:
Uptrend: EMA(8), EMA(12) and EMA(24) are above EMA(72).
Downtrend: EMA(8), EMA(12) and EMA(24) are below EMA(72).
Trade in the direction of the main trend** (buy in an uptrend and sell in a downtrend).
Entry conditions:
- Only trade in a clearly trending market.
Uptrend:
- Wait for the price to correct to the EMA(24).
- Enter a buy order when the price closes above the EMA(24).
- Place a stop loss below the bottom of the EMA(24) candle that has just been swept.
Downtrend:
- Wait for the price to correct to the EMA(24).
- Enter a sell order when the price closes below the EMA(24).
- Place a stop loss above the top of the EMA(24) candle that has just been swept.
Take profit and order management:
- Take profit when the price moves 20 to 40 pips in the direction of the trade.
Use Trailing Stop to optimize profits instead of setting a fixed Take Profit.
Note:
- Do not trade within 30 minutes before and after the announcement of important economic news, as the price may fluctuate abnormally.
Additional filters:
To increase the success rate and reduce noise, this strategy uses additional conditions:
1. The price is calculated only when the candle closes (no repaint).
2. When sweeping through EMA(24), the price needs to close above EMA(24).
3. The closing price must be higher than 50% of the candle's length.
4. **The bottom of the candle sweeping through EMA(24) must be lower than the bottom of the previous candle (liquidity sweep).
---
Alert function:
When the EMA(24) sweep conditions are met, the system will trigger an alert if you have set it up.
- Entry point: The closing price of the candle sweeping through EMA(24).
- Stop Loss:
- Buy Order: Place at the bottom of the sweep candle.
- Sell Order: Place at the top of the sweep candle.
---
Note:
This strategy is designed to help traders identify profitable trading opportunities based on trends. However, no strategy is 100% guaranteed to be successful. Please test it thoroughly on a demo account before using it.

2022 Model ICT Entry Strategy [TradingFinder] One Setup For Life🔵 Introduction
The ICT 2022 model, introduced by Michael Huddleston, is an advanced trading strategy rooted in liquidity and price imbalance, where time and price serve as the core elements. This ICT 2022 trading strategy is an algorithmic approach designed to analyze liquidity and imbalances in the market. It incorporates concepts such as Fair Value Gap (FVG), Liquidity Sweep, and Market Structure Shift (MSS) to help traders identify liquidity movements and structural changes in the market, enabling them to determine optimal entry and exit points for their trades.
This Full ICT Day Trading Model empowers traders to pinpoint the Previous Day High/Low as well as the highs and lows of critical sessions like the London and New York sessions. These levels act as Liquidity Zones, which are frequently swept prior to a market structure shift (MSS) or a retracement to areas such as Optimal Trade Entry (OTE).
Bullish :
Bearish :
🔵 How to Use
The ICT 2022 model is a sophisticated trading strategy that focuses on identifying key liquidity levels and price movements. It operates based on two main principles. In the first phase, the price approaches liquidity zones and sweeps critical levels such as the previous day’s high or low and key session levels.
This movement is known as a Liquidity Sweep. In the second phase, following the sweep, the price retraces to areas like the FVG (Fair Value Gap), creating ideal entry points for trades. Below is a detailed explanation of how to apply this strategy in bullish and bearish setups.
🟣 Bullish ICT 2022 Model Setup
To use the ICT 2022 model in a bullish setup, start by identifying the Previous Day High/Low or key session levels, such as those of the London or New York sessions. In a bullish setup, the price usually moves downward first, sweeping the Liquidity Low. This move, known as a Liquidity Sweep, reflects the collection of buy orders by major market participants.
After the liquidity sweep, the price should shift market structure and start moving upward; this shift, referred to as Market Structure Shift (MSS), signals the beginning of an upward trend. Following MSS, areas like FVG, located within the Discount Zone, are identified. At this stage, the trader waits for the price to retrace to these zones. Once the price returns, a long trade is executed.
Finally, the stop-loss should be set below the liquidity low to manage risk, while the take-profit target is usually placed above the previous day’s high or other identified liquidity levels. This structure enables traders to take advantage of the upward price movement after the liquidity sweep.
🟣 Bearish ICT 2022 Model Setup
To identify a bearish setup in the ICT 2022 model, begin by marking the Previous Day High/Low or key session levels, such as the London or New York sessions. In this scenario, the price typically moves upward first, sweeping the Liquidity High. This move, known as a Liquidity Sweep, signifies the collection of sell orders by key market players.
After the liquidity sweep, the price should shift market structure downward. This movement, called the Market Structure Shift (MSS), indicates the start of a downtrend. Following MSS, areas such as FVG, found within the Premium Zone, are identified. At this stage, the trader waits for the price to retrace to these areas. Once the price revisits these zones, a short trade is executed.
In this setup, the stop-loss should be placed above the liquidity high to control risk, while the take-profit target is typically set below the previous day’s low or another defined liquidity level. This approach allows traders to capitalize on the downward price movement following the liquidity sweep.
🔵 Settings
Swing period : You can set the swing detection period.
Max Swing Back Method : It is in two modes "All" and "Custom". If it is in "All" mode, it will check all swings, and if it is in "Custom" mode, it will check the swings to the extent you determine.
Max Swing Back : You can set the number of swings that will go back for checking.
FVG Length : Default is 120 Bar.
MSS Length : Default is 80 Bar.
FVG Filter : This refines the number of identified FVG areas based on a specified algorithm to focus on higher quality signals and reduce noise.
Types of FVG filters :
Very Aggressive Filter: Adds a condition where, for an upward FVG, the last candle's highest price must exceed the middle candle's highest price, and for a downward FVG, the last candle's lowest price must be lower than the middle candle's lowest price. This minimally filters out FVGs.
Aggressive Filter: Builds on the Very Aggressive mode by ensuring the middle candle is not too small, filtering out more FVGs.
Defensive Filter: Adds criteria regarding the size and structure of the middle candle, requiring it to have a substantial body and specific polarity conditions, filtering out a significant number of FVGs.
Very Defensive Filter: Further refines filtering by ensuring the first and third candles are not small-bodied doji candles, retaining only the highest quality signals.
🔵 Conclusion
The ICT 2022 model is a comprehensive and advanced trading strategy designed around key concepts such as liquidity, price imbalance, and market structure shifts (MSS). By focusing on the sweep of critical levels such as the previous day’s high/low and important trading sessions like London and New York, this strategy enables traders to predict market movements with greater precision.
The use of tools like FVG in this model helps traders fine-tune their entry and exit points and take advantage of bullish and bearish trends after liquidity sweeps. Moreover, combining this strategy with precise timing during key trading sessions allows traders to minimize risk and maximize returns.
In conclusion, the ICT 2022 model emphasizes the importance of time and liquidity, making it a powerful tool for both professional and novice traders. By applying the principles of this model, you can make more informed trading decisions and seize opportunities in financial markets more effectively.

Auto Wyckoff Schematic [by DanielM]This indicator is designed to automatically detect essential components of Wyckoff schematics. This tool aims to capture the critical phases of liquidity transfer from weak to strong hands, occurring before a trend reversal. While the Wyckoff method is a comprehensive and a very nuanced approach, every Wyckoff schematic is unique, making it impractical to implement all its components without undermining the detection of the pattern. Consequently, this script focuses on the essential elements critical to identifying these schematics effectively.
Key Features:
Swing Detection Sensitivity:
The sensitivity of swing detection is adjustable through the input parameter. This parameter controls the number of past bars analyzed to determine swing highs and lows, allowing users to fine-tune detection based on market volatility and timeframes.
Pattern Detection Logic:
Accumulation Schematic:
Detects consecutive lower swing lows, representing phases like Selling Climax (SC) and Spring, which often precede a trend reversal upward. After the final low is identified, a higher high is detected to confirm the upward trend initiation.
Labeled Key Points:
SC: Selling Climax, marking the beginning of the accumulation zone.
ST: Secondary Test during the schematic.
ST(b): Secondary Test in phase B.
Spring: The lowest point in the schematic, signaling a final liquidity grab.
SOS: Sign of Strength, confirming a bullish breakout.
The schematic is outlined visually with a rectangle to highlight the price range.
Distribution Schematic:
Detects consecutive higher swing highs, which indicate phases such as Buying Climax (BC) and UTAD, often leading to a bearish reversal. After the final high, a lower low is detected to confirm the downward trend initiation.
Labeled Key Points:
BC: Buying Climax, marking the beginning of the distribution zone.
ST: Secondary Test during the schematic.
UT: Upthrust.
UTAD: Upthrust After Distribution, signaling the final upward liquidity grab before a bearish trend.
SOW: Sign of Weakness, confirming a bearish breakout.
The schematic is visually outlined with a rectangle to highlight the price range.
Notes:
Simplification for Practicality: Due to the inherent complexity and variability of Wyckoff schematics, the indicator focuses only on the most essential features—liquidity transfer and key reversal signals.
Limitations: The tool does not account for all components of Wyckoff's method (e.g., minor phases or nuanced volume analysis) to maintain clarity and usability.
Unique Behavior: Every Wyckoff schematic is different, and this tool is designed to provide a simplified, generalized approach to detecting these unique patterns.

One Shot One Kill ICT [TradingFinder] Liquidity MMXM + CISD OTE🔵 Introduction
The One Shot One Kill trading setup is one of the most advanced methods in the field of Smart Money Concept (SMC) and ICT. Designed with a focus on concepts such as Liquidity Hunt, Discount Market, and Premium Market, this strategy emphasizes precise Price Action analysis and market structure shifts. It enables traders to identify key entry and exit points using a structured Trading Model.
The core process of this setup begins with a Liquidity Hunt. Initially, the price targets areas like the Previous Day High and Previous Day Low to absorb liquidity. Once the Change in State of Delivery(CISD)is broken, the market structure shifts, signaling readiness for trade entry. At this stage, Fibonacci retracement levels are drawn, and the trader enters a position as the price retraces to the 0.618 Fibonacci level.
Part of the Smart Money approach, this setup combines liquidity analysis with technical tools, creating an opportunity for traders to enter high-accuracy trades. By following this setup, traders can identify critical market moves and capitalize on reversal points effectively.
Bullish :
Bearish :
🔵 How to Use
The One Shot One Kill setup is a structured and advanced trading strategy based on Liquidity Hunt, Fibonacci retracement, and market structure shifts (CISD). With a focus on precise Price Action analysis, this setup helps traders identify key market movements and plan optimal trade entries and exits. It operates in two scenarios: Bullish and Bearish, each with distinct steps.
🟣 Bullish One Shot One Kill
In the Bullish scenario, the process starts with the price moving toward the Previous Day Low, where liquidity is absorbed. At this stage, retail sellers are trapped as they enter short trades at lower levels. Following this, the market reverses upward and breaks the CISD, signaling a shift in market structure toward bullishness.
Once this shift is identified, traders draw Fibonacci levels from the lowest point to the highest point of the move. When the price retraces to the 0.618 Fibonacci level, conditions for a buy position are met. The target for this trade is typically the Previous Day High or other significant liquidity zones where major buyers are positioned, offering a high probability of price reversal.
🟣 Bearish One Shot One Kill
In the Bearish scenario, the price initially moves toward the Previous Day High to absorb liquidity. Retail buyers are trapped as they enter long trades near the highs. After the liquidity hunt, the market reverses downward, breaking the CISD, which signals a bearish shift in market structure. Following this confirmation, Fibonacci levels are drawn from the highest point to the lowest point of the move.
When the price retraces to the 0.618 Fibonacci level, a sell position is initiated. The target for this trade is usually the Previous Day Low or other key liquidity zones where major sellers are active.
This setup provides a precise and logical framework for traders to identify market movements and enter trades at critical reversal points.
🔵 Settings
🟣 CISD Logical settings
Bar Back Check : Determining the return of candles to identify the CISD level.
CISD Level Validity : CISD level validity period based on the number of candles.
🟣 LIQUIDITY Logical settings
Swing period : You can set the swing detection period.
Max Swing Back Method : It is in two modes "All" and "Custom". If it is in "All" mode, it will check all swings, and if it is in "Custom" mode, it will check the swings to the extent you determine.
Max Swing Back : You can set the number of swings that will go back for checking.
🟣 CISD Display settings
Displaying or not displaying swings and setting the color of labels and lines.
🟣 LIQUIDITY Display settings
Displaying or not displaying swings and setting the color of labels and lines.
🔵 Conclusion
The One Shot One Kill setup is one of the most effective and well-structured trading strategies for identifying and capitalizing on key market movements. By incorporating concepts such as Liquidity Hunt, CISD, and Fibonacci retracement, this setup allows traders to enter trades with high precision at optimal points.
The strategy emphasizes detailed Price Action analysis and the identification of Smart Money behavior, helping traders to execute successful trades against the general market trend.
With a focus on identifying liquidity in the Previous Day High and Low and aligning it with Fibonacci retracement levels, this setup provides a robust framework for entering both bullish and bearish trades.
The combination of liquidity analysis and Fibonacci retracement at the 0.618 level enables traders to minimize risk and exploit major market moves effectively.
Ultimately, success with the One Shot One Kill setup requires practice, patience, and strict adherence to its rules. By mastering its concepts and focusing on high-probability setups, traders can enhance their decision-making skills and build a sustainable and professional trading approach.

US30 Q4_trade _levels_Jan2025updated description and use
US30 Trade Levels.plus 50% take profit levels
this indicator is based on the US30 quarterly theory level strategy
the difference here is that the zones have been zoom'd out for the H2 view for oversight and M30 as application theory to the Q4 levels.
The Q4 levels are spaced and calculated 385 pips apart, and also span within the daily ADR range for US30.
so these are zones that has proven to be valid going back as far as Nov2022
these are pass through levels, to together with other confluences like order blocks and or breaker blocks, will give you a guideline as to expect a valid zone of interest.
USE this indicator in conjunction with an SMC point of view to identify OB & CHOCH

Golden Time ErfanThe "Golden Time" Indicator is a custom-built TradingView tool designed to assist traders by highlighting two critical trading time windows: the New York session open and a specific strategy-based time known as Golden Time.

CANDLE RANGE THEORY (H1 Only)Hello traders.
This indicator identifies CRT candles
-Each candle is a range.
-Each candle has its own po3.
-Focus on specific times of the day. By recognizing the importance of time and price, we can capture high-quality trades. Together with HTF PD array, Look for 4-hour candles forming at specific times of the day. (1am - 5am - 9am EST)
-After the 1st candle, wait for the 2nd candle to clear the high/low of the 1st candle and then close inside the 1st candle range at a specific time (1-5-9) and look for entries in the LTF
Why choose 1 5 9 hours EST?
### **1. 1:00 AM (EST)**
- **Trading Session:** This is the time between the Tokyo (Asian) session and the Sydney (Australian) session. The Asian market is very active.
- **Characteristics:**
- Liquidity: Moderate, as only the Asian market is active.
- Volatility: Pairs involving JPY (Japanese Yen), AUD (Australian Dollar), and NZD (New Zealand Dollar) tend to have higher volatility.
- Trading Opportunities: Suitable for traders who like to trade trends or news in the Asian region.
- **Note:** Volatility may be lower than the London or New York session.
### **2. 5:00 AM (EST)**
- **Trading Session:** This is the time near the end of the Tokyo session and the London (European) session is about to open.
- **Characteristics:**
- Liquidity: Starts to increase due to the preparation of the European market.
- Volatility: This is the time between two trading sessions, there can be strong fluctuations, especially in major currency pairs such as EUR/USD, GBP/USD.
- Trading opportunities: Suitable for breakout trading strategies when liquidity increases.
- **Note:** The overlap between Tokyo and London can cause sudden fluctuations.
### **3. 9:00 AM (EST)**
- **Trading sessions:** This time is within the London session and near the beginning of the New York session.
- **Characteristics:**
- Liquidity: Very high, as this is the period between the two largest sessions – London and New York.
- Volatility: Extremely strong, especially for major currency pairs such as EUR/USD, GBP/USD, USD/JPY.
- Trading opportunities: Suitable for both news trading and trend trading, as this is the time when a lot of economic data is released (usually from the US or the European region).
- **Note:** High volatility can bring big profits, but also comes with high risks.
### **Summary of effects:**
- **1 AM (EST):** Moderate volatility, focusing on Asian currency pairs.
- **5 AM (EST):** Increased liquidity and volatility, suitable for breakout trading.
- **9 AM (EST):** High volatility and high liquidity, the best time for Forex trading.
==> How to trade, when the high/low of CRT is swept, move to LTF to wait for confirmation to enter the order
Only sell at high level and buy at discount price.
Find CE at specific important time. Trading CRT with HTF direction has better win rate.
The more inside bars, the higher the probability.
Place a partial and Move breakeven at 50% range.
Do a backtest and post your chart.

faiz MACDMACD: Moving Average Convergence Divergence
The Moving Average Convergence Divergence (MACD) is a popular momentum indicator used in technical analysis to gauge the strength, direction, and potential reversal points of a trend in a financial asset's price movement. Developed by Gerald Appel in the late 1970s, MACD is particularly favored by traders for its ability to capture both trend-following and momentum aspects of price behavior.
Components of the MACD
The MACD is derived from two exponential moving averages (EMAs) of a security's price:
MACD Line: This is the difference between the 12-day and 26-day EMAs. The shorter 12-day EMA reacts more quickly to price changes, while the 26-day EMA smooths out price fluctuations, offering a longer-term perspective.
Formula: MACD Line = 12-day EMA - 26-day EMA
Signal Line: This is the 1-day EMA of the MACD Line itself. The signal line is used to generate buy and sell signals when it crosses the MACD line.
Formula: Signal Line = 1-day EMA of the MACD Line
MACD Histogram: The histogram represents the difference between the MACD Line and the Signal Line. It is displayed as bars that oscillate above and below a zero line, helping to visualize the convergence or divergence between the two lines.
Formula: Histogram = MACD Line - Signal Line
Interpretation of MACD
The MACD indicator is used to identify potential buy and sell signals based on the following observations:
MACD Line and Signal Line Crossovers:
Bullish Crossover: A buy signal occurs when the MACD Line crosses above the Signal Line. This suggests that the momentum is shifting in favor of the bulls, indicating a potential upward price movement.
Bearish Crossover: A sell signal occurs when the MACD Line crosses below the Signal Line. This suggests a bearish trend may be emerging, signaling a potential downward movement.
Divergence:
Bullish Divergence: Occurs when the price of the asset is making new lows, but the MACD is forming higher lows. This suggests that the downward momentum is weakening and a potential reversal to the upside may be imminent.
Bearish Divergence: Occurs when the price is making new highs, but the MACD is forming lower highs. This suggests that the upward momentum is weakening and a reversal to the downside may occur.
Only use it in timeframe m1, and solely use for XAUUSD pair.
Advisable to use it as a confirmation with other indicator such as
BBMA, SMC, SUPPORT RESISTANCE, SUPPLY AND DEMAND.
how to use :
MA 5 Crossing above MA9, will generate BUY signals
MA 5 Crossing below MA9, will generate SELL signals
Trade at your own SKILLS.
I dont mind people using this script for free.
All I want is just prayer for me and my family success.
Thank You and Have a nice and pleasant day :-)

XAMD/AMDX ICT 01 [TradingFinder] SMC Quarterly Theory Cycles🔵 Introduction
The XAMD/AMDX strategy, combined with the Quarterly Theory, forms the foundation of a powerful market structure analysis. This indicator builds upon the principles of the Power of 3 strategy introduced by ICT, enhancing its application by incorporating an additional phase.
By extending the logic of Power of 3, the XAMD/AMDX tool provides a more detailed and comprehensive view of daily market behavior, offering traders greater precision in identifying key movements and opportunities
This approach divides the trading day into four distinct phases : Accumulation (19:00 - 01:00 EST), Manipulation (01:00 - 07:00 EST), Distribution (07:00 - 13:00 EST), and Continuation or Reversal (13:00 - 19:00 EST), collectively known as AMDX.
Each phase reflects a specific market behavior, providing a structured lens to interpret price action. Building on the fractal nature of time in financial markets, the Quarterly Theory introduces the Four Quarters Method, where a currency pair’s price range is divided into quarters.
These divisions, known as quarter points, highlight critical levels for analyzing and predicting market dynamics. Together, these principles allow traders to align their strategies with institutional trading patterns, offering deeper insights into market trends
🔵 How to Use
The AMDX framework provides a structured approach to understanding market behavior throughout the trading day. Each phase has its own characteristics and trading opportunities, allowing traders to align their strategies effectively. To get the most out of this tool, understanding the dynamics of each phase is essential.
🟣 Accumulation
During the Accumulation phase (19:00 - 01:00 EST), the market is typically quiet, with price movements confined to a narrow range. This phase is where institutional players accumulate their positions, setting the stage for future price movements.
Traders should use this time to study price patterns and prepare for the next phases. It’s a great opportunity to mark key support and resistance zones and set alerts for potential breakouts, as the low volatility makes immediate trading less attractive.
🟣 Manipulation
The Manipulation phase (01:00 - 07:00 EST) is often marked by sharp and deceptive price movements. Institutions create false breakouts to trigger stop-losses and trap retail traders into the wrong direction. Traders should remain cautious during this phase, focusing on identifying the areas of liquidity where these traps occur.
Watching for price reversals after these false moves can provide excellent entry opportunities, but patience and confirmation are crucial to avoid getting caught in the manipulation.
🟣 Distribution
The Distribution phase (07:00 - 13:00 EST) is where the day’s dominant trend typically emerges. Institutions execute large trades, resulting in significant price movements. This phase is ideal for trading with the trend, as the market provides clearer directional signals.
Traders should focus on identifying breakouts or strong momentum in the direction of the trend established during this period. This phase is also where traders can capitalize on setups identified earlier, aligning their entries with the market’s broader sentiment.
🟣 Continuation or Reversal
Finally, the Continuation or Reversal phase (13:00 - 19:00 EST) offers a critical juncture to assess the market’s direction. This phase can either reinforce the established trend or signal a reversal as institutions adjust their positions.
Traders should observe price behavior closely during this time, looking for patterns that confirm whether the trend is likely to continue or reverse. This phase is particularly useful for adjusting open positions or initiating new trades based on emerging signals.
🔵 Settings
Show or Hide Phases.
Adjust the session times for each phase :
Accumulation: 19:00-01:00 EST
Manipulation: 01:00-07:00 EST
Distribution: 07:00-13:00 EST
Continuation or Reversal: 13:00-19:00 EST
Modify Visualization : Customize how the indicator looks by changing settings like colors and transparency.
🔵 Conclusion
AMDX provides traders with a practical method to analyze daily market behavior by dividing the trading day into four key phases: Accumulation, Manipulation, Distribution, and Continuation or Reversal. Each phase highlights specific market dynamics, offering insights into how institutional activity shapes price movements.
From the quiet buildup in the Accumulation phase to the decisive trends of the Distribution phase, and the critical transitions in Continuation or Reversal, this approach equips traders with the tools to anticipate movements and make informed decisions.
By recognizing the significance of each phase, traders can avoid common traps during Manipulation, capitalize on clear trends during Distribution, and adapt to changes in the final phase of the day.
The structured visualization of market phases simplifies decision-making for traders of all levels. By incorporating these principles into your trading strategy, you can enhance your ability to align with market trends, optimize entry and exit points, and achieve more consistent results in your trading journey.

Power Of 3 ICT 01 [TradingFinder] AMD ICT & SMC Accumulations🔵 Introduction
The ICT Power of 3 (PO3) strategy, developed by Michael J. Huddleston, known as the Inner Circle Trader, is a structured approach to analyzing daily market activity. This strategy divides the trading day into three distinct phases: Accumulation, Manipulation, and Distribution.
Each phase represents a unique market behavior influenced by institutional traders, offering a clear framework for retail traders to align their strategies with market movements.
Accumulation (19:00 - 01:00 EST) takes place during low-volatility hours, as institutional traders accumulate orders. Manipulation (01:00 - 07:00 EST) involves false breakouts and liquidity traps designed to mislead retail traders. Finally, Distribution (07:00 - 13:00 EST) represents the active phase where significant market movements occur as institutions distribute their positions in line with the broader trend.
This indicator is built upon the Power of 3 principles to provide traders with a practical and visual tool for identifying these key phases. By using clear color coding and precise time zones, the indicator highlights critical price levels, such as highs and lows, helping traders to better understand market dynamics and make more informed trading decisions.
Incorporating the ICT AMD setup into daily analysis enables traders to anticipate market behavior, spot high-probability trade setups, and gain deeper insights into institutional trading strategies. With its focus on time-based price action, this indicator simplifies complex market structures, offering an effective tool for traders of all levels.
🔵 How to Use
The ICT Power of 3 (PO3) indicator is designed to help traders analyze daily market movements by visually identifying the three key phases: Accumulation, Manipulation, and Distribution.
Here's how traders can effectively use the indicator :
🟣 Accumulation Phase (19:00 - 01:00 EST)
Purpose : Identify the range-bound activity where institutional players accumulate orders.
Trading Insight : Avoid placing trades during this phase, as price movements are typically limited. Instead, use this time to prepare for the potential direction of the market in the next phases.
🟣 Manipulation Phase (01:00 - 07:00 EST)
Purpose : Spot false breakouts and liquidity traps that mislead retail traders.
Trading Insight : Observe the market for price spikes beyond key support or resistance levels. These moves often reverse quickly, offering high-probability entry points in the opposite direction of the initial breakout.
🟣 Distribution Phase (07:00 - 13:00 EST)
Purpose : Detect the main price movement of the day, driven by institutional distribution.
Trading Insight : Enter trades in the direction of the trend established during this phase. Look for confirmations such as breakouts or strong directional moves that align with broader market sentiment
🔵 Settings
Show or Hide Phases :mDecide whether to display Accumulation, Manipulation, or Distribution.
Adjust the session times for each phase :
Accumulation: 1900-0100 EST
Manipulation: 0100-0700 EST
Distribution: 0700-1300 EST
Modify Visualization : Customize how the indicator looks by changing settings like colors and transparency.
🔵 Conclusion
The ICT Power of 3 (PO3) indicator is a powerful tool for traders seeking to understand and leverage market structure based on time and price dynamics. By visually highlighting the three key phases—Accumulation, Manipulation, and Distribution—this indicator simplifies the complex movements of institutional trading strategies.
With its customizable settings and clear representation of market behavior, the indicator is suitable for traders at all levels, helping them anticipate market trends and make more informed decisions.
Whether you're identifying entry points in the Accumulation phase, navigating false moves during Manipulation, or capitalizing on trends in the Distribution phase, this tool provides valuable insights to enhance your trading performance.
By integrating this indicator into your analysis, you can better align your strategies with institutional movements and improve your overall trading outcomes.

Silver Bullet ICT Strategy [TradingFinder] 10-11 AM NY Time +FVG🔵 Introduction
The ICT Silver Bullet trading strategy is a precise, time-based algorithmic approach that relies on Fair Value Gaps and Liquidity to identify high-probability trade setups. The strategy primarily focuses on the New York AM Session from 10:00 AM to 11:00 AM, leveraging heightened market activity within this critical window to capture short-term trading opportunities.
As an intraday strategy, it is most effective on lower timeframes, with ICT recommending a 15-minute chart or lower. While experienced traders often utilize 1-minute to 5-minute charts, beginners may find the 1-minute timeframe more manageable for applying this strategy.
This approach specifically targets quick trades, designed to take advantage of market movements within tight one-hour windows. By narrowing its focus, the Silver Bullet offers a streamlined and efficient method for traders to capitalize on liquidity shifts and price imbalances with precision.
In the fast-paced world of forex trading, the ability to identify market manipulation and false price movements is crucial for traders aiming to stay ahead of the curve. The Silver Bullet Indicator simplifies this process by integrating ICT principles such as liquidity traps, Order Blocks, and Fair Value Gaps (FVG).
These concepts form the foundation of a tool designed to mimic the strategies of institutional players, empowering traders to align their trades with the "smart money." By transforming complex market dynamics into actionable insights, the Silver Bullet Indicator provides a powerful framework for short-term trading success
Silver Bullet Bullish Setup :
Silver Bullet Bearish Setup :
🔵 How to Use
The Silver Bullet Indicator is a specialized tool that operates within the critical time windows of 9:00-10:00 and 10:00-11:00 in the forex market. Its design incorporates key principles from ICT (Inner Circle Trader) methodology, focusing on concepts such as liquidity traps, CISD Levels, Order Blocks, and Fair Value Gaps (FVG) to provide precise and actionable trade setups.
🟣 Bullish Setup
In a bullish setup, the indicator starts by marking the high and low of the session, serving as critical reference points for liquidity. A typical sequence involves a liquidity grab below the low, where the price manipulates retail traders into selling positions by breaching a key support level.
This movement is often orchestrated by smart money to accumulate buy orders. Following this liquidity grab, a market structure shift (MSS) occurs, signaled by the price breaking the CISD Level—a confirmation of bullish intent. The indicator then highlights an Order Block near the CISD Level, representing the zone where institutional buying is concentrated.
Additionally, it identifies a Fair Value Gap, which acts as a high-probability area for price retracement and trade entry. Traders can confidently take long positions when the price revisits these zones, targeting the next significant liquidity pool or resistance level.
Bullish Setup in CAPITALCOM:US100 :
🟣 Bearish Setup
Conversely, in a bearish setup, the price manipulates liquidity by creating a false breakout above the high of the session. This move entices retail traders into long positions, allowing institutional players to enter sell orders.
Once the price reverses direction and breaches the CISD Level to the downside, a change of character (CHOCH) becomes evident, confirming a bearish market structure. The indicator highlights an Order Block near this level, indicating the origin of the institutional sell orders, along with an associated FVG, which represents an imbalance zone likely to be revisited before the price continues downward.
By entering short positions when the price retraces to these levels, traders align their strategies with the anticipated continuation of bearish momentum, targeting nearby liquidity voids or support zones.
Bearish Setup in OANDA:XAUUSD :
🔵 Settings
Refine Order Block : Enables finer adjustments to Order Block levels for more accurate price responses.
Mitigation Level OB : Allows users to set specific reaction points within an Order Block, including: Proximal: Closest level to the current price. 50% OB: Midpoint of the Order Block. Distal: Farthest level from the current price.
FVG Filter : The Judas Swing indicator includes a filter for Fair Value Gap (FVG), allowing different filtering based on FVG width: FVG Filter Type: Can be set to "Very Aggressive," "Aggressive," "Defensive," or "Very Defensive." Higher defensiveness narrows the FVG width, focusing on narrower gaps.
Mitigation Level FVG : Like the Order Block, you can set price reaction levels for FVG with options such as Proximal, 50% OB, and Distal.
CISD : The Bar Back Check option enables traders to specify the number of past candles checked for identifying the CISD Level, enhancing CISD Level accuracy on the chart.
🔵 Conclusion
The Silver Bullet Indicator is a cutting-edge tool designed specifically for forex traders who aim to leverage market dynamics during critical liquidity windows. By focusing on the highly active 9:00-10:00 and 10:00-11:00 timeframes, the indicator simplifies complex market concepts such as liquidity traps, Order Blocks, Fair Value Gaps (FVG), and CISD Levels, transforming them into actionable insights.
What sets the Silver Bullet Indicator apart is its precision in detecting false breakouts and market structure shifts (MSS), enabling traders to align their strategies with institutional activity. The visual clarity of its signals, including color-coded zones and directional arrows, ensures that both novice and experienced traders can easily interpret and apply its findings in real-time.
By integrating ICT principles, the indicator empowers traders to identify high-probability entry and exit points, minimize risk, and optimize trade execution. Whether you are capturing short-term price movements or navigating complex market conditions, the Silver Bullet Indicator offers a robust framework to enhance your trading performance.
Ultimately, this tool is more than just an indicator; it is a strategic ally for traders who seek to decode the movements of smart money and capitalize on institutional strategies. With the Silver Bullet Indicator, traders can approach the market with greater confidence, precision, and profitability.

Market structureHi all!
This script shows you the market structure. You can choose to show internal market structure (with pivots of a default length of 5) and swing market structure (with pivots of a default length of 50). For these two trends it will show you:
• Break of structure (BOS)
• Change of character (CHoCH) (mandatory)
• Equal high/low (EQH/EQL)
It's inspired by "Smart Money Concepts (SMC) " by LuxAlgo that will also show you the market structure.
It will create the two market structures depending on the pivots found. Both of these market structures can be enabled/disabled. The pivots length can be configured separately. The pivots found will be the 'base' of this indicator and will show you when price breaks it. When that happens a break of structure or a change of character will be created. The latest 5 pivots found within the current trends will be kept to take action on. The internal market structure is shown with dashed lines and swing market structure is shown with solid lines.
A break of structure is removed if an earlier pivots within the same trend is broken. Like in the images below, the first pivot (in the first image) is removed when an earlier pivot's higher price within the same trend is broken (the second image):
Equal high/lows have a pink zone (by default but can be changed by the user). These zones can be configured to be extended to the right (off by default). Equal high/lows are only possible if it's not been broken by price and if a later bar has a high/low within the limit it's added to the zone (without it being more 'extreme' (high or low) then the previous price). A factor (percentage of width) of the Average True Length (of length 14) that the pivot must be within to to be considered an Equal high/low. This is configurable and sets this 'limit' and is 10 by default.
You are able to show the pivots that are used. "HH" (higher high), "HL" (higher low), "LH" (lower high), "LL" (lower low) and "H"/"L" (for pivots (high/low) when the trend has changed) are the labels used.
This script has proven itself useful for me to quickly see how the current market is. You can see the pivots (price and bar) where break of structure or change of character happens to see the current trends. I hope that you will find this useful for you.
When programming I focused on simplicity and ease of read. I did not focus on performance, I will do so if it's a problem (haven't noticed it is one yet).
You can set alerts for when a change of character happens. You can configure it to fire on when it happens (all or once per bar) but it defaults to 'once_per_bar_close' to avoid repainting. This has the drawback to alert you when the bar closes.
TLDR: this is an indicator showing you the market structure (break of structures and change of characters) using swing points/pivots. Two trends can be shown, internal (with pivots of length of 5) and swing (with pivots of the length of 50).
Best of trading luck!
Smart Money Setup 07 [TradingFinder] Liquidity Hunts & Minor OB🔵 Introduction
The Smart Money Concept relies on analyzing market structure, tracking liquidity flows, and identifying order blocks. Research indicates that traders who apply these methods can improve their accuracy in predicting market movements by up to 30%.
These elements allow traders to understand the behavior of market makers, including banks and large financial institutions, which have the ability to influence price movements and shape major market trends. By recognizing how these entities operate, traders can align their strategies with Smart Money actions and better anticipate shifts in the market.
Smart Money typically enters the market at points of high liquidity where trading opportunities are more attractive. By following these liquidity flows, professional traders can position themselves at market reversal points, leading to profitable trades.
The Smart Money Setup 07 indicator has been specifically designed to detect these complex patterns. Using advanced algorithms, this indicator automatically identifies both bullish and bearish trading setups, assisting traders in discovering hidden market opportunities.
As a powerful technical analysis tool, the Smart Money Setup indicator helps predict the actions of major market participants and highlights optimal entry and exit points. Essentially, this tool enables traders to act like institutional investors and market makers, making the most of price fluctuations in their favor.
Ultimately, the Smart Money Setup 07 indicator transforms complex technical analysis into a simple and practical tool. By detecting order blocks and liquidity zones, this tool helps traders execute their strategies with greater precision, leading to more informed and successful trading decisions.
🟣 Bullish Setup
🟣 Bearish Setup
🔵 How to Use
One of the key strengths of the Smart Money Setup 07 indicator is its ability to accurately identify order blocks and analyze liquidity flows. Order blocks represent areas where large buy or sell orders are placed by Smart Money investors, which often indicate key reversal points in the market. Traders can use these order blocks to pinpoint potential entry and exit opportunities.
The Smart Money Setup indicator detects and visually displays these order blocks on the chart, helping traders identify the best zones to enter or exit trades. Since these zones are frequently used by large institutional investors, following these blocks allows traders to capitalize on price fluctuations and trade with confidence.
🟣 Bullish Smart Money Setup
A Bullish Smart Money Setup forms when the market creates Higher Lows and Higher Highs. In this situation, the indicator analyzes pivot points, liquidity flows, and order blocks to identify buy opportunities. Liquidity points in these setups indicate areas where Smart Money is likely to enter long positions.
In the bullish setup image, multiple Higher Lows and Higher Highs are formed. The green zone represents a Bullish Order Block, signaling traders to enter a long trade. The Smart Money Setup indicator displays a green arrow, indicating a high-probability upward price movement from this liquidity zone.
🟣 Bearish Smart Money Setup
A Bearish Smart Money Setup occurs when the market structure shows Lower Highs and Lower Lows, indicating weakness in price. The indicator identifies these patterns and highlights potential sell opportunities. Liquidity points in this setup mark areas where Smart Money enters sell positions.
In the bearish setup image, a Lower High is followed by a Lower Low, with the red liquidity zone acting as a Bearish Order Block. The Smart Money Setup indicator shows a red arrow, signaling a likely downward move, offering traders an opportunity to enter short positions.
🔵 Settings
Pivot Period : This setting determines how many candles are needed to form a pivot point. A default value of 2 is optimal for quickly identifying key pivot points in price action.
Order Block Validity Period : This parameter defines the lifespan of an order block. Traders can adjust how long each order block remains valid. For instance, setting it to 500 means that an order block will be valid for 500 bars after its formation.
Mitigation Level OB : This setting allows traders to select whether order blocks should be based on the "Proximal," "50% OB," or "Distal" levels, helping traders manage risk more effectively.
Order Block Refinement : Traders can refine the order blocks with precision. The indicator offers two refinement modes: Defensive and Aggressive. The Defensive mode identifies safer order blocks, while the Aggressive mode targets higher-risk blocks with the potential for larger reversals.
🔵 Conclusion
The Smart Money Setup 07 indicator is a powerful tool for identifying key Smart Money movements in the market. It provides traders with essential insights for making informed trading decisions, particularly when combined with technical analysis and liquidity flow analysis. This indicator allows traders to accurately pinpoint entry and exit points, helping them maximize profits and minimize risk.
By offering a range of customizable settings, the Smart Money Setup indicator adapts to different trading styles and strategies. Furthermore, its ability to detect order blocks and identify supply and demand zones makes it an indispensable tool for any trader looking to enhance their strategy.
In conclusion, the Smart Money Setup 07 is a crucial tool for traders aiming to optimize their trading performance. By utilizing the concepts of Smart Money in technical analysis, traders can make more precise decisions and take advantage of market fluctuations.

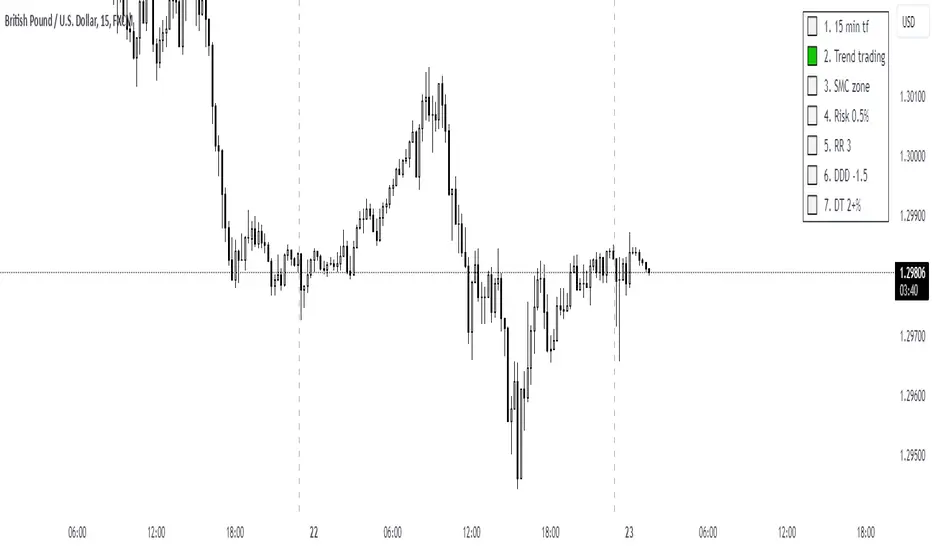
UTC Discipline TradingReminder for Disciplined Trading:
1.Trend Trading – We only open positions in the direction of the trend to take advantage of market momentum.
2.SMC Zones – We trade only within zones defined by the Smart Money Concept (SMC) indicator, identifying key market points.
3.Risk 0.5% – Each position carries a maximum risk of 0.5% of total capital, minimizing potential losses and maintaining risk control.
4.3RR – Every trade must have a risk-to-reward ratio (RR) of 3:1, meaning the potential reward should be three times greater than the risk.
5.DDD -1.5% – When the daily loss reaches -1.5%, trading for the day is closed to avoid further losses.
6.DW 2+% – When daily profit reaches 2%, trading for the day ends. However, if profit exceeds 2%, you may risk an additional amount, and in case of a loss, the day will close with at least 2% profit.
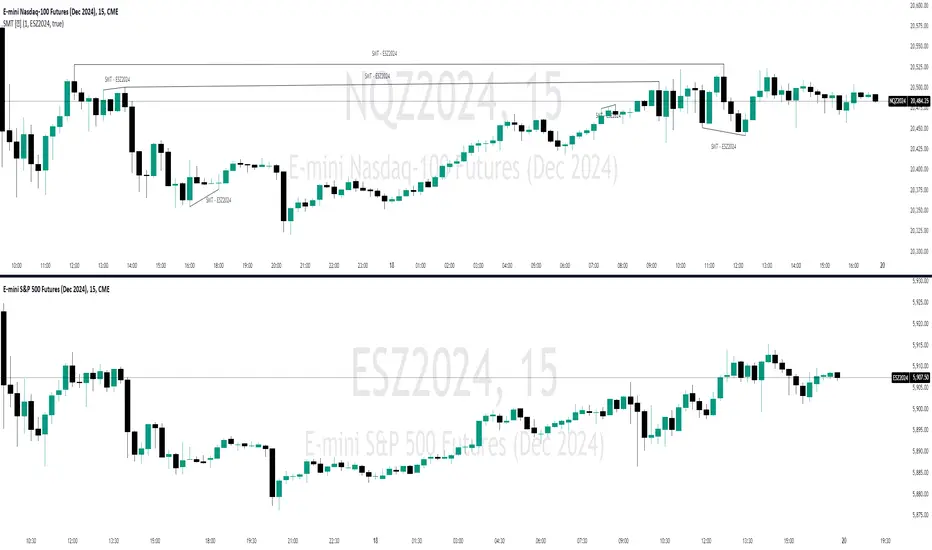
SMT Divergences [OutOfOptions]Smart Money Technique (SMT) Divergence is designed to identify discrepancies between correlated assets within the same timeframe. It occurs when two related assets exhibit opposing signals, such as one forming a higher low while the other forms a lower low. This technique is particularly useful for anticipating market shifts or reversals before they become evident through other Premium Discount (PD) Arrays.
This indicator works by identifying the highs and lows that have formed for an asset on the current chart and the correlated symbol defined in the settings. Once a pivot on either asset is formed, it checks if the pivot has taken liquidity as identified by the previous pivot in the same direction (i.e., a new high taking out a previous high). If this is the case and the corresponding asset has not taken a similar pivot, the condition is determined to be a potential valid divergence. The indicator will then filter out SMTs formed by adjacent candles, requiring at least one candle difference between the candles forming the SMT.
If the “Candle Direction Validation” setting is enabled, the indicator will further check both assets to ensure that for bullish SMTs, the last high on both assets was formed by down candle, and for bearish SMTs, the low was formed by an up candle. This check can often eliminate low-probability SMTs that are frequently broken.
The referenced chart shows divergence between Nasdaq (NQ) and S&P 500 (ES) futures, which are normally closely correlated assets that move in the same direction. The lines shown represent bullish and bearish divergences between the two when they are formed. As you can see from the chart, SMT Divergences may not always indicate a reversal, or a reversal might be just a short-term retrace. Therefore, SMT Divergences should not be used independently. However, in conjunction with other PD arrays, they can provide strong confirmation of a change in market direction.
Configurability:
Pivot strength - Indicates how many bars to the left/right of a high for pivot to be considered, recommended to keep at 1 for maximum detection speed
Candle Direction Validation - Additional SMT validation to filter out weak/low-probability SMTs be examining candle direction
Line Styling for Bullish/Bearish SMTs - Ability to customize line style, color & width for bullish/bearish SMTs
Label Control - Whether or not to show SMT label and if shown what font size & color should be used
What makes this indicator different:
Unlike other SMT indicators, this indicators has additional built-in controls to remove low-probability SMTs
ICT Professional Accumulation DistributionICT Professional Accumulation Distribution (ICT AD) provides a x-ray view into market accumulation and distribution. You can literally see the institutions at work.
The indicator consists of two cumulative lines derived from:
Cumulative change from open to close
Cumulative change from previous close to new open
By overlaying these two cumulative lines, you can detect real meaningful divergence that is narrative based not mathematically derived. You're seeing the real works of algorithms in play working in this area.
These divergences are only useful at extremes (topping or bottoming formations), not while trending. It will probably confirm your suspicion about making a important high or low.
This works on all timeframes but is most impactful on the daily.
How to use:
Method 1:
Enable the option for "Show Open vs Close."
Calculate the shift by subtracting the "Open vs Close" line value from the ICT Accumulation/Distribution (AD) line value.
Look for divergences between the two cumulative lines.
Method 2:
Switch the chart's display mode to "Line View" (representing the Open vs Close).
look for divergences between the line chart and the ICT AD line.
