Inversion Fair Value Gap Signals [AlgoAlpha]🟠 OVERVIEW
This script is a custom signal tool called Inversion Fair Value Gap Signals (IFVG) , designed to detect, track, and visualize fair value gaps (FVGs) and their inversions directly on price charts. It identifies bullish and bearish imbalances, monitors when these zones are mitigated or rejected, and extends them until resolution or expiration. What makes this script original is the inclusion of inversion logic—when a gap is filled, the area flips into an opposite "inversion fair value gap," creating potential reversal or continuation zones that give traders additional context beyond classic FVG analysis.
🟠 CONCEPTS
The script builds on the Smart Money Concepts (SMC) principle of fair value gaps, where inefficiencies form when price moves too quickly in one direction. Detection requires a three-bar sequence: a strong up or down move that leaves untraded price between bar highs and lows. To refine reliability, the script adds an ATR-based size filter and prevents overlap between zones. Once created, gaps are tracked in arrays until mitigation (price closing back into the gap), expiration, or transformation into an inversion zone. Inversions act as polarity flips, where bullish gaps become bearish resistance and bearish gaps become bullish support. Lower-timeframe volume data is also displayed inside zones to highlight whether buying or selling pressure dominated during gap creation.
🟠 FEATURES
Automatic detection of bullish and bearish FVGs with ATR-based thresholding.
Inversion logic: mitigated gaps flip into opposite-colored IFVG zones.
Volume text overlay inside each zone showing up vs down volume.
Visual markers (△/▽ for FVG, ▲/▼ for IFVG) when price exits a zone without mitigation.
🟠 USAGE
Apply the indicator to any chart and enable/disable bullish or bearish FVG detection depending on your focus. Use the colored gap zones as areas of interest: bullish gaps suggest possible continuation to the upside until mitigated, while bearish gaps suggest continuation down. When a gap flips into an inversion zone, treat it as potential support/resistance—bullish IFVGs below price may act as demand, while bearish IFVGs above price may act as supply. Watch the embedded up/down volume data to gauge the strength of participants during gap formation. Use the △/▽ and ▲/▼ markers to spot when price rejects gaps or inversions without filling them, which can indicate strong trending momentum. For practical use, combine alerts with your trade plan to track when new gaps form, when old ones are resolved, or when key zones flip into inversions, helping you align entries, targets, or reversals with institutional order flow logic.
Cari skrip untuk "signal"

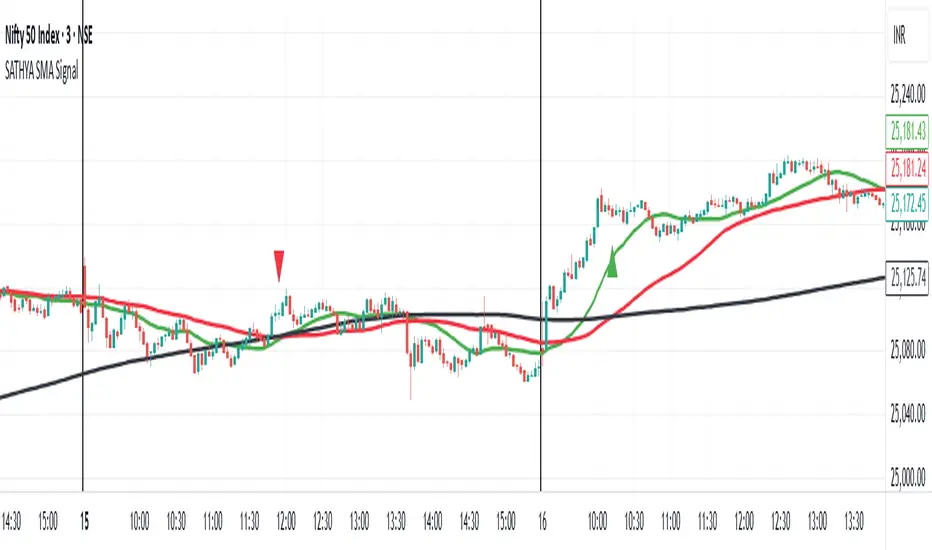
SATHYA SMA SignalThis indicator overlays 20, 50, and 200 Simple Moving Averages (SMAs) on the chart. It generates bullish signals when the 20 SMA crosses above the 200 SMA before the 50 SMA, with both above 200 SMA. Bearish signals occur when the 20 SMA crosses below the 200 SMA before the 50 SMA, with both below 200 SMA. Signals appear as distinct triangles on the chart, helping traders identify trend reversals based on systematic SMA crossovers and order of crossing.

SATHYA SMA Signal)This indicator overlays 20, 50, and 200 Simple Moving Averages (SMAs) on the chart. It generates bullish signals when the 20 SMA crosses above the 200 SMA before the 50 SMA, with both above 200 SMA. Bearish signals occur when the 20 SMA crosses below the 200 SMA before the 50 SMA, with both below 200 SMA. Signals appear as distinct triangles on the chart, helping traders identify trend reversals based on systematic SMA crossovers and order of crossing.
Buy and Sell Signals (Altius Consulting)Generates Buy and Sell signals based on MACD and RSI.
- Plots MACD, Signal & Histogram (optional pane).
- Buy Label (toggle): Bullish MACD crossover + RSI < threshold (no convergence requirement).
- Sell Label: Bearish MACD crossover (MACD crosses below Signal) prints a SELL tag.
- Alert: Provided for convergence-based buy condition (add your own for simple crossover if desired).


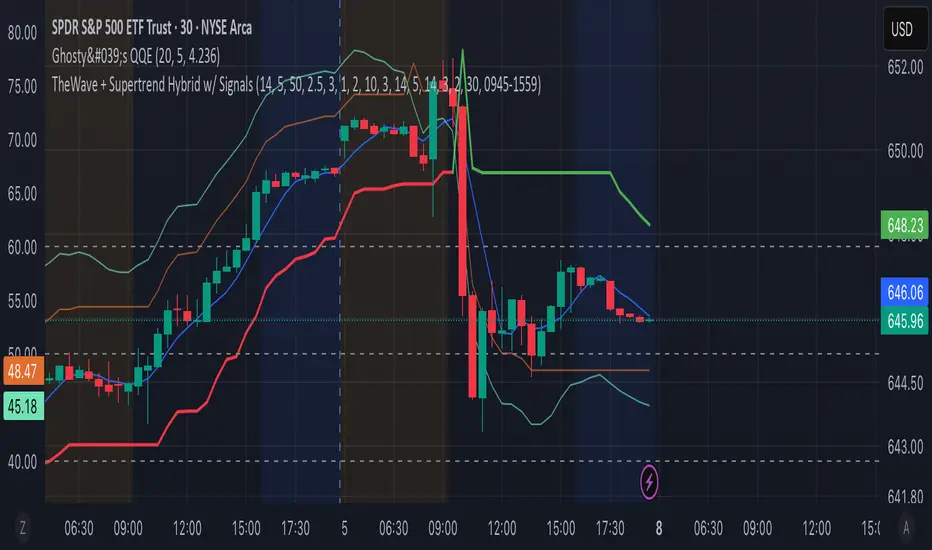
TheWave + Supertrend Hybrid w/ Signals• Green triangle below bar → Long entry signal
• Red triangle above bar → Short entry signal
• Small lime cross above/below → Take-profit hit
• Small maroon cross above/below → Stop-loss hit
• SMA5 and Supertrend lines for trend context
This version makes all entries and exits visually obvious while keeping the hybrid TheWave + Supertrend logic intact.
Sequential Pattern Strength [QuantAlgo]🟢 Overview
The Sequential Pattern Strength indicator measures the power and sustainability of consecutive price movements by tracking unbroken sequences of up or down closes. It incorporates sequence quality assessment, price extension analysis, and automatic exhaustion detection to help traders identify when strong trends are losing momentum and approaching potential reversal or continuation points.
🟢 How It Works
The indicator's key insight lies in its sequential pattern tracking system, where pattern strength is measured by analyzing consecutive price movements and their sustainability:
if close > close
upSequence := upSequence + 1
downSequence := 0
else if close < close
downSequence := downSequence + 1
upSequence := 0
The system calculates sequence quality by measuring how "perfect" the consecutive moves are:
perfectMoves = math.max(upSequence, downSequence)
totalMoves = math.abs(bar_index - ta.valuewhen(upSequence == 1 or downSequence == 1, bar_index, 0))
sequenceQuality = totalMoves > 0 ? perfectMoves / totalMoves : 1.0
First, it tracks price extension from the sequence starting point:
priceExtension = (close - sequenceStartPrice) / sequenceStartPrice * 100
Then, pattern exhaustion is identified when sequences become overextended:
isExhausted = math.abs(currentSequence) >= maxSequence or
math.abs(priceExtension) > resetThreshold * math.abs(currentSequence)
Finally, the pattern strength combines sequence length, quality, and price movement with momentum enhancement:
patternStrength = currentSequence * sequenceQuality * (1 + math.abs(priceExtension) / 10)
enhancedSignal = patternStrength + momentum * 10
signal = ta.ema(enhancedSignal, smooth)
This creates a sequence-based momentum indicator that combines consecutive movement analysis with pattern sustainability assessment, providing traders with both directional signals and exhaustion insights for entry/exit timing.
🟢 Signal Interpretation
Positive Values (Above Zero): Sequential pattern strength indicating bullish momentum with consecutive upward price movements and sustained buying pressure = Long/Buy opportunities
Negative Values (Below Zero): Sequential pattern strength indicating bearish momentum with consecutive downward price movements and sustained selling pressure = Short/Sell opportunities
Zero Line Crosses: Pattern transitions between bullish and bearish regimes, indicating potential trend changes or momentum shifts when sequences break
Upper Threshold Zone: Area above maximum sequence threshold (2x maxSequence) indicating extremely strong bullish patterns approaching exhaustion levels
Lower Threshold Zone: Area below negative threshold (-2x maxSequence) indicating extremely strong bearish patterns approaching exhaustion levels

FTSE Trade SignalTrade FTSE with SMA crossovers and signals only printed on FTSE open, between 8am and 10am

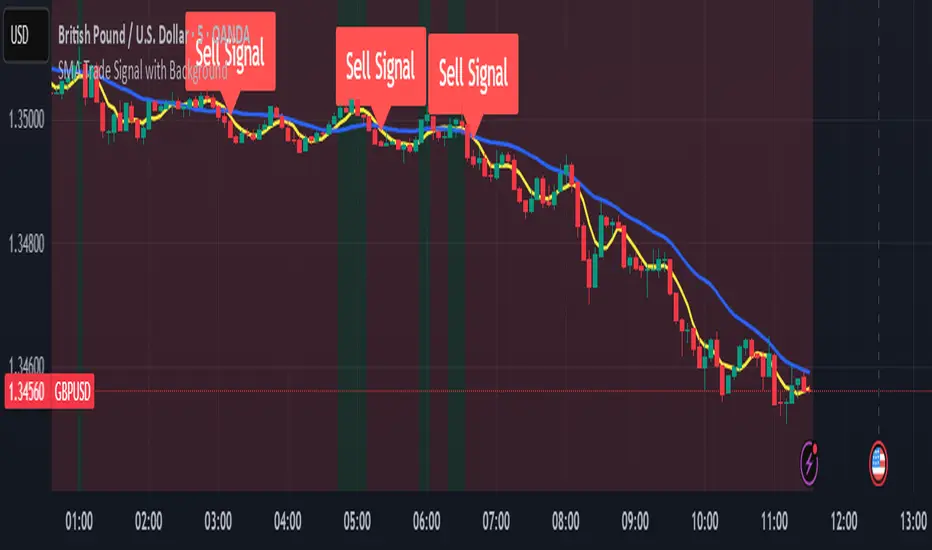
SMA Trade Signal with BackgroundSMA Trade Signal with Background, using 5 & 20 simple moving averages, only showing buy signals during an uptrend and sells during a down trend.
Canyons Trend Ride SignalTrend alignment signals using 3 EMA's. pre-code written parameters must all be met to throw a signal out. Works best with Heiken ashi candles. Works on Gold, Nas100, S&P 500 and US30

Body & Volume-Based Buy/Sell Signals (5min 1.5M Vol)Only for 5 min and Volume 1.5M
Conditions (Summarized)
🔹 BUY Signal
Previous candle is red: close < open
Current candle is green: close > open
Previous candle body is smaller than current:
abs(close - open ) < abs(close - open)
Previous candle body size ≥ 10 points
Both candles' volume ≥ minVolume (default: 2,000,000)
➜ Plot BUY below green candle
🔸 SELL Signal
Previous candle is green: close > open
Current candle is red: close < open
Previous candle body is smaller than current:
abs(close - open ) < abs(close - open)
Previous candle body size ≥ 10 points
Both candles' volume ≥ minVolume
➜ Plot SELL above red candle

Bullish & Bearish Signals (Dual Mode, Strong Filters)on research related to bullish & bearish signal, understanding how ema, macd works...

#TheStrat Multi-Timeframe In-Force Signals, Failed 2's, and FTFCThis indicator combines #TheStrat concepts of bar combinations, in-force signals, and timeframe continuity with 'Failed 2's' which can be early indication of a trend reversal.
It’s designed to help identify the prevailing trend but also reversal points when timeframe-based ranges are reclaimed because a signal failed or went out-of-force.
Core Concepts
1. TheStrat Bar Types
• 1 (Inside Bar): High ≤ previous high and Low ≥ previous low.
• 2U (Two Up): High > previous high and Low ≥ previous low.
• 2D (Two Down): Low < previous low and High ≤ previous high.
• 3 (Outside Bar): High > previous high and Low < previous low.
2. Failed 2’s — Definition & Detection
A Failed 2 occurs when a directional break (2U or 2D) reverses before following through.
This script lets you choose from four failure-definition modes:
1. Open — A 2U fails if last price is below open; a 2D fails if last price is above open.
2. Reclaim — A 2U or 2D fails if last price is within the previous bar’s range.
3. Both — Both of the above conditions must be met.
4. Either — Either condition must be met.
Failed 2U setups are bearish; Failed 2D setups are bullish.
You can also enable FTFC Override, which ignores reclaim-type failures when all higher timeframes are in full agreement with the current trend.
3. Timeframe Continuity (TFC)
TFC measures directional agreement across multiple timeframes.
• Full TFC (FTFC) Up: All selected timeframes above their opens.
• Full TFC (FTFC) Down: All selected timeframes below their opens.
• Mixed or neutral conditions are also displayed.
The indicator tracks classic TFC and supports trend-flip alerts when full agreement changes direction.
Features
• Customizable TFC table showing bar types, failed status, in-force status, reclaims, and direction arrows.
• Automatic bar coloring for TFC alignment, failed-2 transitions, or neutral states.
• Alerts for TFC trend flips.
• Multi-timeframe scanning with selectable intervals.
• Option to highlight bars that trigger a TFC flip due to failed-2 events.
Use Cases
• Quickly gauge market bias across multiple timeframes
• Identify failed 2 reversals against higher timeframes
• Spot potential turning points when trend flips occur
Limitations
This is a tool which can give earlier indication of trend reversals but is highly dependent on selected timeframes. This is discretionary, but having a range of higher and lower timeframes works best. In many cases, it will give the same trend 'flip' that classic FTFC would (based on open).
Ranges are based on timeframes, not swing highs and lows. The selected timeframes must capture the swing high or low to show a 'range' reclaim.
Timeframes lower than the display timeframe cannot be accurately shown due to PineScript limitations. They are 'greyed out' and not included in calculations or displays.
This script is based on the FTFC indicator by TradeForOpportunity with deep gratitude. It has been modified and expanded with permission under MPL 2.0.

MACD (Panel) with Histogram-Confirmed Signals - Middle LineMacd indicator with buy and sell signals to help spot the macd signal crossover and histogram
Zero Lag Liquidity [AlgoAlpha]🟠 OVERVIEW
This script plots liquidity zones with zero lag using lower-timeframe wick profiles and high-volume wicks to mark key price reactions. It’s called Zero Lag Liquidity because it captures significant liquidity imbalances in real time by processing lower-TF price-volume distributions directly inside the wick of abnormal candles. The tool builds a volume histogram inside long upper/lower wicks, then calculates a local Point of Control (POC) to mark the price where most volume occurred. These levels act as visual liquidity zones, which can trigger labels, break signals, and trend detection depending on price interaction.
🟠 CONCEPTS
The core concept relies on identifying high-volume candles with unusually long wicks—often a sign of opposing liquidity. When a large upper or lower wick appears with a strong volume spike, the script builds a histogram of lower-timeframe closes and volumes inside that wick. It bins the wick into segments, sums volume per bin, and finds the POC. This POC becomes the liquidity level. The script then dynamically tracks whether price breaks above or rejects off these levels, adjusts the active trend regime accordingly, and highlights bars to help users spot continuation or reversal behavior. The logic avoids repainting or subjective interpretation by using fixed thresholds and lower-TF price action.
🟠 FEATURES
Dynamic liquidity levels rendered at POC of significant wicks, colored by bullish/bearish direction.
Break detection that removes levels once price decisively crosses them twice in the same direction.
Rejection detection that plots ▲/▼ markers when price bounces off levels intrabar.
Volume labels for each level, shown either as raw volume or percentage of total level volume.
Candle coloring based on trend direction (break-dominant).
🟠 USAGE
Use this indicator to track where liquidity has most likely entered the market via abnormal wick events. When a long wick forms with high volume, the script looks inside it (using your chosen lower timeframe) and marks the most traded price within it. These levels can serve as expected reversal or breakout zones. Rejections are marked with small arrows, while breaks trigger trend shifts and remove the level. You can toggle trend coloring to see directional bias after a breakout. Use the wick multiplier to control how selective the detector is (higher = stricter). Alerts and label modes help customize the signal for different asset types and chart styles.

Holy Grail Signal op EMA + ADXHolygrail + adx indicator with buy signals so you can buy at the yellow arrow


15-Min Chart, 7-Day High-Low SignalThis is a updated script to check for variances above 5% on buy and sell signals. This will help with mean reversion. Test before buying.

Volume Delta + RSI Confluence SignalsEfficient buy and sell signal scans for real trades using volume delta, rsi rejection and some more.
Sadi's Pocket Pivot Buy Signal (PP-B)Can be used to identify early entries within a basing period or later on as the stock breaks out and heads higher (continuation buy signals).
Helps in identifying low risk entries where the investor can pyramid into the stock and hence manage risk better.
Makes sure you get in when the trade in working in your favor and avoid putting good money after bad.

DAX Inducere Simplă v1.3 – Confirmare InducereDAX Inducere Simplă v1.3 – Confirmare Inducere ,signals before fvg mss and displacement

Smart Money Breakout Channels [AlgoAlpha]🟠 OVERVIEW
This script draws breakout detection zones called “Smart Money Breakout Channels” based on volatility-normalized price movement and visualizes them as dynamic boxes with volume overlays. It identifies temporary accumulation or distribution ranges using a custom normalized volatility metric and tracks when price breaks out of those zones—either upward or downward. Each channel represents a structured range where smart money may be active, helping traders anticipate key breakouts with added context from volume delta, up/down volume, and a visual gradient gauge for momentum bias.
🟠 CONCEPTS
The script calculates normalized price volatility by measuring the standard deviation of price mapped to a scale using the highest and lowest prices over a set lookback period. When normalized volatility reaches a local low and flips upward, a boxed channel is drawn between the highest and lowest prices in that zone. These boxes persist until price breaks out, either with a strong candle close (configurable) or by touching the boundary. Volume analysis enhances interpretation by rendering delta bars inside the box, showing volume distribution during the channel. Additionally, a real-time visual “gauge” shows where volume delta sits within the channel range, helping users spot pressure imbalances.
🟠 FEATURES
Automatic detection and drawing of breakout channels based on volatility-normalized price pivots.
Optional nested channels to allow multiple simultaneous zones or a clean single-zone view.
Gradient-filled volume gauge with dynamic pointer to show current delta pressure within the box.
Three volume visualization modes: raw volume, comparative up/down volume, and delta.
Alerts for new channel creation and confirmed bullish or bearish breakouts.
🟠 USAGE
Apply the indicator to any chart. Wait for a new breakout box to form—this occurs when volatility behavior shifts and a stable range emerges. Once a box appears, monitor price relative to its boundaries. A breakout above suggests bullish continuation, below suggests bearish continuation; signals are stronger when “Strong Closes Only” is enabled.
Watch the internal volume candles to understand where buy/sell pressure is concentrated during the box. Use the gauge on the right to interpret whether net pressure is building upward or downward before breakout to anticipate the direction.
Use alerts to catch breakout events without needing to monitor the chart constantly 🚨.

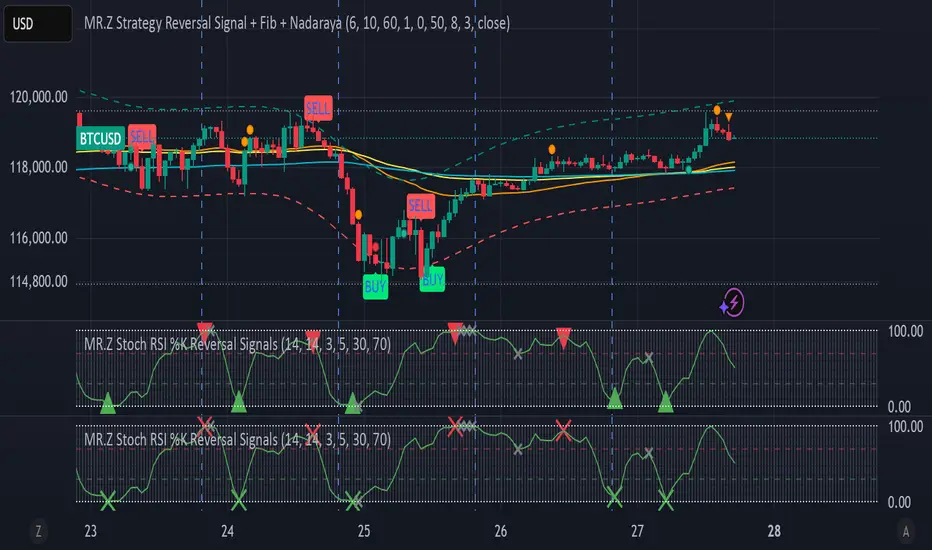
MR.Z Stoch RSI %K Reversal Signals🟢 K Strategy Description
The K Strategy is a momentum-based trading technique using the %K line from the Stochastic Oscillator. It is designed to detect potential reversal points in price trends by identifying extreme conditions of overbought and oversold levels.
✅ Core Logic:
The strategy monitors the %K line (a smoothed form of RSI momentum).
A Buy Signal is triggered when:
The %K line dips to or below a defined lower threshold (commonly 30 or less).
This suggests the asset is oversold and may soon reverse upward.
A Sell Signal is triggered when:
The %K line peaks above an upper threshold (commonly 70 or more).
This suggests the asset is overbought and may reverse downward.
⚙️ Adjustable Parameters:
K Length: The sensitivity of the %K calculation (affects how fast it responds).
Buy Level: Set your oversold trigger (e.g., 20–40).
Sell Level: Set your overbought trigger (e.g., 60–100).
Signal Smoothing (optional): Helps reduce noise and avoid false triggers.
📈 Use Case:
This strategy is effective in ranging markets where prices frequently oscillate. It can also be used with other indicators (like EMA, volume filters, or price action confirmation) to increase accuracy in trending conditions.