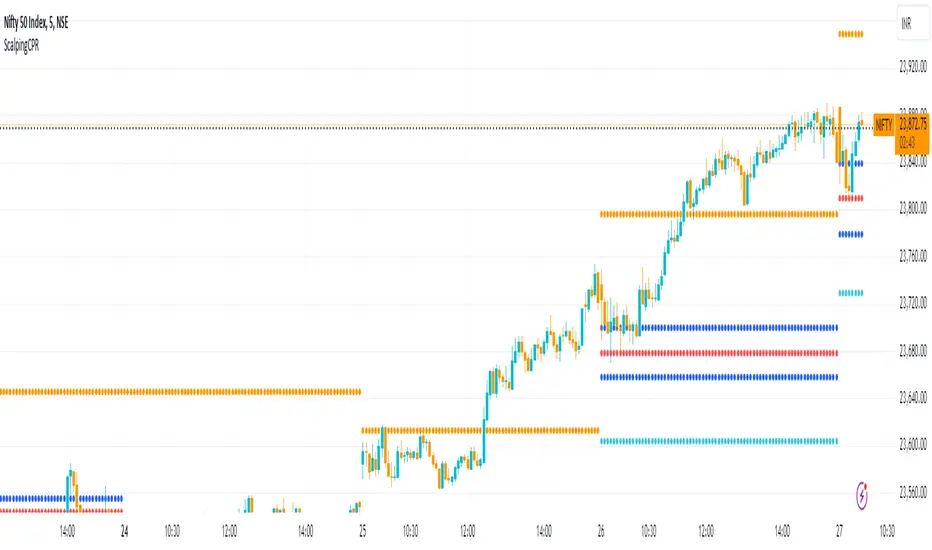
Scalping CPRFetch Previous Day's Data:
Uses request.security to get the previous day's high, low, and close prices.
lookahead=barmerge.lookahead_on ensures the data fetched is fixed for the current session.
Calculate CPR Levels:
Pivot: Average of the previous day's high, low, and close.
Bottom Central Pivot (BC): Average of the previous day's high and low.
Top Central Pivot (TC): Derived from the pivot and BC.
R1 and S1: First resistance and support levels calculated from the pivot and previous day's prices.
Plotting:
Plots the CPR levels (pivot, BC, TC, R1, S1) on the chart with different colors.
Cari skrip untuk "scalping"
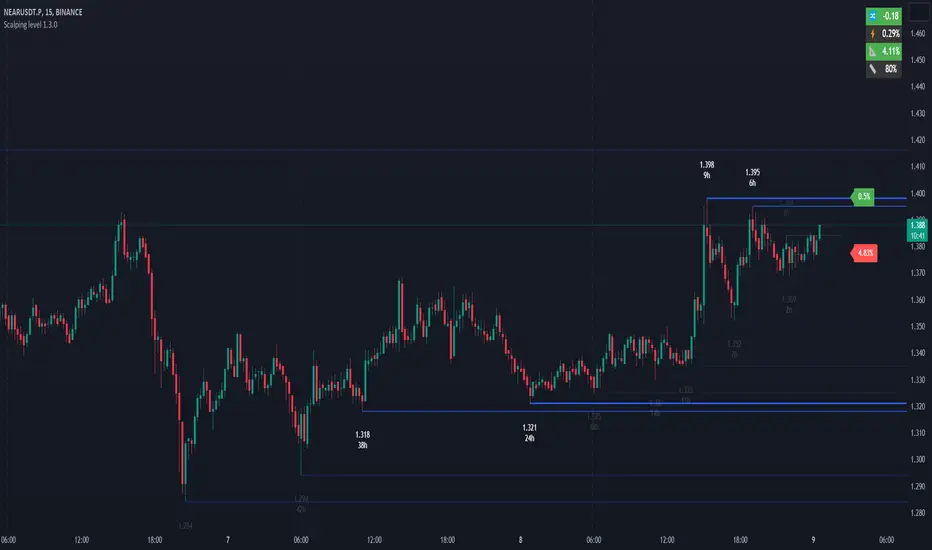
Scalping level 1.3.0The indicator shows the horizontal levels behind which the liquidity accumulates. The indicator is based on the price extremums according to the specified settings. Each extremum is marked with a faint blue line and the price. If two or more extrema are located at the same price or close enough to each other, they are highlighted in bright blue, and it indicates a strong resistance or support level. When prices approach strong resistance levels, we can consider the situation on a long breakout or a bounce from the level in the short. As price approaches strong support levels, we could consider a breakout in the short or a bounce from the level in the long. Each level has a time (indicated at each price extremum), when it was formed in hours, the more hours ago the level was formed, the stronger it is and the more likely is the price reaction at this level.
The marks next to the price show the distance in percent to the nearest strong levels, it gives a reference point for how soon the price will approach these levels.
Additional indicators, located at the top right of the chart help to make decisions in trading.
Daily dollar volume - shows how interesting the instrument to the market participants, if the traded volume for 24 hours is low, then it is not worth to pay attention to this tool.
Bitcoin correlation - (used for the cryptocurrency market), if the coin price follows the bitcoin (the indicator value is close to 1), then you should exclude this coin, because the price is controlled by robot correlators, not market participants.
Natr - the average volatility of a 5-minute candle in %. The low value of volatility can indicate that the instrument is not active at the moment. Also it is possible to use this value as a stoploss in scalper deals.
Price change - price change for the current session in %, if the value is more than 10% (for cryptocurrencies), then the breakdown of resistance levels have a higher probability than a bounce, if the value is less than -10%, then the probability of breaking support levels have a higher than a bounce.
Percentage of average daily ATR - shows how much the price passed in % for the current session from the average daily ATR. If price passed about 100%, it is possible to consider the price reversal from resistance or support levels.
Important! When trading on levels it is necessary to consider the situation in the Depth of Market. Pay attention to large densities located near support and resistance levels.
=== Basic settings: ===
LOCAL LEVEL, MIDDLE LEVEL, GLOBAL LEVEL . Three ranges of levels (local, middle, global). For each range, you can configure the period and lifetime of the level. For example, global levels are the strongest, they have the longest period and the longest time of existence (note: 0 for Lifetime means infinite time of existence), while local levels have the shortest period and the shortest time of existence. Period - the period in which the level is built. Lifetime - time after which the level is removed from the chart. Color and width - color and width of the line.
BREAK LEVELS . Levels broken by the price. These levels are displayed for convenient tracking of previous breakouts. Parameters are set similarly to other levels.
IMPORTANT LEVELS . Important levels show behind which price range the greatest accumulation of liquidity. Important levels can be adjusted by setting the minimum number of adjacent levels, for example 2 or more, as well as the maximum distance between adjacent levels. Thus, important levels show the accumulation of price extremums, behind which there are Stop Losses of the participants.
Near level coefficient - the distance coefficient between adjacent levels, the higher the coefficient is, the greater is the acceptable price range between the levels. The coefficient is multiplied by the average ATR, as a result we get the price range. For example, if we specify 0, then strong levels will be detected only if 2 or more extrema have the same price.
Minimum near levels - the minimum number of adjacent (close to each other) levels. For example, if 2 is specified, then if 2 or more levels are situated near each other at a distance not exceeding the distance, specified in the Near level coefficient, then those levels will be displayed in bright blue color.
Week level transparent - transparency of "weak" levels located at the price extremums.
COMMON.
Max distance to level - the maximum distance of levels is set by a coefficient, it is necessary to display only the closest levels to hide the levels that are formed very far from the current price. It is calculated on the basis of ATR.
Show level time - shows level existence time.
PRICE. Visual settings of price levels on the chart
Size - print size of price on the chart
Color - color of price on the chart
Round price color - color of the round price number. The round number is the price with the last two digits 0. Example 28124.00 or 0.2500
INDICATORS. Auxiliary numeric indicators (located in the upper right corner of the chart):
Daily dollar volume , the traded volume for the last 24 hours in dollars. You can specify a volume threshold in millions of dollars, above which the value will be highlighted in green. The default value is 100 million dollars. A high value of traded volume indicates a large number of participants and increases the probability of volatility of the instrument.
Bitcoin correlation , an indicator of price correlation with bitcoin, the lower the indicator, the instrument is more independent, the closer to 1, the stronger the instrument repeats bitcoin price movements. It has a threshold value of 0.5 by default. If the indicator reading is below the threshold, it is highlighted in color.
Natr , shows the average range at which the price passes in 5 min. The higher the indicator, the higher the volatility of the instrument.
Price change , price change in % for the current session.
Percentage of average daily ATR , shows how much the price passed in % for the current session from the average daily ATR.
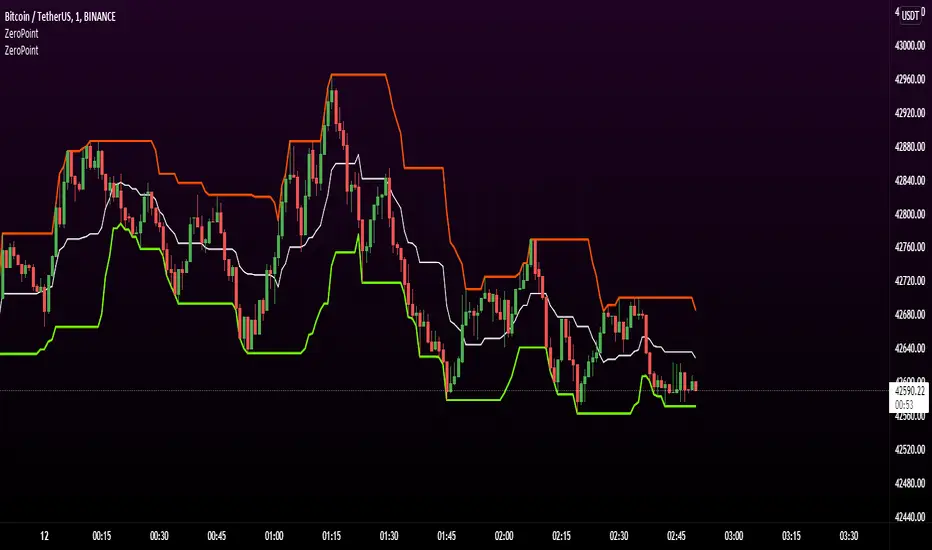
Scalping 1minMost trustworthy indicator for 1 minutes trader! This indicator is the same as the Bollinger band but much more reliable with extremely on-point signals! a lower line means buy, upper lines mean sell, the middle line is an extremely powerline so trade on the middle line will be mostly profitable!
Scalping Trading System ALERT Crypto and StocksThis is the alert version of the strategy with the same name.
Indicators
SImple Moving Average
Exponential Moving Average
Keltner Channels
MACD Histogram
Stochastics
Rules for entry
long= Close of the candle bigger than both moving averages and close of the candle is between the top and bot levels from Keltner . At the same time the macd histogram is negative and stochastic is below 50.
short= Close of the candle smaller than both moving averages and close of the candle is between the top and bot levels from Keltner . At the same time the macd histogram is positive and stochastic is above 50.
Rules for exit
We exit when we meet an opposite reverse order.
This strategy has no risk management inside, so use it with caution !

Scalping EMA ADX RSI with Buy/Sell AlertsThis is a study indicator that shows the entries in the strategy seen in one of the youtube channel so it does not belong to me. I can't tell who it is because it's against the House Rules to advertise but you can find out if you look for it on youtube. Default values of oscilators and ema adjusted as suggested. He says he got the best results in 5 min timeframe but i tried to make things as modifiable as possible so you can mess around with the settings and create your own strategy for different timeframes if you'd like. Suggested to use with normal candlestick charts. The blue line below indicates the ADX is above the selected threshold set in the settings named "Trend Ready Limit". You can set alerts for Buy, Sell or Buy/Sell signal together.
The entry strategy itself is pretty straight forward.
The rules for entry are as follows, the script will check all of this on auto and will give you buy or sell signal :
Recommended time frame: 5 min
For Long Entry:
- Check if price above the set EMA (Can disable this rule if you'd like in the settings)
- RSI is in Oversold
- ADX is above set "Trend Ready" threshold (Meaning there is a trend going on)
- Price must approve the trend of previous candles. This is bullish for buy entries and bearish for sell entries.
- Enter with stop loss below last swing low with 1:1 or 1.5:1 take profit ratio.
For Short Entry:
- Check if price below the set EMA (Can disable this rule if you'd like in the settings)
- RSI is in Overbought
- ADX is above set "Trend Ready" threshold (Meaning there is a trend going on)
- Price must approve the trend of previous candles. This is bullish for buy entries and bearish for sell entries.
- Enter with stop loss above last swing high with 1:1 or 1.5:1 take profit ratio.
This is my first indicator. Let me know if you want any updates. I am not sure if i can add everything but i'll try nonetheless.
Changed: Signals will check up to 2 candles before if the RSI is below or above the set value to show signal. This is because sometimes the entry signal is right but the response might be a bit late.

Scalping 2x MACDThis indicator allows you to plot 2 MACD's within one indicator.
Colors :
Pink for the MACD 1 with std settings 12 - 26 - 9
Green for MACD 2 with settign 5 - 15 - 1


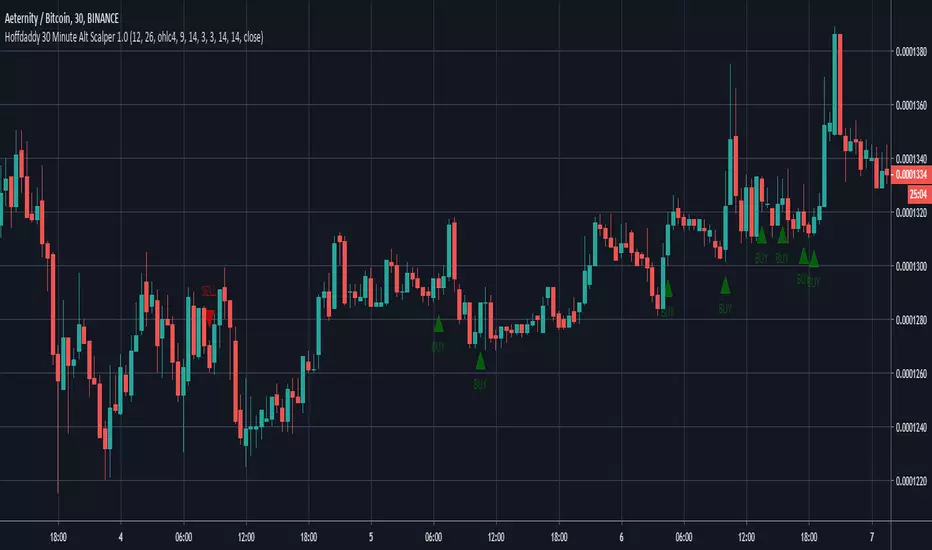
Hoffdaddy 30 Minute Alt Scalper 1.0Scalping indicator for bot trading on altcoins vs BTC. Works best on 30 minutes with minimal DCA, tight stop loss, and 1-2% take profit. No repaint, use candle close on alerts to avoid ghost signals.
PM for temporary access.
As always, I welcome feedback.
Scalping Basics, Indicator v2Auto-plots:
1) After/pre-market range
2) Y OHLC
3) YY OHLC
4) Ability to change background color to split the market into different sessions


Scalping QuantitativeThis is a tool designed to help with mean reverting trades but at the same time provide trend to determine direction. Bar coloring is based on a logarithmic oscillator with red meaning overbought and green meaning oversold.
By giving trend, it can help decide if a trade should be taken. This tool isn't designed for highly volatile markets.

Scalping RibbonCombination of 4 short sma's in one ribbon with optional parabolic sar ribbon color defined by long term ema


Scalping Criptomania EMA - VolumenVersión 1 - 15/02/2018
Indicadores utilizados :
- Ema 13 ( red )
- Ema 34 ( blue )
- Volumen MV : 10
- Bandas de bollinger
Entrada (flecha hacia arriba verde) : cruce hacia arriba y volumen mayor que mv(10)
Salida (flecha hacia abajo roja) : Cruza las bandas de bollinger y vuelve a bajar dará salida o vuelven a cruzar las ema.


1m EMA Scalper + Lot Size HUD [DIMS]1m EMA Scalper w/ Pre-Alert + Lot Size HUD
Purpose:
A short-term (1-minute) scalping strategy for assets like XAUUSD, GBPJPY, and GER30/GER40, showing precise buy/sell signals, stop-loss, take-profit, breakeven levels, and a dynamic lot size HUD for risk management.
Key Features:
Signals:
Buy/Sell signals generated using EMA crossover (fast vs slow) + RSI filter + optional candle/volume filter.
Signals only appear during selected trading sessions (London & NY).
Pre-alert signals appear 30 seconds before the candle closes, so you can prepare to enter.
Stop Loss / Take Profit / Breakeven:
SL calculated using ATR × multiplier and adjustable for spread.
TP follows a configurable risk:reward ratio.
Breakeven can be toggled on/off and uses a custom multiplier.
Lines have customizable length, width, and style.
Lot Size HUD:
Automatically calculates lot size based on account balance, risk % or fixed amount, and leverage.
Shows stop distance in pips/points.
HUD retains the value for 5 minutes after the signal candle.
Flashes 30 seconds before the candle closes to prepare for the trade.
Auto-adjusts for XAUUSD, GBPJPY, GER30/GER40.
Alerts:
Alerts for pre-alert signals and confirmed signals.
Can toggle alerts on/off for both types.
Customization & Display:
Toggle buy/sell signals, SL/TP/BE lines, and pre-alert arrows.
Works entirely on-chart, displaying only the essential arrows, lines, and HUD.
Summary:
It’s a ready-to-trade scalping tool that combines fast technical signal detection with risk management, pre-alert timing, and visual trade guidance — letting you focus on execution without manually calculating lot size or monitoring every candle.

CDC ActionZoneCDC ActionZone – Full English Explanation (Enhanced Version)
The CDC ActionZone indicator is a trend-following system designed to visually classify market conditions based on moving-average structure, price position, and momentum. It helps traders identify trend phases, generate buy/sell signals, and understand market bias at a glance. This version includes upgraded features such as labels, ribbons, momentum filters, optional fixed-timeframe mode, and additional moving averages (SMA20/50/100/200).
🔵 1. Core Concept
The CDC ActionZone is built on a fast vs slow moving average crossover.
Default design uses EMA12 vs EMA26, but this version uses customized SMA/EMA periods with smoothing.
Market “zones” (colors) are determined by:
The direction of the crossover (Bull or Bear)
The position of price relative to both moving averages
Each zone reflects a strength or weakness level in the current trend.
🔵 2. Moving Average Zones (Color Logic)
Bullish / Buy Zones
Color Meaning
Green Strong Buy – Fast MA > Slow MA AND price > Fast MA
Light Blue (LBlue) Early Buy 1 – Bearish MA crossover, but price above Fast MA & below Slow MA
Blue Early Buy 2 – Bearish MA crossover, but price above both MAs
Bearish / Sell Zones
Color Meaning
Red Strong Sell – Fast MA < Slow MA AND price < Fast MA
Yellow Early Sell 1 – Bullish MA crossover, price above Slow MA but below Fast MA
Orange Early Sell 2 – Bullish MA crossover, price below both MAs
These zones help users understand trend strength, weakness, and transition phases.
🔵 3. Buy/Sell Signals (Core CDC Strategy)
Simple CDC Method:
Buy when the first Green bar appears after a non-Green bar
Sell when the first Red bar appears after a non-Red bar
The system tracks:
buycond = first Green bar
sellcond = first Red bar
Internal state using bullish and bearish cycles
The indicator plots:
Green circle below bar = Buy
Red circle above bar = Sell
🔵 4. Context Ribbon
A ribbon can be plotted at Top or Bottom to show current overall bias:
Green = Bullish cycle
Red = Bearish cycle
This helps visually detect trend phases without clutter.
🔵 5. Assistive Labels
When enabled, a label displays:
Buy/Sell suggestion ("BUY next bar" or "SELL next bar")
Symbol + price + currency
Current trend state (bullish / bearish / sideways)
Automatic deletion ensures only the latest label remains.
🔵 6. Momentum-Based Signals (StochRSI Filter)
This optional module adds confirmation signals using StochRSI with fixed parameters:
RSI length 14
Stoch length 14
Smooth K/D = 3/3
OB/OS = 70/30
It generates:
Triangle-Up = Momentum Buy
Triangle-Down = Momentum Sell
User can set a strictness threshold for stronger signals.
🔵 7. Fixed Timeframe Mode
The indicator offers an advanced mode where all calculations use a fixed timeframe (e.g., Daily), regardless of chart timeframe.
This is useful for:
Multi-timeframe trend confirmation
Lower-timeframe scalping guided by higher-timeframe zones
Uses a special function with request.security() in a non-repainting setup.
🔵 8. Bar Coloring
Bars are automatically colored according to zone:
Green / Blue / Aqua for buy phases
Yellow / Orange / Red for sell phases
Black for neutral
This provides instant visual trend recognition.
🔵 9. Additional SMA Trends (20/50/100/200)
At the end of the script, traditional trend MAs are added:
SMA20 – short-term momentum
SMA50 – mid-term trend
SMA100 – intermediate support/resistance
SMA200 – long-term trend baseline
These help confirm market structure and trend alignment.

ORB Pro w/ Filters + Debug + ORB Fib + Golden Pocket + HTF Trend🚀 ORB Pro – Advanced Opening Range Breakout System
A professional ORB indicator with built-in filters, retest confirmation, EMA/HTF trend alignment, and automatic risk/reward targets. Designed to eliminate false breakouts and give traders clean LONG/SHORT signals with Fibonacci and debug overlays for maximum precision.
This script is an advanced Opening Range Breakout (ORB) system designed for futures, indices, and options traders who want more precision, cleaner entries, and higher win probability. It combines classic ORB logic with modern filters, Fibonacci confluence, and higher-timeframe trend confirmation.
The indicator automatically:
Plots the ORB box based on user-defined NY session times (default: 9:30–9:45 EST).
Generates long/short signals when price breaks the ORB range, with optional conditions like:
Candle close outside the range
Retest confirmation (with tolerance %)
Volume spike validation
EMA trend alignment
Higher-timeframe EMA slope alignment
Cooldown filters to prevent over-trading
Integrates Fibonacci retracements & extensions from the ORB box for confluence levels.
Includes Golden Pocket (0.5–0.618) retests for precision entries
Risk/Reward visualization — automatically plots stop loss and take profit levels based on user-defined R:R or fixed % levels.
Debug mode overlay to show why a signal is blocked (e.g., low volume, ORB too small, too late, wrong trend).
This tool is built for scalpers, day traders, and 0DTE options traders who need both flexibility and discipline.
🧑💻 How to Use
Load the indicator on your chart (works best on 1m, 5m, and 15m).
Adjust ORB window (default 9:30–9:45 EST).
Select filters (candle close, retest, volume, EMA, HTF trend).
Watch for Long/Short labels outside ORB box with filters aligned.
Manage trades using plotted SL/TP levels or your own Webull/R:R calculator.
✅ Best Use Cases
Futures (NQ1!, ES1!)
ETFs (QQQ, SPY, IWM)
0DTE Options Trading
Scalping around market open
🚀 Why ORB Pro?
This is more than a standard ORB indicator. It’s a professional breakout system with filters designed to avoid false breakouts, automatically handle risk/reward, and guide traders with clear visual signals. Perfect for both systematic day traders and discretionary scalpers who want structure and confidence.
👉 Recommended starting point:
Load defaults → trade the 15m ORB with EMA + HTF filters on → let the script handle retests and stop/target placement.
⚠️ Disclaimer
This tool is for educational purposes only. It does not constitute financial advice. Trading carries risk, and past performance does not guarantee future results. Always test on paper trading before using real capital.

History Signals — simsonBeautiful Visual Trade Box
✅ The indicator draws a clean, professional box showing:
• Red zone = Stop loss area
• Green zone = Target zone
• Dashed line = Extended Target 2
This gives a clear trade map with zero clutter.
⸻
✅ Alerts Ready (Entry Alerts Included)
Receive instant notifications for:
• Long Entry
• Short Entry
Useful for mobile trading & automated alerts.
⸻
🎯 Purpose & Usage
This tool is built for traders who want:
• Clean charts (no EMA mess)
• High-probability signals only
• Automatic SL + target visualization
• 5m / 15m scalping & intraday accuracy

AnchorPulse RWAP Universal ScalperWhat it is
AnchorPulse Scalper is an intraday indicator that reads price in real time through three ideas working together.
A live pivot engine that detects the current micro leg.
An Anchored Range Weighted Average Price that starts at each new leg or session.
An adaptive rhythm score that communicates a simple bias: Buy, Sell, or Wait.
The goal is clarity. You get one anchor line, soft bands that show stretch, discrete Buy and Sell marks, and a plain-language dashboard that says Trend, Phase, Bias, Momentum, Volatility, Stretch, ETA to next turn, and Regime. No external dependencies and no lookahead. It is designed for standard chart types on one to five minute timeframes across liquid symbols such as major FX, index futures, large cap stocks, and mainstream crypto pairs.
What makes it original
Most scalpers either track a fixed moving average or draw from a session VWAP. AnchorPulse does neither. The anchor resets at every new micro leg detected by a real time pivot engine that measures distance in units of ATR rather than in fixed points. This produces a responsive anchor that updates only when the market proves a leg has turned. On top of that, the rhythm timer keeps an average of how long legs usually last, so the indicator can treat the start and the end of a leg differently. Early in a leg it favors continuation signals. Late in a leg it watches for mean reversion. This mix of an ATR-based leg detector, a leg-anchored RWAP, and a rhythm aware bias is the core originality.
Plain explanation of the calculations
Pivot engine. While price travels up, the script tracks the highest high reached since the last pivot. If price pulls back from that extreme by at least a user defined fraction of ATR, the leg flips down. The reverse applies to down legs. The distance threshold is adaptive because ATR changes with volatility. A short cooldown in bars can prevent double flips on violent bars.
Anchored Range Weighted Average Price. From the first bar of each new leg the script accumulates a weighted average of the typical price, where the weight is the true range of each bar. The anchor can also reset at the start of a session and can ignore the very first session bar to avoid overweighting the open gap.
Progress and phase. The script measures how far price traveled from the last pivot relative to the reversal threshold. That is progress. At the same time it maintains an exponential average of leg duration in bars. The current leg age divided by that average is the age ratio. An age ratio below an adaptive early threshold means Early. Above an adaptive late threshold means Late. The thresholds drift with recent variability in leg length so they match the rhythm of the market.
Wick pressure and intrabar skew. Lower wick minus upper wick, normalized by ATR and smoothed, acts as tape pressure. The sign of close minus open, smoothed, is intrabar skew. They are combined into a compact momentum read.
Bands and stretch. The script computes the deviation of typical price from the anchor and builds soft bands around the anchor. Standard deviation is capped by a multiple of mean absolute error to avoid inflated bands just after a pivot.
Regime filter. You may optionally gate continuation entries when the higher timeframe EMA disagrees, or gate reversals when ADX shows strong trend.
Adaptive edge score. Progress and momentum are turned into percentile scores using a normal CDF of their rolling z scores. This yields a familiar zero to one hundred scale that is easier to read than raw values. Early in an up leg adds a small bonus to long bias. Early in a down leg adds a small bonus to short bias.
Gap cap. Signals are rejected if price is too far from the anchor. The cap is expressed as a fraction of price, which scales across symbols.
What you see on the chart
One white anchor line. Two transparent bands. Subtle green or orange background when a bias is active. Buy marks below bars and Sell marks above bars. Small triangles at pivots. Bar tint softly aligned with momentum. A compact table in the corner that tells you the state in plain language. On alert, a single JSON line can be sent to your alert channel with ticker, timeframe, trend, phase, bias, edge score, stretch, ETA in bars, and regime note.
How to use it in practice
Choose a liquid symbol and a one to five minute timeframe.
Keep the mode on Hybrid until you learn the personality of the market. If you notice long directional pushes, try Continuation mode. If you see frequent fades near the end of legs, try Reversal mode.
Read the table. Trend shows Up or Down according to the current leg. Phase shows Early, Mid, or Late from the rhythm timer. Bias shows Buy, Sell, or Wait once the signal rules and the gap cap are satisfied. Momentum reads Strong Up, Neutral, or Strong Down from wick pressure and skew. Volatility shows Calm, Average, or Wild relative to an ATR baseline. Stretch vs anchor prints the distance between close and the anchor as a percent of price. ETA shows how many bars remain to the average leg length if such a read is meaningful. Regime reflects the optional gate: None, HTF Up, HTF Down, Strong, or Soft.
Focus on the anchor. Continuation longs are stronger when price holds above the anchor in the first part of an up leg with positive momentum and adequate progress. Continuation shorts are the mirror case below the anchor. Reversal longs are stronger when a down leg is late, price crosses the anchor, and momentum flips positive. Reversal shorts are the mirror case in late up legs.
Respect the gap cap. When price is stretched far away from the anchor, skip signals and wait for re-alignment or a fresh leg.
Keep the chart clean. The script is designed to work on its own. If you add other tools, make sure they do not paint multiple backgrounds or heavy drawings that obscure the anchor and the bands.
Inputs explained with practical defaults
The script ships with sensible defaults and all inputs provide tooltips inside the indicator. The description here is included so traders who do not read code can still understand how to tune it.
Signal mode. Continuation uses early leg logic. Reversal uses late leg logic at anchor crosses. Hybrid allows both and lets the edge score decide.
ATR length and Pivot reversal in ATR. These govern flips. Shorter ATR and smaller reversal multiples yield faster turns and more signals. Longer and larger do the opposite. A middle ground such as ATR 50 with reversal 0.75 often reads well across liquid markets.
Rhythm smoothing length and Freeze bars after flip. The first sets how quickly the average leg length adapts. The second prevents double flips on wide bars. Values around 20 and 1 to 3 bars work well for most symbols.
Session hours, Session reset, and Skip first session bar. These are optional. Day sessions in equities can benefit from a reset and from skipping the first bar so the anchor is not dragged by the open gap. Round the session to your venue.
Wick pressure length and Intrabar skew length. They control how quickly the micro momentum reacts. Values between 6 and 12 for wick pressure and 4 to 10 for skew are common.
Early and Late thresholds and the Adaptive option. If you turn adaptation on, the thresholds drift with leg variability. The adaptiveness setting controls the strength of that drift.
Minimum progress and Maximum stretch vs anchor. The first ensures that continuation signals only occur once the leg moved a minimum distance from the last pivot. The second prevents chasing far from the anchor. As a rule, raise minimum progress when the market chops and reduce it on trend days. Keep stretch around one to two percent for many symbols, then adjust by product.
Regime filter. Higher timeframe EMA supports trend alignment. ADX supports a simple read on the strength of trend. Use one at a time or none, depending on your preference.
Adaptive scoring lookback. The percentile logic needs a modest window. Values near one hundred twenty bars tend to give stable ranks without lagging too much.
Band settings. Band length and width control the look of the soft channel around the anchor. The cap versus mean absolute error is there to keep the bands realistic just after flips.
Visual controls. Pick labels, triangles, or circles, and choose to mark only state changes if you prefer a very clean chart.
Why the dashboard uses plain language
Many traders prefer to reason in simple terms rather than in raw values. The table abstracts the math into natural categories such as Early versus Late, Calm versus Wild, or Strong Up versus Strong Down. The only numeric reads are Stretch and Edge score because these help in threshold decisions. Stretch is a percent of price so it scales across markets. Edge is a normalized score from zero to one hundred that reflects the combined progress, momentum, and phase. The table is intended to be the only element you need to glance at during a fast session once you learn the anchor and the band cues.
Design choices and integrity
No repaint. The script uses bar closes and standard Pine semantics with lookahead off in security calls. There are no offset tricks that move plotted values after the fact.
One background painter. Background tint is created by a single call to avoid vertical stripes.
Reset logic is explicit. The anchor resets at a pivot or at session start if that option is enabled. This is written to be transparent so you know why the anchor restarted.
Conservative defaults. Out of the box, the script is not tuned to over trade. It communicates bias rather than forcing entries.
Clean chart guidance. The tool is meant to be used on standard bars or candles. It is not intended for synthetic chart types such as Heikin Ashi, Renko, Kagi, Point and Figure, or Range for the purpose of signal generation.
How to read a few common situations
Breakout with strong follow through. Trend reads Up. Phase reads Early. Momentum reads Strong Up. Stretch sits inside the band. Bias shows Buy. This is the typical continuation long.
Extended push into exhaustion. Trend reads Up. Phase reads Late. Momentum cools. Stretch prints a high positive percent of price. Bias flips to Wait, sometimes to Sell after an anchor cross. This is the potential reversal short.
Mean reverting chop. Trend flips often. Phase hangs around Mid. Momentum flips sign frequently. Stretch hovers near zero. Bias often prints Wait. In this case you let the market speak and only act when the leg matures or when stretch spikes away from the anchor.
Trend day with strength. ADX filter reads Strong. Continuation is allowed. Reversal attempts are blocked. Bias favors the dominant direction.
Session open. If you selected a session reset and chose to skip the first bar, the anchor starts at the second bar and the first prints do not dominate the anchor.
Limits and realistic expectations
This indicator measures leg structure and micro pressure to suggest a bias. It is not a self-contained trading system. It does not size positions, pick stops, or set take profits. It does not promise accuracy or profits. In violent markets the pivot detector can flip and then flip back. Cooldown reduces this effect but cannot remove it. During news and illiquid hours the anchor can move very quickly. Wide slippage and spread can make any intraday approach impractical. These are standard realities of intraday trading and they also apply here.
Suggested workflows
Discretionary scalper. Keep the chart clean. Use the table to decide whether to engage, then work entries at the anchor or inside the band. Focus on position risk and a predefined stop level independent of the script.
Session specialist. If you trade a venue with strong sessions such as US equities or major FX sessions, enable the session reset. Many traders find the tool shines in the first two hours and the last hour of an active session.
Multi timeframe monitor. Keep AnchorPulse on one to five minutes and a simple higher timeframe EMA on a separate chart. If you prefer a single chart, switch the regime filter to HTF Trend and let the indicator handle it.
Alert driven workflow. Create alerts on Buy or Sell. The payload contains the essential context so you can log and review. Use the payload fields to build a small notebook of cases you like to take.
Why it is published as protected
The script contains original logic that relies on a compact set of calculations not commonly seen together. Publishing as protected keeps the logic intact while still giving the community full access through the Public Library.
Frequently asked questions
Does it repaint
No. The pivot flips on confirmed bars using ATR distance. The anchor, bands, and dashboard read from that state and do not shift after the bar closes.
What settings should I change first
Try the reversal distance in ATR and the minimum progress. These two govern how active or selective the tool becomes. If you see too many flips, raise the ATR multiple or the freeze bars. If you want faster action, lower them slightly.
What is a reasonable stretch cap
One to two percent of price is a useful starting point for many symbols. Thin products may need a larger cap. Extremely liquid products can often work with a smaller cap.
Should I use the regime filter
On days with persistent trend, the higher timeframe EMA filter or the ADX filter can help keep you with the flow. On rotational days, consider turning the filter off to allow more two sided action.
Can I use it on higher timeframes
The logic works on any timeframe, but the design and defaults target one to five minutes. If you go higher, adjust the ATR length, reversal distance, and rank lookback accordingly.
Can I combine it with volume
Yes. A simple volume filter that marks above average volume near the anchor can help you time entries. Keep the chart readable.
Risk notice and user responsibility
This indicator is a tool for research and education. It does not give investment advice, trade recommendations, or any guarantee of outcomes. All trading carries risk including the loss of capital. Past performance is not a reliable guide to future results. You are solely responsible for your trading decisions, for verifying that the indicator behaves as you expect on your data and platform settings, and for selecting appropriate risk controls such as position sizing, stops, and loss limits.
Summary
AnchorPulse Scalper is a concise way to read the market’s current leg, its anchor, and its rhythm. The pivot engine tells you direction. The leg-anchored RWAP shows where value sits for this micro move. The adaptive score simplifies momentum and progress into a familiar scale. The dashboard translates complex calculations into the plain words that scalpers actually use. If you prefer simple signals, enable alerts and let them flow into your log. If you prefer context, watch the anchor and bands as the leg evolves and let the rhythm guide your timing. Use it respectfully on a clean chart, stay realistic, and keep your own rules for risk.
