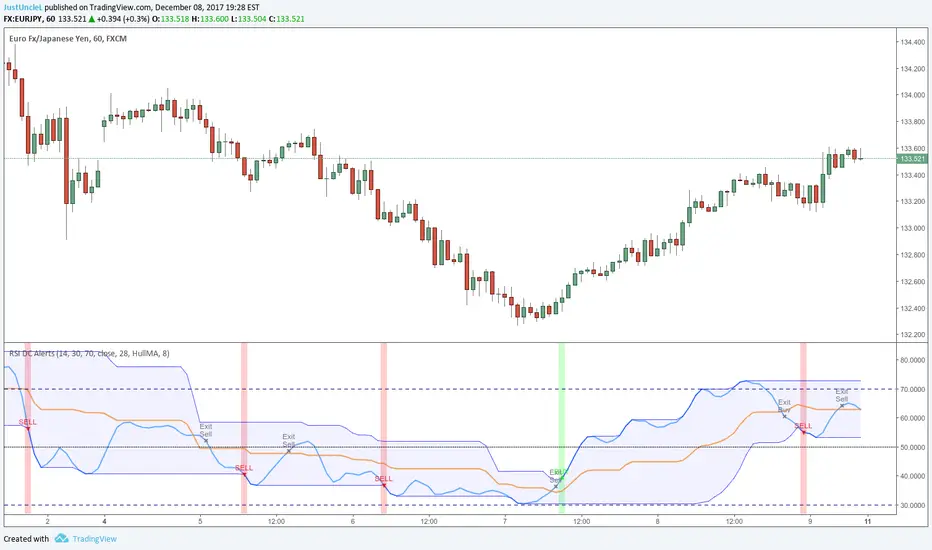
RSI Donchian R1 Alerts by JustUncleLThis study is based on an idea by presented by RicardoSantos and JayRogers of using Donchian Channel (DC) on the RSI curve. The idea being that when RSI passes through the DC centre and touches the Highest/Lowest DC then price action tends to follow in the same direction and stay there until the RSI crosses DC centre line again.
This script expands on the original idea by including alert and exit signals based on the above rules. These alerts are also filtered by the rule: they must be within the Oversold and Overbought boundaries of the RSI.
There is also the option of applying MA smoothing to the RSI curve, the HullMA (8) is recommended (default).
Each Entry and Exit signal creates an Alertcondition that can be picked up by the TradingView Alarm system.
TIP: Remember this type of Trading technique only works well in a trending market. Do not try to trade this technique in a ranging/flat market.
Cari skrip untuk "rsi"
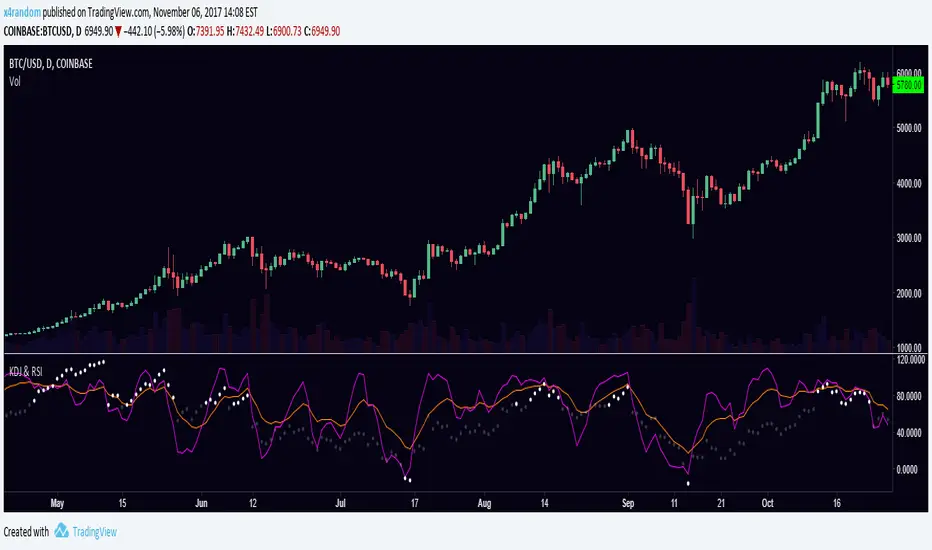
KDJ & RSIRSI and KDJ indicator combined.
KDJ: Buy when J (purple) is going up and and crossing KD (orange) from below. Sell vise versa.
RSI: Overbought when RSI is over 70, oversold when RSI is under -10.
RSI cyclic smoothedCyclic Smoothed Relative Strength Indicator
The cyclic smoothed RSI indicator is an enhancement of the classic RSI, adding
* additional smoothing according to the market vibration,
* adaptive upper and lower bands according to the cyclic memory and
* using the current dominant cycle length as input for the indicator.
The cRSI is used like a standard indicator. The chart highlights trading signals where the signal line crosses above or below the adaptive lower/upper bands. It is much more responsive to market moves than the basic RSI:
The indicator uses the dominant cycle as input to optimize signal, smoothing and cyclic memory. The referenced book provides open indicator source code, indicator characteristics, trading performance and how to obtain the current dominant market cycle. The get more in-depth information on the cyclic-smoothed RSI indicator, please read Chapter 4 "Fine tuning technical indicators" of the book "Decoding the Hidden Market Rhythm" available at Amazon .
Or visit www.whentotrade.com for cycle analytics background, current dominant market cycles for major markets and examples.

RSI candlesLike Volume-Spread-Analysis , this plot is an attempt to show a little of the candle's feeling.
Some people say that "the most important thing is closure", but we can read some patterns on the RSI candle. And if we use volume changes, it can sometimes make the pattern reading clearer. This indicator is intended to help as a support.
The technique is simple: an RSI candle, not just a linear graph. And also with the option to weigh the volume changes.
Ideas, corrections and suggestions.
Those are always welcome
Al igual que el Volume-Spread-Analysis , esta presentación del clasico RSI es un intento de mostrar un poco del sentimiento que refleja la vela.
Algunas personas dicen que "lo más importante es el Precio final", pero podemos leer algunos patrones en la vela aun en el RSI. Y si usamos cambios de volumen, puede hacer que la lectura del patrón sea más clara. Este indicador tiene la intención de ayudar como un soporte.
La técnica es simple: una vela RSI, no sólo un gráfico lineal. Y también con la opción de sopesar los cambios de volumen.
Ideas, correcciones y sugerencias.
Son siempre bienvenidos

RSI comboTraditional RSI plus the adx and moment of rsi to show when rsi is exhausted (thick green and red line). Red and green circle indicate the swing (350 swing indicator) and the top and botton colored bars come from RSS (relative spread strength). When rsi is red or green and circles show up is a good signal. Do the last check at the bar color, better if wait until become silver

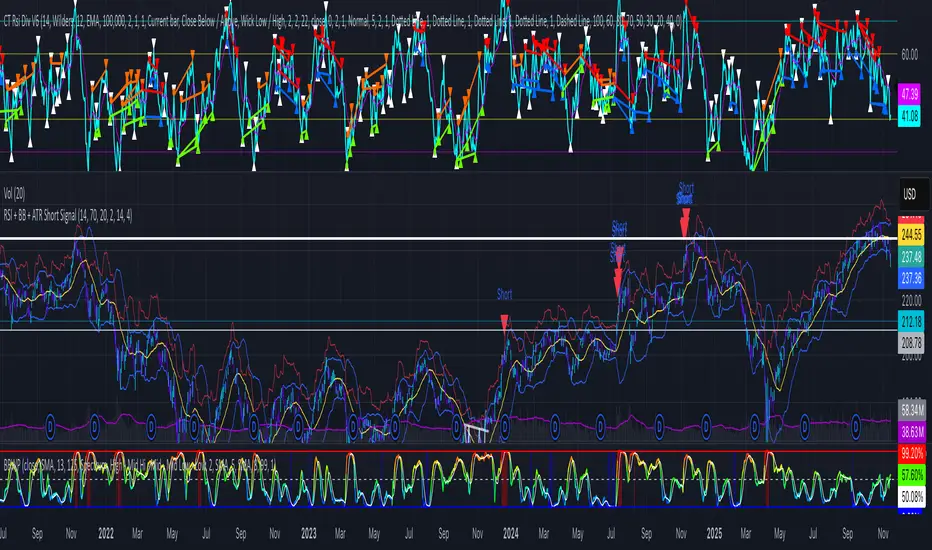
RSI + BB + ATR Short SignalThis indicator highlights potential short setups by combining three conditions:
RSI Overbought – RSI must be above the user-defined level.
Bollinger Band Break – Price must close above the upper Bollinger Band.
Extended Above the 5-Day Low – Price must sit at least X ATR above the recent 5-day low.
When all conditions line up on the same bar, the script plots a red triangle above the candle and triggers an alert so you can act immediately.
To help visualise the setup, the script also plots the full Bollinger Bands (upper, middle, lower) and a line showing the threshold of 5-day-low + ATR × multiplier. You can adjust RSI length and level, Bollinger settings, ATR length, and the ATR multiplier.
RSI Divergence on 15-Minute with 5min & 1min CorrectionUse the 5 minute chart to identify 15 minute rsi divergence, showing the 5 and 1 min rsi levels "participating in" the correction of the 15 minute rsi divergence.

RSI Divergence on 1-Hour with 15min & 5min CorrectionUsing the 15 minute timeframe, rsi divergence on the hourly chart is "tracked" by the 15 and 5 min rsi levels to watch for the hourly chart's rsi correction.

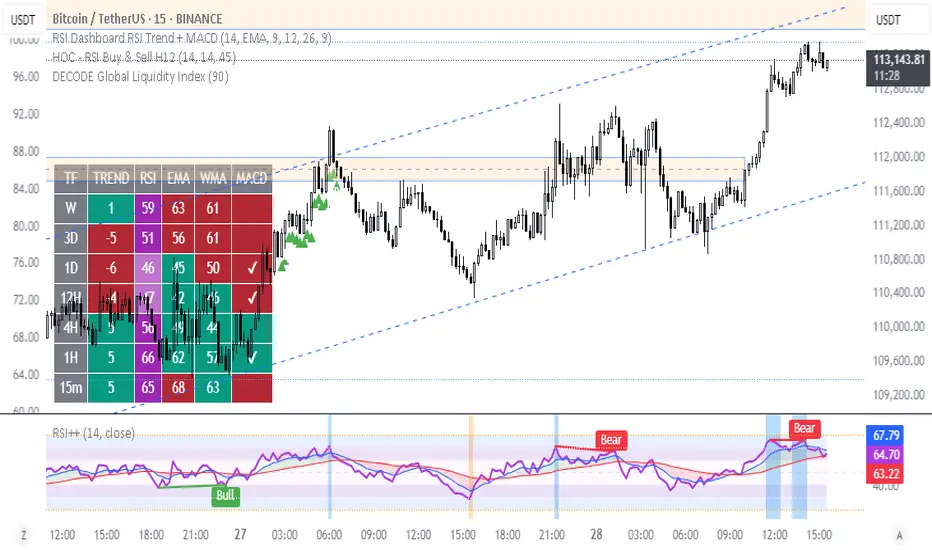
RSI MTF Table - 12 Pairs (1,5,15)
The relative strength index measures the speed and magnitude of an asset's recent price changes. Therefore, it is considered a momentum indicator in technical analysis. Essentially, the RSI is the ratio of the days an asset's value increases to decreases over a given period.
Generally speaking, if the RSI is around 50, we do not expect strong movements. RSI above 65 or below 35 are areas we expect. In this context, this chart and the general momentum in 1-5-15 minutes allow us to quickly determine the parity we will trade. It is useful for intraday trading and scalping.

RSI BandsPlots adaptive ATR bands around the 27-EMA to approximate RSI overbought and oversold zones directly on price. Provides a clean visual reference for RSI-like extremes without displaying the RSI itself.

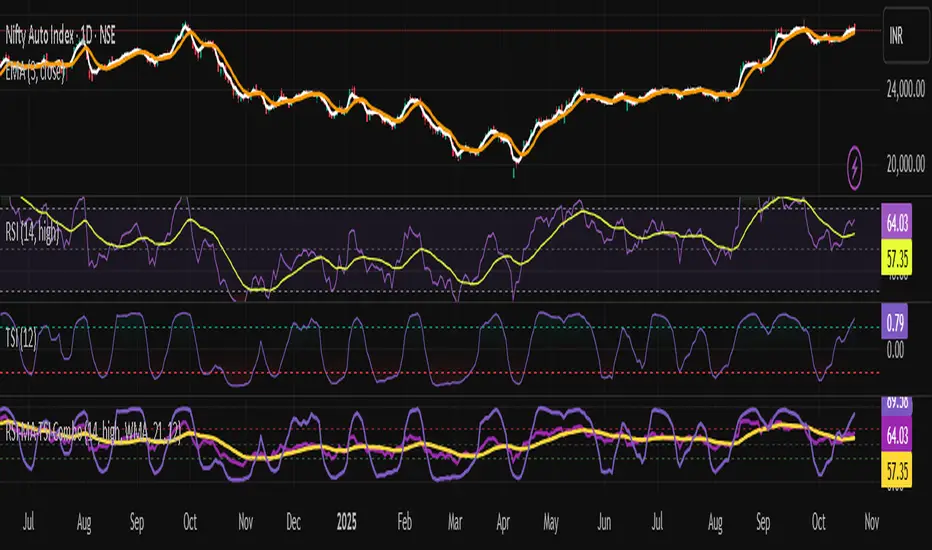
RSI + TSI✅ All 3 indicators in one pane
✅ RSI and RSI MA with standard zones (30, 50, 70)
✅ TSI scaled to 0–100 range for alignment with RSI
✅ Color-coded TSI fill for quick trend recognition (green = bullish, red = bearish)
✅ Compatible with TradingView v6
RSI Reversal + BB RSIReversal Alerts
SELL Reversal (reversalSELL)
Triggers when:
RSI touches or crosses above the upper BB, and
The current candle is bearish (close < open).
→ Plots a small red circle above the candle
→ Fires alert named “reversalSELL”
BUY Reversal (reversalBUY)
Triggers when:
RSI touches or crosses below the lower BB, and
The current candle is bullish (close > open).
→ Plots a small green circle below the candle
→ Fires alert named “reversalBUY”

RSI Prior DayLagged RSI indicator showing the prior day's RSI(14) value for easy divergence detection. Plot it alongside current RSI to spot bullish/bearish signals. Ideal for swing traders scanning for momentum shifts.
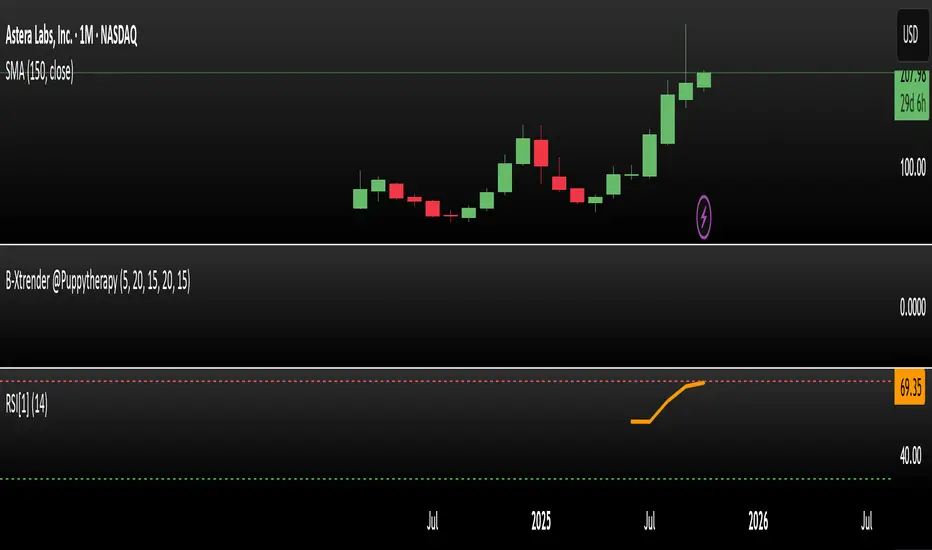
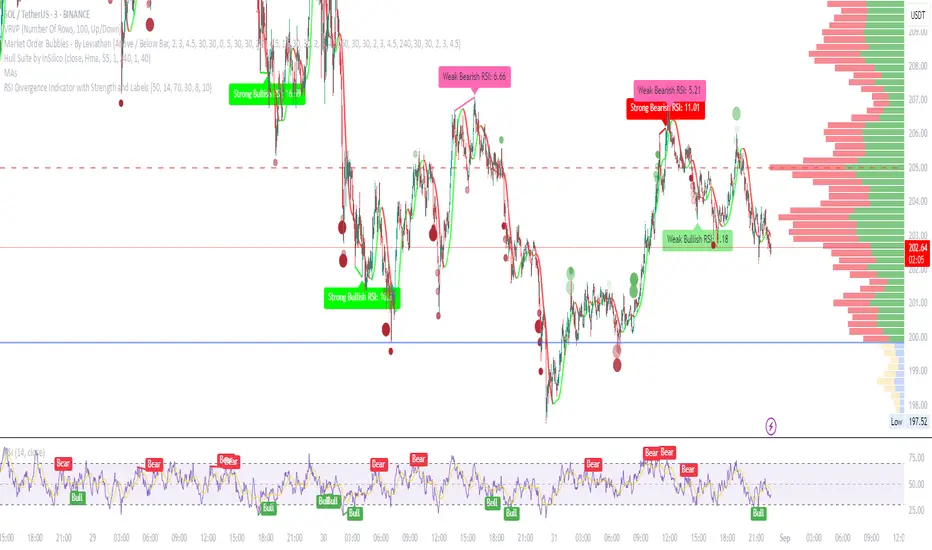
RSI Divergence Indicator with Strength and LabelsHere's a complete Pine Script (version 5) for a TradingView indicator that detects and plots bullish and bearish RSI divergences. This is based on a proven method that tracks price and RSI swings while RSI is in oversold/overbought territories, then checks for mismatched highs/lows within a configurable bar distance.
RSI Plus – Divergence + EMA/WMAThis is an advanced RSI indicator with multi-timeframe dashboard support.
Features:
Customizable Moving Averages (EMA, WMA, SMA, VWMA, SMMA)
Divergence detection
RSI zones with background highlights
Clear buy/sell signals with visual alerts
Perfect for traders who want both classic RSI analysis and cross-timeframe confirmation in one tool.
Multi-Timeframe RSIRSI Divergence (Time-Based Engine)
This script is a powerful and highly customizable tool designed to automatically detect and display RSI divergences from up to three independent, user-defined timeframes directly on your chart. It eliminates the need to manually switch between timeframes to find these critical trading signals, allowing you to see long-term and short-term divergences all in one place.
The engine is built to be flexible, supporting both regular (reversal) divergences and hidden (trend-continuation) divergences. It's designed for traders who rely on divergence analysis as a core part of their strategy.
Key Features
Multi-Timeframe (MTF) Analysis: Configure and display divergences from up to three different timeframes simultaneously (e.g., show 4-Hour, Daily, and Weekly divergences on your 1-Hour chart). Each timeframe operates independently with its own settings.
Regular & Hidden Divergence: The script can detect both standard regular divergences that signal potential reversals and hidden divergences that suggest a trend may continue.
Configurable Pivot Strength: You have full control over the sensitivity of pivot detection. The 'Left Strength' and 'Right Strength' settings allow you to define what qualifies as a significant price pivot, filtering out market noise.
Bar Count Filter: Refine your signals by setting the minimum and maximum number of bars allowed between two pivots. This ensures you only see divergences that fit your specific strategic timeframe.
Dedicated Alerts: Each of the three timeframes has its own "Enable Alerts" toggle. When a new divergence line is drawn on the chart for a specific timeframe, a corresponding alert can be triggered, ensuring you never miss a potential setup.
Full Visual Customization: Tailor the look and feel of the indicator to your preference. Each timeframe has unique color settings for its bullish and bearish lines, allowing for easy visual identification. You can also toggle the visibility of various chart markers to keep your view clean.
How to Use
1. Add the indicator to your chart.
2. Open the Settings panel.
3. For each timeframe you wish to use (1, 2, or 3), check the "Enable Timeframe" box.
4. Select the desired Timeframe, RSI Length, and Pivot Strength for each active engine.
5. Adjust the Min/Max Bars filter to match your trading style.
6. If you want to receive notifications, check the "Enable Alerts" box for the desired timeframe(s). Then, create an alert using TradingView's alert manager, selecting the indicator and choosing the "Any alert() function call" option.

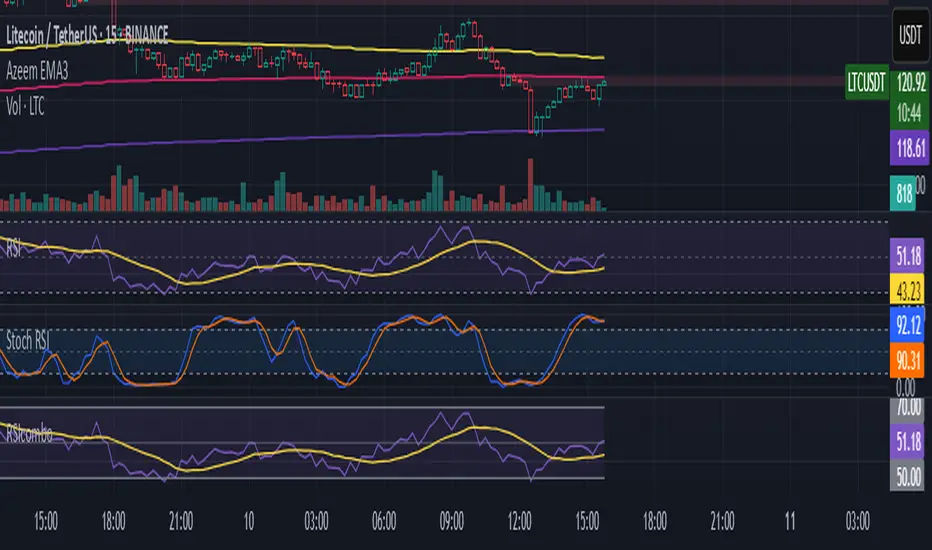
RSI/Stoch RSI ComboIt shows both rsi and stoch rsi as one indicator. You need to select which one using checkbox.
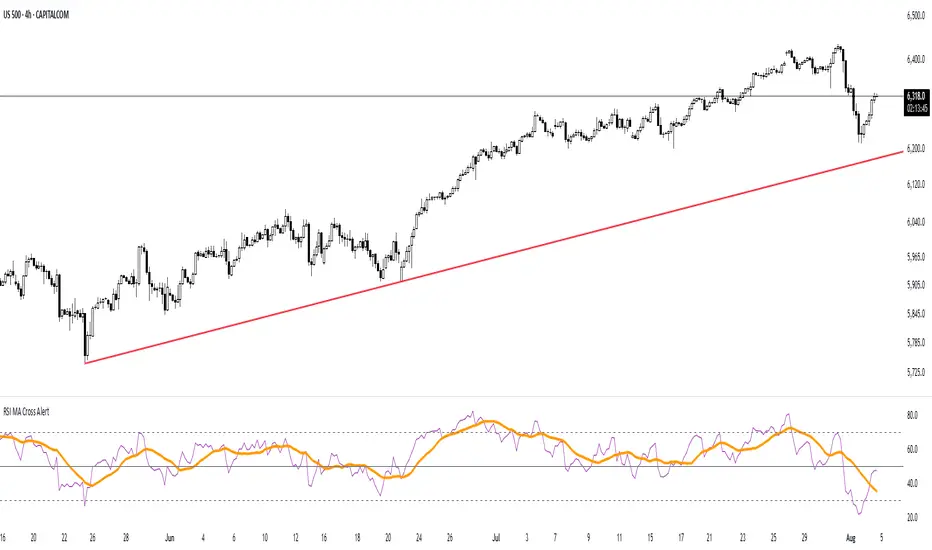
RSI MA Cross AlertAlerts when RSI-based Moving Average crosses above 50. Can be used on any symbol and timeframe. Displays RSI, RSI-MA, and levels 30/50/70.
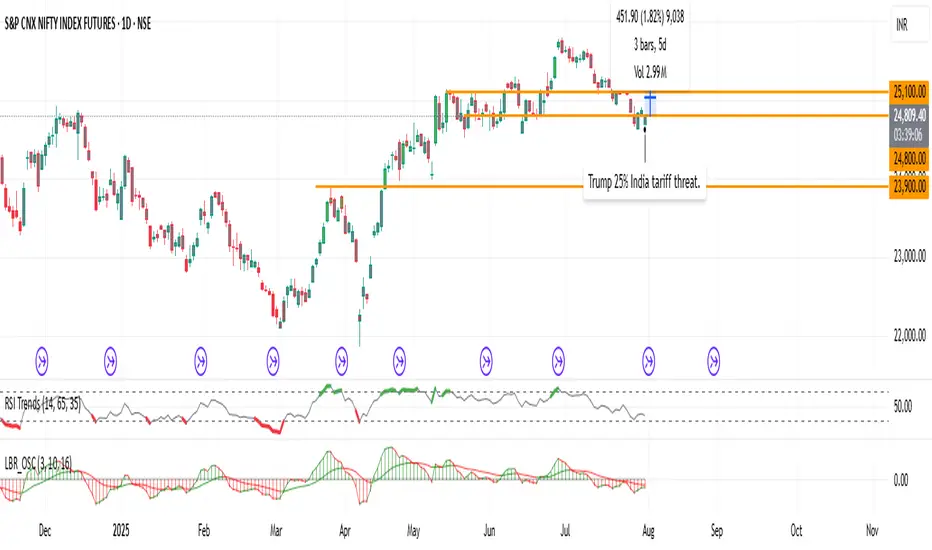
RSI TrendsColor chart with RSI colors
Simple RSI which colors green candle when RSI above 65, red when below 35 and grey when in between.
RSI + VWAP Strategy by vipindaskr🔍 This script combines RSI and VWAP for intraday trend-based entries.
✅ *Buy Signal:*
- Price above VWAP
- RSI > 60
- Green background + up triangle shown
❌ *Sell Signal:*
- Price below VWAP
- RSI < 40
- Red background + down triangle shown
📈 Ideal for Nifty 50 intraday traders using 5-minute chart.
Developed by vipindaskr 💻

RSI Mansfield +RSI Mansfield+ – Adaptive Relative Strength Indicator with Divergences
Overview
RSI Mansfield+ is an advanced relative strength indicator that compares your instrument’s performance against a configurable benchmark index or asset (e.g., Bitcoin Dominance, S&P 500). It combines Mansfield normalization, adaptive smoothing techniques, and automatic detection of bullish and bearish divergences (regular and hidden), delivering a comprehensive tool for assessing relative strength across any market and timeframe.
Originality and Motivation
Unlike traditional relative strength scripts, this indicator introduces several distinctive improvements:
Mansfield Normalization: Scales the ratio between the asset and the benchmark relative to its moving average, transforming it into a normalized oscillator that fluctuates around zero, making it easier to spot outperformance or underperformance.
Adaptive Smoothing: Automatically selects whether to use EMA or SMA based on the market type (crypto or stocks) and timeframe (intraday, daily, weekly, monthly), avoiding manual configuration and providing more robust results under varying volatility conditions.
Divergence Detection: Identifies four types of divergences in the Mansfield oscillator to help anticipate potential reversal points or trend confirmations.
Multi-Market Support: Offers benchmark selection among major crypto and global stock indices from a single input.
These enhancements make RSI Mansfield+ more practical and powerful than conventional relative strength scripts with static benchmarks or without divergence capabilities.
Core Concepts
Relative Strength (RS): Compares price evolution between your asset and the selected benchmark.
Mansfield Normalization: Measures how much the RS deviates from its historical moving average, expressed as a scaled oscillator.
Divergences: Detects regular and hidden bullish or bearish divergences within the Mansfield oscillator.
Timeframe Adaptation: Dynamically adjusts moving average lengths based on timeframe and market type.
How It Works
Benchmark Selection
Choose among over 10 indices or market domains (BTC Dominance, ETH Dominance, S&P 500, European indices, etc.).
Ratio Calculation
Computes the price-to-benchmark ratio and smooths it with the adaptive moving average.
Normalization and Scaling
Transforms deviations into a Mansfield oscillator centered around zero.
Dynamic Coloring
Green indicates relative outperformance, red signals underperformance.
Divergence Detection
Automatically identifies bullish and bearish (regular and hidden) divergences by comparing oscillator pivots against price pivots.
Baseline Reference
A clear zero line helps interpret relative strength trends.
Usage Guidelines
Benchmark Comparison
Ideal for traders analyzing whether an asset is outperforming or lagging its sector or market.
Divergence Analysis
Helps detect potential reversal or continuation signals in relative strength.
Multi-Timeframe Compatibility
Can be applied to intraday, daily, weekly, or monthly charts.
Interpretation
Oscillator >0 and green: outperforming the benchmark.
Oscillator <0 and red: underperforming.
Bullish divergences: potential relative strength reversal to the upside.
Bearish divergences: possible loss of momentum or reversal to the downside.
Credits
The concept of Mansfield Relative Strength is based on Stan Weinstein’s original work on relative performance analysis. This script was built entirely from scratch in TradingView Pine Script v6, incorporating original logic for adaptive smoothing, normalized scaling, and divergence detection, without reusing any external open-source code.

RSI Divergence Indicator - Trading VidhyalayaThis indicator automatically identifies RSI-based bullish and bearish divergences and visually marks them directly on the candlestick chart, making it easier for traders to spot potential reversals.
✅ Key Features:
Bullish Divergence
When the price makes a lower low, but the RSI makes a higher low, the indicator highlights the candle with a green arrow or label to signal potential upward reversal.
Bearish Divergence
When the price makes a higher high, but the RSI forms a lower high, the indicator marks the candle with a red arrow or label to indicate a possible downside move.
Real-time Detection
Divergences are plotted in real-time, helping traders react quickly to changing market conditions.
Candlestick Overlay
Signals are shown directly on the chart, rather than below in a separate panel, allowing for faster and clearer decision-making.
📊 Benefits:
Helps in identifying early trend reversals
Works well with other indicators like MACD, Moving Averages, or Volume
Great for both beginners and advanced traders
Saves time by automating divergence spotting, reducing manual errors

RSI MACD Combined Color StrategyOverview
This indicator combines RSI and MACD signals to create a powerful visual trading system, inspired by TrendSpider's AI Strategy Coder examples. It colors candles based on the alignment of three key technical conditions, providing clear visual signals for potential trend strength and direction.
Technical Components
Core Conditions
RSI (Relative Strength Index) > 50
Indicates bullish momentum when price is trading above the centerline
Traditional indicator of trend strength
MACD Line > Signal Line
Shows positive momentum
Classic signal for potential upward movement
MACD Line > 0
Confirms bullish territory
Indicates overall positive momentum
Color Coding System
🟢 Green Candles: All three conditions are met
Strongest bullish signal
Suggests high probability trading opportunities
⚪ Grey Candles: One or two conditions are met
Neutral or transitioning market
Suggests caution or waiting for stronger confirmation
🔴 Red Candles: No conditions are met
Bearish signal
Suggests potential downward pressure
How to Use This Indicator
For Entry Signals
Look for transitions from red or grey to green candles
Green candles suggest strong bullish alignment
Consider entering long positions when candles turn green
For Exit Signals
Watch for color transitions from green to grey or red
Consider taking profits when candles change from green to grey
Consider stop losses when candles turn red
Risk Management
Use color transitions as part of your broader strategy
Don't rely solely on color changes for trading decisions
Combine with other technical analysis tools and risk management practices
Customizable Parameters
RSI Length (default: 14)
MACD Fast Length (default: 12)
MACD Slow Length (default: 26)
MACD Signal Length (default: 9)
Best Practices
Use multiple timeframes for confirmation
Look for confluences with support/resistance levels
Consider volume and market context
Start with default settings and adjust based on your trading style
Backtest different parameter combinations
Notes
This indicator works best in trending markets
Grey candles can indicate transition periods
Consider market conditions and volatility when interpreting signals
Credits
Inspired by TrendSpider's AI Strategy Coder examples and adapted for TradingView using Pine Script v5.
Disclaimer
This technical indicator is for informational purposes only. Always conduct your own analysis and consider risk management principles before making trading decisions. Past performance does not guarantee future results.
