RSI MTF TableRSI MTF covers the timeframes 1m, 5m, 15m, 1H, 4H and Daily Works on any intraday chart and appears in bottom left of screen Can customise colors and transparencyIndikator Pine Script®oleh mobester16Diupdate 1616468
Smart RSI MTF Matrix [DotGain]Summary Are you tired of trading trend signals, only to miss the bigger picture because you are focused on a single timeframe? The Smart RSI MTF Matrix is the ultimate "Cockpit View" for momentum traders. Unlike chart overlays that can sometimes clutter your price action, this indicator organizes RSI conditions across 10 different timeframes simultaneously into a clean, separate Heatmap pane. It monitors everything from the 5-minute chart all the way up to the 12-Month view , giving you a complete X-ray vision of the market's momentum structure instantly. ⚙️ Core Components and Logic The Smart RSI MTF Matrix relies on a sophisticated hierarchy to deliver clear, actionable context: Multi-Timeframe Engine: The script runs 10 independent RSI calculations in the background, organized in rows from bottom (Short Term) to top (Long Term). Classic RSI Thresholds: Overbought (> 70): Indicates price may be extended to the upside. Oversold (< 30): Indicates price may be extended to the downside. Smart Visibility System (The "Secret Sauce"): Not all signals are equal. A 5-minute signal is "noise" compared to a Yearly signal. This indicator automatically applies Transparency to differentiate importance. The visibility increases by 10% for each higher timeframe slot (Row). 🚦 How to Read the Matrix The indicator plots dots in 10 stacked rows. The position and opacity tell you the direction and significance: 🟥 RED DOTS (Overbought Condition) Trigger: RSI is above 70 on that specific timeframe. Meaning: Potential bearish reversal or pullback. 🟩 GREEN DOTS (Oversold Condition) Trigger: RSI is below 30 on that specific timeframe. Meaning: Potential bullish reversal or bounce. ⚪ GRAY DOTS (Neutral) Trigger: RSI is between 30 and 70. Meaning: No extreme momentum present. 👻 TRANSPARENCY (Signal Strength) The visibility of the dot tells you exactly which Timeframe (Row) is triggered. The higher the row, the more solid the color: Faint (10-30% Visibility): Rows 1-3 (5m, 15m, 1h). Used for scalping entries. Medium (40-60% Visibility): Rows 4-6 (4h, 1D, 1W). Used for swing trading context. Solid (70-100% Visibility): Rows 7-10 (1M, 3M, 6M, 12M). Used for identifying major macro cycles. Visual Elements Structure: Row 1 (Bottom) represents the 5-minute timeframe. Row 10 (Top) represents the 12-Month timeframe. Vertical Alignment: If you see a vertical column of Red or Green dots, it indicates Multi-Timeframe Confluence —a highly probable reversal point. Key Benefit The goal of the Smart RSI MTF Matrix is to keep your main chart clean while providing maximum information. You can instantly see if a short-term pullback (Faint Green Dot) is happening within a long-term uptrend (Solid Gray/Red Dot), allowing for precision entries. Have fun :) Disclaimer This "Smart RSI MTF Matrix" indicator is provided for informational and educational purposes only. It does not, and should not be construed as, financial, investment, or trading advice. The signals generated by this tool (both "Buy" and "Sell" indications) are the result of a specific set of algorithmic conditions. They are not a direct recommendation to buy or sell any asset. All trading and investing in financial markets involves substantial risk of loss. You can lose all of your invested capital. Past performance is not indicative of future results. The signals generated may produce false or losing trades. The creator (© DotGain) assumes no liability for any financial losses or damages you may incur as a result of using this indicator. You are solely responsible for your own trading and investment decisions. Always conduct your own research (DYOR) and consider your personal risk tolerance before making any trades.Indikator Pine Script®oleh DotGain13
Smart RSI MTF [DotGain]Summary Are you tired of constantly switching between timeframes to check the RSI, only to miss the bigger picture? The Smart RSI MTF (Multi-Timeframe) is designed to solve this exact problem. It is a streamlined chart overlay that monitors RSI conditions across up to 10 different timeframes simultaneously —from the 1-minute chart all the way up to the Monthly view. This indicator removes the need for multiple open tabs and declutters your analysis by plotting signals directly on your main chart using a smart "visual hierarchy" system based on transparency. ⚙️ Core Components and Logic The Smart RSI MTF relies on a sophisticated 3-layer logic to deliver clear, actionable context: Multi-Timeframe Engine: The script runs 10 independent RSI calculations in the background. It checks standard intervals (5m, 15m, 1h, 4h, Daily, Weekly, Monthly) to ensure you never miss a momentum extreme on any scale. Classic RSI Thresholds: Overbought (> 70): Indicates price may be extended to the upside. Oversold (< 30): Indicates price may be extended to the downside. Smart Visibility System (The "Secret Sauce"): Not all signals are equal. A 5-minute Overbought signal is "noise" compared to a Weekly Overbought signal. This indicator automatically applies Transparency to differentiate importance: Minutes = High Transparency (Faint). Hours = Medium Transparency. Days/Weeks/Months = No Transparency (Solid/Bold). 🚦 How to Read the Indicator The indicator plots shapes (Labels by default) directly above or below the candles. The appearance tells you the direction and the timeframe significance: 🟥 RED SIGNALS (Overbought Condition) Trigger: RSI is above 70 on a specific timeframe. Location: Placed above the candle bar. Meaning: Potential bearish reversal or pullback. 🟩 GREEN SIGNALS (Oversold Condition) Trigger: RSI is below 30 on a specific timeframe. Location: Placed below the candle bar. Meaning: Potential bullish reversal or bounce. 👻 TRANSPARENCY (Signal Strength) Faint/Ghostly: The signal comes from a lower timeframe (e.g., 5m, 15m). Use for scalping or entry timing. Solid/Bright: The signal comes from a major timeframe (e.g., Daily, Weekly). Use for swing trading and identifying major market turns. Visual Elements Symbol Shapes: Fully customizable (Label, Diamond, Circle, Triangle, etc.) via settings. Stacking: If multiple timeframes trigger at once, symbols will overlay, creating a visually denser and darker color, indicating Confluence . Key Benefit The goal of the Smart RSI MTF is to help traders instantly spot Confluence . When you see a faint short-term signal align with a solid long-term signal, you have identified a high-probability reversal zone without leaving your chart. Have fun :) Disclaimer This "Smart RSI MTF" indicator is provided for informational and educational purposes only. It does not, and should not be construed as, financial, investment, or trading advice. The signals generated by this tool (both "Buy" and "Sell" indications) are the result of a specific set of algorithmic conditions. They are not a direct recommendation to buy or sell any asset. All trading and investing in financial markets involves substantial risk of loss. You can lose all of your invested capital. Past performance is not indicative of future results. The signals generated may produce false or losing trades. The creator (© DotGain) assumes no liability for any financial losses or damages you may incur as a result of using this indicator. You are solely responsible for your own trading and investment decisions. Always conduct your own research (DYOR) and consider your personal risk tolerance before making any trades.Indikator Pine Script®oleh DotGainDiupdate 9
Stochastic RSI - MTF - Up/down colours - 4hr default - squattterStochastic RSI - MTF - Up/down colours - 4hr (240) defaultIndikator Pine Script®oleh squattter22298
Tabela de Tendência e RSI MTF - Tabela em BaixoTabela de Tendência e RSI MTF - Tabela em Baixo This custom TradingView indicator provides a consolidated view of trend and Relative Strength Index (RSI) across multiple timeframes, all within an intuitive table directly on your chart. Designed for traders seeking quick and efficient analysis of market momentum and direction across different time horizons, this indicator automatically adapts to the asset you are currently viewing. With the table downIndikator Pine Script®oleh cfigueira10
RSI MTF Ob+OsHello Traders, This indicator use the same concept as my previous indicator "CCI MTF Ob+Os". It is a simple "Relative Strength Index" ( RSI ) indicator with multi-timeframe (MTF) overbought and oversold level. It can detect overbought and oversold level up to 5 timeframes, which help traders spot potential reversal point more easily. There are options to select 1-5 timeframes to detect overbought and oversold. Aqua Background is "Oversold" , looking for "Long". Orange Background is "Overbought" , looking for "Short". Have fun :)Indikator Pine Script®oleh BacktestTerminal99447
RSI MTF Panel [xdecow]This indicator shows the RSI of up to 10 different timeframes with various customization options: Panel position Panel orientation (vertical/horizontal) Border width and color Choose up to 10 time frames with RSI length and source Background and text colors Thresholds of overbought, oversold, uptrend, downtrend and no-trend zones to change the color of the RSI Color debug mode Indikator Pine Script®oleh xdecowDiupdate 33714
RSI [xdecow]RSI MTF Options: -MA -RSI from another timeframe -Uptrend/Downtrend zone -barcolor based on RSI trendIndikator Pine Script®oleh xdecow33619
RSI MTF with Moving AverageClassic RSI with MTF combined with its moving average (i reused a function to allow you to select any of them you want) for additional signals. Indicator is based on this source: medium.com Indikator Pine Script®oleh QuantTherapy134
RSI MTF [Market Yogi]The Multi-Time Frame RSI with Money Flow Index and Average is a powerful trading indicator designed to help traders identify overbought and oversold conditions across multiple time frames. It combines the Relative Strength Index (RSI) with the Money Flow Index (MFI) and provides an average value for better accuracy. The Relative Strength Index (RSI) is a popular momentum oscillator that measures the speed and change of price movements. It oscillates between 0 and 100 and is used to identify overbought and oversold conditions in an asset. By incorporating the RSI across multiple time frames, this indicator offers a broader perspective on market sentiment. In addition to the RSI, this indicator also includes the Money Flow Index (MFI). The MFI is a volume-based oscillator that measures the inflow and outflow of money into an asset. It takes into account both price and volume, providing insights into the strength and direction of buying and selling pressure. By combining the RSI and MFI across multiple time frames, traders gain a comprehensive understanding of market dynamics. The indicator allows for comparing the RSI and MFI values across different time frames, enabling traders to identify divergences and potential trend reversals. Furthermore, this indicator provides an average value of the multi-time frame RSI, offering a consolidated signal that helps filter out noise and enhance the accuracy of trading decisions. Key Features: 1. Multi-Time Frame RSI: Combines the RSI across different time frames to provide a comprehensive view of market sentiment. 2. Money Flow Index (MFI): Incorporates the MFI to gauge buying and selling pressure based on both price and volume. 3. Average Calculation: Computes the average value of the multi-time frame RSI to generate a consolidated trading signal. 4. Divergence Detection: Enables traders to spot divergences between the RSI and MFI values, indicating potential trend reversals. 5. Overbought and Oversold Levels: Highlights overbought and oversold levels on the RSI, aiding in timing entry and exit points. The Multi-Time Frame RSI with Money Flow Index and Average is a versatile tool that can be applied to various trading strategies, including trend following, swing trading, and mean reversion. Traders can adjust the time frame settings to suit their preferences and trading style. Note: It's important to use this indicator in conjunction with other technical analysis tools and indicators to validate signals and make informed trading decisions.Indikator Pine Script®oleh Market_Yogi126
RSI MTF DashboardThis is an RSI dashboard, which allows you to see the current RSI value for five timeframes across up to 8 tickers of your choice. This is a useful tool to gauge momentum across multiple timeframes, where you would look to enter a buy with high RSI values across the timeframes (and vice versa for sell positions). Conversely, some traders use RSI to identify potential areas for reversals, so you would look to buy with low RSI values (and vice versa for sell positions). In the settings, please select which 5 timeframes you require. Then select which tickers you wish to see, and you will find a dashboard on your chart to show the RSI values. The dashboard can be highlighted when the RSI value shows bearish momentum (a value under 50, of your choice) and bullish momentum (a value over 50, again of your choice). These colours and values are fully customisable. In the settings you can also select the location of the dashboard, as well as some colour and transparency settings to enable the best possible view on screen.Indikator Pine Script®oleh TraderBrycey33316
RSI MTF by PeterOThis is my take on reaching Higher TimeFrame charts, what is usually helpful when determining the trend. On the example of RSI. So imagine you want to check RSI from higher timeframe. 15x higher for example. There are 3 ways to do it. 1. security(tickerid,"15",rsi(close,14)) DON'T!!! I strongly advise against this method. Security() function is buggy in PineScript, leads to so-called "repainting" issues. Repainting is caused by creating leak from future data and leads to abnormally fantastic strategy backtest results like the one in Open Close Cross Strategy. Theoretically speaking if security() used correctly - with Pine version3 and barmerge.lookahead_off - you should encounter no repainting, but I could swear I saw scripts repaint even with security() implemented properly. Even assuming security() implemented correctly will not repaint - it will create delay in your script. I'm using "15" multiplier in my example, and this means, I have to wait for 15 candles to close to produce indicators value. If a strong move happens in the meantime, I'm blind, because I have to wait anyway. So for your own security, stay away from security() at all times. 2. rsi(close,14*15) This will produce RSI plot with no delay, but a very flattened one. RSI will move between 45 and 45, never even reaching 30 or 70 levels. So pretty useless. 3. Dig-in-the-formula way. Doing a bit more math produces RSI line, which is not delayed, not repainting and moving in full 0-100 RSI range. Actually - looking almost identical to the one from the higher timeframe. Which was the goal of this script.Indikator Pine Script®oleh Peter_O1616236
RSI MTF Table (Threshold Colors + Direction Arrows) [v6]Sometimes I want to know what other timeframes are indicating for the RSI so I borrowed from another indicator and created this script. Since I swing trade, I have the timeframes set higher, but you can adjust them to your needs in the settings. Each pane is color coded light green below 50, and pink above 50. Then you can define your own thresholds but the defaults are Red above 70, and Dark Green below 30. The colors can be adjusted to your needs. The top of each pane is its timeframe, then the RSI value for that timeframe. Then I check the current bar against the prior bar to see if the current value is higher (Up Arrow) or lower (Down Arrow) so that you know which way the RSI is moving. The position on your chart can be changed to your needs. This keeps the momentum in perspective for me. I hope it helps you. Good luck in your trading.Indikator Pine Script®oleh cpolaritz240
RSI MTF Table - 12 Pairs (1,5,15) The relative strength index measures the speed and magnitude of an asset's recent price changes. Therefore, it is considered a momentum indicator in technical analysis. Essentially, the RSI is the ratio of the days an asset's value increases to decreases over a given period. Generally speaking, if the RSI is around 50, we do not expect strong movements. RSI above 65 or below 35 are areas we expect. In this context, this chart and the general momentum in 1-5-15 minutes allow us to quickly determine the parity we will trade. It is useful for intraday trading and scalping. Indikator Pine Script®oleh MICROTRADES6
RSI-MTF-Histo-EntryThis indicator gives a histogram of RSI in relation to an ema of the RSI. The histogram is then smoothed to reduce false signals. The actualiteit RSI line with overbought/overvols signals can be added or omitted as preferred. The background can be color coded if the RSI is above or below 50. Version 2. Added support for MTF. Longer timesframes (1h-3h) tend to give better entry results. As an example the indicator was added two times, one for the current timeframe and one for a longer timeframe.Indikator Pine Script®oleh DuyckDiupdate 77336
RSI - MTF - Non RepaintUsing rsi with security function directly will cause repaint. Hence, doing it based on close price and calculating rsi via formula to avoid that. Hope this solves repainting issue. Thanks to @Jittra for requesting this :)Indikator Pine Script®oleh TrendoscopeDiupdate 1616321
RSI MTF 3D / For FunHello All, This is RSI Multi Time Frame 3D - just for fun :) Enjoy!Indikator Pine Script®oleh LonesomeTheBlueDiupdate 2727681
Stochastic RSI with MTF TableShort Description of the Script The provided Pine Script indicator, titled "Stochastic RSI with MTF Table," calculates and displays the Stochastic RSI for the current timeframe and multiple other timeframes (5m, 15m, 30m, 60m, 240m, and daily). The Stochastic RSI is a momentum indicator that blends the Relative Strength Index (RSI) and Stochastic Oscillator to identify overbought and oversold conditions, as well as potential trend reversals via K and D line crossovers. Key features of the script include: Inputs: Customizable parameters such as K smoothing (default 3), D smoothing (default 3), RSI length (default 14), Stochastic length (default 14), source price (default close), and overbought/oversold levels (default 80/20). MTF Table: A table displays the Stochastic RSI status for each timeframe: "OB" (overbought) if K > 80, "OS" (oversold) if K < 20, or "N" (neutral) otherwise. Crossovers: "K↑D" for bullish (K crosses above D) and "K↓D" for bearish (K crosses below D). Visualization: Plots the K and D lines for the current timeframe, with horizontal lines at 80 (overbought), 50 (middle), and 20 (oversold), plus a background fill for clarity. Table Position: Configurable to appear in one of four chart corners (default: top-right). This indicator helps traders assess momentum across multiple timeframes simultaneously, aiding in the identification of trend strength and potential entry/exit points. Trading Strategy with 50EMA and 200EMA for Highest Winning Rate To create a strategy with the best probability of a high winning rate using the Stochastic RSI MTF indicator alongside the 50-period Exponential Moving Average (50EMA) and 200-period Exponential Moving Average (200EMA), we can combine trend identification with momentum-based entry timing. The 50EMA and 200EMA are widely used to determine medium- and long-term trends, while the Stochastic RSI MTF table provides multi-timeframe momentum signals. Here’s the strategy: 1. Determine the Overall Trend Bullish Trend: The 50EMA is above the 200EMA on the current timeframe (e.g., daily or 60m chart). This suggests an uptrend, often associated with a "Golden Cross." Bearish Trend: The 50EMA is below the 200EMA on the current timeframe. This indicates a downtrend, often linked to a "Death Cross." Implementation: Plot the 50EMA and 200EMA on your chart and visually confirm their relative positions. 2. Identify Entry Signals Using the Stochastic RSI MTF Table In a Bullish Trend (50EMA > 200EMA): Look for timeframes in the MTF table showing: Oversold (OS): K < 20, indicating a potential pullback in the uptrend where price may rebound. Bullish Crossover (K↑D): K crosses above D, signaling rising momentum and a potential entry point. Example: If the 60m and 240m timeframes show "OS" or "K↑D," this could be a buy signal. In a Bearish Trend (50EMA < 200EMA): Look for timeframes in the MTF table showing: Overbought (OB): K > 80, suggesting a rally in the downtrend where price may reverse downward. Bearish Crossover (K↓D): K crosses below D, indicating declining momentum and a potential short entry. Example: If the 30m and daily timeframes show "OB" or "K↓D," this could be a sell/short signal. Current Timeframe Check: Use the plotted K and D lines on your trading timeframe for precise entry timing (e.g., confirm a K↑D crossover on a 60m chart for a long trade). 3. Confirm Signals Across Multiple Timeframes Strengthen the Signal: A higher winning rate is more likely when multiple timeframes align with the trend and signal. For instance: Bullish trend + "OS" or "K↑D" on 60m, 240m, and daily = strong buy signal. Bearish trend + "OB" or "K↓D" on 15m, 60m, and 240m = strong sell signal. Prioritize Higher Timeframes: Signals from the 240m or daily timeframe carry more weight due to their indication of broader trends, increasing reliability. 4. Set Stop-Loss and Take-Profit Levels Long Trades (Bullish): Stop-Loss: Place below the most recent swing low or below the 50EMA, whichever is closer, to protect against trend reversals. Take-Profit: Target a key resistance level or use a risk-reward ratio (e.g., 2:1 or 3:1) based on the stop-loss distance. Short Trades (Bearish): Stop-Loss: Place above the most recent swing high or above the 50EMA, whichever is closer. Take-Profit: Target a key support level or apply a similar risk-reward ratio. Trailing Stop Option: As the trend progresses, trail the stop below the 50EMA (for longs) or above it (for shorts) to lock in profits. 5. Risk Management Position Sizing: Risk no more than 1-2% of your trading capital per trade to minimize losses from false signals. Volatility Consideration: Adjust stop-loss distances and position sizes based on the asset’s volatility (e.g., wider stops for volatile stocks or crypto). Avoid Overtrading: Wait for clear alignment between the EMA trend and MTF signals to avoid low-probability setups. Example Scenario Chart: 60-minute timeframe. Trend: 50EMA > 200EMA (bullish). MTF Table: 60m shows "OS," 240m shows "K↑D," and daily is "N." Action: Enter a long position when the 60m K line crosses above D, confirming the table signal. Stop-Loss: Below the recent 60m swing low (e.g., 2% below entry). Take-Profit: At the next resistance level or a 3:1 reward-to-risk ratio. Outcome: High probability of success due to trend alignment and multi-timeframe confirmation. Why This Strategy Works Trend Following: Trading in the direction of the 50EMA/200EMA trend reduces the risk of fighting the market’s momentum. Momentum Timing: The Stochastic RSI MTF table pinpoints pullbacks or reversals within the trend, improving entry timing. Multi-Timeframe Confirmation: Alignment across timeframes filters out noise, increasing the win rate. Risk Control: Defined stop-loss and position sizing protect against inevitable losses. Caveats No strategy guarantees a 100% win rate; false signals can occur, especially in choppy markets. Test this strategy on historical data or a demo account to verify its effectiveness for your asset and timeframe. This approach leverages the strengths of both trend-following (EMA) and momentum (Stochastic RSI) tools, aiming for a high-probability, disciplined trading system.Indikator Pine Script®oleh IP229026
MTF RSI ScannerThis RSI scanner can be use to identify the relative strength of 10 symbols over multiple timeframes it will give you a quick overview which pair is more bearish or more bullish and also signals tops and bottoms in the AVG row light red/green cell = weak bearish (RSI = 45-35) / bullish (RSI = 55-65) medium red/green cell = bearish (RSI = 35-25) / bullish (RSI = 65-75) dark red/green cell = strong bearish (RSI <= 25) / bullish (RSI >= 75) gray cell = neutral (RSI= 45-55) Usage If AVG (average of all 4 timeframes) falls below 30, the cell will get green, indicating a good time to enter long (buy) If AVG (average of all 4 timeframes) rises above 70, the cell will get red, indicating a good time to enter short (sell) Use the "MTF RSI Scanner" in combination with the "MTF Stochastic Scanner" to find tops (RSI MTF avg >=70 AND Stochastic MTF avg >= 80) or bottoms (RSI MTF avg <= 30 AND Stochastic MTF avg <= 20) Here is how the two MTF scanners looked on Nov 08 2021 (ATH) » and here how the MTF scanners looked on June 21 2022 use TradingViews Replay function to check how it would have worked in the past and when not. As always… there NOT a single indicator that can show to the top & bottom 100% every single time. So use with caution, with other indicators and/or deeper understanding of technicals analysis ☝️☝️☝️ Settings You can change the timeframes, symbols, RSI settings, overbought/oversold levels and colors to your liking Drag the table onto the price chart, if you want to use it as an overlay. NOTE: Because of the 4x10 security requests, it can take up to 1 minute for changed settings to take effect! Please be patient 🙃 If you have any idea on how to optimise the code, please feel free to share 🙏 *** Inspired by "Binance CHOP Dashboard" from @Cazimiro and "RSI MTF Table" from @mobester16 *** Indikator Pine Script®oleh Indicator-Jones66451
MTF Stochastic ScannerThis Stochastic scanner can be use to identify overbought and oversold of 10 symbols over multiple timeframes it will give you a quick overview which pair is more overbough or more oversold and also signals tops and bottoms in the AVG row light red/green cell = weak bearish (Stoch = 30-20) / bullish (Stoch = 70-80) medium red/green cell = bearish (Stoch = 20-10) / bullish (Stoch = 80-90) dark red/green cell = strong bearish (Stoch <= 10) / bullish (Stoch >= 90) gray cell = neutral (Stoch = 30-70) Usage If AVG (average of all 4 timeframes) falls below 20, the cell will get green, indicating a good time to enter long (buy) If AVG (average of all 4 timeframes) rises above 80, the cell will get red, indicating a good time to enter short (sell) Use the "MTF Stochastic Scanner" in combination with the " MTF RSI Scanner " to find tops (RSI MTF avg >=70 AND Stochastic MTF avg >= 80) or bottoms (RSI MTF avg <= 30 AND Stochastic MTF avg <= 20) Here is how the two MTF scanners looked on Nov 08 2021 (ATH) » and here how the MTF scanners looked on June 21 2022 use TradingViews Replay function to check how it would have worked in the past and when not. As always… there NOT a single indicator that can show to the top & bottom 100% every single time. So use with caution, with other indicators and/or deeper understanding of technicals analysis ☝️☝️☝️ Settings You can change the timeframes, symbols, Stochastic settings, overbought/oversold levels and colors to your liking Drag the table onto the price chart, if you want to use it as an overlay. NOTE: Because of the 4x10 security requests, it can take up to 1 minute for changed settings to take effect! Please be patient 🙃 If you have any idea on how to optimise the code, please feel free to share 🙏 *** Inspired by "Binance CHOP Dashboard" from @Cazimiro and "RSI MTF Table" from @mobester16 *** Indikator Pine Script®oleh Indicator-JonesDiupdate 2828335
Relative Strength Index (RSI) w/ Multi Time Frame w/ DivergencesThis indicator is an advanced evolution of the classic Relative Strength Index (RSI), designed to provide deeper market context by combining Momentum, Multi-Timeframe (MTF) analysis, and Divergences into a single, clean visual tool. Unlike standard indicators, RSI MTF Pro v2 allows you to configure the Main RSI and the Background Trend Zone independently, giving you full control over your strategy (e.g., watching a 15m RSI while monitoring the 4H trend). Key Features: 🚀 Dual MTF Engine: Completely independent settings for the Main RSI Line and the Background Zone. You can choose different Timeframes, Lengths, and Levels for each. heatmap Style Background: The indicator background changes color (Red/Green) based on the MTF RSI trend, helping you filter out bad trades and stick to the dominant trend. 🎨 Smart Gradient Fills: To keep your chart clean, the gradient colors (Red/Green fills) only appear when the RSI breaches the Overbought or Oversold levels. 🎯 Divergence Detector: Automatically spots and marks Regular Bullish and Bearish divergences with pivot-based logic. How to Use: Trend Confirmation: Use the Background Color to determine the higher timeframe direction (e.g., Red Background = Uptrend). Entry Signals: Look for RSI signals that align with the background color (e.g., RSI Oversold/Green Gradient + Green Background). Reversals: Use the built-in Divergence circles to spot potential trend reversals. Settings: Main RSI: Customizable Timeframe, Length, OB/OS Levels. MTF Background: Independent Timeframe, Length, and Zone thresholds (e.g., >60 Red, <40 Green). Divergences: Toggle On/Off and adjust Pivot lookback periods. Disclaimer: This tool is for informational purposes only and does not constitute financial advice.Indikator Pine Script®oleh ardataskin39
RSI Shaded - MTF Non-repainting multiple time frame RSI with shading of overbought and oversold levels. Includes option for simple moving average smooth of the RSI (Larry Connors) Includes option to plot the EMA of the RSI Related to RSI Shaded . For other multiple time frame indicators see: Adaptive ATR-ADX Trend Fisher Transform MTF ADX-DI MTF Laguerre RSI MTFIndikator Pine Script®oleh mortdiggiddy1010 1.5 K
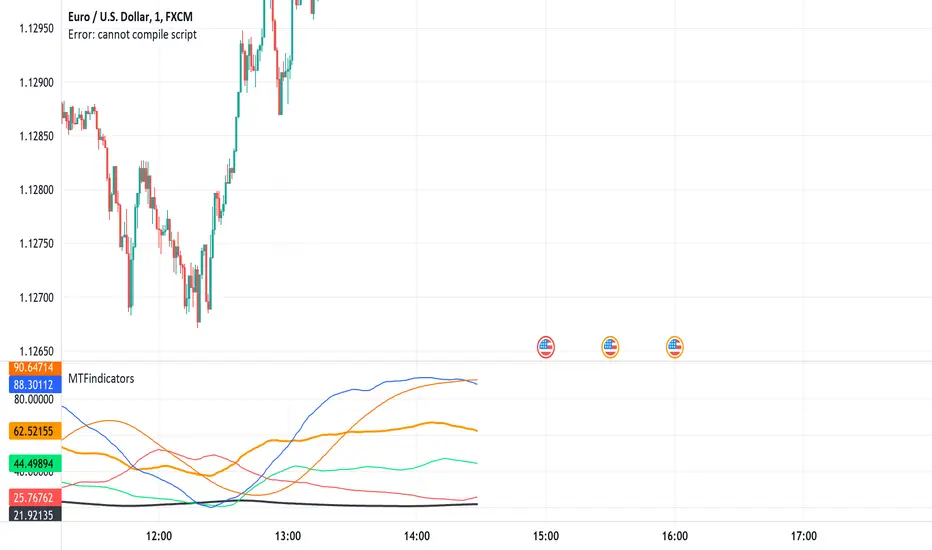
MTFindicatorsQuite recently TradingView added the possibility to create and use Libraries in PineScript. With this feature PineScript became higher quality of coding language overnight. Libraries enable splitting your code into multiple files, providing easier access to code reusability. I was working on a script which included 3000 lines of code, which was recompiling 1:30 min, and recalculating over 1 minute as well. So I split it into 2 parts: main part + library containing "main logic", which I reuse in variety of scripts, but don't change too often. Result? Now recompilation of my main script takes 10 and recalculation 8 seconds!!!. I instantly fell in love with libraries. Having said that, and being dedicated hater of security() calls, I have decided to publish a library of MTF indicators created with my own approach: "dig into formula". I have explained reasons for such approach in desription to this script: So this library script will be a set of indicators reaching to higher timeframes. Just include one line at the beginning of the script you are creating: import Peter_O/MTFindicators/1 as LIB and then somewhere is the code add this line: rsimtf=LIB.rsi_mtf(close,5,14) All of a sudden you have access to rsimtf from 5x higher timeframe without any hassle :) I start with RSI MTF, next ones will be ADX, Stochastic and some more. I will update this library with them here as well. Feel free to request particular indicators in comments. Maybe PSAR? Maybe Bollinger Bands?Perpustakaan Pine Script®oleh Peter_ODiupdate 222297