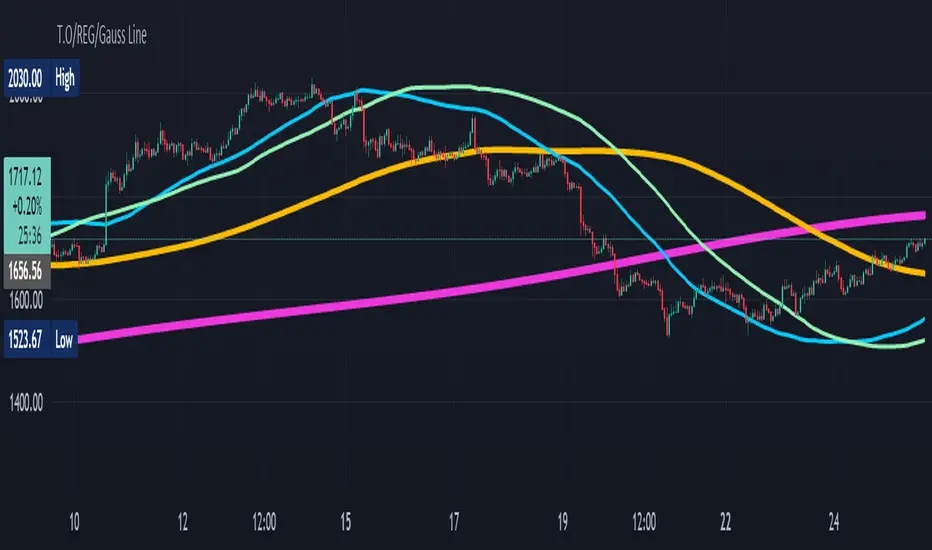
T.O/REG/Gauss LineHi Dear Traders/Dealers!
I present you here 3 lines that I developed myself base on statistical issues.
+Reg. Line
+Gauss Line
+T.O Line
-Reg. Line based on linear regression of previous inputs to make an average value.
-Gauss Line based on Gaussian mean value, Standard Deviation and it uses previous inputs to make an average value.
-T.O Line based on Gaussian and RMA methods generate an average value.
Hopefully useful for you!
Best regards and happy trading
Shakib
Cari skrip untuk "rma"
Multi Type RSI [Misu]█ This Indicator is based on RSI ( Relative Strength Index ) & multiple type of MA (Moving Average) to show different variations of RSI.
The relative strength index (RSI) is a momentum indicator used in technical analysis to evaluate overvalued or undervalued conditions in the price of that security.
█ Usages:
The purpose of this indicator is to obtain the RSI calculated with different MAs modes instead of the classic RMA.
The red and green zones indicate the oversold and overbought zones.
Buy or sell signals are marked by the green and red circles
We have 2 different signal modes : when the different size RSIs cross and when the fast RSI crosses the extreme bands.
Alerts are setup.
█ Parameters:
Lenght RSI: The lenght of the RSI. (14 by default)
RSI MA Type: The type of MA with which the rsi will be calculated. ("SMA", "EMA", "SMMA (RMA)", "WMA", "VWMA")
Fast Lenght MA: The fast lenght smoothing MA.
Slow Lenght MA: The Slow lenght smoothing MA.
Lower Band: The lenght of the lower band. (25 by default)
Upper Band: The lenght of the upper band. (75 by default)
Signal Type: The mode with which buy and sell signals are triggered. ("Cross 2 Mas", "Cross Ma/Bands")

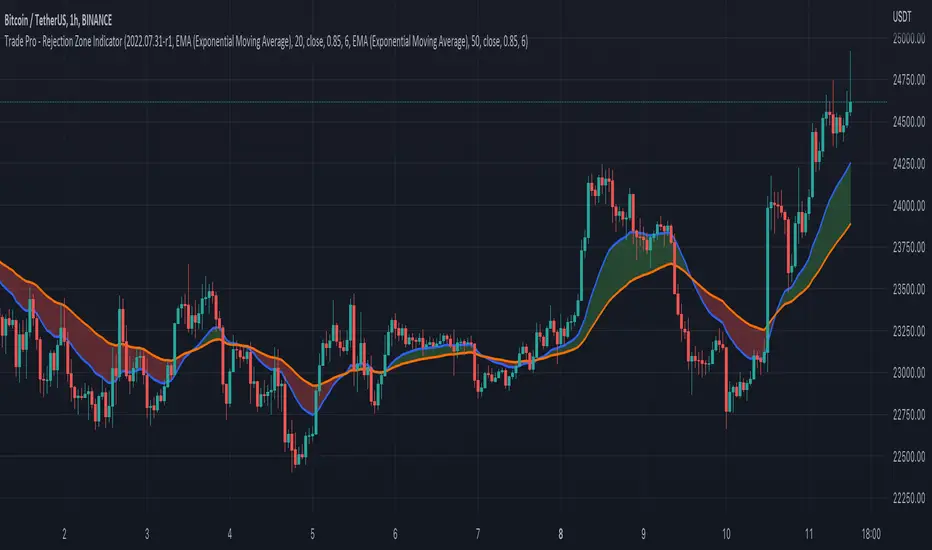
Trade Pro - Rejection Zone IndicatorThe Rejection Zone Indicator can be used to help trend following traders know when to buy dips in up trends, and when to sell pull backs in down trends.
The Rejection Zone Indicator is made up of the 20 and 50 period Exponential Moving Averages. This indicator has colored shading in between these two EMAs, which acts as a nice visual. When the 20 period Exponential Moving Average is below the 50 period Exponential Moving Average, the shaded cloud will be red, and when the 20 EMA is over the 50 EMA the cloud will be green. It is called the Rejection Zone indicator, because often in trends when price pulls back to the colored cloud, it will act as an area of support or resistance.
The suggested use of the Rejection Zone Indicator is to look for long trades when the cloud is green, and once price has pulled back into the green cloud. If the cloud is red one can look for short trading opportunity when price pulls back into the red cloud.
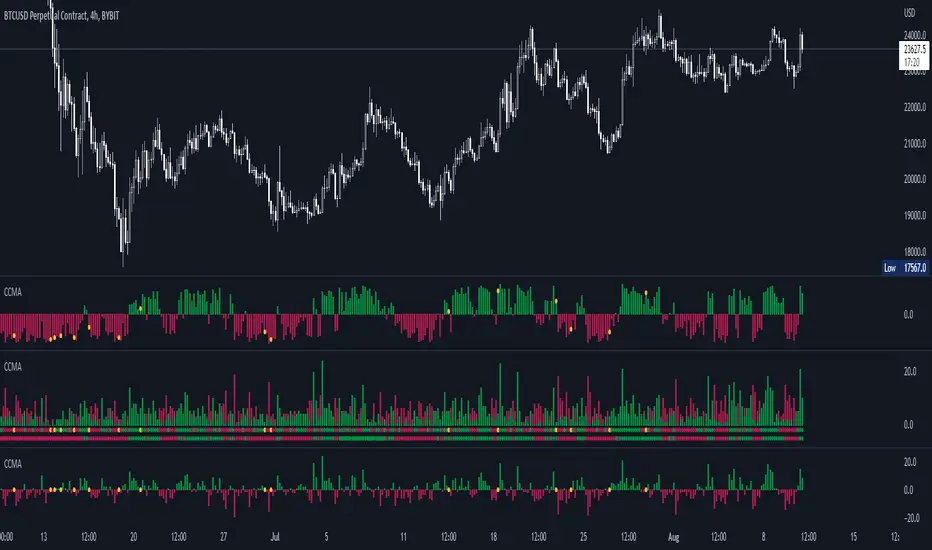
CCMA - Count Condition MA (560 Indicators In One) Do you like using moving averages?
Why do you think a pair of moving averages on a chart will help you?
What is the probability that once two moving averages have crossed, you will successfully enter the trade?
So why not use 100+ moving averages at once to increase the probability of a successful trade?
And all this can be seen in a single oscillator as a histogram!
I want to introduce you to a system that takes into account 560 moving averages movements. And that's just for a second, 560 potential indicators.
Specifically:
- 22 types of MA (EMA, SMA, RMA and others).
- 176 moving averages.
- 310 crossover checks.
- 252 checks of trend following.
The indicator makes the most of the opportunities provided by television. Therefore, it can take a long time to load it.
How does it work ?
In general, the indicator counts the number of fulfilled conditions.
It checks if MA #1 and MA #2 have crossed. If so, it adds +1 to the statistics. It also checks if price is above or below the moving average. There are a total of 560 such checks. (This is about the maximum the TV allowed me).
The default is 8 lengths of moving averages, I took the Fibonacci numbers thinking they were the optimal solution. You can take any of your favorites.
If the "Ratio MOD" feature is on. Then you can see how many MAs are showing signals to enter a long or short position.
You can also see the indication at the bottom as dots. They show which signals are longer/shorter. If the number of signals is the same, the dot will be yellow. The first line of dots counts the number of crossings. The second line counts the number of crossovers + checks whether the price is above or below the average slippage.
If the "Differ MOD" function is enabled. Then you can see the difference between long and short signals. With the same indication as in RATIO MOD.
If "Show all" is on, then the bar graph shows all 560 accounting options. If it is off, only the number of crossovers is displayed. (This does not apply to the display as points)
If the script shows an error, try to change the timeframe and go back. Or add it again.
You can also disable the histogram in the stats settings and leave only the points that help in determining the trend.
ER-Adaptive ATR [Loxx]Average True Range (ATR) is widely used indicator in many occasions for technical analysis. It is calculated as the RMA of true range. This version adds a "twist": it uses Perry Kaufman's Efficiency Ratio to calculate adaptive true range
You can use this indicator the same way you'd use the standard ATR.

Stock Strength Index by zdmreThe basic idea behind indicators is "to buy the strong one and to sell the weak one". This indicator yield entry and exit signals for stock trading.
You can view the STRENGTH INDEX for the symbol you want in this indicator.
Formula
(X - ((RMA(t-1) * (n-1)) + X(t)) / n) / X * 100
n = The length of the Moving Average (defval = 200)
X = Price
t = Timeframe
#DYOR

EMA ON MA SETSOORY FOR MY EINGLISH
ITS NOT MY NATIVE AND IM NOT GOING TO GOOGLE TRANSLATE THIS
this is a beuaitful indicator that plot EMA that gat is calc from another ma and length for your choise so you will get an = 'ema on ma '
it can plot you more beautiful results and more smoothing results
i added golden/death cross for all ma
enjoy !
היי חברים זה בעצם אינדיקטור של ממוצע נע על ממוצע נע לנוחיכותכם
הפלט הראשי הוא EMA
הוא לוקח את החישוב שלו ממוצע אחר והאורך שתגדירו
נותן תוצאה יותר חלקה של ממוצעים נעים
הוספתי חתיוכים בין ההמוצעים
תהנו.

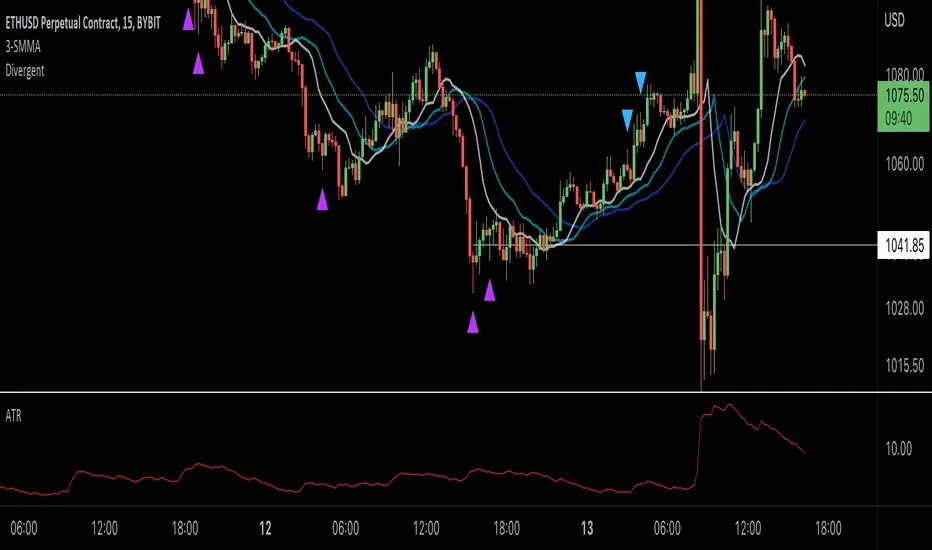
Williams Divergent Bar (First Wise Man)Based on Bill Williams' First Wise Man. Bull candles are marked with purple and Bear candles with blue.
Requirements:
- Candle height must be greater than ATR (filter out tiny Doji candles)
- Open and Close must be beyond the HL2 (midpoint) for either Bull or Bear scenarios
- Candle HL2 must be more than 1x ATR from the Alligator Jaw (13-period SMMA, pushed forward 8 periods). The dark blue line in my example.
- ATR is calculated using a 13-period RMA of the true range
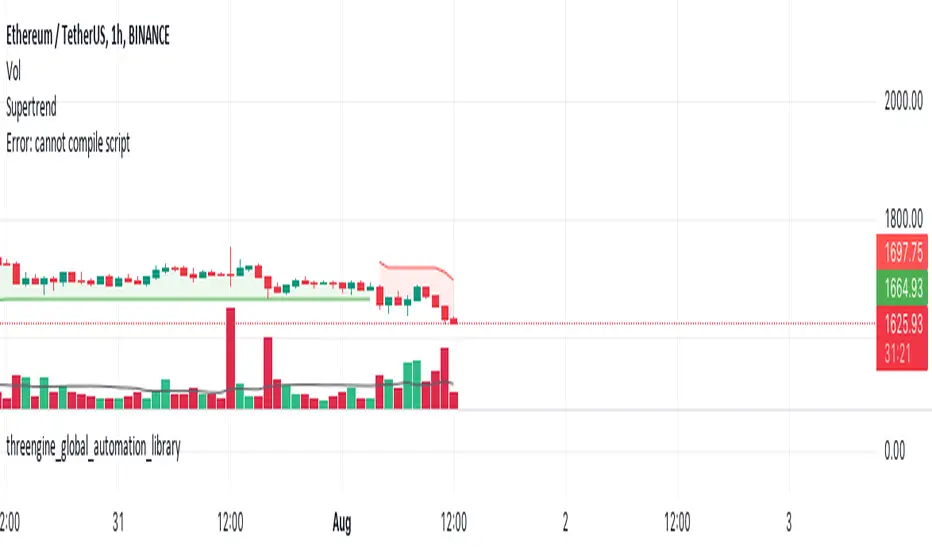
threengine_global_automation_libraryLibrary "threengine_global_automation_library"
A collection of functions used for trade automation
getBaseCurrency()
Gets the base currency for the chart's ticker. Supported trade pairs are USD, USDT, USDC, BTC, and PERP.
Returns: Base currency as a string
getChartSymbol()
Get the current chart's symbol without the base currency appended to it. Supported trade paris are USD, USDT, USDC, BTC, and PERP.
Returns: Ssymbol and base currency
getDecimals()
Calculates how many decimals are on the quote price of the current market
Returns: The current deimal places on the market quote price
checkVar()
Plot a string as a label on the chart to test variable value. Use str.tostring() for any variable that isn't a string.
Returns: Label with stringified variable
getStrategyAlertMessage()
Generates stringified JSON for a limit order that can be passed to the strategy alert_message for a long entry.
Returns: Stringifed JSON for a long entry
taGetAdx()
Calculates the Average Directional Index
Returns: The value of ADX as a float
taGetEma()
Calculates the EMA based on a type, source, and length. Supported types are EMA, SMA, RMA, and WMA.
Returns: The value of the selected EMA
isBetweenTwoTimes()
Checks to see if within a rage based on two times
@retunrs true/false boolean
getAllTradeIDs()
This gets all closed trades and open trades
@retunrs an array of all open and closed trade ID's
getOpenTradeIDs()
This gets all open trades
@retunrs an array of all open trade ID's
orderAlreadyExists()
This checks to see if a provided order id uses the getAllTradeIDs() function to check
@retunrs an array of all open and closed trade ID's
orderCurrentlyExists()
This checks to see if a provided order id uses the getAllTradeIDs() function to check
Returns: an array of all open and closed trade ID's
getContractCount()
calulates the number of contracts you can buy with a set amount of capital and a limit price
Returns: number of contracts you can buy based on amount of capital you want to use and a price
getLadderSteps()
Returns: array of ladder entry prices and amounts based on total amount you want to invest across all ladder rungs and either a range between ladderStart and LadderStop based on specificed number of ladderRungs OR ladderStart, ladderRungs, and LadderSpacingPercent
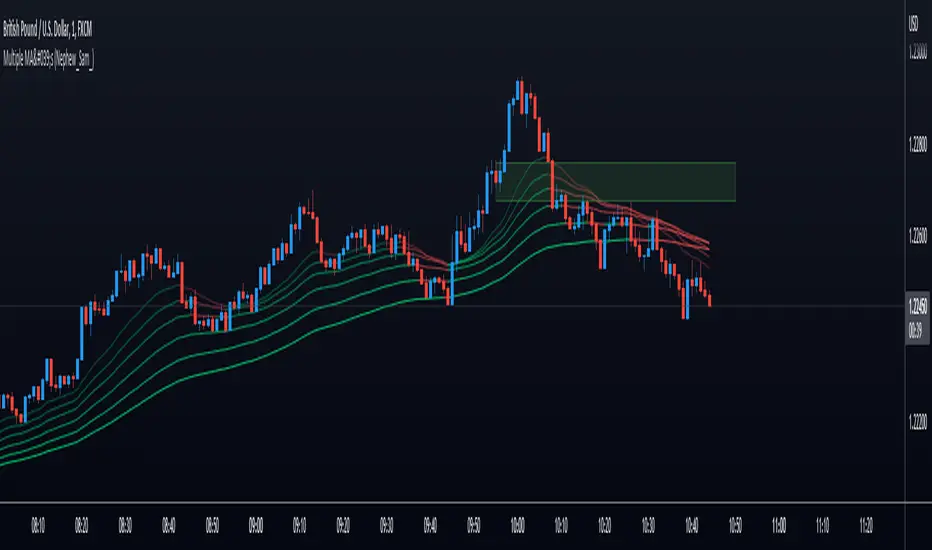
Multiple MA's (Nephew_Sam_)Plots upto 6 moving averages on your charts with and option to choose between EMA, SMA and RMA
You can choose to display the moving averages as either lines or a background and a custom gradient-like color for each MA + different colors for bull and bear momentum.
Joe's Ultimate MA Ribbon (w/ Crossover Triggers)Tired of having to add multiple moving average indicators to your chart? Well, stop doing that.
Here's a sweet moving average ribbon (with 1-10 moving average lines!) that will make your charts look much cooler 😎.
Not only that, it also includes triggers for MA crossovers. So, yeah...you can pick which MA crossovers trigger for longs and shorts separately. Yup, you read that right.
Options:
Show/Hide MA Lines: Only show the lines you wanna see. No more. No less.
MA Type (can be different for each line!): EMA, SMA, SMMA (RMA), WMA, VWMA
MA Source (for each line): open, close, high, low, hl2, hlc3, ohlc4, hlcc4
MA Length (for each line): any number between 1 and 4999
Line Colors: Ooh, pretty.
Triggers: On or Off
Crossover Long Triggers: When _______ crosses over _______ on timeframe _______
Crossover Short Triggers: When _______ crosses over _______ on timeframe _______
Trigger Characters and Location

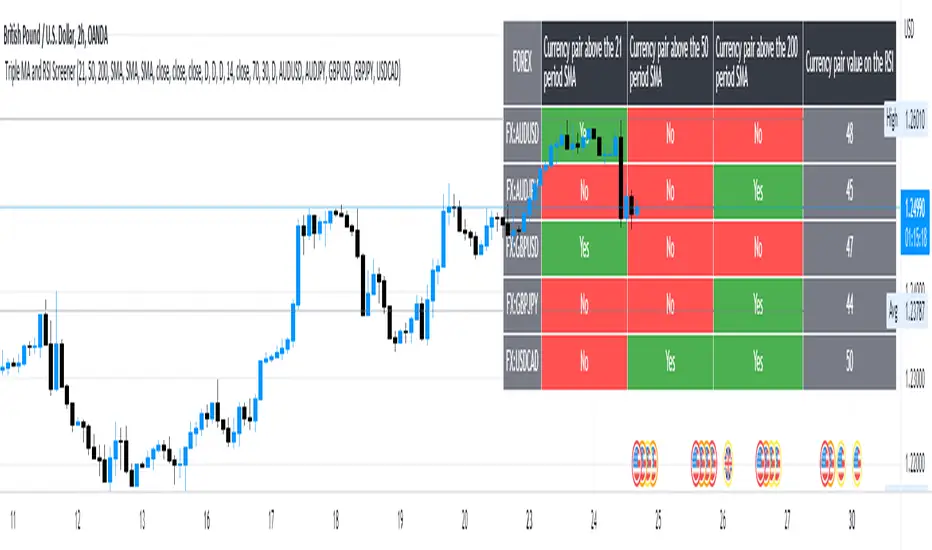
5 Symbol screener with triple MA and RSIBelow is a simple screener script fitted with 5 different symbols in the first column and in the other 4 columns the screener displays the respective moving averages and the RSI, the user has the ability to change between timeframes and different moving averages such as the SMA, EMA, RMA and WMA .
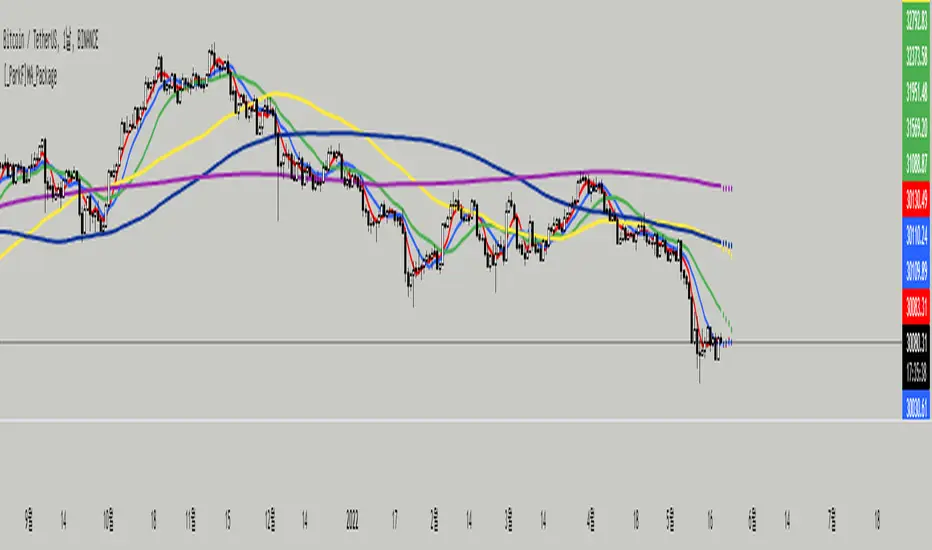
[_ParkF]MA_PackageThis indicator is a comprehensive set of moving averages.
All settings are handled in the input menu.
1. 6 moving averages are included.
2. You can edit the source of 6 moving averages.
3. You can change the type of each moving average line.
4. You can change the period value of each moving average line.
5. You can change the color of each moving average line.
6. You can change the thickness of each moving average line.
7. The predictive value of each moving average line will be displayed as a dot, and this value will be changed according to the type of the moving average line.
--------------------------------------------------------------------------------------------------------------------------------------------------------------------------------------------------------
이 지표는 이동평균선의 종합선물세트 입니다.
모든 설정은 input 메뉴에서 다뤄집니다.
1. 6개의 이동평균선이 포함 되어 있습니다.
2. 6개의 이동평균선의 소스를 수정할 수 있습니다.
3. 각각의 이동평균선의 타입을 변경할 수 있습니다.
4. 각각의 이동평균선의 기간값을 변경할 수 있습니다.
5. 각각의 이동평균선의 색상을 변경할 수 있습니다.
6. 각각의 이동평균선의 두께를 변경할 수 있습니다.
7. 각각의 이동평균선의 예측값이 점으로 표시될 것이고 이 값은 해당 이동평균선의 타입에 맞춰 변경됩니다.
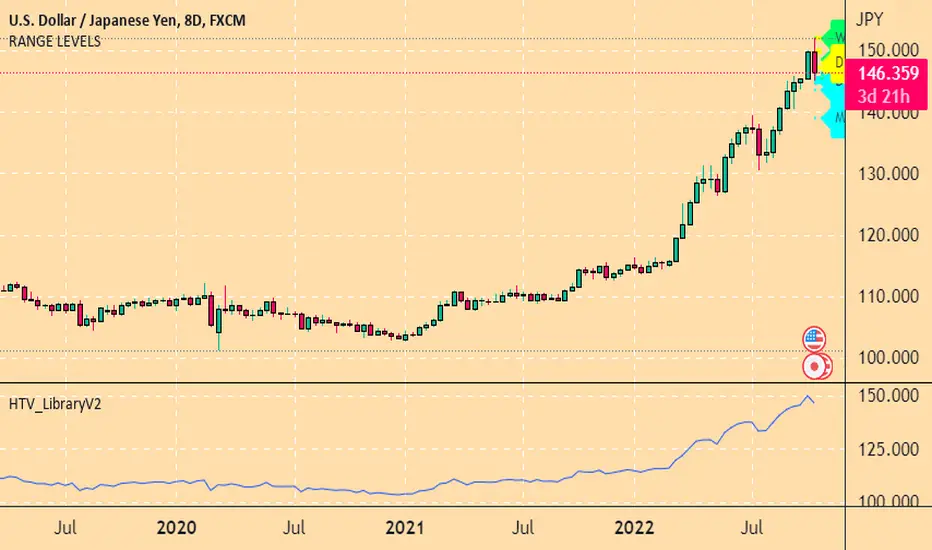
HTV_LibraryLibrary "HTV_LibraryV2"
up_bar() 'up_bar' checks true for every candle that closed above open price.
Returns: custom Series Bool
last_up_bar() 'last_up_bar' checks true for every last candle that closed above open price.
Returns: custom Series Bool
down_bar() 'down_bar' checks true for every candle that closed below open price.
Returns: custom Series Bool
last_down_bar() 'last_down_bar' checks true for every last candle that closed below open price.
Returns: custom Series Bool
TBR_Up() 'TBR_Up' checks true for every last confirmed 2 Bar Reversal.
Returns: custom Series Bool
TBR_Down() 'TBR_Down' checks true for every last confirmed 2 Bar Reversal.
Returns: custom Series Bool
TCR_Up() 'TCR_Up' checks true for every last confirmed 3 Candle Reversal.
Returns: custom Series Bool
TCR_Down() 'TCR_Down' checks true for every last confirmed 3 Candle Reversal.
Returns: custom Series Bool
f_fib() 'f_fib' gives a fibonacci number based on rising numericial order starting from 0
Returns: custom Series Bool
WHITE() uses color.rgb(r,g,b,t) function
Returns: literal color
WHITE_25T()
WHITE_50T()
WHITE_90T()
BLACK()
BLACK_25T()
BLACK_50T()
BLACK_90T()
RED()
RED_25T()
RED_50T()
RED_90T()
GREEN()
GREEN_25T()
GREEN_50T()
GREEN_90T()
BLUE()
BLUE_25T()
BLUE_50T()
BLUE_90T()
GREY()
GREY_25T()
GREY_50T()
GREY_90T()
NEON_YELLOW()
NEON_YELLOW_25T()
NEON_YELLOW_50T()
NEON_YELLOW_90T()
NEON_GREEN()
NEON_GREEN_25T()
NEON_GREEN_50T()
NEON_GREEN_90T()
NEON_PINK()
NEON_PINK_25T()
NEON_PINK_50T()
NEON_PINK_90T()
PURPLE()
PURPLE_25T()
PURPLE_50T()
PURPLE_90T()
SMA()
EMA()
WMA()
VWMA()
RMA()
HMA()
STMA()
ETMA()
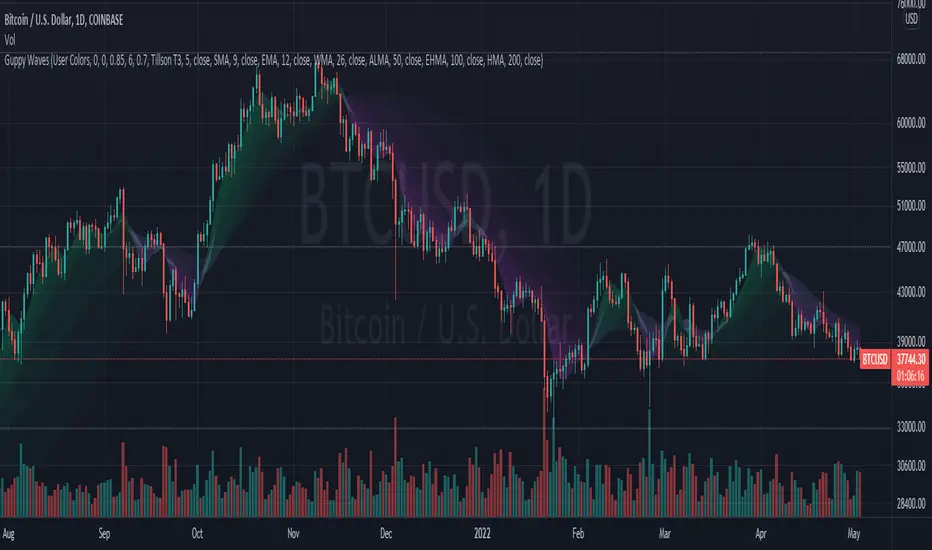
Guppy WavesA lightweight version of the popular "Moving Average Ribbon" or "Guppy" indicators where the visuals are plotted as "waves" rather than moving average lines. As is customary for my indicators, nearly everything about it is user selectable.
Visual Features:
User Customizable Colors
RSI-Based Rainbow Color Scheme
Simple Offset for adjusting transparency
Create great-looking charts very easily
Moving Average Options:
Running (SMoothed) Moving Average (RMA or SMMA ) - very slow/smooth
Simple Moving Average ( SMA )
Exponential Moving Average ( EMA )
Weighted Moving Average ( WMA )
Volume-Weighted Moving Average ( VWMA )
Triple EMA ( TEMA ) - very fast
Exponential Hull Moving Average (EHMA) - Hull with Smoothing (Slower than Hull)
Least Squares Moving Average ( LSMA ) - Simple Linear Regression
Arnaud Legoux Moving Average ( ALMA ) - Adjustable, set offset=1 to be current, offset=0.85 for good smoothing
Hull Moving Average ( HMA ) - very fast
Tillson T3 - very smooth
Donchian Moving Average - plots the average of (lowest, highest) for a given period length
The user can change the source, period, and type of moving average used for every single line on the chart.
Moving Average Macro Trend FilterA simple indicator that adds a background fill to your chart based on a fast and slow moving average.
When the fast moving average is above the slow moving average, the background is green.
When the slow moving average is above the fast moving average, the background is red.
If the fast and slow moving average don't agree on direction, the background is yellow.
Pick between EMA, SMA, RMA, WMA
Select different timeframes for chart, slow MA, and fast MA

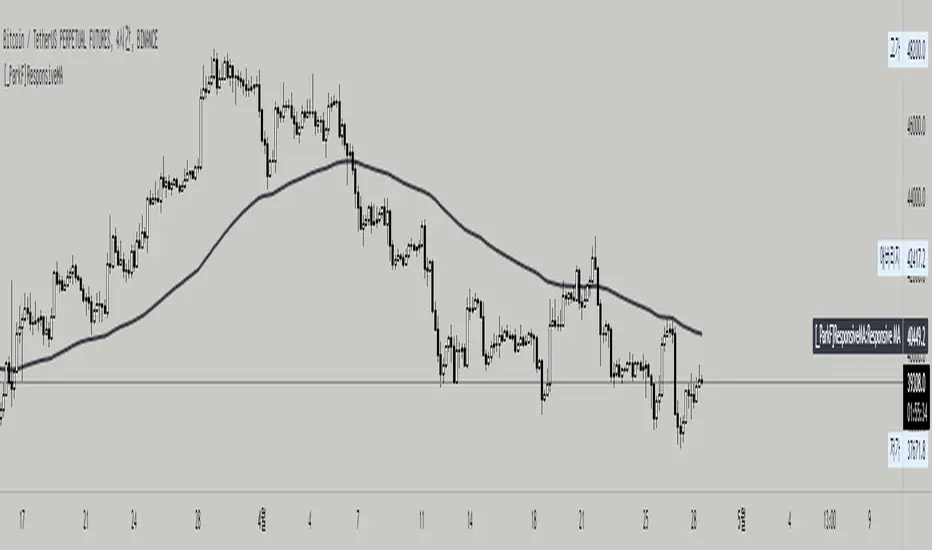
[_ParkF]ResponsiveMAThis indicator is a Responsive Moving Average, and it was made easily by using the Swtich function without using the if function, and it was released as an open source so that traders can freely CUSTOM.
If you select the Moving Average type from the Input menu and input the desired period value of MA for each time frame, the period value of the MA you set in INPUT will be plotted whenever the time frame is changed.
I hope this helps you with your trading.
-----------------------------------------------------------------------------------------------------------------------------------------------------------------------------------------------------------------------------------------------------------------------------
이 지표는 Responsive Moving Average이며, if를 사용하지 않고 Swtich를 이용하여 간편하게 만들었으며, 트레이더분들이 자유롭게 커스텀 하실 수 있게 오픈 소스로 풀었습니다.
Input 메뉴에서 Moving Average 의 Type을 고르고 각각의 Time Frame 마다 원하는 MA의 기간값을 입력하면 시간대를 변경할 때마다 자신이 input 메뉴에서 설정했던 MA의 기간값이 plot 되게 됩니다.
당신의 트레이딩에 도움이 되었으면 좋겠습니다.
Moving Averages With Cross AlertsA simple way to add up to 5 moving averages with optional crossover/crossunder alerts.
Available options for Moving Average Type are:
SMA
EMA (default)
HMA
RMA
WMA
VWMA
VWAP
ALMA
By default, 5 moving averages are enabled and set to the following:
MA1 set to 5
MA2 set to 13
MA3 set to 50
MA4 set to 200
MA5 set to 800
Each moving average has the following options:
Enable/Disable
Source (default is close)
Length
Color
Any 8 Moving Averages - Alerts, Clouds & PercentagesANY 8 MOVING AVERAGES WITH ALERTS, COLOR CHANGING CLOUDS AND PERCENTAGE GAPS
This is a fully customizable moving average cloud with alerts. It has 8 moving averages that can be individually set to any type such as: EMA, SMA, HMA, WMA, VWMA & RMA. Each moving average paints green when price is above it and paints red when price is below it. They include colored clouds between the price and each moving average as well.
You can individually change the length, colors, type of moving average and turn them off for those of you that only want a few moving averages on your chart at once.
There is also a percentage gap table that tells you how far away the price is from each moving average which are labeled accordingly.
You can also set alerts for when price crosses each moving average.
***HOW TO USE***
When all the moving averages are green, buy dips down to the next lower moving average. When all the moving averages are red, short the tops up to the next moving average.
Trade in the direction of the trend and wait for all lines to turn one color before taking trades in that direction.
Make sure there is a big enough percentage gap to the next moving average before taking a trade.
***MARKETS***
This indicator can be used as a signal on all markets, including stocks, crypto, futures and forex.
***TIMEFRAMES***
This moving average can be used on all timeframes.
***TIPS***
Try using numerous indicators of ours on your chart so you can instantly see the bullish or bearish trend of multiple indicators in real time without having to analyze the data. Some of our favorites are our Auto Fibonacci, Directional Movement Index + Fisher Price Action, Volume Profile With Buy & Sell Pressure, Auto Support And Resistance and Money Flow Index in combination with this moving average cloud. They all have unique features to help you make better and faster trading decisions.

Trending Bollinger Bands by SiddWolfBollinger Bands are mostly used for trend reversal. I believe they should be used for Trend Continuation and Trend Confirmation.
In this Trending Bollinger Bands script you will see two bands drawn on chart. The Upper band is suggestive of Uptrend and Lower Band is suggestive of Downtrend Market. It just provides the guidance of where the market is now and where it is headed. It is not to be used as a standalone indicator. Use this to confirm your hypothesis of Uptrend or Downtrend.
Bollinger Bands Trend
When the price crosses the moving average it is interpreted as the price is gonna continue in that direction. But most of the time it is a fake breakout. With this script you get an additional confirmation so that you know it is not a fake breakout and the price have caught the trend.
Bollinger Bands Reversal:
This indicator can also work for reversal. For example when price closes outside the outer bands, it is most likely that the trend is gonna reverse. Don't just enter the trade wait for some other confirmation as reversal trading is more complicated.
Confluence:
Confluence is the key factor for profitable trading. Don't use this indicator as standalone indicator instead combine it with other indicators and price action. Like the divergence occurring when the price is outside the bands is suggestive of trend reversal. I have created a non-delay, non-repaint indicator for finding divergence. I'd soon publish that script. Stay tuned.
Settings is the Key:
Try to play around with the settings. It is a simple yet effective indicator. Change the moving average type or length. I've found moving average RMA or WMA works better than SMA. Find the best setting that works with your setup. Set the Band Source as High/Low to make the outer bands more extreme.
Conclusion:
This is my first script but it isn't my last. I've created quite a few gems that I'm gonna publish soon. If you have any questions or suggestions feel free to comment below. I'd love to connect with you. Thank you.

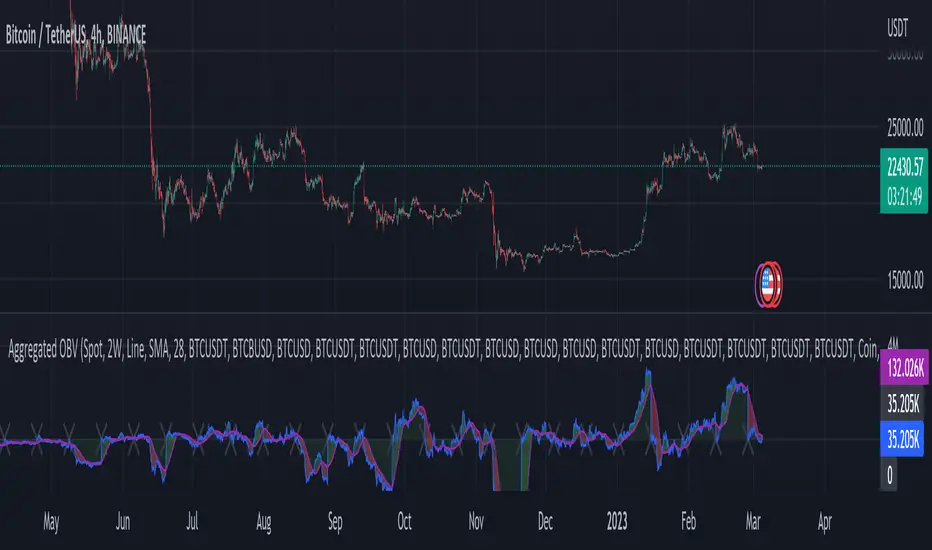
Aggregated Money Flow Index - InFinitoModified Version of In-Built Money Flow Index Indicator. Aggregated Volume is used for it's calculation + a couple of other features.
Aggregation code originally from Crypt0rus
***The indicator can be used for any coin/symbol to aggregate volume , but it has to be set up manually***
***The indicator can be used with specific symbol data only by disabling the aggregation option, which allows for it to be used on any symbol***
- Calculated based on Aggregated Volume instead of by symbol volume . Using aggregated data makes it more accurate and allows to compare volume flow between different kinds of markets (Spot, Futures , Perpetuals, Futures+Perpetuals and All Volume ).
- As well, in order to make the data as accurate as possible, the data from each exchange aggregated is normalized to report always in terms of 1 BTC . In case this indicator is used for another symbol, the calculations can be adjusted manually to make it always report data in terms of 1 contract/coin.
- Added Moving Average ( SMA , EMA , WMA , RMA, VWMA ) that can be plotted to the MFI
- Added 10/90 level and 45/55 range level
Things to look for:
- Divergences: Can be a very good reversal signal
- MA crossovers & Oversold/Overbought levels crossover: With proper confluence, entering a position at MA crossover and exiting at oversold/overbought levels can give very good swing setups (Or scalps on LTF)
- Center range retests: Once in a trend, retesting the middle range can give very good entries and confirmations of the trend
- Confluence of the latter: In combination, if more than one of these occur at the same time it can give more clarity regarding the current state of the market.

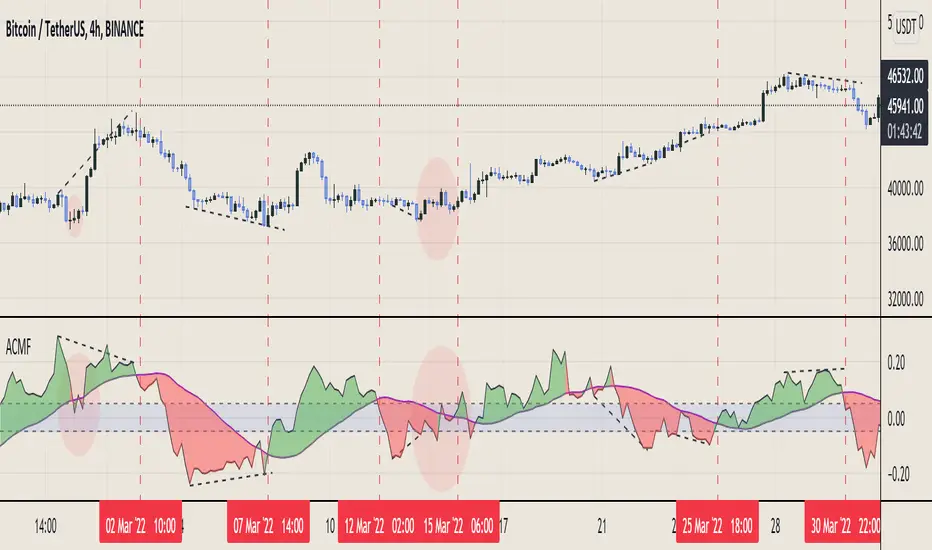
Aggregated Chaikin Money Flow - InFinitoModified Version of In-Built Chaikin Money Flow Indicator. Aggregated Volume is used for it's calculation + a couple of other features.
Aggregation code originally from Crypt0rus
***The indicator can be used for any coin/symbol to aggregate volume , but it has to be set up manually***
***The indicator can be used with specific symbol data only by disabling the aggregation option, which allows for it to be used on any symbol***
- Calculated based on Aggregated Volume instead of by symbol volume. Using aggregated data makes it more accurate and allows to compare volume flow between different kinds of markets (Spot, Futures , Perpetuals, Futures+Perpetuals and All Volume ).
- As well, in order to make the data as accurate as possible, the data from each exchange aggregated is normalized to report always in terms of 1 BTC. In case this indicator is used for another symbol, the calculations can be adjusted manually to make it always report data in terms of 1 contract/coin.
- Added Moving Average ( SMA , EMA , WMA , RMA, VWMA) that can be plotted to the CMF
- Changed 0 line to a small range which tends to be more relevant than the 0 line. This range can be manually modified
Things to look for:
- Divergences: Can be a very good reversal signal
- MA crossovers: Can be a very good confluent Buy/Sell signal
- Center range retests: CMF is normally defined as bullish above 0 and bearish below 0. In this case it is above or below the middle range. Even if the start of the move was missed. The retest of the middle range can give very good entries.
- Confluence of the latter
Aggregated On Balance Volume - InFinitoOn Balance Volume calculated with aggregated and normalized volume data and a few other features:
Aggregation code originally from Crypt0rus
Candle Plotting code from LonesomeTheBlue
***The indicator can be used for any coin/symbol to aggregate volume, but it has to be set up manually***
As normal OBV, this indicator can be used to find divergences and to have an idea of volume flow. Using aggregated data makes it more accurate and allows to compare volume flow between different kinds of markets (Spot, Futures, Perpetuals, Futures+Perpetuals and All Volume).
As well, in order to make the data as accurate as possible, the data from each exchange aggregated is normalized to report always in terms of 1 BTC. In case this indicator is used for another symbol, the calculations can be adjusted manually to make it always report data in terms of 1 contract/coin.
Extra features:
- Based off LonesomeTheBlue, OBV can be plotted as candles and as Heiken Aishi candles (which give wick information)
- A Moving Average (SMA, EMA, WMA, RMA, VWMA) can be plotted to the OBV. This can be used as a confluent signal to enter a trade on a crossover or to know the strength of the current move.
- The OBV basis can be reset to 0 periodically, making it more oscillator-like and allowing to focus only on a certain period of time.