XAMD/AMDX ICT 01 [TradingFinder] SMC Quarterly Theory Cycles🔵 Introduction
The XAMD/AMDX strategy, combined with the Quarterly Theory, forms the foundation of a powerful market structure analysis. This indicator builds upon the principles of the Power of 3 strategy introduced by ICT, enhancing its application by incorporating an additional phase.
By extending the logic of Power of 3, the XAMD/AMDX tool provides a more detailed and comprehensive view of daily market behavior, offering traders greater precision in identifying key movements and opportunities
This approach divides the trading day into four distinct phases : Accumulation (19:00 - 01:00 EST), Manipulation (01:00 - 07:00 EST), Distribution (07:00 - 13:00 EST), and Continuation or Reversal (13:00 - 19:00 EST), collectively known as AMDX.
Each phase reflects a specific market behavior, providing a structured lens to interpret price action. Building on the fractal nature of time in financial markets, the Quarterly Theory introduces the Four Quarters Method, where a currency pair’s price range is divided into quarters.
These divisions, known as quarter points, highlight critical levels for analyzing and predicting market dynamics. Together, these principles allow traders to align their strategies with institutional trading patterns, offering deeper insights into market trends
🔵 How to Use
The AMDX framework provides a structured approach to understanding market behavior throughout the trading day. Each phase has its own characteristics and trading opportunities, allowing traders to align their strategies effectively. To get the most out of this tool, understanding the dynamics of each phase is essential.
🟣 Accumulation
During the Accumulation phase (19:00 - 01:00 EST), the market is typically quiet, with price movements confined to a narrow range. This phase is where institutional players accumulate their positions, setting the stage for future price movements.
Traders should use this time to study price patterns and prepare for the next phases. It’s a great opportunity to mark key support and resistance zones and set alerts for potential breakouts, as the low volatility makes immediate trading less attractive.
🟣 Manipulation
The Manipulation phase (01:00 - 07:00 EST) is often marked by sharp and deceptive price movements. Institutions create false breakouts to trigger stop-losses and trap retail traders into the wrong direction. Traders should remain cautious during this phase, focusing on identifying the areas of liquidity where these traps occur.
Watching for price reversals after these false moves can provide excellent entry opportunities, but patience and confirmation are crucial to avoid getting caught in the manipulation.
🟣 Distribution
The Distribution phase (07:00 - 13:00 EST) is where the day’s dominant trend typically emerges. Institutions execute large trades, resulting in significant price movements. This phase is ideal for trading with the trend, as the market provides clearer directional signals.
Traders should focus on identifying breakouts or strong momentum in the direction of the trend established during this period. This phase is also where traders can capitalize on setups identified earlier, aligning their entries with the market’s broader sentiment.
🟣 Continuation or Reversal
Finally, the Continuation or Reversal phase (13:00 - 19:00 EST) offers a critical juncture to assess the market’s direction. This phase can either reinforce the established trend or signal a reversal as institutions adjust their positions.
Traders should observe price behavior closely during this time, looking for patterns that confirm whether the trend is likely to continue or reverse. This phase is particularly useful for adjusting open positions or initiating new trades based on emerging signals.
🔵 Settings
Show or Hide Phases.
Adjust the session times for each phase :
Accumulation: 19:00-01:00 EST
Manipulation: 01:00-07:00 EST
Distribution: 07:00-13:00 EST
Continuation or Reversal: 13:00-19:00 EST
Modify Visualization : Customize how the indicator looks by changing settings like colors and transparency.
🔵 Conclusion
AMDX provides traders with a practical method to analyze daily market behavior by dividing the trading day into four key phases: Accumulation, Manipulation, Distribution, and Continuation or Reversal. Each phase highlights specific market dynamics, offering insights into how institutional activity shapes price movements.
From the quiet buildup in the Accumulation phase to the decisive trends of the Distribution phase, and the critical transitions in Continuation or Reversal, this approach equips traders with the tools to anticipate movements and make informed decisions.
By recognizing the significance of each phase, traders can avoid common traps during Manipulation, capitalize on clear trends during Distribution, and adapt to changes in the final phase of the day.
The structured visualization of market phases simplifies decision-making for traders of all levels. By incorporating these principles into your trading strategy, you can enhance your ability to align with market trends, optimize entry and exit points, and achieve more consistent results in your trading journey.
Cari skrip untuk "reversal"

Adaptive Squeeze Momentum (Zeiierman)█ Overview
Adaptive Squeeze Momentum (Zeiierman) is a hybrid oscillator that models the market’s transition between trend-efficient and inefficient (choppy or reversal-prone) regimes. It fuses a price efficiency framework, volatility-adaptive responsiveness, and a bounded directional trend score, then intelligently blends them through a dynamic transition band to emphasize either smooth, directional structure or spiky inefficiency.
Unlike traditional momentum tools, it does not simply measure speed or volatility. It measures how efficiently the price is moving. This multidimensional approach allows it to identify when markets are compressed and ready to expand, or stretched and ready to revert.
In essence, Adaptive Squeeze Momentum (Zeiierman) gives traders a deep structural perspective of efficiency, momentum, and compression energy, helping to expose hidden squeezes, early reversals, and trend continuations with remarkable accuracy.
⚪ Why This One Is Unique
Adaptive Squeeze Momentum (Zeiierman) stands out because it doesn’t rely on static momentum or volatility measures alone. It merges price efficiency, volatility adaptivity, and trend structure into one cohesive system capable of detecting:
Early squeeze build-ups and directional releases
Reversals emerging from inefficiency spikes
Shifts between clean trends and noisy, unstable ranges
Adaptive behavior across changing volatility conditions
In essence, it acts as a self-adjusting market intelligence tool, revealing when the price is efficient, exhausted, or preparing for significant expansion.
█ Main Features
⚪ Adaptive Squeeze Momentum Oscillator
The Adaptive Squeeze Momentum (Zeiierman) captures how price structure transitions between compression, expansion, and inefficiency. It merges a volatility-adaptive momentum engine with an efficiency-aware structure filter, creating a responsive oscillator that reflects not just how fast the market moves, but how efficiently it moves.
Adaptive Momentum: Reacts dynamically to changing volatility regimes
Efficiency Awareness: Distinguishes stable, directional flow from unstable or noisy price action
Volatility Squeeze Detection: Identifies buildup (compression) and breakout (release) conditions
Directional Context: Shows momentum alignment, exhaustion, or imbalance through color-coded histograms
This hybrid model provides a multidimensional view of trend quality, squeeze pressure, and inefficiency, ideal for precision-based trend following and structural reversal recognition.
⚪ Understanding the Squeeze
A squeeze occurs when volatility contracts, prices compress, and market energy builds, much like a coiled spring preparing to release. Once volatility expands, that stored energy transforms into directional movement, often marking the beginning of a significant breakout or new trend phase.
Traditional squeeze indicators focus only on volatility contraction. Adaptive Squeeze Momentum (Zeiierman) goes further by incorporating efficiency analysis to evaluate how organized or chaotic the buildup is. This reveals not only when a squeeze may fire but also whether the ensuing release is likely to be sustainable or structurally weak.
Visual Interpretation:
Lighter Dots: Represent low-volatility compression, energy building within an efficient or balanced structure.
Yellow Dots: Mark volatility release, the expansion phase where momentum accelerates.
⚪ Inefficiency Columns
Efficient Price Action
Efficient moves are clean, directional, and purposeful. Price advances with minimal back-and-forth noise, revealing strong conviction and structural alignment. In the indicator, these appear as smooth, non-blue histogram columns. Such periods indicate organized, high-probability momentum where breakouts, trends, and continuations are supported by efficient order flow.
Inefficient Price Action
Inefficient moves are noisy, erratic, and spiky, showing that price is fighting its own structure. Liquidity is thin, reactions are emotional, and momentum lacks balance. In the oscillator, inefficiency is displayed through blue columns, path-break spikes, or OB/OS inefficiency crosses (green/red). These elements act as early warnings of structural instability, suggesting the market may be overextended, losing organization, or entering a mean-reversion or reversal phase.
█ How to Use
⚪ Trend Following
When oscillator bars are above or below zero and growing in color intensity, momentum is expanding, confirming active, efficient trends. When colors fade, momentum is decelerating, signaling potential exhaustion or consolidation.
Interpretation:
Sustained smooth growth above zero indicates strong, efficient bullish momentum.
Sustained smooth growth below zero indicates efficient bearish continuation.
Color fading or a zero-line cross suggests trend fatigue or rotation.
Tip: Confirm trend continuation when yellow squeeze-release dots appear in the same direction. They often precede sustained breakouts following compression.
⚪ Inefficiency Reversals or Breakouts
Adaptive Squeeze Momentum (Zeiierman) excels at detecting instability within active trends, highlighting when moves lose internal efficiency and become unsustainable. When bars change color, outbreak columns appear, or Overbought/Oversold Inefficiency Crosses (green/red) appear, the structure is shifting toward potential reversal or exhaustion.
Blue Inefficiency Columns:
Above Zero: Indicates inefficient buying pressure where markets push higher impulsively or emotionally. Often signals an overstretched or unstable rally prone to short-term corrections or FOMO-driven peaks.
Below Zero: Reflects inefficient selling pressure where panic-driven or disorderly sell-offs often precede exhaustion and recovery phases.
Main Oscillator Inefficiency:
Spiky Column Above Zero
When the main oscillator suddenly surges upward and prints a tall, spiky column above the zero line without turning blue, it signals an inefficient and overextended push to the upside. This type of move breaks the oscillator’s usual smooth rhythm, showing that buyers are becoming overaggressive or emotional, often driven by FOMO or reactive momentum chasing.
Even though the column remains green, the abrupt path break reveals that the move is losing internal structure and may be unsustainable. Such inefficient upward bursts often indicate upside exhaustion or an overshoot, where the market temporarily loses control.
From here, two scenarios can unfold:
A sustained breakout if structure confirms (for example, a valid squeeze release or strong volume support).
A snapback or reversal if follow-through fails on the next bars and the oscillator begins to fade (growth → fall).
Spiky Column Below Zero
When the oscillator sharply dives and prints a tall, spiky column below the zero line without turning blue, it reflects an inefficient and emotional push to the downside. This behavior typically emerges during panic-driven selling, where traders aggressively dump positions, breaking the oscillator’s normal rhythm.
Even though the color remains red, this kind of path-break spike shows that the market has become disordered or overstretched. These inefficient downward thrusts often suggest bear exhaustion, capitulation, or a temporary overshoot below fair structure.
From this point, two potential outcomes can occur:
A sustained breakdown if the move is supported by strong volume or new structural lows.
A rebound or mean reversion occurs when momentum fails to extend, indicating that selling pressure has burned out.
Setting Tip: To focus purely on the oscillator’s structural peaks, set Inefficiency Detection and Inefficiency Duration to identical values, then adjust Inefficiency Price Peaks to control sensitivity. Use lower values for crisp detection and higher values for smoother blending.
Overbought and Oversold Inefficiency Signals
Green Overbought Cross: Signals that buyers are driving the market too aggressively, often from emotional extension or FOMO. This imbalance typically leads to short-term pauses, pullbacks, or corrections.
Red Oversold Cross: Signals panic-driven or emotionally imbalanced selling, marking structural exhaustion. Often precedes rebounds or base formations as volatility normalizes.
Interpretation: Both crosses identify where momentum is inefficient rather than simply overbought or oversold, helping detect exhaustion before conventional oscillators do.
⚪ Squeeze Builds and Releases (Volatility Expansion)
The squeeze system highlights volatility cycles when the market compresses, builds energy, and releases it through expansion.
Lighter Dots: Compression, where volatility contracts, structure tightens, and energy builds.
Yellow Dots: Release, where volatility expands, triggering directional movement.
Interpretation: Light dots signal potential breakout setups. When followed by a yellow dot and an aligned oscillator direction, they confirm momentum ignition —the moment the market transitions from equilibrium to expansion.
█ How It Works
⚪ Inefficiency Logic
The indicator evaluates how efficiently the price progresses relative to internal volatility. When market flow loses directional clarity, it transitions into an inefficiency state, represented by blue columns or sudden outbreaks within the oscillator. These moments reveal when the underlying structure becomes unstable or overly reactive, often preceding reversals or false momentum bursts.
Calculation: Applies an adaptive efficiency model that compares directional movement to internal dispersion and classifies it within a controlled stability band. A dual-threshold hysteresis with smooth interpolation ensures stable transitions between efficient (trend) and inefficient (spike) phases.
⚪ Directional Tendency Core
The directional tendency component models the underlying slope of market intent, expressing the balance between structured progression and reactive drift. It transforms directional bias into a bounded, volatility-normalized range that remains consistent across instruments and timeframes.
Calculation: Constructs a normalized directional field derived from trend displacement over an adaptive window, filtered through a nonlinear bounding transform and dynamic smoothing to control lag and oscillation.
⚪ Squeeze Engine
The squeeze system isolates compression and release cycles, the rhythmic build-up and discharge of volatility. Compression phases represent equilibrium and contraction, while release phases signify volatility expansion and directional acceleration.
Calculation: Integrates a volatility-adjusted energy model with directional gating. Compression forms during sustained contraction, while release occurs as volatility and momentum expand.
⚪ OB/OS Inefficiency Extremes
The OB/OS inefficiency system detects imbalanced extremes in order flow, when price pushes too far in one direction without structural support. These regions often precede exhaustion or rapid mean reversion.
Calculation: Generates an efficiency-weighted propagation field that identifies directional overextension. Threshold analysis and adaptive state classification determine overbought (green) and oversold (red) inefficiency zones.
⚪ Final Oscillator Composition
The final oscillator is an adaptive blend of inefficiency, directional tendency, and volatility state. It continuously morphs between spike-dominant and trend-dominant behavior based on the evolving efficiency environment. This produces a responsive structural map that visualizes the interplay between market stability, momentum, and compression energy.
Calculation: Combines the signed inefficiency signal and the bounded trend vector through a soft-weighted blending function governed by the efficiency band.
-----------------
Disclaimer
The content provided in my scripts, indicators, ideas, algorithms, and systems is for educational and informational purposes only. It does not constitute financial advice, investment recommendations, or a solicitation to buy or sell any financial instruments. I will not accept liability for any loss or damage, including without limitation any loss of profit, which may arise directly or indirectly from the use of or reliance on such information.
All investments involve risk, and the past performance of a security, industry, sector, market, financial product, trading strategy, backtest, or individual's trading does not guarantee future results or returns. Investors are fully responsible for any investment decisions they make. Such decisions should be based solely on an evaluation of their financial circumstances, investment objectives, risk tolerance, and liquidity needs.
Skrip berbayar

GRIDBOT Scalper by nnamWhat is this Indicator used for?
Made specifically for GRID Bots
note: before continuing... this indicator works on any timeframe, but it WORKS BEST ON THE 15 MINUTE TIMEFRAME
Straters and Forex Master Pattern Value Line Traders use this to help determine when the price could reverse.
This indicator is a scalping indicator that produces signals when a "potential" reversal in price is indicated. When the price moves UP and a Potential Bearish Reversal Signal occurs, traders can use this signal as a potential SHORT entry signal for their Short Grid Bot. The process is the same in reverse. After a sustained move down, a Potential Bullish Signal can be used by the trader as a potential LONG entry signal for their GridBot.
As shown in the screenshot below, lines develop on the chart (either RED or GREEN) indicating that a sustained move in one direction is currently occurring; however, there is no potential reversal signal plotted (this means that price action is currently moving in one direction only).
As shown in the screenshot below, lines can be used as a stop-loss after entering the GRIDbot. (usually, by this time, the Grid Bot is in Profit as it usually moves in the opposite direction first)
What this Indicator Does
The GRIDBOT Scalper provides information regarding potential reversals in the market after a sustained movement in one direction (either Bullish or Bearish).
The indicator is based on PRICE-ACTION ONLY and does not take into account the current state of the market (Bullish or Bearish).
Once the price moves in a particular direction for at least 14 bars , a line appears as shown in a previous screenshot. Once the price stops moving in that direction and begins moving in the opposite direction - and after a sustained run - a "signal" appears alerting the trader that a "potential" reversal could be on the horizon soon.
If price moves in one direction and plots both a line and a signal and then begins moving back in the other direction in a sustained manner, the original signal will remain even when a NEW line begins forming (the original line will disappear). (see below) This line will continue to move as the price continues to move. Not until a signal plots on the chart is the potential reversal forming. THE LINE DOES NOT SIGNAL A REVERSAL . Some traders, however, use this information to "ride the wave UP or DOWN" and exit their positions once the signal prints.
As shown below, optional input settings allow the trader to set the line at CLOSE or HIGH/LOW of the candle preceding the potential reversal.
It is suggested to use Close instead of High or Low but the setting allows one to use either.
As shown in the screenshot below, it is typical on LOWER TIME FRAMES to see the price pass the signal line. The Indicator works best on the 15 minute timeframe, as it gives the trader time to make the decisions required as the volatility is less on the 15 minute chart vs the 1 minute or 5 minute charts.
If you have any questions or suggestions for this indicator, please join our Discord. We offer free training on this Indicator on our Discord Server.

MyAlgo ZULU ZONESPLEASE READ THE ENTIRE POST BEFORE PURCHASING & USING THE MyAlgo Tool. Saves you and me some time in emails and messages. :)
This is the official version of MyAlgo ZULU ZONES
PLEASE UNDERSTAND THAT THIS IS A DIFFERENT AND SEPARATE PRODUCT AND SCRIPT FROM "MyAlgo SLIM" FROM THE MyAlgo TRADING TOOL SERIES
Description
ZULU Zones is a rework of a long-gone development from the early stages of MyAlgo.
It is an oscillator, which indicates the best timing for reversal zones, yet also in the settings allows the user to adjust itself to the given asset and its usual retraces/reversals, so it is easier to spot the next incoming reversal.
Side Notes
MyAlgo is being updated and upgraded very frequently to suit the requests of our customers.
This is not financial advice. Please read our disclaimer before using it.
Please refer to the signature field if you are interested in gaining access to this script.
Anything below this sentence will be Updates regarding MyAlgo

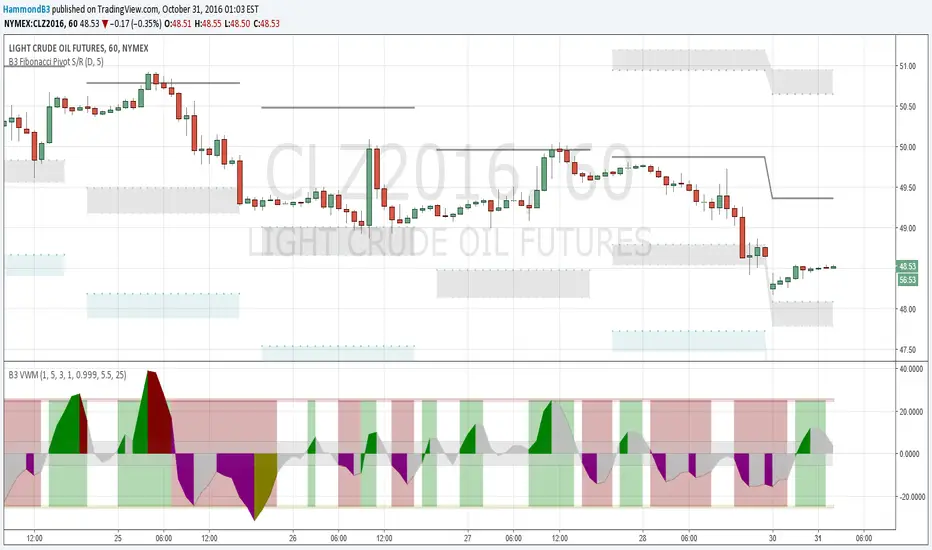
B3 Volume Weighted MomentumB3 VWM is a momentum indicator that responds to the change of price in relationship to volume. In the end the final formula is the classic physics test question of p=mv where p is momentum, m is mass and v is velocity. In this indicator mass is the amount of volume it took to move the price where it did, and velocity is the change in price expressed as a percentage of the bar range. Then, the indicator goes through some filtering to help display the line. Should appear with very little lag work it to find the perfect bar for reversals.
This can be thought of as directional volume times directional momentum index, but truly it is not these literally, as the script doesn't discern how many contracts flew to the bid or to the ask for separation. So with this momentum indicator you can hopefully get a feel of the volume flow, yet still use this like a traditional momentum oscillator. Look to hit the reversals at peaks, and use caution when trading longs when this indicator is negative, and vise versa. There can be divergence in this oscillator, and you can help remedy poor divergences by adjusting the smoothness or the flatness of the indicator to suit your chart. Also the dead zone and mid zone are likely in need of adjustments depending on volume flow and price changes for that symbol and resolution. Defaults are a great starting point for most charts 5m to day. Swing traders might enjoy a length of 8-10 to rid some quick changes of direction in the indicator. Love to have things like this up with pivot studies for level reversal entries, like the few on the shared oil chart.
Enjoy, and I hope you like some of my other proprieties too. Feel free to comment! ~B3
Ultimate MACD Suite [BigBeluga]🔵 OVERVIEW
The Ultimate MACD Suite is an advanced momentum-based system that enhances the classic MACD with modern features tailored for professional traders.
It transforms MACD into a full market-decision engine — offering multi-timeframe confluence, adaptive histogram behavior, divergence detection, heatmap trend visualization, and actionable reversal signals.
This toolkit goes far beyond standard MACD, helping traders identify trend momentum shifts, exhaustion zones, high-probability reversal areas, and breakout confirmation signals across multiple timeframes simultaneously. It's to be used as part of a major trading system and to simplify usage of the MACD.
⚠️ Note:
This is not a traditional MACD — it uses normalized values , enhanced visual feedback, and a multi-timeframe dashboard engine for superior signal quality and clarity.
🔵 CONCEPTS
Combines MACD momentum, signal-line crossovers, and histogram reversals into one system
Uses normalized scaling to detect extreme momentum levels and exhaustion zones
Multi-timeframe dashboard displays consensus signal alignment across several timeframes
Divergence engine identifies bullish & bearish trend weakening early
Heatmap mode visually distinguishes strong trend phases from neutral or fading momentum
Reversal arrows & crosses highlight actionable turning points on chart
🔵 FEATURES
Normalized MACD Engine — improves signal clarity across all assets/timeframes
MACD Heatmap Mode — color-coded slope intensity for trend strength monitoring
MACD Rising and Falling Mode — color-coded rising and falling MACD regimes
Histogram Reversal Detection — early momentum fade signal before price turns
Signal-Line Momentum Shifts — bullish ▲ & bearish ▼ alerts on cross-confirmation
Overbought/Oversold Bands — enhanced visual thresholds at ±80 levels
Smart Divergence Detection (Non-Lag) — confirms regular bullish & bearish divergences
Multi-Timeframe Dashboard — MACD, signal, histogram & divergence signals across 5+ TFs
Reversal Push-Filter — ensures only clean signals after confirmed momentum inflection
On-Chart Reversal Labels — optional compact signal markers for clean visual execution
Histogram Color Logic — rising/falling or heatmap mode for deeper momentum reading
🔵 HOW TO USE
Look for MACD crossing above signal + green histogram to confirm bullish momentum
Use ▼ and ▲ arrows to catch confirmed momentum reversals
Monitor the dashboard — the more timeframes align, the stronger the setup
Watch divergences for trend exhaustion or reversal setups
Treat histogram trend shifts as early momentum clues before price reacts
Use ±80 levels to identify overheated conditions & fade opportunities
Combine with structure, volume, or BigBeluga liquidity tools for higher accuracy
🔵 ALERTS
The indicator includes a full alert suite for automation and real-time trade readiness:
MACD crossovers (Bullish / Bearish)
Histogram reversals & zero-line shifts
Bullish / Bearish divergence detection
Overbought / Oversold MACD alerts
Bullish ▲ and bearish ▼ reversal triggers
Use these alerts to automate signal monitoring or feed algorithmic systems.
🔵 CONCLUSION
The Ultimate MACD Suite transforms a classic indicator into a powerful trading engine.
With multi-timeframe alignment, heatmapping, divergence logic, normalized scaling and automated signals, it becomes an elite momentum-confirmation and reversal-timing system built for serious traders.
Whether scalping intraday or managing swing positions, this MACD engine helps identify the most profitable phases of trend movement — while warning early when a trend is weakening.
Skrip berbayar

Silent Trigger Silent Trigger combines widely used concepts under one scoring engine. Each module adds weight only when its conditions are met:
1. Higher-Timeframe (HTF) context
• Requests 1H and the next HTF up (e.g., 4H/D) with request.security(...) on confirmed bars only.
• Uses RSI(14) and a MACD line (EMA12–EMA26 difference) for bias.
• By default HTF weights the score. There is an option to require HTF alignment if you prefer a hard filter.
2. Market regime
• ADX for trend strength.
• Bollinger Band width and a fractal-energy proxy to detect squeeze/coiling vs expansion.
3. Smart-money / Wyckoff structure
• High-volume narrow bars, absorption, spring/upthrust, and liquidity grabs past recent swing highs/lows.
4. Momentum & divergences
• RSI and MACD-line divergences (regular + hidden) and simple exhaustion checks.
5. Fair Value Gaps (FVG)
• 3-bar gap with mid-gap revisit confirmation.
6. Volume context
• Relative volume and a compact 10-bin rolling volume profile to locate HVN proximity.
7. Sessions / time filter
• Optional London/NY “kill zone” participation filter.
8. Correlation (optional)
• Simple BTC trend check for USD-quoted markets.
Pre-Move (yellow) logic:
Triggers only when the market is compressed (squeeze/low fractal energy), ADX is rising, the MACD histogram is near zero (pressure building), and there is a money-flow impulse (MFI slope and/or OBV Z-score spike).
The yellow diamond is plotted on the side of the expected move:
• Below for bullish reversals / Above for bullish breakouts.
• Above for bearish reversals / Below for bearish breakouts.
A built-in cooldown keeps yellows from spamming.
⸻
What appears on the chart
• Bull diamond (green): Total score ≥ your threshold and > bear score.
• Bear diamond (magenta): Mirror of the above.
• Pre-move (yellow): Early heads-up; use it with HTF context and structure.
All diamonds are intentionally tiny to minimize clutter.
⸻
Key settings
• Signal Mode & Min Probability – tighten/loosen confirmations.
• Use Higher TF in Scoring – soft weighting (default).
• Require HTF Alignment – optional hard gate.
• Module toggles – Smart Money, Wyckoff, FVG, Correlation, Sessions.
• Pre-Move – enable, cooldown bars, MFI levels, OBV Z-score threshold.
⸻
How to use (practical)
1. Choose a TF that matches your style (5–15m intraday, 1H–4H swing).
2. Read HTF bias first; trade in that direction unless structure clearly supports a reversal.
3. Treat yellow as “get ready.” Act only when a green/magenta prints with structure (S/R, FVG, HVN) and acceptable risk.
4. Place stops beyond the liquidity level or FVG midpoint; size positions conservatively.
⸻
Repainting & HTF policy
• No lookahead is used anywhere.
• request.security is called on confirmed bars; the HTF MACD line is computed inside the HTF context (single series), not by indexing a tuple.
• Signals are designed for bar-close confirmation. Intra-bar alerts can change until the bar closes.
⸻
Limitations (honest)
• Money-flow features depend on volume quality; thin/synthetic volume reduces reliability.
• Pre-moves can fail during unscheduled news shocks or when HTF trend is dominant.
• This is not financial advice. You are responsible for entries, exits, and risk.
⸻
Alerts
Built-in bull/bear alerts include direction and a probability bucket (Basic/Moderate/Strong/Extreme).
Pre-move yellows are primarily visual; you can still set an alert on their plot condition if desired.
⸻
Why this isn’t a “mashup”
• A single probability engine blends HTF bias, structure (liquidity/Wyckoff/FVG), regime, and volume into a score, rather than stacking unrelated indicators.
• A pre-move detector that requires compression + rising trend energy + money-flow impulse, and places the marker on the side of the expected move, with cooldown control.
• A lightweight rolling HVN check to bias continuation vs mean-reversion near key nodes.
⸻
Changelog (summary)
• Current release: pre-move module, HTF hard-gate option, tiny diamonds, clarified HTF/no-repaint policy, session filter tidy-up.

Exceptional Volume Spike - Potential Trend Reversal IndicatorWhat the Script Does:
The indicator aims to identify potential trend reversal points using the following steps:
Input Parameters: The script has three main input parameters that you can adjust:
relative_volume_threshold: This parameter sets the threshold for what is considered an exceptional volume spike in relation to the average volume.
ema_length: The length of the exponential moving average (EMA) used for smoothing calculations.
lookback_period: The period over which the script calculates potential support and resistance levels.
Relative Volume Calculation: The script calculates the relative volume by dividing the current volume by the average volume over the specified lookback_period.
Exceptional Volume Spikes: The script identifies exceptional volume spikes when the calculated relative volume exceeds the specified relative_volume_threshold.
EMA of Exceptional Volume Spikes: The script calculates the exponential moving average (EMA) of volume spikes. This EMA smooths out the volume spikes over the chosen ema_length.
Trend Direction: The script determines the trend direction using the crossovers of the EMA of exceptional volume spikes. If the EMA crosses above the EMA of regular volume (not spikes), it suggests a potential upward trend reversal. Conversely, if the EMA crosses below, it suggests a potential downward trend reversal.
Support and Resistance Levels: The script calculates potential support and resistance levels based on the highest high (hh) and lowest low (ll) over the specified lookback_period. These levels are then plotted on the chart.
Plot Shapes and EMA: The script plots triangle shapes below the bars for potential upward reversals and above the bars for potential downward reversals. Additionally, it plots the EMA of the closing price with different colors based on the trend direction.
By using this script as an indicator on your chart, you can visually assess potential trend reversal points based on exceptional volume spikes, trend direction crossovers, and support/resistance levels. Remember that this script serves as a tool to assist your analysis, and it's important to combine it with other technical analysis tools and strategies before making trading decisions.

Z Algo (Expo)█ Overview
Z Algo (Expo) is a sophisticated and user-friendly trading tool designed to meet the needs of both novice and seasoned traders. With its real-time signals, trend analysis, and risk management capabilities, this tool can be a valuable addition to any trader's toolkit.
█ Main Features & How to Use
Buy/Sell signals: Z Algo provides real-time buy and sell signals, which assist traders in identifying the most opportune moments to enter or exit a trade.
Strong Buy/Sell signals: In addition to regular buy and sell signals, the tool also offers strong buy and sell signals. These are generated when the market conditions align with a higher probability of a significant price movement.
Sniper Signals: This feature is specifically designed for contrarian traders who look to exploit temporary market inefficiencies or take advantage of price reversals. When enabled, Sniper Signals identify potential market turning points, offering traders the opportunity to profit from sharp price fluctuations.
Reversal Cloud: The Reversal Cloud is a unique visual representation of the market's potential trend reversals. It offers traders an easy-to-understand display of changing market dynamics, enabling them to quickly identify potential entry and exit points based on trend reversals.
Support and Resistance (S/R) Levels: Z Algo automatically calculates and displays support and resistance levels on the chart. These are crucial price points where buying or selling pressure may change, providing valuable insights for traders looking to enter or exit positions based on these levels.
Trend Tracker: This feature helps traders monitor and analyze the prevailing market trend. Trend Tracker identifies and highlights the direction of the trend, allowing traders to align their strategies accordingly and increase their chances of success.
Trend Background Color: To improve the user experience and simplify the interpretation of market data, Z Algo changes the chart's background color based on the identified trend direction. This visual cue makes it easier for traders to recognize bullish or bearish trends at a glance.
Bar Coloring: In addition to the trend background color, Z Algo also provides bar coloring for both contrarian and trend bars. This feature helps traders visualize price movements and trends more effectively, enabling them to identify potential opportunities for both trend-following and contrarian trading strategies.
Risk Management: The tool incorporates risk management features that help traders to protect their capital and maximize potential returns. Users can set stop-loss and take-profit levels, as well as customize their risk exposure according to their individual preferences and trading style.
█ Calculations
█ What are the Buy/Sell signals based on?
The Buy/Sell signals use volatility and price range with a weighting function that can help reduce lag and respond faster to recent price changes. The function gives more weight to the most recent volatility values and absolute price changes, making the algorithm more responsive to changes in volatility and price moves. Using a model that factors in both price changes and volatility gives a bias toward more recent data. This advanced approach to trading signal generation incorporates the concepts of trend following and mean reversion while accounting for changing market volatility.
Traditional systems often use fixed parameters, which may not adapt quickly to changes in market conditions. This can lead to late entries or exits, potentially reducing profitability or increasing risk. Our algorithm uses a weighting function to give more importance to recent volatility values, and absolute price changes can make these signals more responsive. This is especially useful in dynamic markets where price swings and volatility can change rapidly.
Adapting to Recent Price Changes: Markets can often exhibit trending behavior over certain periods. By weighing recent price changes more heavily, the model can quickly identify and react to the emergence of new trends. This can lead to earlier entries in a new trend, potentially increasing profitability.
Adapting to Recent Volatility Changes: Markets can shift from low to high volatility regimes (and vice versa) quite rapidly. A model that gives more weight to recent volatility can adapt its signals to these changing conditions. For example, in high volatility conditions, the model might generate fewer signals to reduce the risk of false breakouts. Conversely, in low volatility conditions, the model might generate more signals to capitalize on trending behavior.
Adaptive Trading: The approach inherently leads to an adaptive trading system. Rather than using fixed parameters, the system can adjust its behavior based on recent market activity. This can lead to a more robust system that performs well across different market conditions.
█ What are the Sniper signals (contrarian signals) based on?
Our contrarian signals are based on deviation from the expected value. The algorithm quantifies the amount of variation or dispersion in a set of values. Non-expected values are the fundamental core of the signal generation process.
█ Reversal Cloud Calculation
The cloud uses the information of how much the price fluctuates over a specific time period and updates its equilibrium value automatically at new price changes. The price changes are used to predict what will happen next, and the band adapts accordingly. The algorithm assumes that past price changes can predict future market behavior.
█ Support and Resistance (S/R) Levels Calculation
The support and resistance levels use historical overbought and oversold levels combined with a weighted atr function to predict future support and resistance areas. This calculation can potentially give traders a great heads-up on where the price may find support and resistance at.
█ Trend & Bar coloring Calculation
Trend calculations with dynamic events are key in ever-changing markets. The main idea of the calculation method is to find the mathematical function that best fits the data points, by minimizing the sum of the squares of the vertical distances of each data point from the equilibrium. The outcome is a function that finds the best mathematical description of that data. Hence the trend output may vary depending on the asset and timeframe. A unique approach where the same settings can give different results.
█ Risk Management Calculation
The risk management system is not unique in itself and contains everything that can help traders to manage their risk, such as different types of stop losses, Take Profits calculations.
-----------------
Disclaimer
The information contained in my Scripts/Indicators/Ideas/Algos/Systems does not constitute financial advice or a solicitation to buy or sell any securities of any type. I will not accept liability for any loss or damage, including without limitation any loss of profit, which may arise directly or indirectly from the use of or reliance on such information.
All investments involve risk, and the past performance of a security, industry, sector, market, financial product, trading strategy, backtest, or individual's trading does not guarantee future results or returns. Investors are fully responsible for any investment decisions they make. Such decisions should be based solely on an evaluation of their financial circumstances, investment objectives, risk tolerance, and liquidity needs.
My Scripts/Indicators/Ideas/Algos/Systems are only for educational purposes!
Skrip berbayar

Megalodon Pro Automated Longer Term TimerHow to use?
It should be used on DAILY time frame for finding potential market reversal points.
It shows reversal signals by printing Green for Buy - Orange for Strong Buy - Red for Sell - Purple for Strong Sell signals.

AP Capital – Volatility + High/Low Projection v1.1📌 AP Capital – Volatility + High/Low Projection v1.1
Predictive Daily Volatility • Session Logic • High/Low Projection Indicator
This indicator is designed to help traders visually understand daily volatility conditions, identify session-based turning points, and anticipate potential highs and lows of the day using statistical behavior observed across thousands of bars of intraday data.
It combines intraday session structure, volatility regime classification, and context from the previous day’s expansion to highlight high-probability areas where the market may set its daily high or daily low.
🔍 What This Indicator Does
1. Volatility Regime Detection
Each day is classified into:
🔴 High Volatility (trend continuation & expansion likely)
🟡 Normal Volatility
🔵 Low Volatility (chop, false breaks, mean-reversion common)
The background color automatically adapts so you always know what environment you're trading in.
2. Session-Based High/Low Identification
Different global sessions tend to create different market behaviors:
Asia session frequently sets the LOW of day
New York & Late US sessions frequently set the HIGH of day
This indicator uses those probabilities to highlight potential turning points.
3. Potential High / Low of Day Projections
The script plots:
🟢 Potential LOW of Day
🔴 Potential HIGH of Day
These appear only when:
Price hits the session-statistical turning zone
Volatility conditions match
Yesterday’s expansion or compression context agrees
This keeps signals clean and prevents over-marking.
4. Clean Visuals
Instead of cluttering the chart, highs and lows are marked only when conditions align, making this tool ideal for:
Session scalpers
Day traders
Gold / NAS100 / FX intraday traders
High-probability reversal traders
🧠 How It Works
The engine combines:
Daily range vs 20-day average
Real-time intraday high/low formation
Session-specific probability weighting
Previous day expansion and volatility filters
This results in highly reliable signals for:
Fade trades
Reversal setups
Timing entries more accurately
✔️ Best Uses
Identifying where the day’s range is likely to complete
Avoiding trades during low-volatility compression days
Detecting where the market is likely to turn during major sessions
Using potential HIGH/LOW levels as take-profit zones
Enhancing breakout or reversal strategies
⚠️ Disclaimer
This indicator does not repaint, but it is not a standalone entry tool.
It is designed to provide context, session awareness, and volatility-driven turning points to assist your existing strategy.
Always combine with sound risk management.

Trend Discovery by Alex Trend States (Up / Reversal / Down)Author: © Alex Neighbors
Version: v6
The Call/Put Arrow Indicator is a complete market direction tool that identifies high-probability CALL (bullish) and PUT (bearish) opportunities using a combination of:
Simple Moving Averages (SMA)
RSI Momentum
MACD confirmation
VWAP trend filtering
Real-time trend classification (Trending Up, Trending Down, or Reversal)
It provides visual buy/sell arrows, trend labels, and alerts, helping traders quickly recognize optimal option entry points and directional momentum changes.
*** How It Works
✅ CALL Arrow (Green, Up Arrow Below Candle):
Triggered when:
Fast SMA > Slow SMA (uptrend)
RSI > Threshold (default 55)
MACD Line > Signal Line
(Optional) Price > VWAP
🔻 PUT Arrow (Red, Down Arrow Above Candle):
Triggered when:
Fast SMA < Slow SMA (downtrend)
RSI < Threshold (default 45)
MACD Line < Signal Line
(Optional) Price < VWAP
**Trend Detection System:
Trending Up: Both SMAs rising with bullish alignment
Trending Down: Both SMAs falling with bearish alignment
Trend Reversal: Detected instantly when Fast SMA crosses the Slow SMA (marked by a diamond)
Visuals
🟩 Green arrows below candles for CALL entries
🟥 Red arrows above candles for PUT entries
🟢/🔴 Diamonds mark trend reversals
Trend status panel in the top-right corner
Optional background or bar coloring for quick visual confirmation
Alerts
You can create alerts for:
CALL Buy Signal
PUT Buy Signal
Trend Reversal Up
Trend Reversal Down
All alerts trigger exactly when arrows or reversals appear on the chart.
--Best Use
Works on any symbol or timeframe (scalping, swing, or trend trading)
Optimized for SPX, QQQ, TSLA, and high-volume tickers
Ideal for traders combining options flow or price action confirmation
Customization
You can adjust:
SMA lengths
RSI thresholds
MACD parameters
VWAP filter toggle
Background/bar coloring and panel display
Why Traders Love It
Simple, clean chart visuals
Non-repainting, confirmed-bar signals
Multi-filter logic for high accuracy
Trend panel for instant context
Use this indicator to stay on the right side of the market.
Identify reversals early, trade the momentum confidently, and never miss your next CALL or PUT setup again.

LBR 3/10 'Sardine' Oscillator (ATR-Normalized)LBR 3/10 Oscillator - Short-Term Momentum Indicator
The LBR 3/10 "Sardine" Oscillator is a short-term momentum indicator developed by Linda Bradford Raschke. This ATR-normalized version provides cross-market comparability and consistent extreme levels across all timeframes and asset classes.
What is the LBR 3/10 Oscillator?
The LBR 3/10 is designed to capture very short-term momentum shifts by measuring the difference between a 3-period and 10-period moving average. Named after Linda Bradford Raschke's "Trading Sardines" book, this oscillator excels at identifying rapid momentum changes and potential reversal points.
Formula: / ATR(10) × 100
Where MA can be either Simple Moving Average (SMA) or Exponential Moving Average (EMA).
Why ATR Normalization?
Problem with Traditional Oscillators:
Traditional momentum oscillators produce values that vary dramatically across different markets and time periods. A reading of 5 might be extreme for one asset but insignificant for another.
Solution:
ATR normalization divides the raw momentum value by the Average True Range, creating standardized readings that are:
Comparable Across Markets: Same interpretation whether analyzing stocks, forex, commodities, or crypto
Comparable Across Time: Readings maintain consistent meaning regardless of price levels
Universal Extreme Levels: The ±125 levels work consistently across all assets and timeframes
Statistical Research
Extensive statistical analysis across multiple markets identified the ±125 extreme levels:
+125 Level: Reached approximately 4% of the time (extreme bullish momentum)
-125 Level: Reached approximately 2% of the time (extreme bearish momentum)
These statistically-validated levels provide objective definitions for overbought and oversold conditions, eliminating subjective interpretation.
Key Features
Core Components
LBR 3/10 Line: Main oscillator showing normalized short-term momentum
Signal Line: Smoothed moving average of the oscillator (default: 9-period)
Extreme Levels: Horizontal lines at ±125 marking statistical extremes
Zero Line: Separates bullish and bearish momentum regimes
Visual Elements
Blue Line: LBR 3/10 oscillator (main momentum line)
Red Line: Signal line (smoothed moving average of oscillator)
Fill Area: Light blue shaded region between oscillator and signal line
Background Zones: Light red (overbought above +125) or light green (oversold below -125)
Horizontal Lines: Gray dashed lines at +125, -125, and 0 (zero line solid)
Divergence Markers: Green/red circles marking price/oscillator divergences
Signal Crosses: Small green/red triangles marking oscillator/signal line crossovers
Pullback Markers: Yellow diamond shapes with white "↑PB" or "↓PB" text for first pullback signals
Std Dev Bands: Orange circles marking statistical extreme levels (optional, disabled by default)
Advanced Features
MA Type Selection: Choose between SMA or EMA for both oscillator and signal line
Standard Deviation Bands: Optional adaptive extreme levels based on statistical volatility
Pullback Detection: Identifies high-probability counter-trend entries during established trends
First Pullback Filter: Noise reduction system that highlights initial pullback after trend change
Trading Applications
1. Extreme Level Reversals
When the oscillator reaches ±125, it indicates stretched momentum conditions:
Above +125: Overbought - watch for bearish reversal signals
Below -125: Oversold - watch for bullish reversal signals
2. Signal Line Crossovers
Bullish Cross: Oscillator crosses above signal line (momentum shift up)
Bearish Cross: Oscillator crosses below signal line (momentum shift down)
3. Zero Line Crosses
Signal line crossing zero indicates trend regime changes:
Cross Above 0: Transition to bullish trend
Cross Below 0: Transition to bearish trend
4. Divergence Trading
Bullish Divergence: Price makes lower low, oscillator makes higher low
Bearish Divergence: Price makes higher high, oscillator makes lower high
Best used in combination with other momentum indicators for confirmation
5. Pullback Strategy (High-Probability Setup)
Uptrend Pullback: Signal line positive + oscillator crosses below (buy opportunity)
Downtrend Pullback: Signal line negative + oscillator crosses above (sell opportunity)
First Pullback: Initial counter-trend signal after trend change (highest probability)
6. "Anti" Setup
Linda Bradford Raschke's classic setup:
Wait for extreme reading (±125)
Enter on first pullback signal in opposite direction
Captures momentum exhaustion reversals
Comprehensive Alert System
Extreme Level Alerts
Crossed above +125 (overbought)
Crossed below -125 (oversold)
Divergence Alerts
Bullish divergence detected
Bearish divergence detected
Signal Cross Alerts
Bullish cross (oscillator above signal)
Bearish cross (oscillator below signal)
Trend Change Alerts
Signal line crossed above zero (trend change to bullish)
Signal line crossed below zero (trend change to bearish)
Pullback Alerts
Pullback in uptrend (potential buy)
Pullback in downtrend (potential sell)
FIRST pullback in uptrend (high-probability buy)
FIRST pullback in downtrend (high-probability sell)
Settings & Parameters
LBR 3/10 Settings
Fast MA Length: Short-term period (default: 3)
Slow MA Length: Baseline period (default: 10)
ATR Length: Volatility normalization period (default: 10)
MA Type: SMA or EMA selection
Extreme High Level: Overbought threshold (default: 125)
Extreme Low Level: Oversold threshold (default: -125)
Signal Line
Show Signal Line: Enable/disable display (default: true)
Signal Line Length: Smoothing period (default: 9)
Divergence Detection
Show Divergences: Enable/disable detection (default: true)
Divergence Lookback: Pivot detection period (default: 5)
Standard Deviation Bands
Show Std Dev Bands: Enable/disable adaptive levels (default: false)
Std Dev Multiplier: Band width adjustment (default: 1.5)
Std Dev Length: Calculation period (default: 100)
Best Practices
Trending Markets
Focus on pullback signals in direction of trend
Use first pullback filter for highest-probability entries
Watch for extreme levels as profit-taking zones
Ranging Markets
Trade reversals at extreme levels (±125)
Use divergences with additional momentum indicator confirmation
Avoid signal line crosses near zero (low-quality signals)
Multi-Timeframe Analysis
Higher timeframe: Identify trend direction (signal line above/below zero)
Lower timeframe: Time precise entries using pullback signals
Confirmation: Use additional momentum indicators for signal validation
Risk Management
Reduce position size at extreme levels (increased reversal risk)
Use ATR-based stops (e.g., 2× ATR from entry)
Exit on opposite extreme level or signal line zero cross
Chart Legend - Visual Signal Guide
Lines and Fills
🔵 Blue Line: LBR 3/10 oscillator value
🔴 Red Line: Signal line (9-period MA of oscillator)
💠 Light Blue Fill: Area between oscillator and signal line (visual momentum gauge)
Background Colors
🟥 Light Red Background: Extreme overbought zone (LBR > +125)
🟩 Light Green Background: Extreme oversold zone (LBR < -125)
Horizontal Reference Lines
➖ +125 (Gray Dashed): Overbought extreme level
➖ 0 (Gray Solid): Zero line - trend separator
➖ -125 (Gray Dashed): Oversold extreme level
Signal Markers
🟢 Green Circle: Bullish divergence detected (price lower low, oscillator higher low)
🔴 Red Circle: Bearish divergence detected (price higher high, oscillator lower high)
▲ Green Triangle Up: Bullish signal cross (oscillator crosses above signal line)
▼ Red Triangle Down: Bearish signal cross (oscillator crosses below signal line)
Yellow Diamond "↑PB": First pullback in uptrend (high-probability buy setup)
Yellow Diamond "↓PB": First pullback in downtrend (high-probability sell setup)
Combining with MACD-V+ Indicator
LBR 3/10 and MACD-V+ work together as a powerful two-timeframe momentum system:
Indicator Roles
MACD-V+: Strategic direction (12-26 period) - identifies market regime and lifecycle state
LBR 3/10: Tactical timing (3-10 period) - pinpoints precise entry and exit moments
Key Principles
Strategic Filter: MACD-V+ determines IF you should trade (market regime)
Tactical Timing: LBR 3/10 determines WHEN to enter (precise timing)
Confirmation Reduces Risk: Trade only when both indicators agree
Respect Lifecycle Changes: Exit when MACD-V+ state changes against your position
Methodology
The LBR 3/10 indicator implements statistical analysis and volatility normalization techniques to create a universal short-term momentum tool. This approach enables consistent interpretation across all markets and timeframes.
The indicator implements:
ATR-based normalization for cross-market comparability
Statistical extreme level validation (±125 levels)
Noise reduction through first pullback filtering
Dual MA type support (SMA/EMA) for flexibility
Standard deviation bands for adaptive threshold levels
LBR 3/10 provides traders with a precise tool for short-term momentum analysis and tactical entry timing. Combined with proper risk management and multi-timeframe analysis, it offers objective signals for both trend-following and reversal trading strategies.
This indicator is designed for educational and analytical purposes. Past performance does not guarantee future results. Always conduct thorough research and consider consulting with financial professionals before making investment decisions.

Fakeout, Breakout & Trend Switch Detector - TrendPredator FOTrendPredator Fakeout Highlighter (FO)
The TrendPredator Fakeout Highlighter is designed to enhance multi-timeframe trend analysis by identifying key market behaviors that indicate trend strength, weakness, and potential reversals. Inspired by Stacey Burke’s trading approach, this tool focuses on trend-following, momentum shifts, and trader traps, helping traders capitalize on high-probability setups.
At its core, this indicator highlights peak formations—anchor points where price often locks in trapped traders before making decisive moves. These principles align with George Douglas Taylor’s 3-day cycle and Steve Mauro’s BTMM method, making the FO Highlighter a powerful tool for reading market structure. As markets are fractal, this analysis works on any timeframe.
How It Works
The TrendPredator FO highlights key price action signals by coloring candles based on their bias state on the current timeframe.
It tracks four major elements:
Breakout/Breakdown Bars – Did the candle close in a breakout or breakdown relative to the last candle?
Fakeout Bars (Trend Close) – Did the candle break a prior high/low and close back inside, but still in line with the trend?
Fakeout Bars (Counter-Trend Close) – Did the candle break a prior high/low, close back inside, and against the trend?
Switch Bars – Did the candle lose/ reclaim the breakout/down level of the last bar that closed in breakout/down, signalling a possible trend shift?
Reading the Trend with TrendPredator FO
The annotations in this example are added manually for illustration.
- Breakouts → Strong Trend
Multiple candles closing in breakout signal a healthy and strong trend.
- Fakeouts (Trend Close) → First Signs of Weakness
Candles that break out but close back inside suggest a potential slowdown—especially near key levels.
- Fakeouts (Counter-Trend Close) → Stronger Reversal Signal
Closing against the trend strengthens the reversal signal.
- Switch Bars → Momentum Shift
A shift in trend is confirmed when price crosses back through the last closed breakout candles breakout level, trapping traders and fuelling a move in the opposite direction.
- Breakdowns → Trend Reversal Confirmed
Once price breaks away from the peak formation, closing in breakdown, the trend shift is validated.
Customization & Settings
- Toggle individual candle types on/off
- Customize colors for each signal
- Set the number of historical candles displayed
Example Use Cases
1. Weekly Template Analysis
The weekly template is a core concept in Stacey Burke’s trading style. FO highlights individual candle states. With this the state of the trend and the developing weekly template can be evaluated precisely. The analysis is done on the daily timeframe and we are looking especially for overextended situations within a week, after multiple breakouts and for peak formations signalling potential reversals. This is helpful for thesis generation before a session and also for backtesting. The annotations in this example are added manually for illustration.
📈 Example: Weekly Template Analysis snapshot on daily timeframe
2. High Timeframe 5-Star Setup Analysis (Stacey Burke "ain't coming back" ACB Template)
This analysis identifies high-probability trade opportunities when daily breakout or down closes occur near key monthly levels mid-week, signalling overextensions and potentially large parabolic moves. Key signals for this are breakout or down closes occurring on a Wednesday. This is helpful for thesis generation before a session and also for backtesting. The annotations in this example are added manually for illustration. Also an indicator can bee seen on this chart shading every Wednesday to identify the signal.
📉 Example: High Timeframe Setup snapshot
3. Low Timeframe Entry Confirmation
FO helps confirm entry signals after a setup is identified, allowing traders to time their entries and exits more precisely. For this the highlighted Switch and/ or Fakeout bars can be highly valuable.
📊 Example (M15 Entry & Exit): Entry and Exit Confirmation snapshot
📊 Example (M5 Scale-In Strategy): Scaling Entries snapshot
The annotations in this examples are added manually for illustration.
Disclaimer
This indicator is for educational purposes only and does not guarantee profits.
None of the information provided shall be considered financial advice.
Users are fully responsible for their trading decisions and outcomes.

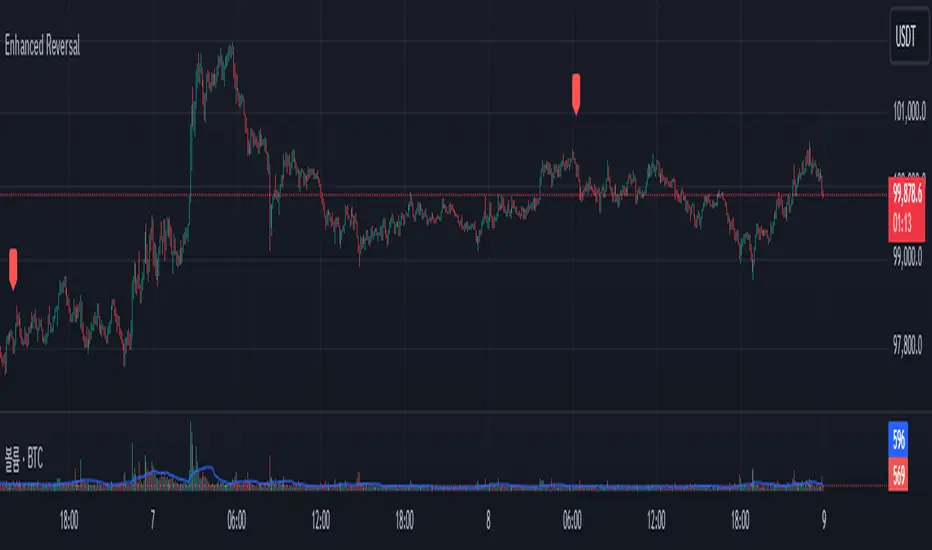
Enhanced Reversal DetectorEnhanced Reversal Detector - Script Description
Overview:
The Enhanced Reversal Detector is a highly refined indicator designed to identify precise trend reversals in financial markets. It improves upon the original reversal detection logic by incorporating additional filters for trend confirmation (using EMA), volume spikes, and candle patterns. These enhancements significantly increase the reliability and accuracy of reversal signals, making it an excellent tool for both short-term and long-term traders.
Key Features
Candle Lookback Logic:
The indicator evaluates historical price action over a user-defined lookback period to detect potential reversal zones.
Bullish reversal conditions are met when price consistently tests lows, and bearish reversal conditions are met when price tests highs.
Trend Confirmation (EMA Filter):
To ensure that reversal signals align with the broader market trend, the indicator incorporates an Exponential Moving Average (EMA) filter.
Bullish signals are only triggered when the price is above the EMA, while bearish signals are only triggered when the price is below the EMA.
Volume Spike Filter:
The indicator checks for significant increases in trading volume to confirm that the reversal is supported by strong market activity.
Volume spikes are calculated as trading volume exceeding a multiple of the 20-bar average volume (default: 1.5x).
Confirmation Period:
Users can define a confirmation window within which reversal signals must be validated.
This reduces false positives and ensures only strong reversals are considered.
Non-Repainting Mode:
Offers a non-repainting option, where signals are based on confirmed conditions from previous bars, ensuring reliability for backtesting.
Visual and Alert Features:
Clear visual markers on the chart indicate bullish (green triangle) and bearish (red triangle) reversal points.
Alert notifications can be enabled for both bullish and bearish reversals, keeping traders informed in real-time.
Inputs
Candle Lookback: Number of candles to evaluate for reversal conditions.
Confirm Within: Number of candles within which a reversal must be validated.
Non-Repainting Mode: Option to enable or disable repainting for signals.
EMA Length: The length of the Exponential Moving Average used for trend confirmation.
Volume Spike Multiplier: Multiplier for identifying significant increases in trading volume.
How It Works
Reversal Detection:
Bullish signals are triggered when:
Price consistently tests recent lows (lookback period).
Price closes above the EMA.
A significant volume spike occurs.
Bearish signals are triggered under opposite conditions (price testing highs, closing below EMA, and volume spike).
Signal Filtering:
Incorporates EMA and volume-based filters to eliminate false positives and focus on high-confidence reversal signals.
Alert Notifications:
Alerts notify users of bullish or bearish reversal opportunities as soon as they are detected.
Use Cases
Scalping and Day Trading:
Ideal for identifying reversals on lower timeframes (e.g., 1-minute or 5-minute charts).
Swing Trading:
Works effectively on higher timeframes (e.g., 1-hour or daily charts) for capturing significant
trend reversals.
Volatile Markets:
Particularly useful in high-volatility markets like cryptocurrencies or forex.
Customization Tips
Adjust the lookback period to fine-tune the sensitivity of the reversal detection.
Increase the volume spike multiplier for markets with irregular trading volumes to focus on significant moves.
Experiment with the EMA length to align signals with your trading strategy's preferred trend duration.
Conclusion
The Enhanced Reversal Detector combines advanced price action analysis, trend confirmation, and market participation filters to deliver high-accuracy reversal signals. With its customizable settings and robust filtering mechanisms, this indicator is an invaluable tool for identifying profitable trading opportunities while minimizing noise and false signals.
Morning & Evening Star Pro (Candle Pattern)Hello Traders!
The Morning & Evening Star Pro indicator often catches the absolute top or bottom of a move and is a reliable reversal indicator. It also provides excellent entries in a strong trending market. For example, in an uptrend you can use a morning star as a pullback entry signal.
The indicator is an advanced tool for identifying powerful reversal patterns in the market. It combines traditional candlestick analysis with modern technical indicators to provide traders with high-probability entry and exit signals.
Key features:
Accurate pattern detection:
Utilizes sophisticated algorithms to identify genuine Morning Star and Evening Star patterns, filtering out false signals.
Trend filter:
Incorporates a customizable Simple Moving Average (SMA) to align signals with the overall market trend, enhancing trade quality.
Volatility awareness:
Integrates Average True Range (ATR) calculations to ensure detected patterns are significant relative to recent price action.
Visual clarity:
Highlights Morning Star and Evening Star patterns with customizable colors and shapes, making them easy to spot on the chart.
Flexible customization:
Offers a wide range of user inputs to tailor the indicator to various trading styles and preferences.
Filtered signal display:
Option to show filtered-out signals, providing insight into the indicator's decision-making process.
Morning Star
Is a bearish reversal (or continuation) pattern consisting of three candles:
A large bearish candle
A small-bodied candle like a Doji or Pin bar
A bullish candle
Evening Star
Is a bullish reversal (or continuation) pattern consisting of three candles:
A large bullish candle
A small-bodied candle like a Doji or Pin bar
A bearish candle
Key differences in this implementation
The middle candle can be either a Doji or a Pin bar, expanding the traditional definition.
The second candle can be a Pin bar, and the third candle can be an outside bar reversal, allowing for more flexibility in pattern recognition.
What makes this indicator unique
Comprehensive pattern analysis:
Goes beyond simple price action by considering multiple factors such as candle body ratios, wick lengths, and relative positions to previous candles.
Adaptive to market conditions:
Uses dynamic thresholds based on recent volatility (ATR) to adjust pattern detection criteria.
Educational value:
The option to display filtered signals helps traders understand why some patterns are rejected, aiding in skill development.
How to Trade with this Indicator:
This indicator often catches the absolute top or bottom of a move and is a reliable reversal indicator. It also provides excellent entries in a trending market. For example, in a strong uptrend you can use morning star signals to enter in a pullback.
Bullish Opportunities:
Look for Morning Star patterns (aqua-colored candles and labels) as potential buy signals.
Bearish Opportunities:
Watch for Evening Star patterns (orange-colored candles and labels) as potential sell signals.
Entry: At next bar open (after the aqua-colored candle for bullish or orange-colored candle for bearish completes)
Stop loss: 2 ticks below/above the pattern's low/high.
Stop loss alternative: If the colored candle is a very strong candle (e.g. for morning star a candle with almost no down wick and a close near the top) the stop goes 2 ticks below/above the colored candle.
Take profit: 3R or use a trailing stop.
Trend Alignment:
For conservative trading, only take trades in the direction of the overall trend as indicated by the SMA.
Note: if you want to see candle coloring of the morning and evening star, you must put the indicator to the top of the object tree.

Multi-Spectral RSI Deviations [AlgoAlpha]🌌 Multi-Spectral RSI Deviations by AlgoAlpha - Dive into Market Dynamics! 🌠
Dive deep into the essence of market trends with our 🚀 Multi-Spectral RSI Deviations indicator, a comprehensive tool designed by AlgoAlpha to enhance your trading strategy. By harnessing the power of multiple RSI lengths and innovative smoothing techniques, this indicator offers a unique perspective on market momentum and potential reversals.
🔍 Key Features:
🎨 Customizable up and down colors for immediate trend recognition.
🔢 Three RSI lengths for multi-layered market analysis.
🔄 Various Moving Average (MA) types including SMA, EMA, and more for tailored smoothing.
✅ Bullish and Bearish divergence plotting for spotting potential reversals.
🕵️♂️ Adjustable divergence sensitivity settings to fine-tune signal detection.
🔔 Built-in alerts for trend shifts and reversal conditions, ensuring you never miss a trading opportunity.
🚀 Quick Guide to Using the Multi-Spectral RSI Deviations Indicator
🛠 Add the Indicator: Search for "Multi-Spectral RSI Deviations" in TradingView's Indicators & Strategies. Adjust the RSI lengths and MA settings to suit your trading strategy.
🔍 Market Analysis: Keep an eye on the color changes for trend direction and use divergence plots to anticipate potential market reversals.
🔔 Alerts Setup: Activate the built-in alerts for trend shifts and reversals to stay ahead of the game without having to constantly monitor the charts.
🧠 How It Works:
At the core of the Multi-Spectral RSI Deviations indicator is its ability to analyze the market through various RSI lengths, providing a comprehensive view of momentum. The indicator calculates the Relative Strength Index (RSI) over three different periods, creating a spectrum of momentum insights. These RSI values are then compared to each other to identify the momentum shifts within the market.
To refine these insights, the differences between these RSI values are smoothed using a selected Moving Average type, such as SMA, EMA, etc., based on user preference. This smoothing process helps in highlighting the overall trend direction and potential reversal points with greater clarity.
Furthermore, the indicator employs a color-coding system, where the plotted line changes color based on the momentum's direction—shifting to an up color for positive momentum and a down color for negative momentum. This visual cue enables traders to quickly discern the market trend at a glance.
Divergences between the price action and the indicator's values are another cornerstone of this tool. By plotting potential bullish and bearish divergences, the indicator provides early signals of possible trend reversals, offering traders a strategic advantage.
Embrace the power of our 🌌 Multi-Spectral RSI Deviations and elevate your trading to stellar heights! 🌠✨

Trend Reversal PredictorTrend Reversal Predictor - An Indicator for Identifying Potential Trend Reversals
This indicator is designed to help traders identify potential trend reversals in the financial markets. It combines multiple criteria including trend identification, volume analysis, average net price movement, and RSI (Relative Strength Index) crossing its moving average to highlight potential danger zones where a trend reversal may occur.
How it Works:
1. Trend Identification: The script uses the Hull Moving Average (HMA) and Parabolic SAR to determine the prevailing trend. The HMA is a smoothing indicator that reduces lag and provides a clear representation of the trend direction.
2. Danger Zone Identification: The script analyzes volume-related metrics and average net price movement to identify potential danger zones where trend reversals might occur. It calculates the rate of change of buying and selling volume and compares it to their respective averages. Additionally, it considers the average net price movement over a specified period.
3. RSI Integration: The script incorporates the RSI, a momentum oscillator, to evaluate overbought and oversold conditions. It calculates the RSI based on user-defined length and source inputs. It also calculates the RSI's moving average using different types of moving averages (SMA, EMA, etc.) specified by the user.
4. Trend Ending Prediction: By combining the conditions of trend identification, volume analysis, average net price movement, and RSI crossing its moving average, the script identifies potential trend reversal points or danger zones. These danger zones are highlighted on the chart using different colors to represent potential uptrend and downtrend reversals.
How to Use:
2. Danger Zone Highlighting: The script highlights potential danger zones on the chart using orange color for uptrend danger zones and blue color for downtrend danger zones. These danger zones suggest areas where a trend reversal may occur.
3. Additional Analysis: Traders can further analyze the danger zones based on their trading strategy and risk management. Consider other technical indicators, price action, and fundamental factors to make informed trading decisions.
Please note that this script provides potential signals for trend reversals but does not guarantee their occurrence. It is important to use this indicator in conjunction with other technical analysis tools and risk management techniques to make well-informed trading decisions.
By understanding the underlying concepts and using the provided visual cues, traders can leverage the Trend Reversal Predictor to potentially identify potential trend reversals in the markets.
Buy/Sell Toolkit (Expo)█ Overview
The Buy/Sell Toolkit is a comprehensive trading tool designed to provide a holistic approach to trading. It brings together essential trading indicators and features in one place, simplifying the trading process and offering valuable insights into the market.
The indicator serves as an all-inclusive solution for traders seeking in-depth technical insights. While the Buy/Sell Toolkit can be utilized alongside other technical analysis methods, it can also be used as a standalone toolkit, adaptable to any trading style. In addition, each feature is thoughtfully integrated because not all technical indicators are suitable for every market condition or trading style.
The Buy/Sell toolkit works in any market and timeframe for discretionary analysis and includes many features:
█ Features
Buy/Sell signals: This feature provides real-time Buy/Sell trading signals for any market and timeframe. These signals are based on the trend.
Contrarian Signals: This feature provides real-time contrarian signals to take a position against the prevailing market trend.
Ultimate Trend: This feature assists in identifying the overall trend of the market, recognizing whether the market is in an uptrend, downtrend, or sideways.
Trend Advisor: The Trend Advisor helps traders understand the trend's strength, duration, and direction.
Trend Reversal: This feature identifies potential points where the current market may reverse within a trend. It's basically a trend-following line based on reversal calculation; it helps traders catch trend continuation setups.
Momentum Average: This indicator measures the rate of change in prices to identify the strength of the current trend. It can be beneficial for spotting potential price breakouts or warning of a market slowdown and pullbacks.
Take Profit Points: This feature suggests optimal points to exit a trade and lock in profits. It determines these points by using various factors such as volatility, support and resistance levels, and historical price movements.
Candle Coloring, Arithmetic Candlesticks, including Arithmetic Heikin Ashi: This feature provides an excellent visual aid to assist traders in recognizing patterns, identifying trends, and optimizing their trading strategies. The Arithmetic Candlesticks help smooth out price volatility and identify market trends more clearly.
Reversal Cloud: This innovative feature provides a graphical representation of potential price reversal zones. The cloud helps traders visualize where the price might reverse its trend.
Trend Cloud: Similar to the Reversal Cloud, this feature visualizes the prevailing market trend, making it easy for traders to understand the direction of the market at a glance.
Signal Optimizer: The Signal Optimizer is a powerful tool that optimizes the Buy/Sell and contrarian signals based on win-rate or performance. It automatically applies the best settings to the signals, freeing traders from the task of constantly adjusting them. This helps traders to get the most reliable signals automatically, enhancing their trading efficiency.
█ How to use the Buy/Sell Toolkit?
Here are a few illustrative examples to provide traders with a better understanding of the Toolkit's practical usage. These examples showcase the combination of features, but it's important to note that they serve as demonstrations, and we encourage traders to explore and adapt the features to align with their unique trading styles.
Buy/Sell Signals & Take Profit
Optimized Buy/Sell signals & Candle Color + Trend Advisor + Reversal Cloud
Contrarian Signals & Take Profit
,with Reversal Cloud
Optimized Contrarian Signals & Ultimate Trend & Reversal Cloud
Trend Cloud
Filter signals with Trend Cloud
█ Why is this Buy/Sell Toolkit Needed?
The Buy/Sell Toolkit is an exceptional tool for traders because it consolidates several critical trading indicators into a single, user-friendly platform. The Toolkit's holistic approach to market analysis can enhance decision-making, reduce guesswork, and improve overall trading performance. Additionally, it allows traders to customize their approach according to the market conditions and their trading style.
The Toolkit's automated features, such as the Signal Optimizer, save time and effort, making it easier for both new and experienced traders. In addition, its comprehensive suite of features ensures traders have all the information they need to make informed trading decisions. All these features make the Buy/Sell Toolkit a powerful ally in any trader's arsenal.
Here's why this Toolkit is essential:
Comprehensive Market Analysis: The Toolkit offers a wide range of indicators and tools for comprehensive market analysis, from trend detection to momentum analysis. This reduces the need for multiple tools and allows for a more efficient trading process. By providing a host of indicators like Buy/Sell signals, Contrarian Signals, Trend Analysis, and Momentum Average, the Toolkit helps traders make well-informed decisions based on comprehensive data and trend analysis.
Automation and Time-Saving: The Signal Optimizer automatically applies the best settings to the signals based on win rate or performance. This saves time and ensures the signals' reliability, reducing, it makes the trading process efficient and hassle-free.
Versatility: The Toolkit is versatile and can be used for various financial markets, including stocks, forex, commodities, or cryptocurrencies. Regardless of the market you trade in, the Buy/Sell Toolkit has something to offer.
Visual Tools: The Toolkit provides visual tools like Reversal Cloud, Trend Cloud, Trend lines, Candle coloring, and much more, which are excellent for visualizing market trends and potential reversal zones. This can make the process of understanding market movements more intuitive and less intimidating, especially for novice traders.
Confirmation: By using multiple indicators in conjunction with each other, traders can confirm signals and improve the accuracy of their trades.
Learning and Development: The Toolkit serves as an excellent resource for both novice and experienced traders to learn about different trading indicators, how they interact, and how to use them effectively.
█ Any Alert Function Call
This function allows traders to combine any feature and create customized alerts. These alerts can be set for various conditions and customized according to the trader's strategy or preferences.
█ How are the features calculated? - Overview
The Toolkit combines many of our existing premium indicators and new technical analysis algorithms to analyze the market. This overview covers how the main features are calculated.
Buy/Sell
The core function calculates the Exponential Weighting for a given time series X over a period T. The time series is based on absolute price changes. It focuses on the magnitude of price changes from one period to the next, irrespective of the direction (up or down). This type of time series can be used to measure the volatility of a price series, as it quantifies the size of price movements. It's useful in scenarios where the direction of the change is not as important as the magnitude of the change.
Contrarian Signals
Our contrarian signals are based on deviation from the expected range value. The algorithm quantifies the amount of variation or dispersion in a set of trading ranges. Non-expected values are the fundamental core of the signal generation process.
Ultimate Trend
The Ultimate trend calculates an adaptive smoothing momentum function by first determining the directional price movement and then applying smoothing to the positive and negative price changes. It then uses these values to calculate a form of Variable Moving Average (VMA), where the smoothing factor is adjusted based on a normalized measure of the relative difference between the Positive and Negative Directional values.
Trend Advisor
It's a form of Moving Averages that are applied to the price chart using three different weighting functions, simple weighting, price volatility smoothing constant weighting, and the traditional EMA weighting function.
Trend Reversal and Cloud
The function uses the information on how much the current price compared to the relative historical price fluctuates over a specific period and automatically updates its equilibrium value at new price changes.
Momentum Average
Essentially, it uses a modified version of the relative rate of change over a certain period.
Take Profit
The take profit uses similar range price functions as the contrarian signals, where a take profit signal is triggered at extremely abnormal values.
Candles
Note, Using and Backtesting on non-standard charts produces unrealistic results since it does not represent the closing price. The candles are based on a smoothing process that finds the best smoothing coefficient for the current data, using close as time series.
█ In conclusion , The Buy/Sell Toolkit serves as a comprehensive, user-friendly, and efficient trading assistant. It brings automation and intelligent data play-by-play to your fingertips, making it an essential tool for anyone serious about trading.
-----------------
Disclaimer
The information contained in my Scripts/Indicators/Ideas/Algos/Systems does not constitute financial advice or a solicitation to buy or sell any securities of any type. I will not accept liability for any loss or damage, including without limitation any loss of profit, which may arise directly or indirectly from the use of or reliance on such information.
All investments involve risk, and the past performance of a security, industry, sector, market, financial product, trading strategy, backtest, or individual's trading does not guarantee future results or returns. Investors are fully responsible for any investment decisions they make. Such decisions should be based solely on an evaluation of their financial circumstances, investment objectives, risk tolerance, and liquidity needs.
My Scripts/Indicators/Ideas/Algos/Systems are only for educational purposes!
Skrip berbayar

RSI MTF Ob+OsHello Traders,
This indicator use the same concept as my previous indicator "CCI MTF Ob+Os".
It is a simple "Relative Strength Index" ( RSI ) indicator with multi-timeframe (MTF) overbought and oversold level.
It can detect overbought and oversold level up to 5 timeframes, which help traders spot potential reversal point more easily.
There are options to select 1-5 timeframes to detect overbought and oversold.
Aqua Background is "Oversold" , looking for "Long".
Orange Background is "Overbought" , looking for "Short".
Have fun :)

CCI MTF Ob+OsHello Traders,
This is a simple Commodity Channel Index (CCI) indicator with multi-timeframe (MTF) overbought and oversold level.
It can detect overbought and oversold level up to 5 timeframes, which help traders spot potential reversal point more easily.
There are options to select 1-5 timeframes to detect overbought and oversold.
Green Background is "Oversold" , looking for "Long".
Red Background is "Overbought" , looking for "Short".
Have fun :)

Signals Pirate™ Doji ScalperSignalsPirate™ Doji Scalper is provides users with an instant screener for the one of the most useful candlestick formations in trading and investing, while also providing signals for points of price reversals and variable levels of support and resistance! This package can take your technical analysis to the next level.
Doji candles are a great indication of indecisiveness in the market, and depending on when they occur can indicate upcoming volatility or even a trend reversal! The candles can be identified by their small bodies (distance between open and close price) and long top and bottom wicks (the candle high and lows).
The simplicity of this package ensures traders of all levels of expertise can utilise this tool and experience its benefits to the fullest. Outside of user preference and customisation options, the only variable that alters package performance is the ‘Sensitivity’ option, which dictates how frequently Doji candles will be detected based on how the candles are formed. A value of 10 indicates more lenient classification of Doji candles, where a value of 1 requires a perfect Doji formation before signalling!
The other options available for your alteration are:
The visibility of the variable levels of support and resistance, which are calculated using a variation of the ATR indicator to gauge asset volatility, as well as price action pivot points to indicate where trader interest may be.
Trend reversal labels for both potentially ‘Weak’ and ‘Strong’ reversals. These labels are created based on how price reacts to the varying levels of support and resistance, as well as the candlestick pattern and formation around those crucial levels.
The default settings are the best settings we’ve found so far but you can change them to build your own unique trading strategy. We’d recommend experimenting with these values to find the best results for the asset you are trading, and your own personal trading and investing style.
Direction for use:
1. Use on any asset class and time frame.
2. Fine tune the Doji Sensitivity variable.
3. Be cautious of upcoming volatility after a Doji signal, especially if the signal occurs near the support and resistance levels or after a large move, which could indicate a trend reversal.
4. Watch for Reversal signals, which can provide confluence with the Doji signals and give an early indication that price may soon start moving in the opposite direction.
As mentioned previously, this is a candlestick detection system that dynamically operates to function with superior accuracy regardless of what you’re trading. But with the level of customisation available, this can easily be fine tuned to accommodate scalping, reversal trading, or even long term investing.
We hope you love this package, and it takes your trading and investing to the next level. Please let us know if you have any questions or queries regarding the logic behind the bundle, or if you have any suggestions for improvements etc. We love your feedback and are constantly striving to continuously improve!

Socrates Reversals PlotterSOCRATES Reversals Plotter
Introduction
This script is intended for users of the Socrates platform. This is located on ask-socrates.com which is property of AE Global Solutions, Inc.
Background
It is cumbersome to track the reversal system on the proprietary platform especially when users want to combine it with real-time data on TradingView. Some active reversals, especially those on the daily level change quite often and updating the charts regularly takes a lot of time. Therefore I've created this script primarily for the following reasons:
Simplify the process of keeping the charts updated
Standardize the look of the graphs so that they can be quickly understood when shared with other users for studying purposes and discussions
Features
v1.0 (20201203)
Add up to 5 daily/weekly/monthly reversals which will plot and format automatically
Easily hide daily/weekly/monthly reversals as a group
Highlight the range of a given unit of reversals. This takes the values of the lowest bullish and highest bearish reversals. They are expected to be written in #01 fields
Don't forget to use the option to "Save As Default" at the bottom of the Inputs tab. This will make sure all your reversals are stored even if you remove the indicator from your graph
