open 5 min range 09:00/15:30the indicator will remove himself after 2h. it´s for trading in the 1min chart. wait for breakout, than retest and after that trade away from the boxes if u see price action.
Cari skrip untuk "retest"
Scalping Strategy: FVG + Engulfing
This is a scalping strategy based on the Fair Value Gap (FVG) and Engulfing pattern confirmation. It identifies the high and low of the first 5-minute candle after the 9:30 AM EST market open and waits for a breakout supported by a Fair Value Gap. A trade is only triggered after a retest of the FVG zone followed by an engulfing candle in the direction of the breakout. Trades are entered with a fixed 3:1 risk-to-reward ratio and limited to 2 entries per trading day to avoid overtrading. Ideal for NASDAQ scalping on a 1-minute chart.

BioSwarm Imprinter™BioSwarm Imprinter™ — Agent-Based Consensus for Traders
What it is
BioSwarm Imprinter™ is a non-repainting, agent-based sentiment oscillator. It fuses many short-to-medium lookback “opinions” into one 0–100 consensus line that is easy to read at a glance (50 = neutral, >55 bullish bias, <45 bearish bias). The engine borrows from swarm intelligence: many simple voters (agents) adapt their influence over time based on how well they’ve been predicting price, so the crowd gets smarter as conditions change.
Use it to:
• Detect emerging trends sooner without overreacting to noise.
• Filter mean-reversion vs continuation opportunities.
• Gate entries with a confidence score that reflects both strength and persistence of the move.
• Combine with your execution tools (VWAP/ORB/levels) as a state filter rather than a trade signal by itself.
⸻
Why it’s different
• Swarm learning: Each agent improves or decays its “fitness” depending on whether its vote matched the next bar’s direction. High-fitness agents matter more; weak agents fade.
• Multi-horizon by design: The crowd is composed of fixed, simple lookbacks spread from lenMin to lenMax. You get a blended, robust view instead of a single fragile parameter.
• Two complementary lenses: Each agent evaluates RSI-style balance (via Wilder’s RMA) and momentum (EMA deviation). You decide the weight of each.
• No repaint, no MTF pitfalls: Everything runs on the chart’s timeframe with bar-close confirmation; no request.security() or forward references.
• Actionable UI: A clean consensus line, optional regime background, confidence heat, and triangle markers when thresholds are crossed.
⸻
What you see on the chart
• Consensus line (0–100): Smoothed to your preference; color/area makes bull/bear zones obvious.
• Regime coloring (optional): Light green in bull zone, light red in bear zone; neutral otherwise.
• Confidence heat: A small gauge/number (0–100) that combines distance from neutral and recent persistence.
• Markers (optional): Triangles when consensus crosses up through your bull threshold (e.g., 55) or down through your bear threshold (e.g., 45).
• Info panel (optional): Consensus value, regime, confidence, number of agents, and basic diagnostics.
⸻
How it works (under the hood)
1. Horizon bins: The range is divided into numBins. Each bin has a fixed, simple integer length (crucial for Pine’s safety rules).
2. Per-bin features (computed every bar):
• RSI-style balance using Wilder’s RMA (not ta.rsi()), then mapped to −1…+1.
• Momentum as (close − EMA(L)) / EMA(L) (dimensionless drift).
3. Agent vote: For its assigned bin, an agent forms a weighted score: score = wRSI*RSI_like + wMOM*Momentum. A small dead-band near zero suppresses chop; votes are +1/−1/0.
4. Fitness update (bar close): If the agent’s previous vote agreed with the next bar’s direction, multiply its fitness by learnGain; otherwise by learnPain. Fitness is clamped so it never explodes or dies.
5. Consensus: Weighted average of all votes using fitness as weights → map to 0–100 and smooth with EMA.
Why it doesn’t repaint:
• No future references, no MTF resampling, fitness updates only on confirmed bars.
• All TA primitives (RMA/EMA/deltas) are computed every bar unconditionally.
⸻
Signals & confidence
• Bullish bias: consensus ≥ bullThr (e.g., 55).
• Bearish bias: consensus ≤ bearThr (e.g., 45).
• Confidence (0–100):
• Distance score: how far consensus is from 50.
• Momentum score: how strong the recent change is versus its recent average.
• Combined into a single gate; start filtering entries at ≥60 for higher quality.
Tip: For range sessions, raise thresholds (60/40) and increase smoothing; for momentum sessions, lower smoothing and keep thresholds at 55/45.
⸻
Inputs you’ll actually tune
• Agents & horizons:
• N_agents (e.g., 64–128)
• lenMin / lenMax (e.g., 6–30 intraday, 10–60 swing)
• numBins (e.g., 12–24)
• Weights & smoothing:
• wRSI vs wMOM (e.g., 0.7/0.3 for FX & indices; 0.6/0.4 for crypto)
• deadBand (0.03–0.08)
• consSmooth (3–8)
• Thresholds & hygiene:
• bullThr/bearThr (55/45 default)
• cooldownBars to avoid signal spam
⸻
Playbooks (ready-to-use)
1) Breakout / Trend continuation
• Timeframe: 15m–1h for day/swing.
• Filter: Take longs only when consensus > 55 and confidence ≥ 60.
• Execution: Use your ORB/VWAP/pullback trigger for entry. Trail with swing lows or 1.5×ATR. Exit on a close back under 50 or when a bearish signal prints.
2) Mean reversion (fade)
• When: Sideways days or low-volatility clusters.
• Setup: Increase deadBand and consSmooth.
• Signal: Bearish fades when consensus rolls over below ≈55 but stays above 50; bullish fades when it rolls up above ≈45 but stays below 50.
• Targets: The neutral zone (~50) as the first take-profit.
3) Multi-TF alignment
• Keep BioSwarm on 1H for bias, execute on 5–15m:
• Only take entries in the direction of the 1H consensus.
• Skip counter-bias scalps unless confidence is very low (explicit mean-reversion plan).
⸻
Integrations that work
• DynamoSent Pro+ (macro bias): Only act when macro bias and swarm consensus agree.
• ORB + Session VWAP Pro: Trade London/NY ORB breakouts that retest while consensus >55 (long) or <45 (short).
• Levels/Orderflow: BioSwarm is your “go / no-go”; execution stays with your usual triggers.
⸻
Quick start
1. Drop the indicator on a 1H chart.
2. Start with: N_agents=64, lenMin=6, lenMax=30, numBins=16, deadBand=0.06, consSmooth=5, thresholds 55/45.
3. Trade only when confidence ≥ 60.
4. Add your favorite execution tool (VWAP/levels/OR) for entries & exits.
⸻
Non-repainting & safety notes
• No request.security(); no hidden lookahead.
• Bar-close confirmation for fitness and signals.
• All TA calls are unconditional (no “sometimes called” warnings).
• No series-length inputs to RSI/EMA — we use RMA/EMA formulas that accept fixed simple ints per bin.
⸻
Known limits & tips
• Too many signals? Raise deadBand, increase consSmooth, widen thresholds to 60/40.
• Too few signals? Lower deadBand, reduce consSmooth, narrow thresholds to 53/47.
• Over-fitting risk: Keep learnGain/learnPain modest (e.g., ×1.04 / ×0.96).
• Compute load: Large N_agents × numBins is heavier; scale to your device.
⸻
Example recipes
EURUSD 1H (swing):
lenMin=8, lenMax=34, numBins=16, wRSI=0.7, wMOM=0.3, deadBand=0.06, consSmooth=6, thr=55/45
Buy breakouts when consensus >55 and confidence ≥60; confirm with 5–15m pullback to VWAP or level.
SPY 15m (US session):
lenMin=6, lenMax=24, numBins=12, consSmooth=4, deadBand=0.05
On trend days, stay with longs as long as consensus >55; add on shallow pullbacks.
BTC 1H (24/7):
Increase momentum weight: wRSI=0.6, wMOM=0.4, extend lenMax to ~50. Use dynamic stops (ATR) and partials on strong verticals.
⸻
Final word
BioSwarm is a state engine: it tells you when the market is primed to continue or mean-revert. Pair it with your entries and risk framework to turn that state into trades. If you’d like, I can supply a companion strategy template that consumes the consensus and back-tests the three playbooks (Breakout/Fade/Flip) with standard risk management.

维加斯双通道策略Vegas Channel Comprehensive Strategy Description
Strategy Overview
A comprehensive trading strategy based on the Vegas Dual Channel indicator, supporting dynamic position sizing and fund management. The strategy employs a multi-signal fusion mechanism including classic price crossover signals, breakout signals, and retest signals, combined with trend filtering, RSI+MACD filtering, and volume filtering to ensure signal reliability.
Core Features
Dynamic Position Sizing: Continue adding positions on same-direction signals, close all positions on opposite signals
Smart Take Profit/Stop Loss: ATR-based dynamic TP/SL, updated with each new signal
Fund Management: Supports dynamic total amount management for compound growth
Time Filtering: Configurable trading time ranges
Risk Control: Maximum order limit to prevent over-leveraging
Leverage Usage Instructions
Important: This strategy does not use TradingView's margin functionality
Setup Method
Total Amount = Actual Funds × Leverage Multiplier
Example: Have 100U actual funds, want to use 10x leverage → Set total amount to 100 × 10 = 1000U
Trading Amount Calculation
Each trade percentage is calculated based on leveraged amount
Example: Set 10% → Actually trade 100U margin × 10x leverage = 1000U trading amount
Maximum Orders Configuration
Must be used in conjunction with leveraged amount
Example: 1000U total amount, 10% per trade, maximum 10 orders = maximum use of 1000U
Note: Do not exceed 100% of total amount to avoid over-leveraging
Parameter Configuration Recommendations
Leverage Configuration Examples
Actual funds 100U, 5x leverage, total amount setting 500U, 10% per trade, 50U per trade, recommended maximum orders 10
Actual funds 100U, 10x leverage, total amount setting 1000U, 10% per trade, 100U per trade, recommended maximum orders 10
Actual funds 100U, 20x leverage, total amount setting 2000U, 5% per trade, 100U per trade, recommended maximum orders 20
Risk Control
Conservative: 5-10x leverage, 10% per trade, maximum 5-8 orders
Aggressive: 10-20x leverage, 5-10% per trade, maximum 10-15 orders
Extreme: 20x+ leverage, 2-5% per trade, maximum 20+ orders
Strategy Advantages
Signal Reliability: Multiple filtering mechanisms reduce false signals
Capital Efficiency: Dynamic fund management for compound growth
Risk Controllable: Maximum order limits prevent liquidation
Flexible Configuration: Supports various leverage and fund allocation schemes
Time Control: Configurable trading hours to avoid high-risk periods
Usage Notes
Ensure total amount is set correctly (actual funds × leverage multiplier)
Maximum orders should not exceed the range allowed by total funds
Recommend starting with conservative configuration and gradually adjusting parameters
Regularly monitor strategy performance and adjust parameters timely
维加斯通道综合策略说明
策略概述
基于维加斯双通道指标的综合交易策略,支持动态加仓和资金管理。策略采用多信号融合机制,包括经典价穿信号、突破信号和回踩信号,结合趋势过滤、RSI+MACD过滤和成交量过滤,确保信号的可靠性。
核心功能
动态加仓:同向信号继续加仓,反向信号全部平仓
智能止盈止损:基于ATR的动态止盈止损,每次新信号更新
资金管理:支持动态总金额管理,实现复利增长
时间过滤:可设置交易时间范围
风险控制:最大订单数限制,防止过度加仓
杠杆使用说明
重要:本策略不使用TradingView的保证金功能
设置方法
总资金 = 实际资金 × 杠杆倍数
示例:实际有100U,想使用10倍杠杆 → 总资金设置为 100 × 10 = 1000U
交易金额计算
每笔交易百分比基于杠杆后的金额计算
示例:设置10% → 实际交易 100U保证金 × 10倍杠杆 = 1000U交易金额
最大订单数配置
必须配合杠杆后的金额使用
示例:1000U总资金,10%单笔,最大10单 = 最多使用1000U
注意:不要超过总资金的100%,避免过度杠杆
参数配置建议
杠杆配置示例
实际资金100U,5倍杠杆,总资金设置500U,单笔百分比10%,单笔金额50U,建议最大订单数10单
实际资金100U,10倍杠杆,总资金设置1000U,单笔百分比10%,单笔金额100U,建议最大订单数10单
实际资金100U,20倍杠杆,总资金设置2000U,单笔百分比5%,单笔金额100U,建议最大订单数20单
风险控制
保守型:5-10倍杠杆,10%单笔,最大5-8单
激进型:10-20倍杠杆,5-10%单笔,最大10-15单
极限型:20倍以上杠杆,2-5%单笔,最大20单以上
策略优势
信号可靠性:多重过滤机制,减少假信号
资金效率:动态资金管理,实现复利增长
风险可控:最大订单数限制,防止爆仓
灵活配置:支持多种杠杆和资金配置方案
时间控制:可设置交易时间,避开高风险时段
使用注意事项
确保总资金设置正确(实际资金×杠杆倍数)
最大订单数不要超过总资金允许的范围
建议从保守配置开始,逐步调整参数
定期监控策略表现,及时调整参数

ICT Sweep + FVG Entry (v6) • Pro Pack 📌 ICT Sweep + FVG Entry Pro Pack
This indicator combines key ICT price action concepts with practical execution tools to help traders spot high-probability setups faster and more objectively. It’s designed for scalpers and intraday traders who want to keep their chart clean but never miss critical market structure events.
🔑 Features
Liquidity Pools (HTF)
• Auto-detects recent swing highs/lows from higher timeframes (5m/15m).
• Draws both lines and optional rectangles/zones for clear liquidity areas.
Liquidity Sweeps (BSL/SSL)
• Identifies when price sweeps above/below liquidity pools and rejects back.
• Optional Grade-A sweep filter (wick size + strong re-entry).
Fair Value Gaps (FVGs)
• Highlights bullish/bearish imbalances.
• Optional midline (50%) entry for precision.
• Auto-invalidation when price fully closes inside the gap.
Killzones (New York)
• Highlights AM (9:30–11:30) and PM (14:00–15:30) killzones.
• Option to block signals outside killzones for higher strike rate.
Bias Badge (DR50)
• Displays if price is trading in a Bull, Bear, or Range context based on displacement range midpoint.
SMT Assist (NQ vs ES)
• Detects simple divergences between indices:
Bearish SMT → NQ makes HH while ES doesn’t.
Bullish SMT → NQ makes LL while ES doesn’t.
SL/TP Helper & R:R Label
• Automatically draws stop loss (at sweep extreme) and target (opposite pool or recent swing).
• Displays expected Risk:Reward ratio and blocks entries if below your chosen minimum.
Filters
• ATR filter ensures signals only appear in sufficient volatility.
• Sweep quality filter avoids weak wicks and fake-outs.
🎯 How to Use
Start on HTF (5m/15m) → Identify liquidity zones and bias.
Drop to LTF (1m) → Wait for a liquidity sweep confirmation.
Check for FVG in the sweep’s direction → Look for retest entry.
Use the SL/TP helper to validate your risk/reward before taking the trade.
Focus entries during NY Killzones for maximum effectiveness.
✅ Why this helps
This tool reduces screen time and hesitation by automating repetitive ICT concepts:
Liquidity pools, sweeps, and FVGs are marked automatically.
Killzone timing and SMT divergence are simplified.
Clear visual signals for entries with built-in RR filter help keep your trading mechanical.
⚠️ Disclaimer: This script is for educational purposes only. It does not provide financial advice or guarantee results. Always use proper risk management.

TRAPPER TRENDLINES — PRICEDraws dynamic trendlines on price by connecting the two most recent confirmed swing points (highs to highs for resistance, lows to lows for support). Swings are defined with a symmetric left/right pivot window. Old anchors are ignored so lines stay attached to current structure. Optional break alerts are included.
How it works (plain language)
Pivots: A bar is a swing high (or low) only if it’s the most extreme point compared with a set number of bars on the left and the right.
Lines:
Support connects the last two confirmed swing lows.
Resistance connects the last two confirmed swing highs.
Lines can be extended right only or both left & right (toggle).
Recency filter: Only swings within the last N bars are kept. This avoids anchoring to very old pivots far from current price.
Alerts: Optional alerts fire when price closes above resistance or below support.
Inputs
Auto Settings
Auto pivot size by chart timeframe: When ON, the script picks a pivot size suitable for the current timeframe (you can scale it with Auto pivot multiplier). When OFF, the manual left/right inputs are used.
Auto pivot multiplier: Scales the auto pivot size (e.g., 1.5 makes pivots stricter).
Manual Pivots
Pivot Left / Pivot Right: Bars to the left/right required to confirm a swing. Example: Left=50 & Right=50 keeps only major swings.
Recency Filter
Use last N bars for pivots: Swings older than this window are discarded so trendlines stay relevant to current price.
Style
Support/Resistance color: Line colors.
Extend Left & Right: When ON, both endpoints extend; when OFF, lines extend to the right only.
Alerts
Enable Break Alerts: When ON, alert conditions are exposed:
Price: Break Up — close above resistance.
Price: Break Down — close below support.
Suggested settings
Higher timeframes (4H / 1D / 1W):
Manual: Pivot Left = 50, Pivot Right = 50, Use last N bars = 400–800.
Or enable Auto with Auto pivot multiplier = 1.0–1.5.
Intraday (15m / 30m / 1H):
Manual: Pivot Left = 30, Pivot Right = 30, Use last N bars = 300–500.
Or enable Auto with multiplier ≈ 1.0–1.2.
Pairing with RSI for confluence/divergence
This tool is designed to pair with a companion TRAPPER TRENDLINES — RSI (or any RSI trendline script):
To mirror swings, set RSI Pivot Lookback equal to the price Pivot Left/Right you use here.
Example: Price = 50/50 → RSI Pivot Lookback = 50.
Keep RSI at Length 14 with 70/30 channel for clarity.
Confluence: Price holds/rejects at a trendline while RSI trendline agrees.
Divergence: Price prints a higher high (resistance line rising) while RSI prints a lower high (RSI resistance line falling), or vice-versa for lows. Matching pivot windows makes these relationships clear and reduces false signals.
Reading the signals
Trendline touch/hold: Potential reaction area; wait for follow-through.
Break Up / Break Down (alerts): Close beyond the line. Consider retest behavior, higher-timeframe context, and volume/RSI confirmation.
Notes & limitations
Pivots require future bars to confirm (by design). Lines update as pivots confirm.
“Use last N bars” purposely ignores very old swings. Increase this value if you need legacy structure.
Lines are based on two most recent confirmed pivots per side; rapidly changing markets can replace anchors as new swings confirm.
This is a visual/analytical tool. No strategy entries/exits or performance claims are provided.
Compliance
This script is for educational purposes only and does not constitute financial advice. Trading involves risk. Past results do not guarantee future outcomes. No promises of profit, accuracy, or performance are made.
Alerts (titles/messages)
Price: Break Up — “Price broke above resistance trendline.”
Price: Break Down — “Price broke below support trendline.”
Quick start
Add the indicator to your chart.
Choose Auto or set Pivot Left/Right manually.
Set Use last N bars for how far back to consider swings.
Toggle Extend Left & Right to your preference.
(Optional) Add your RSI trendline indicator and match Pivot Lookback with your price pivot size for clean confluence/divergence.
Enable alerts if you want notifications on breaks.

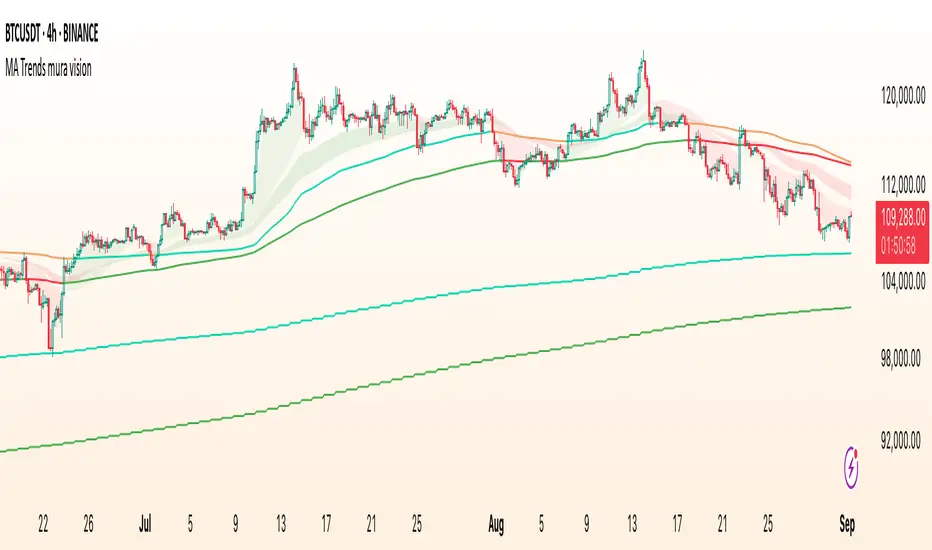
MA Trends — mura visionMA Trends — mura vision is a multi-timeframe trend map that blends two local trend “ribbons” on the current timeframe with higher-timeframe context lines. It helps you read market bias at a glance and align entries with the dominant trend.
What the indicator plots
On the current timeframe
SMA 5/34 — short-term trend ribbon (filled area between SMA5 and SMA34).
EMA 55/89 — swing trend ribbon (filled area between EMA55 and EMA89).
Higher-timeframe context
EMA 233 (4H & 1D) — plotted as lines. Color reflects whether price on the same HTF is above (support) or below (resistance).
KAMA 233 (4H & 1D) — plotted as lines using a custom Kaufman implementation (Efficiency Ratio with fast=2, slow=30; squared smoothing). Color logic is the same as EMA 233.
Optional (disabled by default)
EMA 233 & KAMA 233 on the current TF — toggle on if you want the same 233 anchors on the chart’s timeframe.
Note: All higher-TF series are requested via request.security() with lookahead_off .
How to read it
1 Bias : Use the 4H/1D EMA/KAMA 233 as dynamic anchors.
• Green = price is above the anchor on that HTF (supportive context).
• Red = price is below the anchor on that HTF (resistive context).
2 Alignment : When both ribbons are green (SMA5>34 and EMA55>89) while HTF anchors are green, momentum and context agree (higher-quality trend). The opposite coloring suggests bearish alignment.
3 Pullbacks : Retracements toward the ribbon edges often act as retest zones within the prevailing regime.
Inputs & customization
Visibility toggles for each block:
SMA 5/34 (current TF), EMA 55/89 (current TF), EMA/KAMA 233 for 4H, 1D, and current TF (the latter are off by default).
Colors :
Lines for SMA5/SMA34 and EMA55/EMA89 (plotted with high transparency), fill colors for up/down trend ribbons, and separate support/resistance colors for EMA/KAMA 233.
Line width for all 233 anchors.
MTF behavior & repainting notes
HTF lines (4H/1D) are computed with lookahead_off and update intrabar until the higher-TF candle closes. This is expected on TradingView and not “future-looking”, but values can stabilize only at the close of the 4H/1D bar.
If you require strictly confirmed HTF values, use a “previous bar” approach (e.g., plotting series ) — not included here to keep the display responsive.
Good practices
Determine direction with 4H/1D EMA/KAMA 233, then refine timing with the current-TF ribbons.
For conservative use, favor trades with the color of the dominant HTF anchor.
Combine with your own risk management and confirmation rules.
What this script is / isn’t
✅ Visual analysis tool for multi-timeframe trend context.
❌ Not a strategy: it does not generate orders or calculate P&L.
Credits & license
© trading_mura — Published for educational purposes under the Mozilla Public License 2.0.
KAMA is implemented via a custom Kaufman method (ER with fast=2, slow=30, squared smoothing), not ta.kama() .
Disclaimer
Trading involves risk. This indicator is provided “as is” for informational/educational use only and is not financial advice. Always test on historical data and use proper risk management.
Ai Golden Support and Resistance Adaptive Support & Resistance (ADR-scaled ABCD + Breakout/Retest Zones)
What it does
This indicator detects actionable support/resistance zones from swing structure and breakout events, then keeps each zone active until it’s invalidated by price. It adapts zone sensitivity using Average Daily Range (ADR) so the same rules scale across symbols and vol regimes.
Core Logic (high level)
Swing & ABCD pattern seed
Detects alternating pivots (high–low–high–low or low–high–low–high) using a user-selected lookback.
Validates basic AB–BC–CD proportions: BC must retrace a portion of AB; CD must extend BC within a set range.
From a valid sequence, sets a candidate level (top for bearish, bottom for bullish).
Breakout confirmation
A level becomes confirmed when price closes beyond it (crossover/crossunder).
On confirmation, the script draws a dotted reference line and records how many bars elapsed from the seed pivot to breakout. That count defines the lookback window used for local extremes.
Zone construction
Supply (bearish): builds a box around the most recent local range near the bearish seed;
Demand (bullish): builds a box around the most recent local range near the bullish seed.
Each zone’s height is derived from nearby extremes and the seed swing, so boxes reflect local structure rather than fixed pip widths.
Volatility normalization (ADR%)
ADR is computed from daily candles.
The Risk Profile input (“High/Medium/Low”) scales required move sizes using ADR%, and adjusts pivot sensitivity (fewer/more bars).
Higher risk → more sensitive (smaller ADR %, tighter pivot lookback).
Lower risk → stricter filters (larger ADR %, wider pivot lookback).
Explosive-move filter (streak logic)
Searches the seeded lookback for consecutive same-color candles (config via the risk profile).
Requires the cumulative % move of that streak to exceed an ADR-scaled threshold.
When found, the zone is tagged as originating from an “explosive” move (potentially higher reaction probability).
Zone persistence & invalidation
Zones persist and auto-extend to the right until invalidated.
Invalidation occurs when price closes through a rule-based threshold derived from the seed structure (stored per zone).
Once invalidated, the zone is marked inactive and stops updating.
Inputs & Controls
Risk Profile: High / Medium / Low (sets pivot lookback, streak length, and ADR% thresholds).
Labels & Visuals: Toggle labels and level lines; set line width.
Colors/Boxes: Supply (red), Demand (green); dotted breakout references.
No broker/session settings are required; the script adapts per symbol via ADR.
On-Chart Elements
Dotted breakout lines at confirmed levels (with measured bars-to-breakout).
Supply/Demand boxes that extend until invalidation.
Optional labels for clarity; minimal clutter by default.
How to Use
Context: Use higher-TF context for bias; apply zones on your trading TF.
Confluence: Combine zones with your own triggers (structure breaks, rejection wicks, momentum shifts).
Invalidation: If price closes beyond a zone’s invalidation threshold, treat that zone as inactive.
Sensitivity: If too many zones appear, switch to Medium/Low Risk (stricter ADR% & pivots); if too few, use High Risk.
Notes & Limitations
Logic is rule-based; there is no machine learning.
Daily ADR is computed from D timeframe, so intraday charts inherit daily volatility context.
Results vary by symbol and timeframe; validate settings per market.
This is an indicator (no orders or P/L).

CRUCE EMA200/EMA365 + RETEST Created by our community member Gian from cryptobytez. This indicator shows you when the 200 and 365 EMA cross

Bearish Breakaway Dual Session-FVGInspired by the FVG Concept:
This indicator is built on the Fair Value Gap (FVG) concept, with a focus on Consolidated FVG. Unlike traditional FVGs, this version only works within a defined session (e.g., ETH 18:00–17:00 or RTH 09:30–16:00).
See the Figure below as an example:
Bearish consolidated FVG & Bearish breakaway candle
Begins when a new intraday high is printed. After that, the indicator searches for the 1st bearish breakaway candle, which must have its high below the low of the intraday high candle. Any candles in between are part of the consolidated FVG zone. Once the 1st breakaway forms, the indicator will shades the candle’s range (high to low). Then it will use this candle as an anchor to search for the 2nd, 3rd, etc. breakaways until the session ends.
Session Reset: Occurs at session close.
Repaint Behavior:
If a new intraday (or intra-session) high forms, earlier breakaway patterns are wiped, and the system restarts from the new low.
Counter:
A session-based counter at the top of the chart displays how many bullish consolidated FVGs have formed.
Settings
• Session Setup:
Choose ETH, RTH, or custom session. The indicator is designed for CME futures in New York timezone, but can be adjusted for other markets.
If nothing appears on your chart, check if you loaded it during an inactive session (e.g., weekend/Friday night).
• Max Zones to Show:
Default = 3 (recommended). You can increase, but 3 zones are usually most useful.
• Timeframe:
Best on 1m, 5m, or 15m. (If session range is big, try higher time frame)
Usage:
See this figure as an example
1. Avoid Trading in Wrong Direction
• No Bearish breakaway = No Short trade.
• Prevents the temptation to countertrade in strong uptrends.
2. Catch the Trend Reversal
• When a bearish breakaway appears after an intraday high, it signals a potential reversal.
• You will need adjust position sizing, watch out liquidity hunt, and place stop loss.
• Best entries of your preferred choices: (this is your own trading edge)
Retest
Breakout
Engulf
MA cross over
Whatever your favorite approach
• Reversal signal is the strongest when price stays within/below the breakaway candle’s
range. Weak if it breaks above.
3. Higher Timeframe Confirmation
• 1m can give false reversals if new lows keep forming.
• 5m often provides cleaner signals and avoids premature reversals.
Summary
This indicator offers 3 main advantages:
1. Prevents wrong-direction trades.
2. Confirms trend entry after reversal signals.
3. Filters false positives using higher timeframes.
Failed example:
Usually happen if you are countering a strong trend too early and using 1m time frame
Last Mention:
The indicator is only used for bearish side trading.

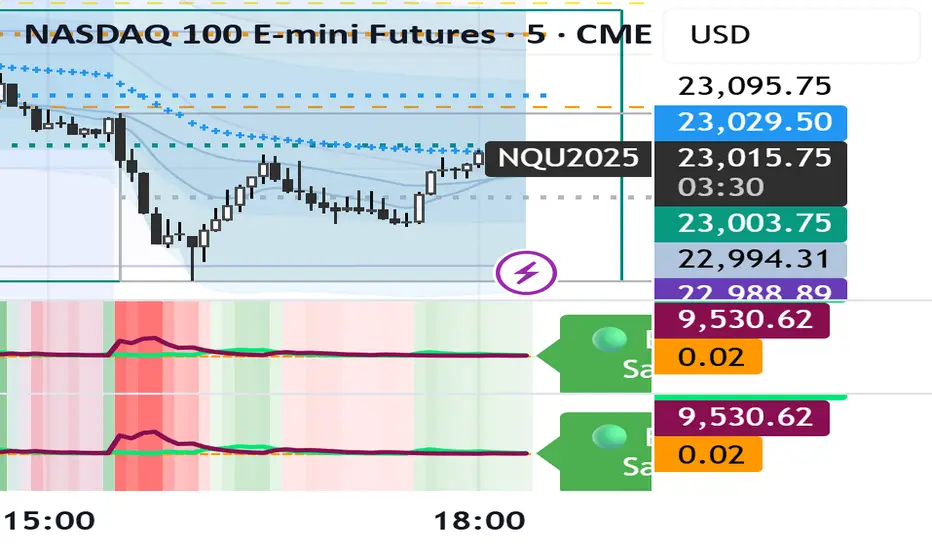
Renko Open Range delta
Delta Renko-Style Indicator Guide (NQ Focus)
This indicator takes inspiration from the Renko Chart concept and is optimized for the RTH session (New York time zone), specifically applied to the Nasdaq futures (NQ) product.
If you’re unfamiliar with Renko charts, it may help to review their basics first, as this indicator borrows their clean, block-based perspective to simplify price interpretation.
⸻
🔧 How the Indicator Works
• At market open (9:30 AM EST), the indicator plots a horizontal open price line, referred to as 0 delta.
• From this anchor, it plots 10 incremental levels (deltas) both above and below the open, each spaced by 62.5 NQ points.
Why 62.5?
• With NQ currently trading in the 23,000–24,000 range, a 62.5-point move represents roughly 0.26% of the daily average range.
• This makes each delta step significant enough to capture movement while filtering out smaller noise.
A mini table (location adjustable) displays:
• Current delta zone
• Last touched delta level
This gives you a quick snapshot of where price sits relative to the open.
⸻
📈 How to Read the Market
• At the open, price typically oscillates between 0 and +1 / -1 delta.
• A break beyond this zone often signals stronger directional intent:
• Trending day: price can push into +2, +3, +4, +5 (or the inverse for downside).
• Range day: expect price to bounce between +1, 0, -1 deltas.
⚠️ Note: This is a visualization tool, not a trading system. Its purpose is to help you quickly recognize range vs. trend conditions.
⸻
📊 Example
• In this case, NQ reached +1 delta shortly after open.
• A retest of 0 delta followed, and price later surged to +5/+6 deltas (helped by Fed news).
⸻
🛠️ Practical Uses
This indicator can help you:
• Define profit targets
• Place hard stop levels
• Gauge whether a counter-trend trade is worth the risk
⚠️ Caution: Avoid counter-trend trades if price is aggressively pushing toward +5/+6 or -5/-6 deltas, as trend exhaustion usually hasn’t set in yet.
⸻
🔄 Adapting for ES (S&P Futures)
• On NQ, 62.5 points ≈ $1,250 per contract.
• For ES, this translates to 25 points.
• Since 1 NQ contract ≈ 2 ES contracts in dollar terms, an optimized ES delta step would be 12.5 points.
You may also experiment with different delta values (e.g., 50 or 31.25 for NQ) to align with your risk profile and trading style.
⸻
🧪 Extending Beyond NQ
You can experiment with applying this indicator to ES or even stocks, but non-futures assets may require additional calibration and testing.
⸻
✅ Bottom line: This tool provides a clean, Renko-inspired framework for quickly gauging trend vs. range conditions, setting realistic profit targets, and avoiding poor counter-trend setups.

Three-Step 9:30 Range Scalping# Three-Step 9:30 Range Scalping Strategy Rules
## Step 1: Mark the Levels (9:30 AM)
- Wait for the **first 5-minute candle** starting at 9:30 AM EST to close
- Mark the **HIGH** and **LOW** of this candle
- Switch to **1-minute chart** for trading
## Step 2: Find Your Entry (Trade for 1 hour only: 9:30-10:30 AM)
### BREAK Entry
- Need: **Fair Value Gap (FVG)** + **ANY** of the 3 FVG candles closes outside the range
- FVG = Gap between candle wicks (3-candle pattern)
### TRAP Entry
- Need: Break outside range → Retest back inside → Close back outside again
### REVERSAL Entry
- Need: Failed break in one direction → Opposite FVG back into the range
## Step 3: Trade Management
### Stop Loss:
- **Break/Trap**: Low/High of first candle that closed outside the range
- **Reversal**: Low/High of first candle in the FVG pattern
### Take Profit:
- **Always 2:1 risk-to-reward ratio**
- If you risk $100, you make $200
## Key Rules:
- ✅ **Body close** outside range (not just wicks)
- ✅ Trade on **1-minute chart** only
- ✅ Only trade **first hour** (9:30-10:30 AM EST)
- ✅ **Fixed 2:1** take profit every time
- ✅ One strategy, stay consistent
**That's it. No complicated indicators, no higher timeframe bias, no guesswork.**

Bullish Breakaway Dual Session-Publish-Consolidated FVG
Inspired by the FVG Concept:
This indicator is built on the Fair Value Gap (FVG) concept, with a focus on Consolidated FVG. Unlike traditional FVGs, this version only works within a defined session (e.g., ETH 18:00–17:00 or RTH 09:30–16:00).
Bullish consolidated FVG & Bullish breakaway candle
Begins when a new intraday low is printed. After that, the indicator searches for the 1st bullish breakaway candle, which must have its low above the high of the intraday low candle. Any candles in between are part of the consolidated FVG zone. Once the 1st breakaway forms, the indicator will shades the candle’s range (high to low). Then it will use this candle as an anchor to search for the 2nd, 3rd, etc. breakaways until the session ends.
Session Reset: Occurs at session close.
Repaint Behavior:
If a new intraday (or intra-session) low forms, earlier breakaway patterns are wiped, and the system restarts from the new low.
Counter:
A session-based counter at the top of the chart displays how many bullish consolidated FVGs have formed.
Settings
• Session Setup:
Choose ETH, RTH, or custom session. The indicator is designed for CME futures in New York timezone, but can be adjusted for other markets.
If nothing appears on your chart, check if you loaded it during an inactive session (e.g., weekend/Friday night).
• Max Zones to Show:
Default = 3 (recommended). You can increase, but 3 zones are usually most useful.
• Timeframe:
Best on 1m, 5m, or 15m. (If session range is big, try higher time frame)
Usage
1. Avoid Trading in Wrong Direction
• No bullish breakaway = No long trade.
• Prevents the temptation to countertrade in strong downtrends.
2. Catch the Trend Reversal
• When a bullish breakaway appears after an intraday low, it signals a potential reversal.
• You will need adjust position sizing, watch out liquidity hunt, and place stop loss.
• Best entries of your preferred choices: (this is your own trading edge)
Retest
Breakout
Engulf
MA cross over
Whatever your favorite approach
• Reversal signal is the strongest when price stays within/above the breakaway candle’s
range. Weak if it breaks below.
3. Higher Timeframe Confirmation
• 1m can give false reversals if new lows keep forming.
• 5m often provides cleaner signals and avoids premature reversals.
Failed Trade Example:
This indicator will repaint if a new intraday session low is updated. So it is possible to have a failed trade. Here is an example from the same session in 1m chart. However, if you enter the trade later at another bullish breakaway candle signal. The loss can be mitigated by the profit.
Therefore you should use smaller position size for your 1st trade. You should also considering using 5m chart to avoid 1m bull trap. In this example, if you use 5m chart, you can totally avoid this failed trade.
If you enter the trade, you will see the intraday low is stop loss hunted. You can also see the 1st bullish breakaway candle is super weak. There are a lot of candles below the breakaway candle low, so it is very possible to fail.
In the next chart, you can see the failed traded get stop loss hunted. However you can enter another trade with huge profit to win back the loss from the 1st trade if you follow the rule.
Summary
This indicator offers 3 main advantages:
1. Prevents wrong-direction trades.
2. Confirms trend entry after reversal signals.
3. Filters false positives using higher timeframes.
How to sharp your edge:
1. ⏳Extreme patience⏳: Do not guess the bottom during a downtrend before a confirmed bullish breakaway candle. If you get caught, have the courage to cut loss. This is literally the most important usage of this indicator. Again, this is the most important rule of this indicator and actually the hardest rule to follow.
2. 🛎Better Entry🛎: After a confirmed bullish breakaway, you will always have a good opportunity to enter the trade using established trading technique. Your edge will come from the position size, draw down, stop loss placement, risk/reward ratio.
3. ✂Cut loss fast✂: If you enter a trade according to the rule, but you are still not making profit for a period of time, and the price is below the low of the breakaway candle. It is very likely you may hit stop loss soon (intraday session low). It won't be a bad idea to cut loss before stop loss hit.
4. 🔂Reentry with confidence after stop loss🔂: a stop loss will not invalidate the indicator. If you see a second chance to reenter, you should still follow the trade guide and rule.
5. 🕔Time frame matter🕔: try 1m, 3m, 5m, 10m, 15m time frame. Over time, you should know what time frame work best for you and the market. Higher time frame will reduce the noise of false positive trade, but it comes with a higher stop loss placement and less max profit, however it may come with a lower draw down. Time frame will matter depending on the range of the session. If the session range is small (<0.5%), lower time frame is good. If session range is big (>1%), 5m time frame is better. Remember to wait for candle to close, if you use higher time frame.
Last Mention:
The indicator is only used for bullish side trading.

Opening Range BreakoutOpen Range Breakout (ORB) – Trading Strategy Documentation
Definition:
The Open Range Breakout (ORB) is a short-term trading strategy that identifies the price range established during the initial period of market opening (typically the first 15 to 60 minutes) and uses the high and low of that range as key reference levels for potential breakout entries.
Components:
Open Range High: The highest price traded during the defined opening period.
Open Range Low: The lowest price traded during the same period.
Breakout Trigger: A price move above the Open Range High or below the Open Range Low, signaling potential continuation momentum.
How It Works:
Define the Opening Period: Select a time window (e.g., 30 minutes) at market open to establish the initial range.
Identify Range Boundaries: Record the high and low prices during this period.
Monitor for Breakout: Watch for price to break and close above the Open Range High (bullish breakout) or below the Open Range Low (bearish breakout).
Enter Trade: Enter long on a confirmed break above the Open Range High, or short on a break below the Open Range Low. Entry may be triggered on a retest of the broken level or with volume confirmation.
Set Stop-Loss and Target:
Stop-loss: Placed just inside the open range (e.g., below the high for long, above the low for short).
Profit target: Based on volatility (e.g., ATR multiple) or support/resistance levels.
Key Assumptions:
Early price action reflects initial market sentiment.
A breakout from this range indicates strong directional momentum likely to continue.
Best Conditions:
High liquidity markets (e.g., major indices, large-cap stocks).
Volatile or news-driven trading sessions.
Used primarily in intraday trading.
Limitations:
Prone to false breakouts during low-volume or choppy markets.
Requires strict risk management due to reliance on timing and confirmation.
Conclusion:
The ORB strategy capitalizes on early market momentum by trading breakouts from the initial price range. Its effectiveness depends on precise range definition, timely execution, and disciplined risk control.

MACROFLOW 200 — Bias & Triggersstephtradez model
MACROFLOW 200 — at a glance (the elevator pitch)
Trade direction = Macro Bias + 1H 200 EMA filter + DXY confirm.
Locations = 1H supply/demand zones.
Triggers (15m): (T1) Retest rejection, (T2) Liquidity sweep + BOS/CHOCH, (T3) Momentum break + shallow pullback.
Stops: structure‑based beyond zone with ATR buffer.
Targets: 2R base, scale at 1.5R, trail to next HTF zone.
Sessions: 7–10 pm ET and 9:30–10:30 am ET.
Risk: tight, prop‑friendly max 1% per session


Dual Volume Profiles: Session + Rolling (Range Delineation)Dual Volume Profiles: Session + Rolling (Range Delineation)
INTRO
This is a probability-centric take on volume profile. I treat the volume histogram as an empirical PDF over price, updated in real time, which makes multi-modality (multiple acceptance basins) explicit rather than assumed away. The immediate benefit is operational: if we can read the shape of the distribution, we can infer likely reversion levels (POC), acceptance boundaries (VAH/VAL), and low-friction corridors (LVNs).
My working hypothesis is that what traders often label “fat tails” or “power-law behavior” at short horizons is frequently a tail-conditioned view of a higher-level Gaussian regime. In other words, child distributions (shorter periodicities) sit within parent distributions (longer periodicities); when price operates in the parent’s tail, the child regime looks heavy-tailed without being fundamentally non-Gaussian. This is consistent with a hierarchical/mixture view and with the spirit of the central limit theorem—Gaussian structure emerges at aggregate scales, while local scales can look non-Gaussian due to nesting and conditioning.
This indicator operationalizes that view by plotting two nested empirical PDFs: a rolling (local) profile and a session-anchored profile. Their confluence makes ranges explicit and turns “regime” into something you can see. For additional nesting, run multiple instances with different lookbacks. When using the default settings combined with a separate daily VP, you effectively get three nested distributions (local → session → daily) on the chart.
This indicator plots two nested distributions side-by-side:
Rolling (Local) Profile — short-window, prorated histogram that “breathes” with price and maps the immediate auction.
Session Anchored Profile — cumulative distribution since the current session start (Premkt → RTH → AH anchoring), revealing the parent regime.
Use their confluence to identify range floors/ceilings, mean-reversion magnets, and low-volume “air pockets” for fast traverses.
What it shows
POC (dashed): central tendency / “magnet” (highest-volume bin).
VAH & VAL (solid): acceptance boundaries enclosing an exact Value Area % around each profile’s POC.
Volume histograms:
Rolling can auto-color by buy/sell dominance over the lookback (green = buying ≥ selling, red = selling > buying).
Session uses a fixed style (blue by default).
Session anchoring (exchange timezone):
Premarket → anchors at 00:00 (midnight).
RTH → anchors at 09:30.
After-hours → anchors at 16:00.
Session display span:
Session Max Span (bars) = 0 → draw from session start → now (anchored).
> 0 → draw a rolling window N bars back → now, while still measuring all volume since session start.
Why it’s useful
Think in terms of nested probability distributions: the rolling node is your local Gaussian; the session node is its parent.
VA↔VA overlap ≈ strong range boundary.
POC↔POC alignment ≈ reliable mean-reversion target.
LVNs (gaps) ≈ low-friction corridors—expect quick moves to the next node.
Quick start
Add to chart (great on 5–10s, 15–60s, 1–5m).
Start with: bins = 240, vaPct = 0.68, barsBack = 60.
Watch for:
First test & rejection at overlapping VALs/VAHs → fade back toward POC.
Acceptance beyond VA (several closes + growing outer-bin mass) → traverse to the next node.
Inputs (detailed)
General
Lookback Bars (Rolling)
Count of most-recent bars for the rolling/local histogram. Larger = smoother node that shifts slower; smaller = more reactive, “breathing” profile.
• Typical: 40–80 on 5–10s charts; 60–120 on 1–5m.
• If you increase this but keep Number of Bins fixed, each bin aggregates more volume (coarser bins).
Number of Bins
Vertical resolution (price buckets) for both rolling and session histograms. Higher = finer detail and crisper LVNs, but more line objects (closer to platform limits).
• Typical: 120–240 on 5–10s; 80–160 on 1–5m.
• If you hit performance or object limits, reduce this first.
Value Area %
Exact central coverage for VAH/VAL around POC. Computed empirically from the histogram (no Gaussian assumption): the algorithm expands from POC outward until the chosen % is enclosed.
• Common: 0.68 (≈“1σ-like”), 0.70 for slightly wider core.
• Smaller = tighter VA (more breakout flags). Larger = wider VA (more reversion bias).
Max Local Profile Width (px)
Horizontal length (in pixels) of the rolling bars/lines and its VA/POC overlays. Visual only (does not affect calculations).
Session Settings
RTH Start/End (exchange tz)
Defines the current session anchor (Premkt=00:00, RTH=your start, AH=your end). The session histogram always measures from the most recent session start and resets at each boundary.
Session Max Span (bars, 0 = full session)
Display window for session drawings (POC/VA/Histogram).
• 0 → draw from session start → now (anchored).
• > 0 → draw N bars back → now (rolling look), while still measuring all volume since session start.
This keeps the “parent” distribution measurable while letting the display track current action.
Local (Rolling) — Visibility
Show Local Profile Bars / POC / VAH & VAL
Toggle each overlay independently. If you approach object limits, disable bars first (POC/VA lines are lighter).
Local (Rolling) — Colors & Widths
Color by Buy/Sell Dominance
Fast uptick/downtick proxy over the rolling window (close vs open):
• Buying ≥ Selling → Bullish Color (default lime).
• Selling > Buying → Bearish Color (default red).
This color drives local bars, local POC, and local VA lines.
• Disable to use fixed Bars Color / POC Color / VA Lines Color.
Bars Transparency (0–100) — alpha for the local histogram (higher = lighter).
Bars Line Width (thickness) — draw thin-line profiles or chunky blocks.
POC Line Width / VA Lines Width — overlay thickness. POC is dashed, VAH/VAL solid by design.
Session — Visibility
Show Session Profile Bars / POC / VAH & VAL
Independent toggles for the session layer.
Session — Colors & Widths
Bars/POC/VA Colors & Line Widths
Fixed palette by design (default blue). These do not change with buy/sell dominance.
• Use transparency and width to make the parent profile prominent or subtle.
• Prefer minimal? Hide session bars; keep only session VA/POC.
Reading the signals (detailed playbook)
Core definitions
POC — highest-volume bin (fair price “magnet”).
VAH/VAL — upper/lower bounds enclosing your Value Area % around POC.
Node — contiguous block of high-volume bins (acceptance).
LVN — low-volume gap between nodes (low friction path).
Rejection vs Acceptance (practical rule)
Rejection at VA edge: 0–1 closes beyond VA and no persistent growth in outer bins.
Acceptance beyond VA: ≥3 closes beyond VA and outer-bin mass grows (e.g., added volume beyond the VA edge ≥ 5–10% of node volume over the last N bars). Treat acceptance as regime change.
Confluence scores (make boundary/target quality objective)
VA overlap strength (range boundary):
C_VA = 1 − |VA_edge_local − VA_edge_session| / ATR(n)
Values near 1.0 = tight overlap (stronger boundary).
Use: if C_VA ≥ 0.6–0.8, treat as high-quality fade zone.
POC alignment (magnet quality):
C_POC = 1 − |POC_local − POC_session| / ATR(n)
Higher C_POC = greater chance a rotation completes to that fair price.
(You can estimate these by eye.)
Setups
1) Range Fade at VA Confluence (mean reversion)
Context: Local VAL/VAH near Session VAL/VAH (tight overlap), clear node, local color not screaming trend (or flips to your side).
Entry: First test & rejection at the overlapped band (wick through ok; prefer close back inside).
Stop: A tick/pip beyond the wider of the two VA edges or beyond the nearest LVN, a small buffer zone can be used to judge whether price is truly rejecting a VAL/VAH or simply probing.
Targets: T1 node mid; T2 POC (size up when C_POC is high).
Flip: If acceptance (rule above) prints, flip bias or stand down.
2) LVN Traverse (continuation)
Context: Price exits VA and enters an LVN with acceptance and growing outer-bin volume.
Entry: Aggressive—first close into LVN; Conservative—retest of the VA edge from the far side (“kiss goodbye”).
Stop: Back inside the prior VA.
Targets: Next node’s VA edge or POC (edge = faster exits; POC = fuller rotations).
Note: Flatter VA edge (shallower curvature) tends to breach more easily.
3) POC→POC Magnet Trade (rotation completion)
Context: Local POC ≈ Session POC (high C_POC).
Entry: Fade a VA touch or pullback inside node, aiming toward the shared POC.
Stop: Past the opposite VA edge or LVN beyond.
Target: The shared POC; optional runner to opposite VA if the node is broad and time-of-day is supportive.
4) Failed Break (Reversion Snap-back)
Context: Push beyond VA fails acceptance (re-enters VA, outer-bin growth stalls/shrinks).
Entry: On the re-entry close, back toward POC.
Stop/Target: Stop just beyond the failed VA; target POC, then opposite VA if momentum persists.
How to read color & shape
Local color = most recent sentiment:
Green = buying ≥ selling; Red = selling > buying (over the rolling window). Treat as context, not a standalone signal. A green local node under a blue session VAH can still be a fade if the parent says “over-valued.”
Shape tells friction:
Fat nodes → rotation-friendly (fade edges).
Sharp LVN gaps → traversal-friendly (momentum continuation).
Time-of-day intuition
Right after session anchor (e.g., RTH 09:30): Session profile is young and moves quickly—treat confluence cautiously.
Mid-session: Cleanest behavior for rotations.
Close / news: Expect more traverses and POC migrations; tighten risk or switch playbooks.
Risk & execution guidance
Use tight, mechanical stops at/just beyond VA or LVN. If you need wide stops to survive noise, your entry is late or the node is unstable.
On micro-timeframes, account for fees & slippage—aim for targets paying ≥2–3× average cost.
If acceptance prints, don’t fight it—flip, reduce size, or stand aside.
Suggested presets
Scalp (5–10s): bins 120–240, barsBack 40–80, vaPct 0.68–0.70, local bars thin (small bar width).
Intraday (1–5m): bins 80–160, barsBack 60–120, vaPct 0.68–0.75, session bars more visible for parent context.
Performance & limits
Reuses line objects to stay under TradingView’s max_lines_count.
Very large bins × multiple overlays can still hit limits—use visibility toggles (hide bars first).
Session drawings use time-based coordinates to avoid “bar index too far” errors.
Known nuances
Rolling buy/sell dominance uses a simple uptick/downtick proxy (close vs open). It’s fast and practical, but it’s not a full tape classifier.
VA boundaries are computed from the empirical histogram—no Gaussian assumption.
This script does not calculate the full daily volume profile. Several other tools already provide that, including TradingView’s built-in Volume Profile indicators. Instead, this indicator focuses on pairing a rolling, short-term volume distribution with a session-wide distribution to make ranges more explicit. It is designed to supplement your use of standard or periodic volume profiles, not replace them. Think of it as a magnifying lens that helps you see where local structure aligns with the broader session.
How to trade it (TL;DR)
Fade overlapping VA bands on first rejection → target POC.
Continue through LVN on acceptance beyond VA → target next node’s VA/POC.
Respect acceptance: ≥3 closes beyond VA + growing outer-bin volume = regime change.
FAQ
Q: Why 68% Value Area?
A: It mirrors the “~1σ” idea, but we compute it exactly from empirical volume, not by assuming a normal distribution.
Q: Why are my profiles thin lines?
A: Increase Bars Line Width for chunkier blocks; reduce for fine, thin-line profiles.
Q: Session bars don’t reach session start—why?
A: Set Session Max Span (bars) = 0 for full anchoring; any positive value draws a rolling window while still measuring from session start.
Changelog (v1.0)
Dual profiles: Rolling + Session with independent POC/VA lines.
Session anchoring (Premkt/RTH/AH) with optional rolling display span.
Dynamic coloring for the rolling profile (buying vs selling).
Fully modular toggles + per-feature colors/widths.
Thin-line rendering via bar line width.

CP Strat ORBnew york opening range breakout and retest allows you to enter a trade with a better clarity if the price comes back and retest the range

Volume Based Analysis V 1.00
Volume Based Analysis V1.00 – Multi-Scenario Buyer/Seller Power & Volume Pressure Indicator
Description:
1. Overview
The Volume Based Analysis V1.00 indicator is a comprehensive tool for analyzing market dynamics using Buyer Power, Seller Power, and Volume Pressure scenarios. It detects 12 configurable scenarios combining volume-based calculations with price action to highlight potential bullish or bearish conditions.
When used in conjunction with other technical tools such as Ichimoku, Bollinger Bands, and trendline analysis, traders can gain a deeper and more reliable understanding of the market context surrounding each signal.
2. Key Features
12 Configurable Scenarios covering Buyer/Seller Power convergence, divergence, and dominance
Advanced Volume Pressure Analysis detecting when both buy/sell volumes exceed averages
Global Lookback System ensuring consistency across all calculations
Dominance Peak Module for identifying strongest buyer/seller dominance at structural pivots
Real-time Signal Statistics Table showing bullish/bearish counts and volume metrics
Fully customizable inputs (SMA lengths, multipliers, timeframes)
Visual chart markers (S01 to S12) for clear on-chart identification
3. Usage Guide
Enable/Disable Scenarios: Choose which signals to display based on your trading strategy
Fine-tune Parameters: Adjust SMA lengths, multipliers, and lookback periods to fit your market and timeframe
Timeframe Control: Use custom lower timeframes for refined up/down volume calculations
Combine with Other Indicators:
Ichimoku: Confirm volume-based bullish signals with cloud breakouts or trend confirmation
Bollinger Bands: Validate divergence/convergence signals with overbought/oversold zones
Trendlines: Spot high-probability signals at breakout or retest points
Signal Tables & Peaks: Read buy/sell volume dominance at a glance, and activate the Dominance Peak Module to highlight key turning points.
4. Example Scenarios & Suggested Images
Image #1 – S01 Bullish Convergence Above Zero
S01 activated, Buyer Power > 0, both buyer power slope & price slope positive, above-average buy volume. Show S01 ↑ marker below bar.
Image #2 – Combined with Ichimoku
Display a bullish scenario where price breaks above Ichimoku cloud while S01 or S09 bullish signal is active. Highlight both the volume-based marker and Ichimoku cloud breakout.
Image #3 – Combined with Bollinger Bands & Trendlines
Show a bearish S10 signal at the upper Bollinger Band near a descending trendline resistance. Highlight the confluence of the volume pressure signal with the band touch and trendline rejection.
Image #4 – Dominance Peak Module
Pivot low with green ▲ Bull Peak and pivot high with red ▼ Bear Peak, showing strong dominance counts.
Image #5 – Statistics Table in Action
Bottom-left table showing buy/sell volume, averages, and bullish/bearish counts during an active market phase.
5. Feedback & Collaboration
Your feedback and suggestions are welcome — they help improve and refine this system. If you discover interesting use cases or have ideas for new features, please share them in the script’s comments section on TradingView.
6. Disclaimer
This script is for educational purposes only. It is not financial advice. Past performance does not guarantee future results. Always do your own analysis before making trading decisions.
Tip: Use this tool alongside trend confirmation indicators for the most robust signal interpretation.

Market Energy – Trend vs RetestShows who is in control of the market. The red lines are sellers in control and the green are the buyers in control
Dual Session ORB S/R Lines Pro by Yendor_BShort description:
Clean opening-range breakout support/resistance lines for London and US sessions with confirmed breakout labels and alert-ready signals. UTC-based, adjustable start point, customizable styling, minimal clutter.
Detailed description:
What it does:
Captures the Opening Range (default first 15 minutes) for London and New York (US) sessions in UTC, plots the high and low as support/resistance lines, and marks confirmed breakouts when price closes beyond those levels. Lines can begin at either the range end or session start and persist for the configured session length.
Key Features:
ORB defined over the first N minutes after session open (configurable, default 15).
Two sessions: London and US (New York) with separate start times.
High/low support & resistance lines per session:
Selectable start point: Range End or Session Start.
Independently customizable color, width, and style (solid/dashed/dotted) for each high and low.
Confirmed breakout labels: only on the first candle that closes beyond the ORB high or low after the range completes (prior close must be inside).
Alerts and alertconditions for breakout long/short per session, usable in TradingView’s alert dialog.
Fully UTC-based. Works on any timeframe; 1-minute or 5-minute recommended for precision.
Minimal visual clutter; no persistent shaded boxes in this version.
Inputs explained:
ORB Duration (minutes): Length of the opening range used to calculate session high and low.
Session Length (hours): How long the S/R lines remain active (typically full session).
London / US Start (UTC): Session open times in UTC.
Line Start Point: Choose whether the lines begin at the range end or at the session start.
High/Low Styling: Independent color, thickness, and style for each session’s high and low.
Breakout Labels: Toggle one-time confirmed breakout annotations.
Alerts: Enable breakout alert messages.
Example workflows:
Monitor the first 15 minutes of the London session.
After the range, wait for a candle to close beyond the high or low for a confirmed breakout.
Use the label or alert to trigger entry logic (retest, continuation, etc.).
Repeat for the US session; compare overlaps for higher conviction.
Alert setup:
Open the Alerts panel. Choose one of the built-in alertconditions: London Breakout Long, London Breakout Short, US Breakout Long, US Breakout Short. Set frequency to Once Per Bar Close. Customize notification/webhook payload if automating.
Preset suggestions:
Standard London ORB: 15 minute range, lines from range end, green high / lime low.
Standard US ORB: 15 minute range, lines from range end, blue high / aqua low.
Overlap Bias: Both sessions active, lines start from session start, differentiated styles.
Tips & best practices:
Combine with external volume or volatility filters to reduce false breakouts. Use on correlated pairs to observe consistent session structure. Treat broken ORB levels as flipped support/resistance on revisit. Prefer confirmed closes beyond lines rather than wick touches.
Limitations / disclaimer:
Provides structural visualization and breakout signaling; does not guarantee profitability. Always apply proper risk management and confirm with additional context. Backtest settings before live use.
Tags:
#ORB #OpeningRangeBreakout #SessionTrading #LondonSession #NewYorkSession #SupportResistance #Breakout #Intraday #Pinev6 #TradingView #Forex #TrendStructure #Alerts #USD #EURUSD #TradingSignals #UTCBased #PriceAction #MarketStructure #IntradayBreakouts

Fractal Support and Resistance [BigBeluga]🔵 OVERVIEW
The Fractal Support and Resistance indicator automatically identifies high-probability support and resistance zones based on repeated fractal touches. When a defined number of fractal highs or lows cluster around the same price zone, the indicator plots a clean horizontal level and shaded zone, helping traders visualize structurally important areas where price may react.
🔵 CONCEPTS
Fractal Points: Swing highs and lows based on user-defined left and right range (length). A valid fractal forms only when the center candle is higher or lower than its neighbors.
Zone Validation: A level is only confirmed when the price has printed the specified number of fractals (e.g., 3) within a narrow ATR-defined range.
Dynamic Zone Calculation: The plotted level can be based on the average of clustered fractals or on the extreme value (min or max), depending on the user’s choice.
Support/Resistance Zones: Once a zone is validated, a horizontal line and shaded box are drawn and automatically extended into the future until new valid clusters form.
Auto-Clean & Reactivity: Each zone persists until replaced by a new fractal cluster, ensuring the chart remains uncluttered and adaptive.
🔵 FEATURES
Detects swing fractals using adjustable left/right range.
Confirms zones when a defined number of fractals occur near the same price.
Plots horizontal level and shaded box for visual clarity.
Choice between average or min/max logic for level calculation.
Distinct color inputs for support (green) and resistance (orange) zones.
Adaptive auto-extension keeps valid zones projected into the future.
Displays optional triangle markers above/below bars where fractals form.
Clean design optimized for structural S/R analysis.
🔵 HOW TO USE
Use support zones (from low fractals) to look for potential long entries or bounce points .
Use resistance zones (from high fractals) to look for short setups or rejections .
Adjust the Fractals Qty to make zones more or less strict—e.g., 3 for higher reliability, 2 for quicker responsiveness.
Combine with liquidity indicators or break/retest logic to validate zone strength.
Toggle between average and min/max mode to fit your style (average for balance, extremes for aggression).
🔵 CONCLUSION
Fractal Support and Resistance offers a robust way to identify hidden levels that the market respects repeatedly. By requiring multiple fractal confirmations within a zone, it filters out noise and highlights clean structural areas of interest. This tool is ideal for traders who want automatic, adaptive, and reliable S/R levels grounded in raw market structure.

S&R Zones MTF (TechnoBlooms)S&R Zones MTF – Multi-Timeframe Support & Resistance Boxes
🔍 Overview
S&R Zones MTF is a professional-grade yet beginner-friendly indicator that dynamically plots Support & Resistance zones across multiple timeframes, helping traders recognize high-probability reversal areas, entry confirmations, and price reaction points.
This tool visualizes structured zones as colored boxes, allowing both new and experienced traders to analyze multi-timeframe confluence with ease and clarity.
🧠 What Is This Indicator?
S&R Zones MTF automatically detects the most significant support and resistance levels from up to four custom timeframes, using a configurable lookback period. These zones are displayed as colored horizontal boxes directly on the chart, making it easy to:
Spot where price has historically reacted
Identify potential reversal or breakout zones
Confirm entries with institutional-style precision
🛠️ Key Features
✅ Multi-Timeframe Zone Detection (up to 4 timeframes)
📦 Auto Plotted Boxes for Support (Blue) & Resistance (Pink)
🧱 Dynamic Height based on average price range or fixed input
🏷️ Timeframe Labels to instantly identify zone origin
🎛️ Customizable inputs: Lookback length, box color, height style
🔁 Real-time updates as price structure changes
🎓 Educational & Easy to Use
Whether you’re a new trader learning about price structure, or a professional applying institutional concepts, this tool offers an educational layout to understand:
How price respects historic zones
Why multi-timeframe zones offer stronger confluence
How to use zones for entry, exit, or risk placement
📈 How to Use (Multi-Timeframe Strategy)
Select Your Timeframes – Customize up to 4 higher timeframes (e.g., 1m, 5m, 15m, 1h).
Observe Overlapping Zones – When multiple timeframes agree, those zones are more significant.
Entry Confirmation – Wait for price to reach a zone, then look for reversal patterns (engulfing candle, pin bar, etc.)
Combine with Other Tools – Use alongside indicators like RSI, MACD, or Order Blocks for added confidence.
💡 Pro Tips
Zones from higher timeframes (1H, 4H) are often more powerful and reliable.
Confluence matters: If a 15m support zone aligns with a 1H support zone — that's a high-probability reaction area.
Use break-and-retest strategies with zone rejections for sniper entries.
Enable "Auto Height" for a more adaptive, volatility-based zone display.
🌟 Summary
S&R Zones MTF blends precision, clarity, and professional analysis into a visual structure that’s easy to understand. Whether you're learning support & resistance or optimizing your MTF edge — this tool will bring clarity to your charts and confidence to your trades.
