Broadview Algorithmic StudioWelcome! This is the writeup for the Broadview Algorithmic Studio.
There are many unique features in this script.
- Broadview Underpriced & Overpriced
- Broadview Blackout Bollinger Bands
- Trailing Take Profit Suite
- Algorithmic Weights
- VSA Score
- Pip Change Log
- Activation Panel
- Weight Scanner
There are 116 primary inputs that allow users to algorithmically output unique DCA signal-sets. There are 85 inputs that allow users to control individual lengths, levels, thresholds, and multiplicative weights of the script. You will not find any other script with this many inputs, properly strung together for you to produce unlimited strategies for any market. The entire premise for the Broadview Algorithmic Studio is for users to be able to have extensive-cutting-edge features that allow them to produce more strategies, having control over every element that outputs a signal set. The number of unique strategies you can output with this script is VAST, and each continues to follow a safe DCA methodology.
This script is ready for use with 3Commas, interactive brokers, and other means of automation. It provides detailed information on Base Orders and Safety Orders, giving the number, cumulative spending, position average, and remaining balance for each SO in the series. Using this script we will explore the depths of strategic volume scaling, and the algorithms we use to determine spending.
Let me first start by saying the number of safe DCA-friendly signal-sets this script can output is absolutely staggering.
Let's limit the scope just to the Broadview Underpriced & Overpriced and Broadview Dominance indicators.
Each band of the Dominance Suite can be controlled individually with unique lengths, levels, and weights. This means the Dominance Suite can establish Bearish or Bullish dominance, in any market condition, and give it a unique overloading weight. The Broadview Underpriced & Overpriced indicator finally gives us the ability to establish these "market conditions" first with cycles. Of all the cycles this indicator establishes, the two primary are Underpriced & Overpriced. We determine this using a composite Overbought & Oversold with an Exponential Moving Average. So the script can now know, what cycle it is in, who is dominant during that cycle, and exactly how much weight in volume scaling the order should have.
Brand new is the ability for indicators of this level to be able to talk together in a single script. The Broadview Underpriced & Overpriced indicator and the Broadview Dominance indicator can inform one another across multiple vectors, create a unique market snapshot, and give that snapshot a unique weight every bar. The unique weight is compiled in the volume scaling math, thus giving us an automated-strategic-safe and quite efficient volume scaling for every order. In our coming updates we will explore this synergy to its very deepest layers. These indicators can be laced together in many ways, called vectors.
Only in the Algorithmic Studio do we explore these depths and yield those findings, features, and inputs to the user.
Let me take a quick break to explain another area-of-opportunity for our research and development.
The VSA Score is something we've tried before, but until the creation of the Broadview Blackout Bollinger Bands Auto Indicator it was not possible. The concept we want to explore is "Positional Honing". Over time we want users and the script itself to be able to understand the difference between a script-config that produces a high number of Hits, from a configuration that produces a high number of "Misses". The Volume Scaling Accuracy Score uses the BBB Auto Indicator as a heavily reliable, non-repainting, method of determining what the very-best signals for increased volume-scaling are.
Increased volume scaling is denoted by the near-white highlighter line running vertically. This line will either fall inside the BBB Auto Indicator bands (which are hidden), or, they will fall below and outside the BBB Auto bands. If increased spending happens inside the bands it's a "Miss". If increased spending happens below and outside the bands, it's a Hit. Oftentimes misses are actually pretty good spots for extra spending, which helps lower your position average, but Hits are always better. The Hits that the BBB Auto Indicator provides are extremely good.
Let's talk about the Trailing Take Profit Suite. This suite allows us to set a trailing take profit which is a feature that lets one maximize their profits. If the trailing take profit is engaged, then when the regular take profit is hit, it will trigger, denoted in red vertical lines, and the trailing take profit will look for a specified rate of change before it actually takes profit. This usually helps traders in those times when their regular take profit was set too low, allowing them to maximize their profits with a Trailing Take Profit.
For the moment, let's think about our scores. In the dashboard you'll notice a score beginning the Pip Change Log, the VSA Score, and the Activation Panel.
These scores use a new kind of logistic correlation formula where 4 digits are given to activation, rather than 1. This is to allow room for a future concept in AI we call "Deadzones" or you can think of it as impedance. This is not a bias in logistic regression. It's an entirely different concept. A neuron, which a perceptron attempts to mimic, has a bias.. but it also has a sort of electrical resistance. This is because a neuron is individually-alive entity. So a perceptron, as it were, would need to have both a bias and a natural resistance, or deadzone.
It is a lot of fun to watch the scores and how they react during playback. They tend to smooth trends but are also quite quick to correct to accuracy. In the future we will add the deadzones and biases to the scores. This should help both users and the script produce better signal sets. The Pip Change Log is an indicator that measures Rate of Change in Pips. This is one that I am particularly excited to study, as I am a huge fan of ROC. The Activation Panel shows these scores for 4 primary indicators: On Balance Volume, Relative Strength Index, Average Directional Index, and Average True Range.
Having the Pip Change Log, VSA Score, and Activation Panel up on the dashboard with their logistic correlation scores allows traders to study markets and setups quite intimately. The weight scanner at the bottom allows users to track the cumulative applied multiplicative weights during playback. The massive number of inputs, connected vectors of indicators, input-weights, lengths, levels, and thresholds sets up all the algorithmic infrastructure for powerusers to explore every idea and strategy output they could imagine. Also with the connected vector infrastructure we can deepen our indicators in a way where, "How they talk to each other.", comes first in every development conversation.
The Algorithmic Studio is for the Power-user.
These are not basic equations coming together to determine spending. This is a massive multi-layered-perceptron with everything from Trailing-Take-Profits to strategic-automatic algorithmic downscaling. The Broadview Algorithmic Studio gives a home to the poweruser who wants access to everything in a trading and investing AI, right up until the backpropagation. The Broadview Algorithmic Studio, gives users the ability to sit in the chair of the would-be AI.
Thank you.
Cari skrip untuk "range"


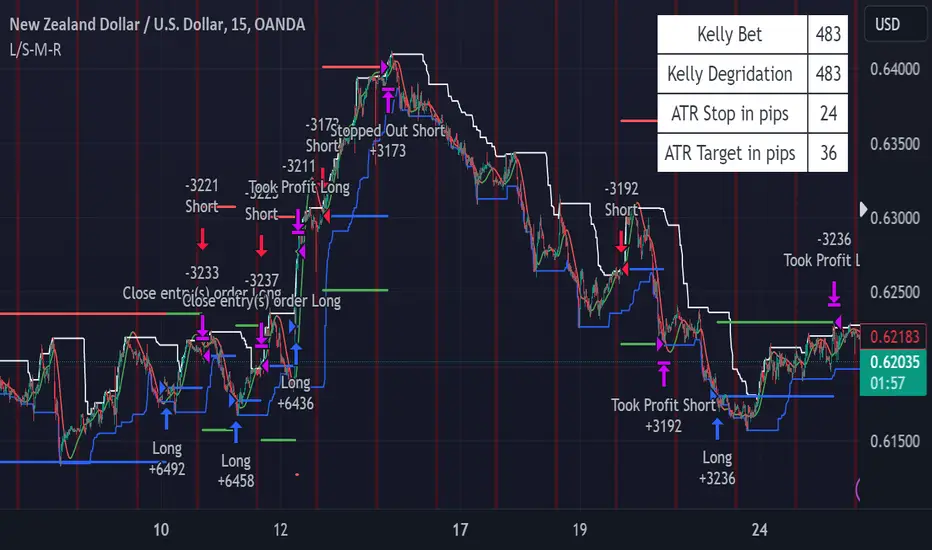
PRICE CHANNEL MEAN REVERSIONThis script is a Fully Automated trading script meant to be used with "Oanda" broker and the plug-ins for algorithmic trading automation.( FOREX ONLY)
This script is meant to capture "MEAN REVERSION " for intraday charts (1hour) preferably and will hold for days / weeks .trading on forex markets.
(The combination of indicators includes a high and low price channel along with a fast moving average)
This script is original in the description of Alan Hulls moving average combined with the high and low closing of price action.
The concept of this mean reversion strategy is to try and capture price exhaustive moves . The moving average is fast and most times remains in the channel. when the moving average overshoots the channel the average price of the instrument is thought to be rising or falling faster then average, indicating a possibility that the instrument may revert (pull back) this strategy aims to capture that pull back.
This strategy uses a higher risk than reward profile to jump in front of market moves (4 risk to 1 reward)
in the likelihood the instrument will revert back (example) 25 pips before it continues 100 pips in the current direction.
This strategy should only be used in markets that you believe are mean reverting at the time of trading otherwise you will be jumping Infront of a possible trend and the price can continue in the trending direction for an unknown specified amount of time.
This script uses a (user defined period) fast moving average ( green/red color) and (user defined period) price channel (White/Blue) chosen in the indicator settings menu.
The default parameters are 55 with a (minimum of 1 and maximum of 10000) for the moving average and 50 with a (minimum of 1 and maximum of 10000) for the price channel , the default parameters = roughly 2 days of price action on the (1 hour) chart.
"The default parameters should be kept unless you fully understand the complete strategy"
the upper band (white line) is the highest close of the specified period and the lower band (blue line) is the lowest close of the same period.
When the fast moving average over shoots the price channel (exits) then crosses back into the price channel (enters) it will trigger a long or short trade.
The long signal is given when the the moving average crosses below the low band then crosses back above the low band . The trade long trade will be entered and the trade will exit if the stop loss or profit targets are hit or if the short signal is given the trade will close then reverse.
The short trade will be entered if the fast moving average crosses above the upper band (white line) then crosses back down through the upper band (white line) The trade short trade will be entered and the trade will exit if the stop loss or profit targets are hit or if the long signal is given the trade will close then reverse.
When the trade is entered a red , a blue and green horizontal dotted line will appear on the chart.
the blue line is the strategy entry price , the red line is the stop loss price , and the green line is the take profit price . the colors will invert if the trade is long or short.
(Setting alerts should be done in the indicator settings menu, and the parameters you chose will determine the stop loss/target and the amount of "units = (position size)" you wish to trade for the (forex only) markets. using "alert() function calls only" is the only alert that should be used with this strategy.
(note : when "alert() function calls only" is set two messages will be sent, one closing any open position in the opposite direction and one placing the new order regardless if you are currently in a trade or not)
Trade targets , stoploss and trade position size are a user defined variables entered in the indicator settings menu. (target pips minimum 0 and a maximum of 1000)(stop pips minimum of 0 and maximum of 1000)
Back test date range is included in the script for back testing different data periods.
the back ground will be colored a transparent navy blue if the period you are looking trading is with in the date range( note: to place live trades the end date will need to be in the future)
this is also adjustable in the settings menu
The avoid spread filter is a user defined time in which the spread is typically higher than average, applying this filter avoids trades in the specified time. When this filter is applied there will be a transparent red back ground color in the specified time.
Back test default setting are equivocal to OANDA:NZDUSD
at the time of this publication placing trades with the "Oanda" broker are as follows , NZD units = 3250 equal 2000 USD position size . "Oanda" current leverage is 33.3 to 1 for this particular pair and commission is paid in spread (1.7) pips = 0.55 USD per trade , Margin required for the trade is 60.50 USD , Position sizing = 6.5% of a 1000 USD account. OANDA:NZDUSD
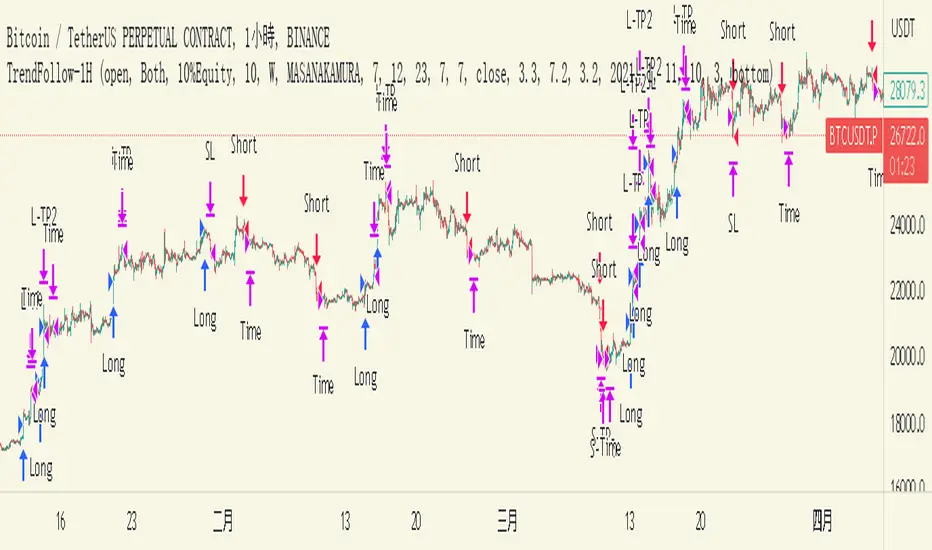
TrendFollow-1HThis is a trading strategy specially used on btcusdtperp in binance 1H chart
The most important part of this strategy is to use Support and Resistance with trading volume
Auxiliary indicators are include Directional Movement Index, trading volume, Commodity Channel Index,volume-weighted average price,Range Filter
Why is it not applicable to other trading varieties or exchanges?
Because the activity of each trading target is different from the trading volume, this strategy is very focused on the change of trading volume, so it may not be applicable to every trading variety
The idea of this strategy is to chase when the trend in the market is clear
Determine whether to break support or resistance to identify trends
But the market is full of false breakouts
Therefore, trading volume is an important indicator for judging the true and false.
Therefore, when the price breaks through support or resistance, accompanied by a huge trading volume, and forms a resonance with auxiliary indicators, the strategy will follow the trend, a time stop loss is also set. After entering the market, if there is no immediate profit to the stop profit, you will leave the market first.
But the market is always random, so the profit and loss ratio must be taken into account
Use a fixed stop loss space in exchange for a larger profit space, and ensure that the expected value is positive to make stable profits in the market
Therefore, this strategy uses 3.2% stop loss, 3.3% Take profit1 and 7.2% take profit2
About 1.5:1 profit and loss ratio to ensure positive expected value
Because the market has a clear trend only about 10% of the time
So the trading frequency of this strategy is very low
According to the backtest of up to 2021-01-01 till now , it takes about 5 days to make a transaction
User can choose their own leverage to obtain higher returns. But be sure to prioritize risk.
In order to prevent you from using this strategy without knowing it, the trading date of this strategy is only executed until the release date, and positions will not be opened and closed for subsequent markets.
You can contact me if you want to know more about this strategy
這是專門用於幣安1H圖表中btcusdtperp的交易策略
本策略最重要的部分是將支撐和阻力與交易量一起使用
輔助指標包括ADX,成交量,CCI,VWAP,Range Filter等
為什麼不適用於其他交易品種或交易所?
由於每個交易標的的活躍度與交易量不同,本策略非常注重交易量的變化,因此不一定適用於每個交易品種
這個策略的方法是在趨勢明朗的時候進行趨勢跟隨
確定是否打破支撐或阻力以識別趨勢
但市場充滿假突破
因此,成交量是判斷真假的重要指標。
當價格突破支撐位或阻力位,伴隨著巨大的成交量,並與輔助指標形成共振時,策略會順勢而為,同時設置時間止損。進場後,如果沒有立即獲利到止盈,就離場。
但市場總是隨機的,所以必須考慮盈虧比
用固定的止損空間換取更大的盈利空間,保證預期值為正,才能在市場中穩定獲利
因此,該策略使用 3.2% 止損、3.3% 止盈1 和 7.2% 止盈2
約1.5:1盈虧比,確保正期望值
因為市場只有大約 10% 的時間有明顯的趨勢
所以這個策略的交易頻率很低
根據2021-01-01至今的回測,交易頻率大約5天一次
用戶也可以選擇適合自己的槓桿以獲得更高的收益。但一定要優先考慮風險。
為防止您在不知情的情況下使用本策略,本策略的運行交易的日期僅至2023-05-30止,後續日期將不開倉和平倉。
如果您想了解更多有關此策略的信息,可以聯繫我。
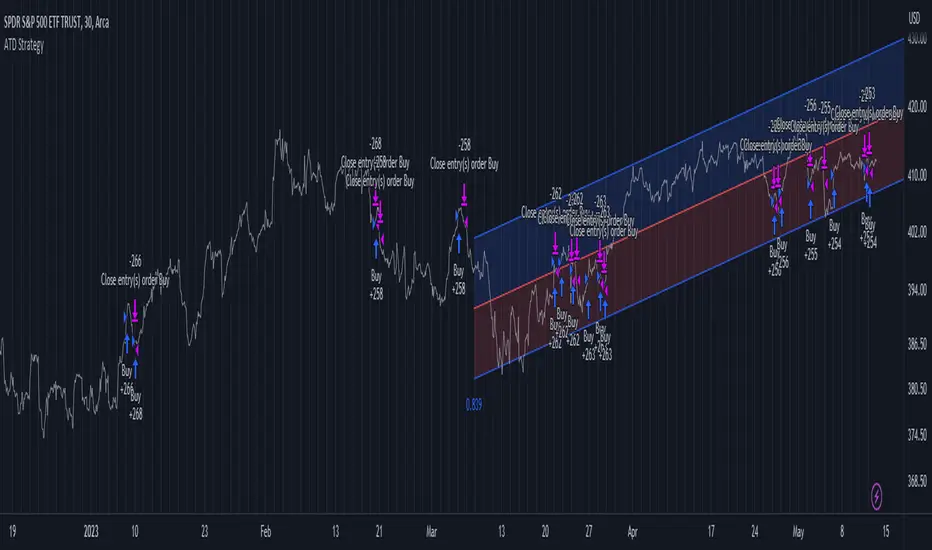
Advanced Trend Detection StrategyThe Advanced Trend Detection Strategy is a sophisticated trading algorithm based on the indicator "Percent Levels From Previous Close".
This strategy is based on calculating the Pearson's correlation coefficient of logarithmic-scale linear regression channels across a range of lengths from 50 to 1000. It then selects the highest value to determine the length for the channel used in the strategy, as well as for the computation of the Simple Moving Average (SMA) that is incorporated into the strategy.
In this methodology, a script is applied to an equity in which multiple length inputs are taken into consideration. For each of these lengths, the slope, average, and intercept are calculated using logarithmic values. Deviation, the Pearson's correlation coefficient, and upper and lower deviations are also computed for each length.
The strategy then selects the length with the highest Pearson's correlation coefficient. This selected length is used in the channel of the strategy and also for the calculation of the SMA. The chosen length is ultimately the one that best fits the logarithmic regression line, as indicated by the highest Pearson's correlation coefficient.
In short, this strategy leverages the power of Pearson's correlation coefficient in a logarithmic scale linear regression framework to identify optimal trend channels across a broad range of lengths, assisting traders in making more informed decisions.
Chandelier Exit ZLSMA StrategyIntroducing a Powerful Trading Indicator: Chandelier Exit with ZLSMA
If you're a trader, you know the importance of having the right tools and indicators to make informed decisions. That's why we're excited to introduce a powerful new trading indicator that combines the Chandelier Exit and ZLSMA: two widely-used and effective indicators for technical analysis.
The Chandelier Exit (CE) is a popular trailing stop-loss indicator developed by Chuck LeBeau. It's designed to follow the price trend of a security and provide an exit signal when the price crosses below the CE line. The CE line is based on the Average True Range (ATR), which is a measure of volatility. This means that the CE line adjusts to the volatility of the security, making it a reliable indicator for trailing stop-losses.
The ZLEMA (Zero Lag Exponential Moving Average) is a type of exponential moving average that's designed to reduce lag and improve signal accuracy. The ZLSMA takes into account not only the current price but also past prices, using a weighted formula to calculate the moving average. This makes it a smoother indicator than traditional moving averages, and less prone to giving false signals.
When combined, the CE and ZLSMA create a powerful indicator that can help traders identify trend changes and make more informed trading decisions. The CE provides the trailing stop-loss signal, while the ZLSMA provides a smoother trend line to help identify potential entry and exit points.
In our indicator, the CE and ZLSMA are plotted together on the chart, making it easy to see both the trailing stop-loss and the trend line at the same time. The CE line is displayed as a dotted line, while the ZLSMA line is displayed as a solid line.
Using this indicator, traders can set their stop-loss levels based on the CE line, while also using the ZLSMA line to identify potential entry and exit points. The combination of these two indicators can help traders reduce their risk and improve their trading performance.
In conclusion, the Chandelier Exit with ZLSMA is a powerful trading indicator that combines two effective technical analysis tools. By using this indicator, traders can identify trend changes, set stop-loss levels, and make more informed trading decisions. Try it out for yourself and see how it can improve your trading performance.
Warning: The results in the backtest are from a repainting strategy. Don't take them seriously. You need to do a dry live test in order to test it for its useability.
-
Here is a description of each input field in the provided source code:
length: An integer input used as the period for the ATR (Average True Range) calculation. Default value is 1.
mult: A float input used as a multiplier for the ATR value. Default value is 2.
showLabels: A boolean input that determines whether to display buy/sell labels on the chart. Default value is false.
isSignalLabelEnabled: A boolean input that determines whether to display signal labels on the chart. Default value is true.
useClose: A boolean input that determines whether to use the close price for extrema calculations. Default value is true.
zcolorchange: A boolean input that determines whether to enable rising/decreasing highlighting for the ZLSMA (Zero-Lag Exponential Moving Average) line. Default value is false.
zlsmaLength: An integer input used as the length for the ZLSMA calculation. Default value is 50.
offset: An integer input used as an offset for the ZLSMA calculation. Default value is 0.
-
Ty for checking this out and good luck on your trading journey! Likes and comments are appreciated. 👍
--
Credits to:
▪ @everget – Chandelier Exit (CE)
▪ @netweaver2022 – ZLSMA

SuperTrend Long Strategy +TrendFilterThis strategy aims to identify long (buy) opportunities in the market using the SuperTrend indicator. It utilizes the Average True Range (ATR) and a multiplier to determine the dynamic support levels for entering long positions. This presentation will provide an overview of the strategy's components, explain its usage, and highlight that it focuses on long trades.
Components of the Strategy:
1. ATR Period: This input determines the period used for calculating the Average True Range (ATR). A higher value may result in smoother trend lines but may lag behind recent price changes.
2. Source (src): This input determines the price source used for calculations, with "hl2" (the average of high and low prices) set as the default.
3. ATR Multiplier: This input specifies the multiplier applied to the ATR value to determine the distance of the support levels from the source.
4. Change ATR Calculation Method: This input allows toggling between two methods of ATR calculation: the default method using atr() or a simple moving average (SMA) of ATR values (sma(tr, Periods)).
5. Show Buy/Sell Signals: This input enables or disables the display of buy and sell signals on the chart.
6. Highlighter On/Off: This input controls whether highlighting of up and down trends is displayed on the chart.
7. Bar Coloring On/Off: This input determines whether the bars on the chart are colored based on the trend direction.
8. The "SuperTrend Long STRATEGY" has been enhanced by incorporating a trend filter. A moving average is used as the filter to confirm the prevailing trend before executing trades. This addition effectively reduces false signals and improves the strategy's reliability, all while maintaining its original name.
Strategy Logic:
1. The strategy calculates the upper (up) and lower (dn) trend lines based on the ATR value and the chosen multiplier.
2. The trend variable keeps track of the current trend, with 1 indicating an uptrend and -1 indicating a downtrend.
3. Buy and sell signals are generated based on the change in trend direction.
4. The strategy includes an optional highlighting feature that colors the chart background based on the current trend.
5. Additionally, the bar coloring feature colors the bars based on the direction of the last trend change.
Usage:
1. ATR Period and ATR Multiplier can be adjusted based on the desired sensitivity and risk tolerance.
2. Buy and sell signals can be displayed using the Show Buy/Sell Signals input, providing clear indications of entry and exit points.
3. The Highlighter On/Off input allows users to visually identify the prevailing trend by coloring the chart background.
4. The Bar Coloring On/Off input offers a quick visual reference for the most recent trend change.
Long Strategy:
The SuperTrend Long Strategy is specifically designed to identify long (buy) opportunities. It generates buy signals when the current trend changes from a downtrend to an uptrend, indicating a potential entry point for long positions. The strategy aims to capture upward price movements and maximize profits during bullish market conditions.
The SuperTrend Long Strategy provides traders with a systematic approach to identifying long trade opportunities. By leveraging the SuperTrend indicator and dynamic support levels, this strategy aims to generate buy signals in uptrending markets. Traders can customize the inputs and utilize the visual features to adapt the strategy to their specific trading preferences.
The modification adds a trend filter to the "SuperTrend Long STRATEGY" to improve its effectiveness. The trend filter uses a moving average to confirm the prevailing trend before taking trades. This addition helps filter out false signals and enhances the strategy's reliability without changing its name.

[pAulseperformance] PSStrategyX█ OVERVIEW
This script reduces the amount of time it takes to turn your indicator into a live trading bot.
It will convert your signals into alerts that will be sent to your exchange for trading.
The script features a broker connector to automate alert syntax and connect with third-party exchanges to live trade strategies with minimal setup.
It also includes an enhanced version of the built-in backtester with customizable options to speed up backtesting, trade-by-trade statistics, and a chart strategy summary to help traders make informed decisions.
The PSStrategyX trading tool is designed to provide traders with a range of benefits, including:
Increased confidence in their strategies.
Better understanding of the accuracy of indicator signals.
Simplified automated trading through third-party broker connections.
Reduced time to develop strategies by focusing on signal development only. No need to work with complicated strategy testing code and 3rd party automation.
█ FEATURES
Broker Connector
— Supports Autoview (More Connectors added in the future)
— Connects and auto trades with most exchanges
— No need for Webhooks (AutoView)
— Can forward test live strategies on Testnets before using real money.
Built in Backtester loaded with options to speed up backtesting
— Standard strategy features including stop loss, take profit, and various filters reduce the time and complexity involved in building a working strategy.
Trade By Trade Statistics
— Gain insight on every trade with additional trade-by-trade statistics.
Strategy Summary
— Get instant feedback on your chart of your strategies performance. Visual cues and feedback give you hints on where to look and what to improve.
Strategy Tester Enhancements
— Take the max trades allowed in the strategy tester without errors.
— Take the largest or smallest trade allowed without errors.
█ WHY?
The PSStrategyX tool was developed to solve a common problem faced by traders who use Pine Script on TradingView: the inability to integrate Pine Script with exchanges through TradingView.
Without this integration, traders need to go through several extra steps to live trade their Pine Script strategies on a real exchange with real money. This includes finding a broker, learning the new syntax for the broker, and placing that syntax correctly in the strategy.
These steps can be time-consuming and add complexity to the codebase.
The PSStrategyX tool simplifies this process by automatically configuring the correct alert syntax to connect to third-party exchanges, allowing traders to live trade their strategies with minimal setup. This saves traders time and effort, allowing them to focus on signal development rather than complicated strategy testing code and 3rd party automation.
Additionally, the tool was developed to address the time-consuming task of converting any one of the thousands of great free indicators on TradingView to strategies through hours of coding.
Overall, I built the PSStrategyX to streamline the auto trading process and make auto trading more accessible to traders of all levels.
█ HOW TO USE THIS?
Using the PSStrategyX trading tool is a straightforward process that requires a few key steps:
1 — Generate trading signals: You need a signal generator that can provide buy and sell signals for your preferred trading instrument(s).
You can use TradingView's indicators or create your own custom indicators using TradingView's Pine programming language.
2 — Connect trading signals to PSStrategyX: You will use 2 scripts on your chart. One generates buy/sell/exit signals, and the other is the PSStrategyX script executing those signals as trades.
To set this up you will need to make sure that your signal generator is an indicator, NOT a strategy.
Make sure the signals are being plotted buy = 1; sell = -1; exit = 0; signals in one plot. Exits are optional.
Example plot(buy ? 1 : sell ? -1 : exit ? 0 : na)
You will choose the plot with buy/sell/exit signals inside the PSStrategyX tool to execute trades. If you need help, check out the docs for more details.
3 — Set up the broker connector (optional): If you want to take live trades with this tool, you will need to set up a third party connecter. Once set up, everything is automated. See more details in the "authors instructions." at the bottom of this post.
4 — Set up an exchange account (optional): If you want to trade on an exchange, you will need to set up an account with the exchange you plan to use.
The Broker Connector supports a range of popular exchanges, including Binance, Bitfinex, Kraken, Oanda and more.
Once you have generated your trading signals, set up the Broker connecter (optional) and set up an exchange account (optional), you can start using the PSStrategyX trading tool to execute trades automatically based on your trading signals.
█ LIMITATIONS
Here are some important limitations to keep in mind when using the PSStrategyX trading tool:
General:
— Once the alert is sent, there is no way to monitor positions on any exchange. The order will be processed by the broker connector and sent to the exchange.
While this usually works fine, it's important to check the log for errors.
Sometimes the broker connector may fail to process the order, or the exchange may not process it for various reasons.
— The tool sends TP/SL orders with the entry order when possible to protect your order in case of errors or if you lose a connection.
However, not all exchanges accept TP/SL orders, and sometimes your entry order will be left unprotected.
FIFO:
— This tool DOES NOT support the First In First Out (FIFO) method for closing positions.
— Instead, it uses the ANY method. There currently is no way to make this variable.
█ FAQ
What does PSStrategyX do exactly?
PSStrategyX is a strategy enhancing, backtester, forwardtester, automation and simulation tool. It's NOT a signal generator, and does not produce buy/sell signals by itself. You provide buy/sell signals, and PSStrategyX will put those signals on steroids...basically.
PSStrategyX helps you figure out what indicators actually work. Without wasting time learning how to code.
Why did you choose AutoView for this tool?
AutoView offered the best integration I could find. They allow you to connect to test exchanges for free, which is great for practicing without using real money. They also work without using webhooks, which means you can live trade without paying for Tradingview pro. Additionally, AutoView supports many different exchanges. I don't work for AutoView, but if you sign up through my referral link and purchase a paid version, I earn a commission.
Why doesn't Tradingview automatically connect Pine Script to exchanges?
This is a great question, but unfortunately I don't have the answer. It would definitely be helpful if Tradingview provided this feature, but it might also put some brokers out of business.
How do I get access?
DON'T ask for access in the comments.
DO review the "Authors Instructions" on this page for details.

BTC 4h bot 2.0 StrategyThis is Strategy version of BTC 4h bot 2.0.
Optimized for pairs BTC vs stablecoins, 4h timeframe.
HOW IT WORKS:
Script is based on the fact that there are certain phases of the market when there is a greater probability that BTC will go to one side or the other. To evaluate which phase we are in, the script uses "Main trend" and "Confirmation signals".
Main trend
- Is composed of a combination of several supertrends and moving averages. A Supertrend is a trend following indicator that helps in identifying whether we are in an uptrend or a downtrend. A higher factor is used to capture the main trend and not just small movements. In case the market goes sideways, the Supertrend does not work well, so it is a combination of multiple supertrends along with moving averages to differentiate a real strong trend from a range.
- It can be seen on the graph as a thick solid line.
- In an uptrend is green, in a downtrend red, gray represents the neutral zone.
Confirmation signals
- Are several script-evaluated indicators such as RSI , MACD , ADX and others, which serve to confirm the trend. In this case, it is the opposite way to the Main trend. Confirmation signals are used here to detect small movements. They are trying to capture bullish and bearish price momentum.
- On the graph they are seen as dashed lines above or below the Main trend (in the gray zone they are in the middle).
- It indicates only two signals, green for buy and red for sell.
HOW TO USE IT:
if the Main trend and Confirmation signals are of the same color, it will send a buy or sell signal, depending on which phase of the trend it is in. If the Main trend is e.g. in an uptrend and the market is going up, Confirmation signals should generate a lot of signals. But if the market starts to go in the opposite direction, Confirmation signals should generate fewer signals or none at all, thus reducing the number of wrong trades. In the gray zone of the Main trend it does not open positions.
To close position is possible to use stop loss and take profit or alternative could be to set very high TP value, thereby letting the script close the positions by itself.
The default setting is:
TP: 3.9%
SL: 4.7%.
In this case, it is a strategy to find out how the script worked in the past period. The longest period in which it is possible to test BTCUSD is on the Bitstamp exchange. The script works consistently well over a long period of time, using past probabilities, but this does not guarantee future results.

X48 - Strategy | BreakOut & Consecutive (11in1) + Alert | V.1.2================== Read This First Before Use This Strategy ==============
*********** Please be aware that this strategy is not a guarantee of success and may lead to losses.
*********** Trading involves risk and you should always do your own research before making any decisions.
================= Thanks Source Script and Explain This Strategy ===================
► Description
Write a detailed and meaningful description that allows users to understand how your script is original, what it does, how it does it and how to use it
This Strategy Are Combine Strategy and Indicators Alert Function For Systematic Trading User.
Strategy List, Thanks For Original Source Script , From Tradingview Build-in Script From fmzquant Github
// Channel BreakOut Strategy : Calculate BreakOut Zone For Buy and Sell.
// Consecutive Bars UP/Down Strategy : The consecutive bars up/down strategy is a trading strategy used to identify potential buy and sell signals in the stock market. This strategy involves looking for a series of bars (or candles) that are either all increasing or all decreasing in price. If the bars are all increasing, it can be a signal to buy, and if the bars are all decreasing, it can be a signal to sell. This strategy can be used on any timeframe, from a daily chart to an intraday chart.
// 15m Range Length SD : Range Of High and Low Candle Price and Lookback For Calculate Buy and Sell.
Indicators Are Simple Source Script (Almost I'm Chating With CHAT-GPT and Convert pinescript V4 to V5 again for complete almost script and combine after)
// SwingHigh and SwingLow Plot For SL (StopLoss by Last Swing).
// Engulfing and 3 Candle Engulfing Plot.
// Stochastic RSI for Plot and Fill Background Paint and Plot TEXT For BULL and BEAR TREND.
// MA TYPE MODE are plot 2 line of MA Type (EMA, SMA, HMA, WMA, VWMA) for Crossover and Crossunder.
// Donchian Fans MODE are Plot Dot Line With Triangle Degree Bull Trend is Green Plot and Bear Trend is Red Plot.
// Ichimoku Cloud Are Plot Cloud A-B For Bull and Bear Trend.
// RSI OB and OS for TEXT PLOT 'OB' , 'OS' you will know after OB and OS, you can combo with other indicators that's make you know what's the similar trend look like?
// MACD for Plot Diamond when MACD > 0 and MACD < 0, you can combo with other indicators that's make you know what's the similar trend look like?
Alert Can Alert Sent When Buy and Sell or TP and SL, you can adjust text to alert sent by your self or use default setting.
========== Let'e Me Explain How To Use This Strategy =============
========== Properties Setting ==========
// Capital : Default : 1,000 USDT For Alot Of People Are Beginner Investor = It's Capital Your Cash For Investment
// Ordersize : Default Are Setting 5% / Order We Call Compounded
========== INPUT Setting ==========
// First Part Use Must Choose Checkbox For Use of Strategy and Choose TP/SL by Swing or % (can choose both)
// In Detail Of Setting Are Not Too Much, Please Read The Header Of Setting Before Change The Value
// For The Indicator In List You Want To Add Just Check ✅ From MODE Setting, It's Show On Your Chart
// You Can Custom TP/SL % You Want
========== ##### No trading strategy is guaranteed to be 100% successful. ###### =========
For Example In My Systematic Trading
Select 1/3 Strategy Setting TP/SL % Match With Timeframe TP Long Are Not Set It's Can 161.8 - 423.6% but Short Position Are Not Than 100% Just Fine From Your Aset
Choose Indicators For Make Sure Trend and Strategy are the same way like Strategy are Long Position but MACD and Sto background is bear. that's mean this time not open position.
Donchian Fans is Simple Support and Ressistant If You Don't Know How To Plot That's, This indicator plot a simple for you ><.
Make Sure With Engulfing and 3 Candle Engulfing If You Don't Know, What's The Engulfing, This Indicator are plot for you too ><.
For a Big Trend You can use Ichimoku Cloud For Check Trend, Candle Upper Than Cloud or Lower Than Cloud for Bull and Bear Trend.

BankNifty 5min Supertrend Based StrategyBankNifty 5min Supertrend Based Strategy, Intraday.
Work Best at 5mint chart on BankNifty.
The strategy is designed to trade using the Supertrend indicator with session-based rules, and risk management. It allows for customization through input variables and aims to provide a clear visual representation of the Supertrend by changing the color .
The script also includes input variables for the trading session and date range, which allows the trader to specify the time period in which they want the strategy to run. The session variable specifies the start and end times of the trading session, which in this case is set to the Indian trading session from 9:15 am to 3:10 pm.
The strategy starts by defining input variables such as the session time, start and end date for the backtesting, the length of the ATR, and the Supertrend factor. It also includes options for delay at session start and stop loss points and trail percentage .
The code then checks if the current time is within the specified session and date range . If it is, the Supertrend and its direction are calculated using the defined input variables. The strategy then waits for N numbers of candles (defined by the User) to form at the start of every session i.e. 09:15 AM before entering a trade.
The entry and exit conditions for long and short trades are defined based on the change in the Supertrend direction and the number of candles formed at the session start i.e. 09:15 AM . After that, it takes entry and exit for long and short trades on the change in the Supertrend direction . Stop-loss and trailing stop-loss are also defined based on the input variables.
Stop-loss (Defined by the user) is fixed points either below or above the Entry Price for Long and Short entries.
The Supertrend plot is displayed with changing colors depending on the direction. Finally, the strategy closes all trades at the end of the session if there are any open trades.
Overall, this strategy aims to trade with the Supertrend indicator using session-based rules and risk management.
However, as with any trading strategy, it is important to thoroughly test it before using it in live trading .

Negroni MA & RSI Strategy, plus trade entry and SL/TP optionsI will start with the context, and some things to think about when using a strategy tool to back-test ideas.
CONTEXT
FIRST: This is derived from other people's work, but I honestly hadn't found a mixed indicator MA strategy tool that does what this now does. If it is out there, apologies!!
This tool can help back-test various MA trends (SMA, EMA, HMA, VWMA); as well as factoring in RSI levels (or not); and can factor in a fixed HTF MA (or not). You can apply a 'retest entry' or a 'breakout entry', and you can also apply various risk mgt for SL/TP orders: 1) No SL/TP; or 2) a fixed %, or 3) dynamic ATR multipliers.
Find below, some details explaining what this tool is attempting to do.
Thank you, tack, salute!
THINGS TO REVIEW (it is not just about 'profitability'!!)
Whilst discretion is always highly encouraged as a trader, and a 100% indicator-driven strategy is VERY unlikely to yield sustainable results going forward, at the very least back-testing your strategies can help provide some guidance, not just on win rate Vs profit factor, but other things including:
a) Trade frequency: if a strategy has an 75% win rate and profit factor of 4, with all your parameters and confluence checks, but only triggers 3 trades every 5 years, is that realistically implementable to your trading situation if you have a $10,000 account?
b) Trade entry type: is it consistently better to wait for a retest of an 'MA zone', or is it better to market buy/sell on breakout of the 'MA zone'?
c) Risk management (SL/TP): is it consistently better to have a fixed static % for SL/TP ("I always place my stops 2% away, whether it is EURUSD or BTCUSDT"), or would you be better placed to try using an ATR multiplier of the respective assets?
d) Moving average type: is your old faithful 100 EMA really serving you well, or is the classic SMA more reliable, or how about the HMA, or the VWMA? Is the 100/200 cross holding up, or do you need something more sensitive? Is there any significant difference between a 10 EMA/20 EMA trend zone compared to a 13 EMA /25 EMA zone?
e) Confluence: Do added confluence checks (RSI, higher timeframe MA) actually improve profitability? But even if they do, is at the cost of cutting too many trades?
INPUTS AND PARAMETERS
Choice 1) Entry Strategy: Retest or Breakout - You can select both!
[ ]:
a) RETEST entry strat: price crosses UNDER FastMA INTO the 'MA trend zone'.
b) BREAKOUT entry strat: price crosses OVER FastMA OUT the 'MA trend zone'.
Choice 2) Risk Management (SL and TP) - You can select more than 1 strategy!
a) No SL/TP: Long trades are closed when the LOW crosses back UNDER the fastMA again, and shorts are closed when the HIGH crosses back OVER the fastMA again.
b) Static % SL/TP: Your SL/TP will be a fixed % away from avg. position price... WARNING: You should change this for various asset classes; FX vol is not the same as crypto altcoin vol!
c) Dynamic ATR SL/TP: Your SL/TP is a multiple of your selected ATR range (default is 50, see 'info' when you select ATR range). ATR accounts for the change in vol of different asset classes somewhat, HOWEVER... you should probably still not have the same multiplier trading S&P500 as you would trading crypto altcoins!
Then select your preferred parameters: EMA, SMA, HMA, VWMA, etc. You can mix and match, and most options have a info/tooltip guide.
RSI note: If you don't care for RSI levels, then set buy signal at 1... i.e always buys! Similarly set sell signal at 99.
ATR note: standard ATR length is usually 14, however... your SL/TP will move POST entry, and can tighten or widen your initial SL/TP... for better AND usually for worse! Go find a trade (strat 3) on the chart, look at the SL/TP lines, now change the number to 5, you'll see.
Fixed HTF MA note: If you don't care for HTF MA confluence, just change the timeframe/options to match the 'Slow MA' options you've chosen.

Combined Strategy Trading Bot (RSI ADX 20SMA)Trading Bot V1, This code implements a combined trading strategy that uses several indicators and strategies to make buy and sell decisions in the market. The code is written in Pine Script™, which is a programming language used in the TradingView platform. By BraelonWhitfield.Eth
The strategy uses the Average Directional Movement Index (ADX) and the Pine SuperTrend indicator to identify trends and price movements in the market. The SuperTrend indicator is a popular technical analysis tool that helps to identify the direction of the current trend and provides entry and exit points for trades.
The strategy also uses the Relative Strength Index (RSI) to identify overbought and oversold conditions in the market. The RSI is a momentum indicator that measures the speed and change of price movements in the market.
The first part of the code defines the inputs for the ADX and DI Length, which are used to calculate the ADX and DI values. The dirmov() function is used to calculate the positive and negative directional indicators (plusDM and minusDM) based on the high and low prices. The truerange variable is then calculated using the True Range (TR) formula. Finally, the plus and minus variables are calculated using the smoothed moving average of the plusDM and minusDM values.
The adx() function is then used to calculate the ADX values based on the plus and minus variables. The Pine SuperTrend indicator is defined using the pine_supertrend() function. This function uses the high-low average (hl2) and the Average True Range (ATR) to calculate the upper and lower bands for the indicator. The direction of the current trend is then determined based on whether the current price is above or below the upper or lower bands.
The RSI values are then calculated using the ta.rsi() function, with the inputs for the close price and the RSI period. The overbought and oversold conditions are defined using the OB and OS inputs, which specify the threshold values for the RSI. The upTrend and downTrend variables are defined based on the direction of the Pine SuperTrend indicator.
The next part of the code defines the 20-period Simple Moving Average (SMA) using the ta.sma() function. The os and ob variables are then calculated based on the RSI values and the OB and OS inputs. The strategy.entry() function is used to define the buy and sell orders based on the upTrend and downTrend variables, as well as the Pine SuperTrend indicator, the 20-period SMA, and the os variable.
The final part of the code defines the Channel Breakout Strategy using the ta.highest() and ta.lowest() functions to calculate the upper and lower bounds of the channel. The strategy.entry() function is then used to define the buy and sell orders based on whether the current price is above or below the upper or lower bounds.
In summary, this code implements a combined trading strategy that uses several indicators and strategies to make buy and sell decisions in the market. The strategy is designed to identify trends and price movements in the market, as well as overbought and oversold conditions, to provide entry and exit points for trades. The strategy uses the Pine SuperTrend indicator, the ADX and DI indicators, the RSI, and the 20-period SMA, as well as the Channel Breakout Strategy to make informed trading decisions.

Extended Recursive Bands StrategyThe original indicator was created by alexgrover .
All credit goes to alexgrover for creating the indicator that this strategy uses.
This strategy was posted because there were multiple requests for it, and no strategy based on this indicator exists yet.
The Recursive Bands Indicator, an indicator specially created to be extremely efficient, I think you already know that calculation time is extra important in algorithmic trading, and this is the principal motivation for the creation of the proposed indicator. Originally described in Alex's paper "Pierrefeu, Alex (2019): Recursive Bands - A New Indicator For Technical Analysis", the indicator framework has been widely used in his previous uploaded indicators, however it would have been a shame to not upload it, however user experience being a major concern for me, I decided to add extra options, which explain the term "extended".
The Indicator
The indicator displays one upper and one lower band, every common usages applied to bands indicators such as support/resistance , breakout, trailing stop, etc, can also be applied to this one. Length controls how reactive the bands are, higher values will make the bands cross the price less often.
In order to provide more flexibility for the user alexgrover added the option to use various methods for the calculation of the indicator, therefore the indicator can use the average true range , standard deviation, average high-low range, and one totally exclusive method specially designed for this indicator.
Added logic:
We have implemented a logic that checks whether the bands have been following in the same direction for a set amount of bars. This logic must be true before it can enter trades. This is completely new code that was written by us entirely, and it makes a huge difference on strategy performance.
Strategy Long conditions:
1 — Price low is below the the lower band.
2 — The lower band keeps increasing in value until the 'lookback' setting amount of bars is reached.
Strategy Short conditions:
1 — Price high is above the upper band.
2 — The upper band keeps decreasing in value until the 'lookback' setting amount of bars is reached.
Strategy Properties:
We have set a default commission of 0.06% because these are Bybit's fees. The strategy uses an order size of 10% of equity, since drawdown is very low like this. We also use a 10 tick slippage to keep results realistic and account for this. All other settings were left as default apart from initial capital, just to decrease the size of the numbers.

Macro Score -- User-Customized Scores and SignalsA "macro score", as defined here, is created by giving various weights to different signals and adding them together to get one smooth score. Positive or negative values are assigned to each of the signals depending on if the statement is true or false (e.g. DPO > 0: +1, DPO < 0: -1). This manner of strategy allows for a subset of the available signals to be present at one time as opposed to every technical signal having to be active in order for a long/short signal to trigger. This particular strategy allows the user to choose between 18 different signals to be used in scoring as well as allowing the user to determine the individual weights of each score as well as the overall threshold to determine long or short signals. Weights for each score range between 1 and 5, with 5 being the greatest weight. The overall threshold for long or short is dependent on the total possible weights added together (i.e. if your weights total -10 or +10, a threshold within this range must be used).
The macro score itself is printed in an underlay as a white line that goes between the maximum positive and negative values for all weights added together for this strategy. In addition to the macro score line, a green momentum line (sourced by the macro score itself) has been included. A crossover/crossunder of the macro score and the macro momentum line is included into the long/short signal syntax in addition to a threshold for the macro score. The length of the Macro Score's momentum line can be found in the settings.
The current signals to choose from include:
- ADX Threshold - if the Average Directional Index is above a set threshold, signal positive or negative
- CMF Threshold - if the Chaikin Money Flow oscillator is above 0, signal positive; otherwise, signal negative
- CMO > TSI Signal - signal positive if there is a cross of the Chande Momentum Oscillator and the True Strength Index signal line
- CMO Threshold - if the Chande Momentum Oscillator is above 0, signal positive; otherwise, signal negative
- DPO Threshold - if the Detrended Price Oscillator is above 0, signal positive; otherwise, signal negative
- EOM Threshold - if the Ease of Money Oscillator is above 0, signal positive; otherwise, signal negative
- Jurik Threshold - if the Jurik price line (from the Jurik Volatility Bands) is above 0, signal positive; otherwise, signal negative
- MACD Threshold - if the MACD signal line is above 0, signal positive; otherwise, signal negative
- McGinley Cross - a crossover of a fast McGinley Dynamic length line and a slow McGinley Dynamic line signals positive; otherwise, signal negative
- PSAR - if the direction of the PSAR is heading long, signal positive; otherwise, signal negative
- ROC Threshold - if the Rate of Change oscillator is above 0, signal positive; otherwise, signal negative
- RSI Threshold - if the Relative Strength Index is above 50, signal positive; otherwise, signal negative
- Stoch RSI Threshold - if the Stoch RSI is above 50, signal positive; otherwise, signal negative
- Supertrend - if the Supertrend determines long, signal positive; otherwise, signal negative
- TSI Cross - a crossover of the True Strength Index value line and the TSI signal line signals positive; otherwise, signal negative
- TSI Signal Threshold - if the TSI signal line is above 0, signal positive; otherwise, signal negative
- Williams Alligator Cross - if the Williams Alligator lips cross the teeth and jaw, signal positive; otherwise, signal negative
- Williams %R - if the Williams %R is above -50, signal positive; otherwise, signal negative
Take profit, stop loss, and trailing percentages are also included, found at the bottom of the Input tab under “TT and TTP” as well as “Stop Loss”. Make sure to understand the TP/SL ratio that you desire before use, as the desired hit rate/profitability percentage will be affected accordingly. This strategy does NOT guarantee future returns. Apply caution in trading regardless of discretionary or algorithmic. Understand the concepts of risk/reward and the intricacies of each strategy choice before utilizing them in your personal trading.
Profitview Settings:
If you wish to utilize Profitview’s automation system, find the included “Profitview Settings” under the Input tab of the strategy settings menu. If not, skip this section entirely as it can be left blank. Options will be “OPEN LONG TITLE”, “OPEN SHORT TITLE”, “CLOSE LONG TITLE”, and “CLOSE SHORT TITLE”. If you wished to trade SOL, for example, you would put “SOL LONG”, “SOL SHORT”, “SOL CLOSE LONG”, and “SOL CLOSE SHORT” in these areas. Within your Profitview extension, ensure that your Alerts all match these titles. To set an alert for use with Profitview, go to the “Alerts” tab in TradingView, then create an alert. Make sure that your desired asset and timeframe are currently displayed on your screen when creating the alert. Under the “Condition” option of the alert, select the strategy, then select the expiration time. If using TradingView Premium, this can be open-ended. Otherwise, select your desired expiration time and date. This can be updated whenever desired to ensure the strategy does not expire. Under “Alert actions”, nothing necessarily needs to be selected unless so desired. Leave the “Alert name” option empty. For the “Message”, delete the generated message and replace it with {{strategy.order.alert_message}} and nothing else.
Sample setup for SOLUSDT 30M:
- Score 1 - Value 4, PSAR (0.05 start, 0.02 increment, 0.2 max value; sourced open)
- Score 2 - Value 4, Jurik Threshold (JVB Length 25, JVB Smoothing 6, JVB Price Threshold 0)
- Score 3 - Value 5, DPO Threshold (DPO Length 40, uncentered)
- Score 4 - Value 5, CMO Threshold (CMO Length 40, sourced open)
- Score 5 - Value 2, MACD Threshold (Fast Length 12, Slow Length 30, sourced open)
- Macro Length 21
- Long Threshold - -3
- Short Threshold - +3
- Take Profit % - 0.9/0.9
- Trail % - 0.005
- Stop Loss % - 1.4
Sample setup for AVAXUSDT 20M:
- Score 1 - Value 3, TSI Cross (Long Length 25, Short Length 16, Signal Length 17)
- Score 2 - Value 2, TSI Signal Threshold (same settings as the TSI Cross)
- Score 3 - Value 2, Jurik Threshold (JVB Length 20, JVB Smoothing 8, JVB Price Threshold 0)
- Score 4 - Value 2, DPO Threshold (DPO Length 40, uncentered)
- Score 5 - Value 1, Stoch Threshold (K/D 3, RSI (Stoch) Length 10, Stochastic Length 4, sourced open)
- Macro Length 13
- Long Threshold - +5
- Short Threshold - -5
- Take Profit % - 1.2/1.2
- Trail % - 0.005
- Stop Loss % - 1.5

SuperTrend Multi Time Frame Long and Short Trading Strategy
Hello All
This is non-repainting Supertrend Multi Time Frame script, I got so many request on Supertrend with Multi Time Frame. This is for all of them ..I am making it open for all so you can change its coding according to your need.
How the Basic Indicator works
SuperTrend is one of the most common ATR based trailing stop indicators.
In this version you can change the ATR calculation method from the settings. Default method is RMA.
The indicator is easy to use and gives an accurate reading about an ongoing trend. It is constructed with two parameters, namely period and multiplier. The default values used while constructing a Supertrend indicator are 10 for average true range or trading period and three for its multiplier.
The average true range (ATR) plays an important role in 'Supertrend' as the indicator uses ATR to calculate its value. The ATR indicator signals the degree of price volatility .
The buy and sell signals are generated when the indicator starts plotting either on top of the closing price or below the closing price. A buy signal is generated when the ‘Supertrend’ closes above the price and a sell signal is generated when it closes below the closing price.
It also suggests that the trend is shifting from descending mode to ascending mode. Contrary to this, when a ‘Supertrend’ closes above the price, it generates a sell signal as the colour of the indicator changes into red.
A ‘Supertrend’ indicator can be used on spot, futures, options or forex, or even crypto markets and also on daily, weekly and hourly charts as well, but generally, it fails in a sideways-moving market.
How the Strategy works
This is developed based on SuperTrend.
Use two time frame for confirm all entry signals.
Two time frame SuperTrend works as Trailing stop for both long and short positions.
More securely execute orders, because it is wait until confine two time frames(example : daily and 30min)
Each time frame developed as customisable for user to any timeframe.
User can choose trading position side from Long, Short, and Both.
Custom Stop Loss level, user can enter Stop Loss percentage based on timeframe using.
Multiple Take Profit levels with customisable TP price percentage and position size.
Back-testing with custom time frame.
This strategy is develop for specially for automation purpose.
The strategy includes:
Entry for Long and Short.
Take Profit.
Stop Loss.
Trailing Stop Loss.
Position Size.
Exit Signal.
Risk Management Feature.
Backtesting.
Trading Alerts.
Use the strategy with alerts
This strategy is alert-ready. All you have to do is:
Go on a pair you would like to trade
Create an alert
Select the strategy as a Trigger
Wait for new orders to be sent to you
This is develop for specially for automating trading on any exchange, if you need to get that automating service for this strategy or any Tradingview strategy or indicator please contact me I am have 8 year experience on that field.
I hope you enjoy it!
Thanks,
Ranga

[MT] Strategy Backtest Template| Initial Release | | EN |
An update of my old script, this script is designed so that it can be used as a template for all those traders who want to save time when programming their strategy and backtesting it, having functions already programmed that in normal development would take you more time to program, with this template you can simply add your favorite indicator and thus be able to take advantage of all the functions that this template has.
🔴Stop Loss and 🟢Take Profit:
No need to mention that it is a Stop Loss and a Take Profit, within these functions we find the options of: fixed percentage (%), fixed price ($), ATR, especially for Stop Loss we find the Pivot Points, in addition to this, the price range between the entry and the Stop Loss can be converted into a trailing stop loss, instead, especially for the Take Profit we have an option to choose a 1:X ratio that complements very well with the Pivot Points.
📈Heikin Ashi Based Entries:
Heikin Ashi entries are trades that are calculated based on Heikin Ashi candles but their price is executed to Japanese candles, thus avoiding false results that occur in Heikin candlestick charts, this making in certain cases better results in strategies that are executed with this option compared to Japanese candlesticks.
📊Dashboard:
A more visual and organized way to see the results and necessary data produced by our strategy, among them we can see the dates between which our operations are made regardless if you have activated some time filter, usual data such as Profit, Win Rate, Profit factor are also displayed in this panel, additionally data such as the total number of operations, how many were gains and how many losses, the average profit and loss for each operation and finally the maximum profits and losses followed, which are data that will be very useful to us when we elaborate our strategies.
Feel free to use this template to program your own strategies, if you find errors or want to request a new feature let me know in the comments or through my social networks found in my tradingview profile.
| Update 1.1 | | EN |
➕Additions: '
Time sessions filter and days of the week filter added to the time filter section.
Option to add leverage to the strategy.
5 Moving Averages, RSI, Stochastic RSI, ADX, and Parabolic Sar have been added as indicators for the strategy.
You can choose from the 6 available indicators the way to trade, entry alert or entry filter.
Added the option of ATR for Take Profit.
Ticker information and timeframe are now displayed on the dashboard.
Added display customization and color customization of indicator plots.
Added customization of display and color plots of trades displayed on chart.
📝Changes:
Now when activating the time filter it is optional to add a start or end date and time, being able to only add a start date or only an end date.
Operation plots have been changed from plot() to line creation with line.new().
Indicator plots can now be controlled from the "plots" section.
Acceptable and deniable range of profit, winrate and profit factor can now be chosen from the "plots" section to be displayed on the dashboard.
Aesthetic changes in the section separations within the settings section and within the code itself.
The function that made the indicators give inputs based on heikin ashi candles has been changed, see the code for more information.
⚙️Fixes:
Dashboard label now projects correctly on all timeframes including custom timeframes.
Removed unnecessary lines and variables to take up less code space.
All code in general has been optimized to avoid the use of variables, unnecessary lines and avoid unnecessary calculations, freeing up space to declare more variables and be able to use fewer lines of code.
| Lanzamiento Inicial | | ES |
Una actualización de mi antiguo script, este script está diseñado para que pueda ser usado como una plantilla para todos aquellos traders que quieran ahorrar tiempo al programar su estrategia y hacer un backtesting de ella, teniendo funciones ya programadas que en el desarrollo normal te tomaría más tiempo programar, con esta plantilla puedes simplemente agregar tu indicador favorito y así poder aprovechar todas las funciones que tiene esta plantilla.
🔴Stop Loss y 🟢Take Profit:
No hace falta mencionar que es un Stop Loss y un Take Profit, dentro de estas funciones encontramos las opciones de: porcentaje fijo (%), precio fijo ($), ATR, en especial para Stop Loss encontramos los Pivot Points, adicionalmente a esto, el rango de precio entre la entrada y el Stop Loss se puede convertir en un trailing stop loss, en cambio, especialmente para el Take Profit tenemos una opción para elegir un ratio 1:X que se complementa muy bien con los Pivot Points.
📈Entradas Basadas en Heikin Ashi:
Las entradas Heikin Ashi son operaciones que son calculados en base a las velas Heikin Ashi pero su precio esta ejecutado a velas japonesas, evitando así́ los falsos resultados que se producen en graficas de velas Heikin, esto haciendo que en ciertos casos se obtengan mejores resultados en las estrategias que son ejecutadas con esta opción en comparación con las velas japonesas.
📊Panel de Control:
Una manera más visual y organizada de ver los resultados y datos necesarios producidos por nuestra estrategia, entre ellos podemos ver las fechas entre las que se hacen nuestras operaciones independientemente si se tiene activado algún filtro de tiempo, datos usuales como el Profit, Win Rate, Profit factor también son mostrados en este panel, adicionalmente se agregaron datos como el número total de operaciones, cuantos fueron ganancias y cuantos perdidas, el promedio de ganancias y pérdidas por cada operación y por ultimo las máximas ganancias y pérdidas seguidas, que son datos que nos serán muy útiles al elaborar nuestras estrategias.
Siéntete libre de usar esta plantilla para programar tus propias estrategias, si encuentras errores o quieres solicitar una nueva función házmelo saber en los comentarios o a través de mis redes sociales que se encuentran en mi perfil de tradingview.
| Actualización 1.1 | | ES |
➕Añadidos:
Filtro de sesiones de tiempo y filtro de días de la semana agregados al apartado de filtro de tiempo.
Opción para agregar apalancamiento a la estrategia.
5 Moving Averages, RSI, Stochastic RSI, ADX, y Parabolic Sar se han agregado como indicadores para la estrategia.
Puedes escoger entre los 6 indicadores disponibles la forma de operar, alerta de entrada o filtro de entrada.
Añadido la opción de ATR para Take Profit.
La información del ticker y la temporalidad ahora se muestran en el dashboard.
Añadido personalización de visualización y color de los plots de indicadores.
Añadido personalización de visualización y color de los plots de operaciones mostradas en grafica.
📝Cambios:
Ahora al activar el filtro de tiempo es opcional añadir una fecha y hora de inicio o fin, pudiendo únicamente agregar una fecha de inicio o solamente una fecha de fin.
Los plots de operaciones han cambiados de plot() a creación de líneas con line.new().
Los plots de indicadores ahora se pueden controlar desde el apartado "plots".
Ahora se puede elegir el rango aceptable y negable de profit, winrate y profit factor desde el apartado "plots" para mostrarse en el dashboard.
Cambios estéticos en las separaciones de secciones dentro del apartado de configuraciones y dentro del propio código.
Se ha cambiado la función que hacía que los indicadores dieran entradas en base a velas heikin ashi, mire el código para más información.
⚙️Arreglos:
El dashboard label ahora se proyecta correctamente en todas las temporalidades incluyendo las temporalidades personalizadas.
Se han eliminado líneas y variables innecesarias para ocupar menos espacio en el código.
Se ha optimizado todo el código en general para evitar el uso de variables, líneas innecesarias y evitar los cálculos innecesarios, liberando espacio para declarar más variables y poder utilizar menos líneas de código.

Open High Low StrategyThis is a very simple, yet effective and to some extend widely followed scalping strategy to capture the underling sentiments of the counter whether it will go up or down.
What is it?
This is Open-High-Low (OLH) strategy.
As you already aware of Candlestick patterns, there is patterns called as Marubozu patterns where the sell wick or buy wick either ceases to exists (or very small). This is exactly in the same principle.
In OLH strategy: The buy signal appears when the Open Price is the Low Price. It means if you draw the candlestick, there is no bottom wick. So after the opening of the candle, the demand drives the price up to the level, some selling may or may not come and closes in green. This indicates a strong upward biasness of the underlying counter.
Similarly, a sell signal appears when the Open price is the High Price. It means there is no upper wick. So there is no buying pressure, since the opening of the candle, sellers are in force and pulls down the price to a closing.
This strategy generates the signal at the close of the candle (technically barstate.isconfirmed). Because until the bar is real-time there is no option to know the final closing or high. So you will see the bar on which it generates the buy or sell signal is actually indicates the previous bar as OLH bar.
To determine the Stop-Loss, it uses the most widely known SL calculation of:
For buy signal, it takes the low of the last 7 candles and substract the ATR (Average True Range) of 14-period.
For sell signal, it takes the high of the last 7 candles and add it to the ATR (Average True Range) of 14-period.
One can plot the SL lines as dotted green and red lines as well to see visually.
Default Risk:Reward is 1:2, Can be customizable.
What is Unique?
Of course the utter simplistic nature of this strategy is it's key point. Very easy and intuitive to understand.
There are awesome strategies in this forum that talks about the various indicators combinations and what not.
Instead of all this, in a 15m NSE:NIFTY chart, it generates a good ~ 47% profit-factor with 1:2 Risk Reward ratio. Means if you loose a trade you will loose 1% of account and if you win you will gain 2%. Means 3 trades (2 profits and 1 loss) in a trading session result 3% overall gain for the day. (Assuming you are ready with 1% draw down of your account per trade, at max).
Disclaimer:
This piece of software does not come up with any warrantee or any rights of not changing it over the future course of time.
We are not responsible for any trading/investment decision you are taking out of the outcome of this indicator.

AlgoTrade DCA Bot Backtester█ OVERVIEW
This script can be used to backtest DCA Bots. It draws inspiration from 3Commas and has most settings that are available on 3Commas. It contains a few popular DCA Bot Presets that are well known in the community for you to test out! Preset used here: Kirigakure V4
█ FEATURES
DCA Preset (Custom, Standard TA,Urma Lite V3,Kirigakure V1,Kirigakure V3,Kirigakure V4)
Order Size Type (Fixed/% of equity to simulate compounding)
Base Order Size
Safety Order Size
Max Safety Trades Count
Price Deviation to open safety order %
Safety Order Volume Scale
Safety Order Step Scale
Take Profit %
Use ADR (Average Daily Range) as Take Profit
ADR length (if ADR as take profit is enabled)
Take Profit Type (% from total volume / % from base order)
Trailing Take Profit
Stop Loss
Deal Start Condition (Start ASAP) ▶ More Deal Starting Conditions will be added in the future
Bot Direction (Long / Short)
Start Time ▶ 1999-01-01 (Use this to always backtest the entire history)
End Time
This strategy also allows you to plot the Average Price and Take Profit of each trade, so it's easier to follow the trade and understand what's happening.
█ HOW TO USE
1. Select a DCA Preset and change the initial capital to the exact amount that is required (seen in the error message on top of the table). When using a Preset the following settings will be locked, meaning if you change them in the script's settings it won't have any effect:
Base Order Size
Safety Order Size
Max Safety Trades Count
Price Deviation to open safety order %
Safety Order Volume Scale
Safety Order Step Scale
Use ADR (Average Daily Range) as Take Profit
1.1 When using Presets you can choose the Order Size Type of Fixed or % of equity which simulates compounding
1.2 Choose a Direction and a Start and End Time
2. To backtest customized settings choose the preset "Custom"
2.1 All other settings are now "unlocked" and can be used
█ LIMITATIONS
Whenever a DCA preset is changed the initial_capital needs to be changed to the exact amount the settings require. If the initial_capital is not the same there will be an error of top of the table. To fix this error navigate to the Script's Settings and Properties and change the initial_capital to the same amount that is stated in the error.
DCA Bots with a high number of safety orders, e.g. 100, can run into an error that says "Maximum number of orders (9000) reached". If this error happens change the backtesting time to a shorter timeframe.
Using % of equity simulates compounding but is unrealistic because you cannot re-invest every single dollar
█ THANKS
This script in insipred by rouxam's "Backtesting 3commas DCA Bot v2" script

Candles - The WhaleThe strategy is based on candle patterns, with confluence indicators. Note some of the candles are rare, they can be found only a specific timeframe, or within specific stocks.
The added patterns are as follows:
- Bullish Engulfing
It is formed by two candles, the second candlestick engulfing the first candlestick. The first candle is a bearish candle that indicates the continuation of the downtrend.
The second candlestick is a long bullish candle that completely engulfs the first candle and shows that the bulls are back in the market.
- Bullish Harami
It consists of two candlestick charts, the first candlestick being a tall bearish candle, and the second, being a small bullish candle which should be in the range of the first candlestick.
The first bearish candle shows the continuation of the bearish trend and the second candle shows that the bulls are back in the market.
- Piercing Line
Two candles from it, the first candle being a bearish candle which indicates the continuation of the downtrend.
The second candle is a bullish candle that opens the gap down but closes more than 50% of the real body of the previous candle, which shows that the bulls are back in the market and a bullish reversal is going to take place.
- Bullish Belt
A Bullish Belt Hold, known as “yorikiri” in Japanese, is a single Japanese candlestick pattern that suggests a possible reversal of the current downtrend.
- Bullish Kicker
A bullish kicker is a two candlestick pattern that’s usually formed after a significant downtrend, but could also appear after an uptrend.
- Abandoned Baby
The abandoned baby candlestick pattern is a three-bar reversal pattern. It is similar to the morning and evening star formations and is a very reliable reversal signal when it occurs after a sharp rise or drop.
- Homing Pigeon
The bullish homing pigeon is a two-candle bullish reversal pattern that occurs at the end of a bearish trend. Both candles are negative, but the second candle is confined within the range of the previous candle.
- Breakaway
Breakaway patterns are multi-candle formations found on Japanese candlestick charts that suggest a market reversal may be in the offing. An actual breakaway is a five candlestick formation that occurs in either an upward or downward trend.
- Concealing Baby Swallow
The Concealing Baby Swallow candlestick pattern is a four-candlestick pattern that can signal a bullish reversal price movement or a bearish continuation move, depending on where it occurs in the overall market structure. However, the pattern is quite rare, and you may not encounter it in your trading.
- Doji Dragonfly
A dragonfly doji can be an indicator of a reversal in price. When the price of a security has shown a downward trend, it might signal an upcoming price increase.
- Doji Gravestone
The Gravestone Doji forms when the price closes at relatively the same level where it opened, providing that the open coincides with the low or at least the two are very close
- Doji Star
Consists of a long bullish candle, followed by a Doji that gaps up, then a third bearish candle that gaps down and closes well within the body of the first candle. An Evening Doji Star is a three-candle bearish reversal pattern similar to the Evening Star.
- Kicker
A kicker pattern is a two-bar candlestick pattern that predicts a change in the direction of an asset's price trend. This pattern is characterized by a sharp reversal in price over the span of two candlesticks. Traders use it to determine which group of market participants is in control of the direction.
- Ladder Bottom
Is a five-candle bullish reversal pattern that occurs at the end of a bullish trend. The four first candles are bearish and followed by a positive candle that starts with a positive gap.
- MatHold
A bullish pattern begins with a large bullish candle followed by a gap higher and three smaller candles which move lower.
- Matching Low
A matching low is a bullish two-candle reversal pattern that forms in an ongoing downtrend. As to its appearance, a matching low consists of two candlesticks that are negative, but the close at or around the same price.
- Meeting Lines
Bullish meeting lines are a two-candle bullish reversal pattern that occurs in a downtrend and signals a reversal of the trend. The first candle of the bullish meeting lines is bearish, and followed by a positive candle that closes very near the close of the previous candle.
- Morning Doji Star
It is made of 3 candlesticks, the first being a bearish candle, the second, a Doji, and the third being a bullish candle.
The first candle shows the continuation of the downtrend. The second candle being a doji indicates indecision in the market. The third bullish candle shows that the bulls are back in the market and a reversal will take place. The second candle should be completely out of the real bodies of the first and third candles.
- Rising Three Method1
Rising three methods is a bullish continuation pattern that appears in an ongoing uptrend. The Rising three methods pattern consists of five candles. where the first and last candles are long and bullish, with three small bearish candles in between.
- Rising Three Method2
It is the same as "Rising Three Method1" but with a different calculation
- Upside Tasuki Gap1
Is a bullish continuation candlestick pattern that forms in an ongoing uptrend. It consists of three candles, where the two first are bullish with a positive gap in-between, and followed by a negative candle that closes in the gap formed between the first two candles.
- Upside Tasuki Gap2
It is the same as "Upside Tasuki Gap1" but with a different calculation
- Three Line Strike1
Is a four-candle bullish continuation candlestick pattern. It forms a bullish trend and is believed to signal the continuation of the bullish trend.
- Three Line Strike2
It is the same as "Three Line Strike2" but with a different calculation
The confluence indicators:
Movement Averages: multi options checks, you can select what to check to open a position, and the description of each open is in the strategy.
Volume Oscillator: positive signal if the volume is above zero.
EMA: positive signal if the candle source is above EMA.
VWAP: positive signal if the candle source is above VWAP.
BTC Trend: it is an equation to track the BTC price movement
The profit is based on TSL, while the stop loss is based on ATR, or lowest candle.
The recommended time frame is 4 hours.

Forex Midpoint Stratejisi For Nasdaq English Knowledge:
Midpoint Strategy;
The general calculation method is a strategy that helps determine direction by the intersection of a MA line and the value obtained by dividing the lowest and highest price in the specified length range.
Başlangıç Periyodu: The data length of the Midpoint Line.
Kaydırma Seviyesi: The number of steps forward or backward of the Midpoint Line.
Yüzde Seviyesi: the amount of vertical scrolling.
Uzunluk: The length of the MA line
represents.
This strategy is prepared for the Nasdaq 5-minute period. It needs to be optimized for use on other instruments.
There are take profit and stop loss levels within the codes. Friends who want to use it can remove the invisibility from the relevant sections. Also, I removed the midpoint and the MA line so that it does not crowd the image, you can add it if you want.
Thank you.
Turkish Knowledge:
Midpoint Stratejisi;
Genel hesaplama yöntemi, belirlenen uzunluk aralığındaki en düşük ve en yüksek fiyatın ikiye bölümü ile elde edilen değer ve bir ortalama çizgisinin kesişimleriyle yön belirlemeye yardımcı bir stratejidir.
Başlangıç Period: Midpoint Çizgisinin veri uzunluğunu.
Kaydırma Seviyesi: Midpoint Çizgisinin ileri veya geri adım sayısını.
Yüzde Seviyesi: dikey kaydırma miktarını.
Uzunluk: Ortalama çizgisinin uzunluğunu
temsil etmektedir.
Bu strateji Nasdaq 5 dakikalık periot için hazırlanmıştır. Diğer enstrümanlarda kullanılması için optimize edilmesi gerekir.
Kodların içinde Kar alma , zarar durdurma seviyeleri mevcuttur. Kullanmak isteyen arkadaşlar ilgili bölümlerden görünmezliği kaldırabilirler. ayrıca midpoint ve ortalama çizgisinide görüntü kalabalığı yapmaması için ben kaldırdım isterseniz siz ekleyebilirsiniz.
Teşekkürler.

STD-Filtered, Gaussian-Kernel-Weighted Moving Average BT [Loxx]STD-Filtered, Gaussian-Kernel-Weighted Moving Average BT is the backtest for the following indicator
Included:
This backtest uses a special implementation of ATR and ATR smoothing called "True Range Double" which is a range calculation that accounts for volatility skew.
You can set the backtest to 1-2 take profits with stop-loss
Signals can't exit on the same candle as the entry, this is coded in a way for 1-candle delay post entry
This should be coupled with the INDICATOR version linked above for the alerts and signals. Strategies won't paint the signal "L" or "S" until the entry actually happens, but indicators allow this, which is repainting on current candle, but this is an FYI if you want to get serious with Pinescript algorithmic botting
You can restrict the backtest by dates
It is advised that you understand what Heikin-Ashi candles do to strategies, the default settings for this backtest is NON Heikin-Ashi candles but you have the ability to change that in the source selection
This is a mathematically heavy, heavy-lifting strategy. Make sure you do your own research so you understand what is happening here.
STD-Filtered, Gaussian-Kernel-Weighted Moving Average is a moving average that weights price by using a Gaussian kernel function to calculate data points. This indicator also allows for filtering both source input price and output signal using a standard deviation filter.
Purpose
This purpose of this indicator is to take the concept of Kernel estimation and apply it in a way where instead of predicting past values, the weighted function predicts the current bar value at each bar to create a moving average that is suitable for trading. Normally this method is used to create an array of past estimators to model past data but this method is not useful for trading as the past values will repaint. This moving average does NOT repaint, however you much allow signals to close on the current bar before taking the signal. You can compare this to Nadaraya-Watson Estimator wherein they use Nadaraya-Watson estimator method with normalized kernel weighted function to model price.
What are Kernel Functions?
A kernel function is used as a weighing function to develop non-parametric regression model is discussed. In the beginning of the article, a brief discussion about properties of kernel functions and steps to build kernels around data points are presented.
Kernel Function
In non-parametric statistics, a kernel is a weighting function which satisfies the following properties.
A kernel function must be symmetrical. Mathematically this property can be expressed as K (-u) = K (+u). The symmetric property of kernel function enables its maximum value (max(K(u)) to lie in the middle of the curve.
The area under the curve of the function must be equal to one. Mathematically, this property is expressed as: integral −∞ + ∞ ∫ K(u)d(u) = 1
Value of kernel function can not be negative i.e. K(u) ≥ 0 for all −∞ < u < ∞.
Kernel Estimation
In this article, Gaussian kernel function is used to calculate kernels for the data points. The equation for Gaussian kernel is:
K(u) = (1 / sqrt(2pi)) * e^(-0.5 *(j / bw )^2)
Where xi is the observed data point. j is the value where kernel function is computed and bw is called the bandwidth. Bandwidth in kernel regression is called the smoothing parameter because it controls variance and bias in the output.
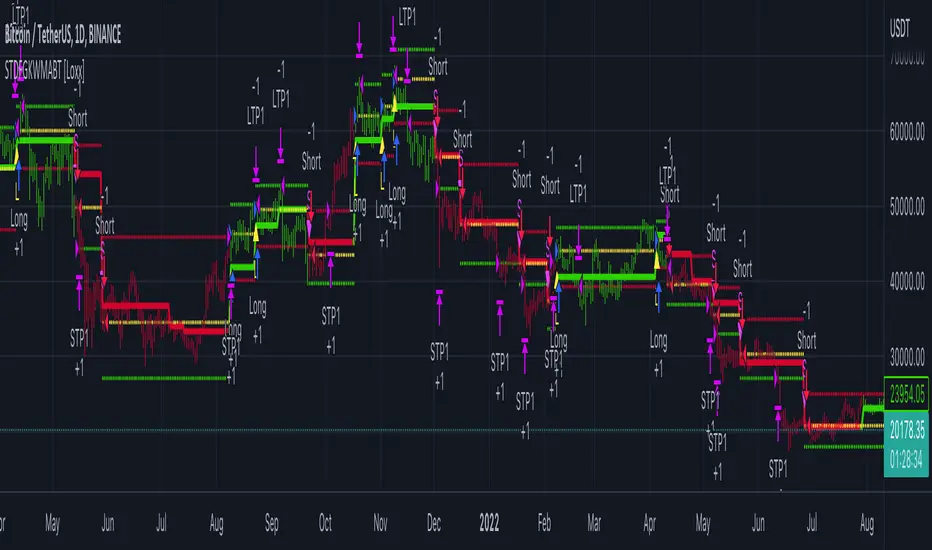
Swing Trend StrategyThis script is a trend following system which uses a long term Moving Average to spot the trend in combination with the Average True Range to filter out Fakeouts, limiting the overall drawdown.
Default Settings and Calculation:
- The trend is detected using the Exponential Moving Average on 200 periods.
- The Average True Range is calculated on 10 periods.
- The Market is considered in an Uptrend when the price closes above the EMA + ATR.
- The Market is considered in a Downtrend when the price closes below the EMA - ATR.
- The strategy will open a LONG position when the market is in an Uptrend.
- The strategy will close its LONG positions when the price closes below the EMA.
- The strategy will open a SHORT position when the market is in a Downtrend.
- The strategy will close its SHORT positions when the price closes above the EMA.
This script is best suited for the 4h timeframe, and shows good results on BTC and ETH especially.
The options allow to modify the type of moving average to use, the period of the moving average, the ATR multiplier to add as well as the possibility to open short trades or not.
