SuperATR 7-Step Profit - Strategy [presentTrading] Long time no see!
█ Introduction and How It Is Different
The SuperATR 7-Step Profit Strategy is a multi-layered trading approach that integrates adaptive Average True Range (ATR) calculations with momentum-based trend detection. What sets this strategy apart is its sophisticated 7-step take-profit mechanism, which combines four ATR-based exit levels and three fixed percentage levels. This hybrid approach allows traders to dynamically adjust to market volatility while systematically capturing profits in both long and short market positions.
Traditional trading strategies often rely on static indicators or single-layered exit strategies, which may not adapt well to changing market conditions. The SuperATR 7-Step Profit Strategy addresses this limitation by:
- Using Adaptive ATR: Enhances the standard ATR by making it responsive to current market momentum.
- Incorporating Momentum-Based Trend Detection: Identifies stronger trends with higher probability of continuation.
- Employing a Multi-Step Take-Profit System: Allows for gradual profit-taking at predetermined levels, optimizing returns while minimizing risk.
BTCUSD 6hr Performance
█ Strategy, How It Works: Detailed Explanation
The strategy revolves around detecting strong market trends and capitalizing on them using an adaptive ATR and momentum indicators. Below is a detailed breakdown of each component of the strategy.
🔶 1. True Range Calculation with Enhanced Volatility Detection
The True Range (TR) measures market volatility by considering the most significant price movements. The enhanced TR is calculated as:
TR = Max
Where:
High and Low are the current bar's high and low prices.
Previous Close is the closing price of the previous bar.
Abs denotes the absolute value.
Max selects the maximum value among the three calculations.
🔶 2. Momentum Factor Calculation
To make the ATR adaptive, the strategy incorporates a Momentum Factor (MF), which adjusts the ATR based on recent price movements.
Momentum = Close - Close
Stdev_Close = Standard Deviation of Close over n periods
Normalized_Momentum = Momentum / Stdev_Close (if Stdev_Close ≠ 0)
Momentum_Factor = Abs(Normalized_Momentum)
Where:
Close is the current closing price.
n is the momentum_period, a user-defined input (default is 7).
Standard Deviation measures the dispersion of closing prices over n periods.
Abs ensures the momentum factor is always positive.
🔶 3. Adaptive ATR Calculation
The Adaptive ATR (AATR) adjusts the traditional ATR based on the Momentum Factor, making it more responsive during volatile periods and smoother during consolidation.
Short_ATR = SMA(True Range, short_period)
Long_ATR = SMA(True Range, long_period)
Adaptive_ATR = /
Where:
SMA is the Simple Moving Average.
short_period and long_period are user-defined inputs (defaults are 3 and 7, respectively).
🔶 4. Trend Strength Calculation
The strategy quantifies the strength of the trend to filter out weak signals.
Price_Change = Close - Close
ATR_Multiple = Price_Change / Adaptive_ATR (if Adaptive_ATR ≠ 0)
Trend_Strength = SMA(ATR_Multiple, n)
🔶 5. Trend Signal Determination
If (Short_MA > Long_MA) AND (Trend_Strength > Trend_Strength_Threshold):
Trend_Signal = 1 (Strong Uptrend)
Elif (Short_MA < Long_MA) AND (Trend_Strength < -Trend_Strength_Threshold):
Trend_Signal = -1 (Strong Downtrend)
Else:
Trend_Signal = 0 (No Clear Trend)
🔶 6. Trend Confirmation with Price Action
Adaptive_ATR_SMA = SMA(Adaptive_ATR, atr_sma_period)
If (Trend_Signal == 1) AND (Close > Short_MA) AND (Adaptive_ATR > Adaptive_ATR_SMA):
Trend_Confirmed = True
Elif (Trend_Signal == -1) AND (Close < Short_MA) AND (Adaptive_ATR > Adaptive_ATR_SMA):
Trend_Confirmed = True
Else:
Trend_Confirmed = False
Local Performance
🔶 7. Multi-Step Take-Profit Mechanism
The strategy employs a 7-step take-profit system
█ Trade Direction
The SuperATR 7-Step Profit Strategy is designed to work in both long and short market conditions. By identifying strong uptrends and downtrends, it allows traders to capitalize on price movements in either direction.
Long Trades: Initiated when the market shows strong upward momentum and the trend is confirmed.
Short Trades: Initiated when the market exhibits strong downward momentum and the trend is confirmed.
█ Usage
To implement the SuperATR 7-Step Profit Strategy:
1. Configure the Strategy Parameters:
- Adjust the short_period, long_period, and momentum_period to match the desired sensitivity.
- Set the trend_strength_threshold to control how strong a trend must be before acting.
2. Set Up the Multi-Step Take-Profit Levels:
- Define ATR multipliers and fixed percentage levels according to risk tolerance and profit goals.
- Specify the percentage of the position to close at each level.
3. Apply the Strategy to a Chart:
- Use the strategy on instruments and timeframes where it has been tested and optimized.
- Monitor the positions and adjust parameters as needed based on performance.
4. Backtest and Optimize:
- Utilize TradingView's backtesting features to evaluate historical performance.
- Adjust the default settings to optimize for different market conditions.
█ Default Settings
Understanding default settings is crucial for optimal performance.
Short Period (3): Affects the responsiveness of the short-term MA.
Effect: Lower values increase sensitivity but may produce more false signals.
Long Period (7): Determines the trend baseline.
Effect: Higher values reduce noise but may delay signals.
Momentum Period (7): Influences adaptive ATR and trend strength.
Effect: Shorter periods react quicker to price changes.
Trend Strength Threshold (0.5): Filters out weaker trends.
Effect: Higher thresholds yield fewer but stronger signals.
ATR Multipliers: Set distances for ATR-based exits.
Effect: Larger multipliers aim for bigger moves but may reduce hit rate.
Fixed TP Levels (%): Control profit-taking on smaller moves.
Effect: Adjusting these levels affects how quickly profits are realized.
Exit Percentages: Determine how much of the position is closed at each TP level.
Effect: Higher percentages reduce exposure faster, affecting risk and reward.
Adjusting these variables allows you to tailor the strategy to different market conditions and personal risk preferences.
By integrating adaptive indicators and a multi-tiered exit strategy, the SuperATR 7-Step Profit Strategy offers a versatile tool for traders seeking to navigate varying market conditions effectively. Understanding and adjusting the key parameters enables traders to harness the full potential of this strategy.
Cari skrip untuk "range"

Universal Trend Following Strategy | QuantumRsearchUniversal All Assets Strategy by Rocheur
The Universal All Assets Strategy is a cutting-edge, trend-following algorithm designed to operate seamlessly across multiple asset classes, including equities, commodities, forex, and cryptocurrencies. This strategy leverages the power of eight unique indicators, offering traders robust, adaptive signals. Its dynamic logic, combined with a comprehensive risk management framework, allows for precision trading in a variety of market conditions.
Core Methodologies and Features
1. Eight Integrated Trend Indicators
At the heart of the Universal All Assets Strategy are eight sophisticated trend-following indicators, each designed to capture different facets of market behavior. These indicators work together to provide a multi-dimensional analysis of price trends, filtering out noise and reacting only to significant movements:
Directional Moving Averages : Tracks the primary market trend, offering a clear indication of long-term price direction, ideal for identifying sustained upward or downward movements.
Smoothed Moving Averages : Reduces short-term volatility and noise to reveal the underlying trend, enhancing signal clarity and helping traders avoid reacting to temporary price spikes.
RSI Loops : Utilizes the Relative Strength Index (RSI) to assess market momentum, using a unique for loop mechanism to smooth out data and enhance precision.
Supertrend Filters : This indicator dynamically adjusts to market volatility, closely following price action to detect significant breakouts or reversals. The Supertrend is a core component for identifying shifts in trend direction with minimal lag.
RVI for Loop : The Relative Volatility Index (RVI) measures the strength of market volatility. It is optimized with a for loop mechanism, which smooths out the data and improves directional cues, especially in choppy or sideways markets.
Hull for Loop : The Hull Moving Average is designed to minimize lag while offering a smooth, responsive trend line. The for loop mechanism further enhances this by making the Hull even more sensitive to trend shifts, ensuring faster reaction to market movements without generating excessive noise.
These indicators evaluate market conditions independently, assigning a score of 1 for bullish trends and -1 for bearish trends. The average score across all eight indicators is calculated for each time frame (or bar), and this score determines whether the strategy should enter, exit, or remain neutral in a trade.
2. Scoring and Signal Confirmation
The strategy’s confirmation system ensures that trades are initiated only when there is strong alignment across multiple indicators:
A Long Position (Buy) is initiated when the majority of indicators generate a bullish signal, i.e., the average score exceeds a predefined upper threshold.
A Short Position or Exit is triggered when the average score falls below a lower threshold, signaling a bearish trend or neutral market.
By using a majority-rule confirmation system, the strategy filters out weak signals, reducing the chances of reacting to market noise or false positives. This ensures that only robust trends—those supported by multiple indicators—trigger trades.
Adaptive Logic for All Asset Classes
The Universal All Assets Strategy stands out for its ability to adapt dynamically across different asset classes. Whether it’s applied to highly volatile assets like cryptocurrencies or more stable instruments like equities, the strategy fine-tunes its behavior to match the asset’s volatility profile and price behavior.
Volatility Filters : The system incorporates volatility-sensitive filters, such as the Average True Range (ATR) and standard deviation metrics, which dynamically adjust its sensitivity based on market conditions. This ensures the strategy remains responsive to significant price movements while filtering out inconsequential fluctuations.
This adaptability makes the Universal All Assets Strategy effective across diverse markets, providing consistent performance whether the market is trending, range-bound, or experiencing high volatility.
Customization and Flexibility
1. Directional Bias
The strategy offers traders the flexibility to set a customizable directional bias, allowing it to focus on:
Long-only trades during bullish markets.
Short-only trades during bear markets.
Bi-directional trades for those looking to capitalize on both uptrends and downtrends.
This bias can be fine-tuned based on market conditions, trader preference, or risk tolerance, without compromising the integrity of the overall signal-generation process.
2. Volatility Sensitivity
Traders can adjust the strategy’s volatility sensitivity through customizable settings. By modifying how the system reacts to volatility, traders can make the strategy more aggressive in high-volatility environments or more conservative in quieter markets, depending on their individual trading style.
Visual Representation of Component Behavior
One of the unique features of the strategy is its real-time visual representation of the eight indicators through a component table displayed on the chart. This table provides a clear overview of the current status of each indicator:
A score of 1 indicates a bullish signal.
A score of -1 indicates a bearish signal.
The table is updated at each time frame (bar), showing how each indicator is contributing to the overall trend decision. This real-time feedback allows traders to monitor the exact composition of the strategy’s signal, helping them better understand market dynamics.
Oscillator Visualization for Trend Detection
To complement the component table, the strategy includes a trend oscillator displayed beneath the price chart, offering a visual summary of the overall market direction:
Green bars represent bullish trends when the majority of indicators signal an uptrend.
Red bars represent bearish trends or a neutral (cash) position when the majority of indicators detect a downtrend.
This oscillator allows traders to quickly assess the market’s overall direction at a glance, without needing to analyze each individual indicator, providing a clear and immediate visual of the market trend.
Backtested and Forward-Tested for Real-World Conditions
The Universal All Assets Strategy has been thoroughly tested under real-world trading conditions, incorporating key factors like:
Slippage : Set at 20 ticks to represent real market fluctuations.
Order Size : Calculated as 10% of equity, ensuring appropriate risk exposure for realistic capital management.
Commission : A fee of 0.05% has been factored in to account for trading costs.
These settings ensure that the strategy’s performance metrics—such as the Sortino Ratio , Sharpe Ratio , Omega Ratio , and Profit Factor —are reflective of actual trading environments. The rigorous backtesting and forward-testing processes ensure that the strategy produces realistic results, making it compatible with the markets it is written for and demonstrating how the system would behave in live conditions. It also includes robust risk management tools to minimize drawdowns and preserve capital, making it suitable for both professional and retail traders.
Anti-Fragile Design and Realistic Expectations
The Universal All Assets Strategy is engineered to be anti-fragile, thriving in volatile markets by adjusting to turbulence rather than being damaged by it. This is a crucial feature that ensures the strategy remains effective even during times of significant market instability.
Moreover, the strategy is transparent about realistic expectations, acknowledging that no system can guarantee a 100% win rate and that past performance is not indicative of future results. This transparency fosters trust and provides traders with a realistic framework for long-term success, making it an ideal choice for traders looking to navigate complex market conditions with confidence.
Acknowledgment of External Code
Special credit goes to bii_vg, whose invite-only code was used with permission in the development of the Universal All Assets Strategy. Their contributions have been instrumental in refining certain aspects of this strategy, ensuring its robustness and adaptability across various markets.
Conclusion
The Universal All Assets Strategy by Rocheur offers traders a powerful, adaptable tool for capturing trends across a wide range of asset classes. Its eight-indicator confirmation system, combined with customizable settings and real-time visual representations, provides a comprehensive solution for traders seeking precision, flexibility, and consistency. Whether used in high-volatility markets or more stable environments, the strategy’s dynamic adaptability, transparent logic, and robust testing make it an excellent choice for traders aiming to maximize performance while managing risk effectively.

Support Resistance Pivot EMA Scalp Strategy [Mauserrifle]A strategy that creates signals based on: pivots, EMA 9+20, RSI, ATR, VWAP, wicks and volume.
The strategy is developed as a helper for quick long option scalping. This strategy is primarily designed for intraday trading on the 2m SPY chart with extended hours. However, users can adapt it for use on different symbols and timeframes. These signals are meant as a helper rather than fully automated trading bots.
One of the key elements is its pivot-based calculation, driven by my integrated indicator "Support and Resistance Pivot Points/Lines ". It enables multi-timeframe pivot calculations which are used to generate the signals and offers customizability, allowing you to define rounding methods and cooldown periods to refine pivot levels. The pivots, in combination with EMA crossovers, VWAP trend, and additional filters (RSI, ATR, VWAP, wicks and volume), create an entry and exit strategy for scalping opportunities that is useful for 0/1 DTE options with an average trade time of six minutes with the default setup for SPY. Option trading should be done outside TradingView. At this moment of release there is no option trading support.
All parameters used in the strategy are tweaked based on deep backtests results and real-time behavior. Be mindful that past performance does not guarantee future results.
The strategy is designed for intermediate and advanced users who are familiar intraday option scalping techniques.
How It Works
The strategy identifies entries based on multiple conditions, including: recently above pivot, recent EMA crossovers, RSI range, candle patterns, and VWAP uptrend. It avoids trades below the VWAP lower band due to poor backtesting results in those conditions. It creates a great number of signals when it detects an uptrend, which entails: VWAP and its lower/upper band slopes are going up, and the number of next high pivot points is greater than the number of lower pivot points. This indicates that we hope it will keep going up. In historical testing, this showed favorable results. This uptrend criteria runs on 15m charts max (where up to the VWAP effectiveness is the greatest).
The strategy also checks for candle and volume patterns, identified in backtesting to improve entry levels on historic data. Which include:
A red candle after multiple green ones, hoping to jump on a trend during a small pullback
Zero lower wick
Percentage and volume is up after lower volume candles
Percentage is up and the first and second EMA slopes are going up
Percentage is up, the first EMA is higher than the second, the price low is below the second EMA and price close above it
The VWAP uptrend overrules the candle and volume conditions (thus lots of signals during those moments).
The above is the base for many signals. There is a strict mode that adds extra checks such as:
not trading when there is no next low or high pivot
requiring a VWAP uptrend only
minimum candle percentages
This mode is for analyzing history and seeing performance during these conditions. It is worth it to create a separate alert for strict mode so you are aware of these conditions during trading.
When no stop has been defined, exits will always happen on pivot crossunder confirmations. If a stop is defined (default config), the strategy exits a position when:
the position is negative or no trail has been set
at least 1 bar has past
OR no stop has been defined (overrules previous)
trail has not been activated
The second exit condition happens when the close is below first EMA(9 by default) and when:
the position has been above first EMA
the gap between close and last pivot isn't small
the position is negative or no trail has been set
OR no stop has been defined (overrules above)
trail has not been activated
There are some more variations on this but the above are the most common. These exit conditions are a safety net because the strategy heavily relies on and favors stops. The settings allow changing stops, profit takers and trails. You can configure it to always sell without the conditions above.
The script will paint the pivot lines, trailing activation/stops, EMAs and entry/exits; with extra information in the data panel. For a complete view add VWAP and RSI to your chart, which are available from TradingView official indicator library. The strategy will not rely on those added indicators since VWAP and RSI are programmed in. You can add them to track the behavior of the signals based on these filters you have configured and have a complete view trading this strategy.
As mentioned earlier, the default settings are built for SPY 2m charts, with extended hours and real-time data. Open the strategy on this chart to study how all input parameters are used. If you don't have real-time data you need to adjust the minimum volume settings (set it to 0 at first).
The backtest
The default backtest configuration is set up to simulate SPY option trading.
Start capital is set to 10,000 and we risk around 5% of that per trade (1 contract)
Commission is set to 0.005%. The reason: at the time of this publication the SPY index price is approximately $580. Two ITM 0/1 DTE options contracts, each priced around $280, which is approximately $560. The typical commission for such a trade is around $3. To simulate this commission in the backtest on the SPY index itself, a commission of 0.005% per trade has been applied, approximating the options trading costs.
Slippage of 3 is set reflecting liquid SPY
The bar magnifier feature is turned on to have more realistic fills
Trading
In backtesting, setting commission and slippage to 0 on the SPY 2m chart shows many trades result around breaking even. Personally, I view them as an opportunity and safety net to help manage emotional decisions for exits. The signals are designed for short option scalps, allowing traders to take small profits and potentially re-enter during the strategy’s position window. It's advisable to take small potential profits, such as 4%, whenever the opportunity arises and consider re-entering if the setup still looks favorable, for example price still above ema9. Exiting a long position below ema9 is a common strategy for 2m scalping.
The average trade duration is approximately 6 minutes (3 bars). The choice between ITM (in-the-money), ATM (at-the-money), or OTM (out-of-the-money) options will depend on your trading style. Personally, I’ve seen better results with ITM options because they tend to move more in sync with the underlying index, thanks to their higher delta.
It’s important to note that the signals are designed to be a helper for manual trading rather than to automate a bot. Users are encouraged to take small profits and re-enter positions if favorable conditions persist. Be mindful that past performance does not guarantee future results.
For the default SPY setup the losses will mostly be 4-10% for ITM options. Be mindful of extreme volatile conditions where losses may reach 30% quickly, especially when trading ATM/OTM options.
The following settings can be changed:
8 pivot timeframes with left/right bars and days rendered
Here you can configure the timeframes for the pivots, which are crucial. The strategy wants that a crossover has happened recently (so it might enter after a crossunder if the crossover was recent) or the price is still above the crossed pivot.
When you decide to use a pivot timeframe higher than your chart, make sure it aligns the same starting point as the chart timeframe. As stated in the 43000478429 docs, there is a dependency between the resolution and the alignment of a starting point:
1–14 minutes — aligns to the beginning of a week
15–29 minutes — aligns to the beginning of a month
from 30 minutes and higher — aligns to the beginning of a year
This alignment also affects the setting of rendered days. I recommend a max value of 5 days for 1-14 minutes timeframes.
Also make sure a higher pivot timeframe can be divided by the lower. For instance I had repaint issues using 3m pivots on a 2m chart. But 4m pivots work fine.
Please look up docs 43000478429 to make sure this information is still up to date.
Pivot rounding
The pivot rounding option is used to add pivots based on a rounded price and limit the number of pivots. While this feature is disabled by default it can be useful with tweaking strategy variations, because many orders are placed at rounded levels and tend to act as strong price barriers.
There are multiple rounding methods: round, ceil/floor, roundn (decimal) and rounding to the minimal tick.
The next feature is a powerful extension called "Cooldown rounding":
Pivot cooldown rounding
This rounds new pivot levels for a cooldown period to keep the previous pivot line instead of adding a new line when they match the rounded value within the cooldown period. The existing line will be extended. This feature is useful because it makes sure the initial line is added to the exact high/low pivot level but any future lines within the rounding will just extend the existing line. This limits the number of pivots while still having precise levels (which normal rounding lacks) and allows more precise pivot trading.
This feature also helps ensure that the number of rendered lines will not exceed 500 too much, which is the render limit on TradingView.
You can set a maximum minutes for the cooldown. The default is 3 years which will enable the cooldown rounding permanently on the intraday (due to the max bar limit).
Pivot always added when new higher/lower pivot
When using cooldown rounding, one may find it useful to override this behavior when a new lower or higher pivot level has been reached. When enabled the new level will be added despite the fact that they may be rounded the same in the cooldown check. This is a good balance between limiting pivots but also allowing preciser trading.
VWAP bands multiplier
This is used to tweak the inner VWAP working for the upper and lower band. The default VWAP multiplier (0.9) is set based on backtesting since it performed better on historic data (the strategy does not trade below the lowerband). When you add the VWAP indicator from the TradingView library to the chart, make sure it uses the same multiplier setting as within this strategy so you have a correct view of the conditions the strategy acts on.
ATR EMA smoothing length
Used to tweak the ATR EMA smoothing. By default it is set up to 4 based on deep backtesting historic data.
EMA lengths
Changing the EMA length allows you to fine tune the EMA crossing behavior. By default the strategy is set up to EMA 9 and 20 which are considered commonly used values on the 2-minute chart.
Trading intraday time restrictions
For intraday charts you can configure when the strategy starts trading after market open and when it stops, including a hard sell. This makes sure there are no open positions left for the day during backtesting and can also aid in your trading style. For example some scalpers will not trade in the first two hours. Having no signals during this time can be beneficial. It is possible to configure these settings based on the number of bars or minutes.
Not trading on days the market closes earlier
By default the strategy does not trade on days the market closes earlier in the US. This makes sure there are no open positions left open during backtesting. Make sure to change it when using it on such a day. The days are: day before independence day, day after thanksgiving, Christmas eve and new years eve.
Not trading below VWAP lowerband
Backtesting has shown poor performance when trading below the VWAP lowerband but you are free to allow it to trade in such conditions. Past performance does not guarantee future results.
Minimum volume
A minimum volume can be set up. The current value is based on better deep backtest results for SPY using real-time data (48000). When you do not have a data plan for SPY, please set it to 0 and tweak based on backtests.
Minimum ATRP
The strategy has shown during my trading that it is sensitive to higher ATRP values and more volatile market conditions. There is more chance the index moves and we can profit from this during option scalping (if it moves in your favor). The default is based on SPY backtesting (0.04%), as a balance to have a lot of trades but also capture minimal movement.
RSI range
A RSI range can be set using a minimum and maximum value so we can limit trading during overbought/oversold conditions. Backtesting for SPY has shown the strategy performs better on historic data within a tighter range, so a default range has been set to 40-65.
Allow orders on every tick (no effect on stop/profit/trail)
This setting is used to allow orders on every tick. The strategy has been developed without trading on every tick but you can change this, for example when you have configured a setup different than the default configuration that you know works well with this. The default setup will not work well with it due to too many constant signals.
Stop percentage + ATRP threshold
One of the most important settings for managing the risk. I recommend setting a stop percentage first and later the ATRP threshold where the stop is calculated based on the current ATRP value. The calculated value will only be in effect when it is greater than the normal stop--the normal stop acts as baseline. The default stop is low (0.03). With a default ATRP threshold stop of 1.12, the calculated value overrules the normal stop when the value is greater. 0.03 acts as a minimum value but in reality the stop will most likely be higher on average for SPY with the default ATRP threshold.
For the default SPY setup the losses will be around 4-10% for ITM options. Be mindful of extreme volatile conditions where losses may reach 30% quickly, especially when trading ATM/OTM options.
Profit taker percentage + ATRP threshold
Same principles as the stop percentage above, but for profit taking. There is a very high ATRP threshold of 4 set by default. Backtests showed that trailing stops perform better on historic data.
Trailing stop
Used to set up a trailing stop. A useful feature to secure profit after a run-up, or get out with a small loss after initial activation. It is important to not use too tight values because they will give unrealistic backtest results and trigger too fast in real-time. Both the trail activation level and trail stop itself can be configured with a percentage value and ATRP value. I recommend setting up the ATRP last. By default the values are 0.05 for activation and 0.03 for the stop based on SPY real-time behavior.
Always sell on pivot crossunder confirmation
The strategy includes pivot crossunder confirmations as sell condition. By default it will not sell on every crossunder confirmation but checks for different conditions (explained in detail earlier in this description). You can change this behavior.
Always sell below first EMA when position has been above
The strategy sells below the first EMA when the position has been above it. By default it will not always sell but checks for different conditions (mentioned earlier in this description). You can change this behavior.
Buy modes pivot
By default the strategy buys between pivots as long as there has been a pivot crossover and EMAs crossover recently or price is still above it. You can change the behavior so it only buys on pivot crossovers or pivot crossover confirmations. Backtesting on the default setup shows decreased performance but for other strategy variations and pivot setups this feature can be useful since many scalpers do not buy between pivots.
Strict mode
There is a strict mode that adds extra checks such as not trading when there is no next low or high pivot, requiring a VWAP uptrend only and minimum candle percentages. This mode is for analyzing history and seeing performance during these conditions. It is worth it to create a separate alert for strict mode so you are aware of these conditions during trading. The deep backtests improved with these setting but past performance does not guarantee future results.
In the strict mode section you can override the stop, minimum ATRP, set up a minimum percentage, only trade VWAP uptrends and to not trade candles without a wick.
A summary and some extra detail
At the time of release only long trades are supported
The strategy is meant for quick scalping but one might find other uses for it
Enable extended hours on intraday charts so it captures more pivots
It does not trade extended hours (pre and post market) since options do not trade during those times
real-time data is recommended and required if a symbol has delayed data by default
You can configure that it trades minutes after market open and hard sells minutes after market open
The entries have a specific label text, example: "833 LE1 / 569.71 / P:569.8". This means: / / . The condition number is only for development/debug purposes for me when you have an issue.
The strategy cannot be tweaked to work on multiple symbols and timeframes with a single config. So you will have to make a config for every timeframe and symbol. I recommend using the Indicator Templates feature of TradingView. This way you can save the settings per timeframe and symbol
The strategy is per default config very dependent on (trailing) stops because it trades between pivots too. It wants that a pivot and EMA crossover has happened more recently than a crossunder. But you can change this behavior to always force crossover buys and crossunder sells.
It’s recommended to set up alerts to notify you of entry and exit signals. Watching the chart alone might cause you to miss trades, especially in fast-moving markets.
Only a max of 500 lines can be rendered on the chart, but the strategy will function with more under the hood. When you exceed 500 you will notice the beginning of the chart has no pivots, but beneath everything functions for backtesting.
Changing settings
Changing the settings for a different symbol and/or timeframe can be a challenging task. Here's a how-to you could use the first time to help you get going:
Set commission and slippage to 0. I prefer to do this so it is more clear whether you are balancing on break-even trades
Enable the pivot timeframe equal or above your chart timeframe. Avoid repainting as discussed earlier by choosing timeframes that align with the same timeframe
Set all volume, ATR, stop, profit takers and trail values to 0
Make sure strict mode is disabled at the bottom of the settings
You now have a clean state and you should see the backtest results purely based on pivot and EMA conditions
Tweak the stop and profit taker, beginning with the simple values and then ATRP threshold
At the last moment tweak the trailing stops. Tight trailing stops create an unrealistic backtest so you will need to tweak them based on real-time behavior of the symbol you're using which you will have to monitor during signals while the market is open. The default values are low (2m intraday SPY). Only with the bar magnifier feature it is somewhat possible to tweak realistic with history data. The tighter they are, the more unrealistic your backtest results. As a starting point, set the trailing stop low and find the highest activation level that doesn't change the results drastically, then increase the stop to the value you think reflects real-time behavior.
Keep refining by testing it during real-time behavior. Does it exit too early according to your own judgment? You need to increase the stop and maybe the activation level.
I hope you will find this useful!
DISCLAIMER
Trading is risky & most day traders lose money. This indicator is purely for informational & educational purposes only. Past performance does not guarantee future results.

Multi-Step FlexiSuperTrend - Strategy [presentTrading]At the heart of this endeavor is a passion for continuous improvement in the art of trading
█ Introduction and How it is Different
The "Multi-Step FlexiSuperTrend - Strategy " is an advanced trading strategy that integrates the well-known SuperTrend indicator with a nuanced and dynamic approach to market trend analysis. Unlike conventional SuperTrend strategies that rely on static thresholds and fixed parameters, this strategy introduces multi-step take profit mechanisms that allow traders to capitalize on varying market conditions in a more controlled and systematic manner.
What sets this strategy apart is its ability to dynamically adjust to market volatility through the use of an incremental factor applied to the SuperTrend calculation. This adjustment ensures that the strategy remains responsive to both minor and major market shifts, providing a more accurate signal for entries and exits. Additionally, the integration of multi-step take profit levels offers traders the flexibility to scale out of positions, locking in profits progressively as the market moves in their favor.
BTC 6hr Long/Short Performance
█ Strategy, How it Works: Detailed Explanation
The Multi-Step FlexiSuperTrend strategy operates on the foundation of the SuperTrend indicator, but with several enhancements that make it more adaptable to varying market conditions. The key components of this strategy include the SuperTrend Polyfactor Oscillator, a dynamic normalization process, and multi-step take profit levels.
🔶 SuperTrend Polyfactor Oscillator
The SuperTrend Polyfactor Oscillator is the heart of this strategy. It is calculated by applying a series of SuperTrend calculations with varying factors, starting from a defined "Starting Factor" and incrementing by a specified "Increment Factor." The indicator length and the chosen price source (e.g., HLC3, HL2) are inputs to the oscillator.
The SuperTrend formula typically calculates an upper and lower band based on the average true range (ATR) and a multiplier (the factor). These bands determine the trend direction. In the FlexiSuperTrend strategy, the oscillator is enhanced by iteratively applying the SuperTrend calculation across different factors. The iterative process allows the strategy to capture both minor and significant trend changes.
For each iteration (indexed by `i`), the following calculations are performed:
1. ATR Calculation: The Average True Range (ATR) is calculated over the specified `indicatorLength`:
ATR_i = ATR(indicatorLength)
2. Upper and Lower Bands Calculation: The upper and lower bands are calculated using the ATR and the current factor:
Upper Band_i = hl2 + (ATR_i * Factor_i)
Lower Band_i = hl2 - (ATR_i * Factor_i)
Here, `Factor_i` starts from `startingFactor` and is incremented by `incrementFactor` in each iteration.
3. Trend Determination: The trend is determined by comparing the indicator source with the upper and lower bands:
Trend_i = 1 (uptrend) if IndicatorSource > Upper Band_i
Trend_i = 0 (downtrend) if IndicatorSource < Lower Band_i
Otherwise, the trend remains unchanged from the previous value.
4. Output Calculation: The output of each iteration is determined based on the trend:
Output_i = Lower Band_i if Trend_i = 1
Output_i = Upper Band_i if Trend_i = 0
This process is repeated for each iteration (from 0 to 19), creating a series of outputs that reflect different levels of trend sensitivity.
Local
🔶 Normalization Process
To make the oscillator values comparable across different market conditions, the deviations between the indicator source and the SuperTrend outputs are normalized. The normalization method can be one of the following:
1. Max-Min Normalization: The deviations are normalized based on the range of the deviations:
Normalized Value_i = (Deviation_i - Min Deviation) / (Max Deviation - Min Deviation)
2. Absolute Sum Normalization: The deviations are normalized based on the sum of absolute deviations:
Normalized Value_i = Deviation_i / Sum of Absolute Deviations
This normalization ensures that the oscillator values are within a consistent range, facilitating more reliable trend analysis.
For more details:
🔶 Multi-Step Take Profit Mechanism
One of the unique features of this strategy is the multi-step take profit mechanism. This allows traders to lock in profits at multiple levels as the market moves in their favor. The strategy uses three take profit levels, each defined as a percentage increase (for long trades) or decrease (for short trades) from the entry price.
1. First Take Profit Level: Calculated as a percentage increase/decrease from the entry price:
TP_Level1 = Entry Price * (1 + tp_level1 / 100) for long trades
TP_Level1 = Entry Price * (1 - tp_level1 / 100) for short trades
The strategy exits a portion of the position (defined by `tp_percent1`) when this level is reached.
2. Second Take Profit Level: Similar to the first level, but with a higher percentage:
TP_Level2 = Entry Price * (1 + tp_level2 / 100) for long trades
TP_Level2 = Entry Price * (1 - tp_level2 / 100) for short trades
The strategy exits another portion of the position (`tp_percent2`) at this level.
3. Third Take Profit Level: The final take profit level:
TP_Level3 = Entry Price * (1 + tp_level3 / 100) for long trades
TP_Level3 = Entry Price * (1 - tp_level3 / 100) for short trades
The remaining portion of the position (`tp_percent3`) is exited at this level.
This multi-step approach provides a balance between securing profits and allowing the remaining position to benefit from continued favorable market movement.
█ Trade Direction
The strategy allows traders to specify the trade direction through the `tradeDirection` input. The options are:
1. Both: The strategy will take both long and short positions based on the entry signals.
2. Long: The strategy will only take long positions.
3. Short: The strategy will only take short positions.
This flexibility enables traders to tailor the strategy to their market outlook or current trend analysis.
█ Usage
To use the Multi-Step FlexiSuperTrend strategy, traders need to set the input parameters according to their trading style and market conditions. The strategy is designed for versatility, allowing for various market environments, including trending and ranging markets.
Traders can also adjust the multi-step take profit levels and percentages to match their risk management and profit-taking preferences. For example, in highly volatile markets, traders might set wider take profit levels with smaller percentages at each level to capture larger price movements.
The normalization method and the incremental factor can be fine-tuned to adjust the sensitivity of the SuperTrend Polyfactor Oscillator, making the strategy more responsive to minor market shifts or more focused on significant trends.
█ Default Settings
The default settings of the strategy are carefully chosen to provide a balanced approach between risk management and profit potential. Here is a breakdown of the default settings and their effects on performance:
1. Indicator Length (10): This parameter controls the lookback period for the ATR calculation. A shorter length makes the strategy more sensitive to recent price movements, potentially generating more signals. A longer length smooths out the ATR, reducing sensitivity but filtering out noise.
2. Starting Factor (0.618): This is the initial multiplier used in the SuperTrend calculation. A lower starting factor makes the SuperTrend bands closer to the price, generating more frequent trend changes. A higher starting factor places the bands further away, filtering out minor fluctuations.
3. Increment Factor (0.382): This parameter controls how much the factor increases with each iteration of the SuperTrend calculation. A smaller increment factor results in more gradual changes in sensitivity, while a larger increment factor creates a wider range of sensitivity across the iterations.
4. Normalization Method (None): The default is no normalization, meaning the raw deviations are used. Normalization methods like Max-Min or Absolute Sum can make the deviations more consistent across different market conditions, improving the reliability of the oscillator.
5. Take Profit Levels (2%, 8%, 18%): These levels define the thresholds for exiting portions of the position. Lower levels (e.g., 2%) capture smaller profits quickly, while higher levels (e.g., 18%) allow positions to run longer for more significant gains.
6. Take Profit Percentages (30%, 20%, 15%): These percentages determine how much of the position is exited at each take profit level. A higher percentage at the first level locks in more profit early, reducing exposure to market reversals. Lower percentages at higher levels allow for a portion of the position to benefit from extended trends.

Fractal Breakout Trend Following StrategyOverview
The Fractal Breakout Trend Following Strategy is a trend-following system which utilizes the Willams Fractals and Alligator to execute the long trades on the fractal's breakouts which have a high probability to be the new uptrend phase beginning. This system also uses the normalized Average True Range indicator to filter trades after a large moves, because it's more likely to see the trend continuation after a consolidation period. Strategy can execute only long trades.
Unique Features
Trend and volatility filtering system: Strategy uses Williams Alligator to filter the counter-trend fractals breakouts and normalized Average True Range to avoid the trades after large moves, when volatility is high
Configurable Trading Periods: Users can tailor the strategy to specific market windows, adapting to different market conditions.
Flexible Risk Management: Users can choose the stop-loss percent (by default = 3%) for trades, but strategy also has the dynamic stop-loss level using down fractals.
Methodology
The strategy places stop order at the last valid fractal breakout level. Validity of this fractal is defined by the Williams Alligator indicator. If at the moment of time when price breaking the last fractal price is higher than Alligator's teeth line (8 period SMA shifted 5 bars in the future) this is a valid breakout. Moreover strategy has the additional volatility filtering system using normalized ATR. It calculates the average normalized ATR for last user-defined number of bars and if this value lower than the user-defined threshold value the long trade is executed.
When trade is opened, script places the stop loss at the price higher of two levels: user defined stop-loss from the position entry price or down fractal validation level. The down fractal is valid with the rule, opposite as the up fractal validation. Price shall break to the downside the last down fractal below the Willians Alligator's teeth line.
Strategy has no fixed take profit. Exit level changes with the down fractal validation level. If price is in strong uptrend trade is going to be active until last down fractal is not valid. Strategy closes trade when price hits the down fractal validation level.
Risk Management
The strategy employs a combined approach to risk management:
It allows positions to ride the trend as long as the price continues to move favorably, aiming to capture significant price movements. It features a user-defined stop-loss parameter to mitigate risks based on individual risk tolerance. By default, this stop-loss is set to a 3% drop from the entry point, but it can be adjusted according to the trader's preferences.
Justification of Methodology
This strategy leverages Williams Fractals to open long trade when price has broken the key resistance level to the upside. This resistance level is the last up fractal and is shall be broken above the Williams Alligator's teeth line to be qualified as the valid breakout according to this strategy. The Alligator filtering increases the probability to avoid the false breakouts against the current trend.
Moreover strategy has an additional filter using Average True Range(ATR) indicator. If average value of ATR for the last user-defined number of bars is lower than user-defined threshold strategy can open the long trade according to open trade condition above. The logic here is following: we want to open trades after period of price consolidation inside the range because before and after a big move price is more likely to be in sideways, but we need a trend move to have a profit.
Another one important feature is how the exit condition is defined. On the one hand, strategy has the user-defined stop-loss (3% below the entry price by default). It's made to give users the opportunity to restrict their losses according to their risk-tolerance. On the other hand, strategy utilizes the dynamic exit level which is defined by down fractal activation. If we assume the breaking up fractal is the beginning of the uptrend, breaking down fractal can be the start of downtrend phase. We don't want to be in long trade if there is a high probability of reversal to the downside. This approach helps to not keep open trade if trend is not developing and hold it if price continues going up.
Backtest Results
Operating window: Date range of backtests is 2023.01.01 - 2024.05.01. It is chosen to let the strategy to close all opened positions.
Commission and Slippage: Includes a standard Binance commission of 0.1% and accounts for possible slippage over 5 ticks.
Initial capital: 10000 USDT
Percent of capital used in every trade: 30%
Maximum Single Position Loss: -3.19%
Maximum Single Profit: +24.97%
Net Profit: +3036.90 USDT (+30.37%)
Total Trades: 83 (28.92% win rate)
Profit Factor: 1.953
Maximum Accumulated Loss: 963.98 USDT (-8.29%)
Average Profit per Trade: 36.59 USDT (+1.12%)
Average Trade Duration: 72 hours
These results are obtained with realistic parameters representing trading conditions observed at major exchanges such as Binance and with realistic trading portfolio usage parameters.
How to Use
Add the script to favorites for easy access.
Apply to the desired timeframe and chart (optimal performance observed on 4h and higher time frames and the BTC/USDT).
Configure settings using the dropdown choice list in the built-in menu.
Set up alerts to automate strategy positions through web hook with the text: {{strategy.order.alert_message}}
Disclaimer:
Educational and informational tool reflecting Skyrex commitment to informed trading. Past performance does not guarantee future results. Test strategies in a simulated environment before live implementation

IsAlgo - CandleWave Channel Strategy► Overview:
The CandleWave Channel Strategy uses an exponential moving average (EMA) combined with a custom true range function to dynamically calculate a multi-level price channel, helping traders identify potential trend reversals and price pullbacks.
► Description:
The CandleWave Channel Strategy is built around an EMA designed to identify potential reversal points in the market. The channel’s main points are calculated using this EMA, which serves as the foundation for the strategy’s dynamic price channel. The channel edges are determined using a proprietary true range function that measures the distance between the highs and lows of price movements over a specific period. By factoring in the maximum distance between highs and lows and averaging these values over the period, the strategy creates a responsive channel that adapts to current market conditions. The channel consists of five levels, each representing different degrees of trend tension.
The strategy continuously monitors the price in relation to the channel edges. When a candle closes outside one of these edges, it indicates a potential price reversal. This outside-close candle acts as a signal for a possible trend change, prompting the strategy to prepare for a trade entry. Upon detecting an outside-close candle, the strategy triggers an entry. The logic behind this is that when the price moves outside the defined channel, it is likely to revert back within the channel and move towards the opposite edge. The strategy aims to capitalize on this reversion by entering trades based on these signals.
Traders can adjust the channel’s length, levels, and minimum distance to tailor it to different market conditions. They can also define the characteristics of the entry candle, such as its size, body, and relative position to previous candles, to ensure it meets specific conditions before triggering a trade. Additionally, the strategy permits the specification of trading hours and days, enabling traders to focus on preferred market periods. Exit can be configured based on profit/loss limits, trade duration, and band reversal signals or other criteria.
How it Works:
Channel Calculation: The strategy continuously updates the channel edges using the EMA and true range function.
Signal Detection: It waits for a candle to close outside the channel edges.
Trade Entry: When an outside-close candle is detected, the strategy enters a trade expecting the price to revert to the opposite channel edge.
Customization: Users can define the characteristics of the entry candle, such as its size relative to previous candles, to ensure it meets specific conditions before triggering a trade.
↑ Long Trade Example:
The entry candle closes below the channel level, indicating a potential upward reversal. The strategy enters a long position expecting the price to move towards the upper levels.
↓ Short Trade Example:
The entry candle closes above the channel level, signaling a potential downward reversal. The strategy enters a short position anticipating the price to revert towards the lower levels.
► Features and Settings:
⚙︎ Channel: Adjust the channel’s length, levels, and minimum distance to suit different market conditions and trading styles.
⚙︎ Entry Candle: Customize entry criteria, including candle size, body, and relative position to previous candles for accurate signal generation.
⚙︎ Trading Session: Define specific trading hours during which the strategy operates, restricting trades to preferred market periods.
⚙︎ Trading Days: Specify active trading days to avoid certain days of the week.
⚙︎ Backtesting: backtesting for a selected period to evaluate strategy performance. This feature can be deactivated if not needed.
⚙︎ Trades: Configure trade direction (long, short, or both), position sizing (fixed or percentage-based), maximum number of open trades, and daily trade limits.
⚙︎ Trades Exit: Set profit/loss limits, specify trade duration, or exit based on band reversal signals.
⚙︎ Stop Loss: Choose from various stop-loss methods, including fixed pips, ATR-based, or highest/lowest price points within a specified number of candles. Trades can also be closed after a certain number of adverse candle movements.
⚙︎ Break Even: Adjust stop loss to break even once predefined profit levels are reached, protecting gains.
⚙︎ Trailing Stop: Implement a trailing stop to adjust the stop loss as the trade becomes profitable, securing gains and potentially capturing further upside.
⚙︎ Take Profit: Set up to three take-profit levels using methods such as fixed pips, ATR, or risk-to-reward ratios. Alternatively, specify a set number of candles moving in the trade’s direction.
⚙︎ Alerts: Comprehensive alert system to notify users of significant actions, including trade openings and closings. Supports dynamic placeholders for take-profit levels and stop-loss prices.
⚙︎ Dashboard: Visual display on the chart providing detailed information about ongoing and past trades, aiding users in monitoring strategy performance and making informed decisions.
► Backtesting Details:
Timeframe: 30-minute GBPJPY chart
Initial Balance: $10,000
Order Size: 500 units
Commission: 0.02%
Slippage: 5 ticks

Calculus Free Trend Strategy for Crypto & StocksObjective :
The Correlation Channel Trading Strategy is designed to identify potential entry points based on the relationship between price movements and a correlation channel. The strategy aims to capture trends within the channel while managing risk effectively.
Parameters :
Length: Determines the period for calculating moving averages and the true range, influencing the sensitivity of the strategy to price movements.
Multiplier: Adjusts the width of the correlation channel, providing flexibility to adapt to different market conditions.
Inputs :
Asset Symbol: Allows users to specify the financial instrument for analysis.
Timeframe: Defines the timeframe for data aggregation, enabling customization based on trading preferences.
Plot Correlation Channel: Optional input to visualize the correlation channel on the price chart.
Methodology :
Data Acquisition: The strategy fetches OHLC (Open, High, Low, Close) data for the specified asset and timeframe. In this case we use COINBASE:BTCUSD
Calculation of Correlation Channel: It computes the squared values for OHLC data, calculates the average value (x), and then calculates the square root of x to derive the source value. Additionally, it calculates the True Range as the difference between high and low prices.
Moving Averages: The strategy calculates moving averages (MA) for the source value and the True Range, which form the basis for defining the correlation channel.
Upper and Lower Bands: Using the MA and True Range, the strategy computes upper and lower bands of the correlation channel, with the width determined by the multiplier.
Entry Conditions: Long positions are initiated when the price crosses above the upper band, signaling potential overbought conditions. Short positions are initiated when the price crosses below the lower band, indicating potential oversold conditions.
Exit Conditions: Stop-loss mechanisms are incorporated directly into the entry conditions to manage risk. Long positions are exited if the price falls below a predefined stop-loss level, while short positions are exited if the price rises above the stop-loss level.
Strategy Approach: The strategy aims to capitalize on trends within the correlation channel, leveraging systematic entry signals while actively managing risk through stop-loss orders.
Backtest Details : For the purpose of this test I used the entire data available for BTCUSD Coinbase, with 10% of capital allocation and 0.1% comission for entry/exit(0.2% total). Can be also used with other both directly correlated with current settings of BTC or with new ones
Advantages :
Provides a systematic approach to trading based on quantifiable criteria.
Offers flexibility through customizable parameters to adapt to various market conditions.
Integrates risk management through predefined stop-loss mechanisms.
Limitations :
Relies on historical price data and technical indicators, which may not always accurately predict future price movements.
May generate false signals during periods of low volatility or erratic price behavior.
Requires continuous monitoring and adjustment of parameters to maintain effectiveness.
Conclusion :
The Correlation Channel Trading Strategy offers traders a structured framework for identifying potential entry points within a defined price channel. By leveraging moving averages and true range calculations, the strategy aims to capture trends while minimizing risk through stop-loss mechanisms. While no strategy can guarantee success in all market conditions, the Correlation Channel Trading Strategy provides a systematic approach to trading that can enhance decision-making and risk management for traders.

Long EMA Strategy with Advanced Exit OptionsThis strategy is designed for traders seeking a trend-following system with a focus on precision and adaptability.
**Core Strategy Concept**
The essence of this strategy lies in use of Exponential Moving Averages (EMAs) to identify potential long (buy) positions based on the relative positions of short-term, medium-term, and long-term EMAs. The use of EMAs is a classic yet powerful approach to trend detection, as these indicators smooth out price data over time, emphasizing the direction of recent price movements and potentially signaling the beginning of new trends.
**Customizable Parameters**
- **EMA Periods**: Users can define the periods for three EMAs - long-term, medium-term, and short-term - allowing for a tailored approach to capture trends based on individual trading styles and market conditions.
- **Volatility Filter**: An optional Average True Range (ATR)-based volatility filter can be toggled on or off. When activated, it ensures that trades are only entered when market volatility exceeds a user-defined threshold, aiming to filter out entries during low-volatility periods which are often characterized by indecisive market movements.
- **Trailing Stop Loss**: A trailing stop loss mechanism, expressed as a percentage of the highest price achieved since entry, provides a dynamic way to manage risk by allowing profits to run while cutting losses.
- **EMA Exit Condition**: This advanced exit option enables closing positions when the short-term EMA crosses below the medium-term EMA, serving as a signal that the immediate trend may be reversing.
- **Close Below EMA Exit**: An additional exit condition, which is disabled by default, allows positions to be closed if the price closes below a user-selected EMA. This provides an extra layer of flexibility and risk management, catering to traders who prefer to exit positions based on specific EMA thresholds.
**Operational Mechanics**
Upon activation, the strategy evaluates the current price in relation to the set EMAs. A long position is considered when the current price is above the long-term EMA, and the short-term EMA is above the medium-term EMA. This setup aims to identify moments where the price momentum is strong and likely to continue.
The strategy's versatility is further enhanced by its optional settings:
- The **Volatility Filter** adjusts the sensitivity of the strategy to market movements, potentially improving the quality of the entries during volatile market conditions.
The Average True Range (ATR) is a key component of this filter, providing a measure of market volatility by calculating the average range between the high and low prices over a specified number of periods. Here's how you can adjust the volatility filter settings for various market conditions, focusing on filtering out low-volatility markets:
Setting Examples for Volatility Filter
1. High Volatility Markets (e.g., Cryptocurrencies, Certain Forex Pairs):
ATR Periods: 14 (default)
ATR Multiplier: Setting the multiplier to a lower value, such as 1.0 or 1.2, can be beneficial in high-volatility markets. This sensitivity allows the strategy to react to volatility changes more quickly, ensuring that you're entering trades during periods of significant movement.
2. Medium Volatility Markets (e.g., Major Equity Indices, Medium-Volatility Forex Pairs):
ATR Periods: 14 (default)
ATR Multiplier: A multiplier of 1.5 (default) is often suitable for medium volatility markets. It provides a balanced approach, ensuring that the strategy filters out low-volatility conditions without being overly restrictive.
3. Low Volatility Markets (e.g., Some Commodities, Low-Volatility Forex Pairs):
ATR Periods: Increasing the ATR period to 20 or 25 can smooth out the volatility measure, making it less sensitive to short-term fluctuations. This adjustment helps in focusing on more significant trends in inherently stable markets.
ATR Multiplier: Raising the multiplier to 2.0 or even 2.5 increases the threshold for volatility, effectively filtering out low-volatility conditions. This setting ensures that the strategy only triggers trades during periods of relatively higher volatility, which are more likely to result in significant price movements.
How to Use the Volatility Filter for Low-Volatility Markets
For traders specifically interested in filtering out low-volatility markets, the key is to adjust the ATR Multiplier to a higher level. This adjustment increases the threshold required for the market to be considered sufficiently volatile for trade entries. Here's a step-by-step guide:
Adjust the ATR Multiplier: Increase the ATR Multiplier to create a higher volatility threshold. A multiplier of 2.0 to 2.5 is a good starting point for very low-volatility markets.
Fine-Tune the ATR Periods: Consider lengthening the ATR calculation period if you find that the strategy is still entering trades in undesirable low-volatility conditions. A longer period provides a more averaged-out measure of volatility, which might better suit your needs.
Monitor and Adjust: Volatility is not static, and market conditions can change. Regularly review the performance of your strategy in the context of current market volatility and adjust the settings as necessary.
Backtest in Different Conditions: Before applying the strategy live, backtest it across different market conditions with your adjusted settings. This process helps ensure that your approach to filtering low-volatility conditions aligns with your trading objectives and risk tolerance.
By fine-tuning the volatility filter settings according to the specific characteristics of the market you're trading in, you can enhance the performance of this strategy
- The **Trailing Stop Loss** and **EMA Exit Conditions** provide two layers of exit strategies, focusing on capital preservation and profit maximization.
**Visualizations**
For clarity and ease of use, the strategy plots the three EMAs and, if enabled, the ATR threshold on the chart. These visual cues not only aid in decision-making but also help in understanding the market's current trend and volatility state.
**How to Use**
Traders can customize the EMA periods to fit their trading horizon, be it short, medium, or long-term trading. The volatility filter and exit options allow for further customization, making the strategy adaptable to different market conditions and personal risk tolerance levels.
By offering a blend of trend-following principles with advanced risk management features, this strategy aims to cater to a wide range of trading styles, from cautious to aggressive. Its strength lies in its flexibility, allowing traders to fine-tune settings to their specific needs, making it a potentially valuable tool in the arsenal of any trader looking for a disciplined approach to navigating the markets.

FlexiMA x FlexiST - Strategy [presentTrading]█ Introduction and How it is Different
The FlexiMA x FlexiST Strategy blends two analytical methods - FlexiMA and FlexiST, which are opened in my early post.
- FlexiMA calculates deviations between an indicator source and a dynamic moving average, controlled by a starting factor and increment factor.
- FlexiST, on the other hand, leverages the SuperTrend model, adjusting the Average True Range (ATR) length for a comprehensive trend-following oscillator.
This synergy offers traders a more nuanced and multifaceted tool for market analysis.
BTC 6H L/S Performance
Local
█ Strategy, How It Works: Detailed Explanation
The strategy combines two components: FlexiMA and FlexiST, each utilizing unique methodologies to analyze market trends.
🔶FlexiMA Component:
- Calculates deviations between an indicator source and moving averages of variable lengths.
- Moving average lengths are dynamically adjusted using a starting factor and increment factor.
- Deviations are normalized and analyzed to produce median and standard deviation values, forming the FlexiMA oscillator.
Length indicator (50)
🔶FlexiST Component:
- Uses SuperTrend indicators with varying ATR (Average True Range) lengths.
- Trends are identified based on the position of the indicator source relative to the SuperTrend bands.
- Deviations between the indicator source and SuperTrend values are calculated and normalized.
Starting Factor (5)
🔶Combined Strategy Logic:
- Entry Signals:
- Long Entry: Triggered when median values of both FlexiMA and FlexiST are positive.
- Short Entry: Triggered when median values of both FlexiMA and FlexiST are negative.
- Exit Signals:
- Long Exit: Triggered when median values of FlexiMA or FlexiST turn negative.
- Short Exit: Triggered when median values of FlexiMA or FlexiST turn positive.
This strategic blend of FlexiMA and FlexiST allows for a nuanced analysis of market trends, providing traders with signals based on a comprehensive view of market momentum and trend strength.
█ Trade Direction
The strategy is designed to cater to various trading preferences, offering "Long", "Short", and "Both" options. This flexibility allows traders to align the strategy with their specific market outlook, be it bullish, bearish, or a combination of both.
█ Usage
Traders can effectively utilize the FlexiMA x FlexiST Strategy by first selecting their desired trade direction. The strategy then generates entry signals when the conditions for either the FlexiMA or FlexiST are met, indicating potential entry points in the market. Conversely, exit signals are generated when the conditions for these indicators diverge, thus signaling a potential shift in market trends and suggesting a strategic exit point.
█ Default Settings
1. Indicator Source (HLC3): Provides a balanced and stable price source, reducing the impact of extreme market fluctuations.
2. Indicator Lengths (20 for FlexiMA, 10 for FlexiST): Longer FlexiMA length smooths out short-term fluctuations, while shorter FlexiST length allows for quicker response to market changes.
3. Starting Factors (1.0 for FlexiMA, 0.618 for FlexiST): Balanced start for FlexiMA and a harmonized approach for FlexiST, resonating with natural market cycles.
4. Increment Factors (1.0 for FlexiMA, 0.382 for FlexiST): FlexiMA captures a wide range of market behaviors, while FlexiST provides a gradual transition to capture finer trend shifts.
5. Normalization Methods ('None'): Uses raw deviations, suitable for markets where absolute price movements are more significant.
6. Trade Direction ('Both'): Allows strategy to consider both long and short opportunities, ideal for versatile market engagement.
*More details:
1. FlexiMA
2. FlexiST

COSTAR Strategy [SS]A little late posting this but here it is, as promised!
This is the companion to the COSTAR indicator.
What it does:
It creates a co-integration paired relationship with a separate, cointegrated ticker. It then plots out the expected range based on the value of the cointegrated pair. When the current ticker is below the value of its co-integrated partner, it becomes a "Buy" and should be longed. When it becomes overvalued in comparison, it becomes a "Sell" and should be shorted.
The example above is with BA and USO, which have a strong inverse relationship.
How it works:
I made the strategy version a bit more intuitive. Instead of you selecting the parameters for your model, it will autoselect the ideal parameters based on your desired co-integrated pair. You simply enter the ticker you want to compare against, and it will sort through the values at various lags to find significance and stationarity. It will then create a model and plot the model out for you on your chart, as you can see above.
The premise of the strategy:
The premise of the strategy is as stated before. You long when the ticker is undervalued in comparison to its co-integrated pair, and short when it is overvalued. The conditions for entry are simply a co-integrated pair being over the expected range (short) or below the expected range (long).
The condition to exit is a "re-integration", or a crossover of the expected value of the ticker (the centreline).
What if it can't find a relationship?
In some instances, the indicator will not be able to determine a co-integrated relationship, owning to a lack of stationarity between the data. When this happens, you will get the following error:
The indicator provides you with prompts, such as switching the timeframe or trying an alternative ticker. In the case displayed above, if we simply switch to the 1 hour timeframe, we have a viable model with great backtest results:
You can toggle in the settings menu the various parameters, such as timeframe, fills and displays.
And that is the strategy in a nutshell, be sure to check out its partner indicator, COSTAR, for more information on the premise of using co-integrated models for trading. And let me know your questions below!
Safe trades everyone!

RSI & Backed-Weighted MA StrategyRSI & MA Strategy :
INTRODUCTION :
This strategy is based on two well-known indicators that work best together: the Relative Strength Index (RSI) and the Moving Average (MA). We're going to use the RSI as a trend-follower indicator, rather than a reversal indicator as most are used to. To the signals sent by the RSI, we'll add a condition on the chart's MA, filtering out irrelevant signals and considerably increasing our winning rate. This is a medium/long-term strategy. There's also a money management method enabling us to reinvest part of the profits or reduce the size of orders in the event of substantial losses.
RSI :
The RSI is one of the best-known and most widely used indicators in trading. Its purpose is to warn traders when an asset is overbought or oversold. It was designed to send reversal signals, but we're going to use it as a trend indicator by increasing its length to 20. The RSI formula is as follows :
RSI (n) = 100 - (100 / (1 + (H (n)/L (n))))
With n the length of the RSI, H(n) the average of days closing above the open and L(n) the average of days closing below the open.
MA :
The Moving Average is also widely used in technical analysis, to smooth out variations in an asset. The SMA formula is as follows :
SMA (n) = (P1 + P2 + ... + Pn) / n
where n is the length of the MA.
However, an SMA does not weight any of its terms, which means that the price 10 days ago has the same importance as the price 2 days ago or today's price... That's why in this strategy we use a RWMA, i.e. a back-weighted moving average. It weights old prices more heavily than new ones. This will enable us to limit the impact of short-term variations and focus on the trend that was dominating. The RWMA used weights :
The 4 most recent terms by : 100 / (4+(n-4)*1.30)
The other oldest terms by : weight_4_first_term*1.30
So the older terms are weighted 1.30 more than the more recent ones. The moving average thus traces a trend that accentuates past values and limits the noise of short-term variations.
PARAMETERS :
RSI Length : Lenght of RSI. Default is 20.
MA Type : Choice between a SMA or a RWMA which permits to minimize the impact of short term reversal. Default is RWMA.
MA Length : Length of the selected MA. Default is 19.
RSI Long Signal : Minimum value of RSI to send a LONG signal. Default is 60.
RSI Short signal : Maximum value of RSI to send a SHORT signal. Default is 40.
ROC MA Long Signal : Maximum value of Rate of Change MA to send a LONG signal. Default is 0.
ROC MA Short signal : Minimum value of Rate of Change MA to send a SHORT signal. Default is 0.
TP activation in multiple of ATR : Threshold value to trigger trailing stop Take Profit. This threshold is calculated as multiple of the ATR (Average True Range). Default value is 5 meaning that to trigger the trailing TP the price need to move 5*ATR in the right direction.
Trailing TP in percentage : Percentage value of trailing Take Profit. This Trailing TP follows the profit if it increases, remaining selected percentage below it, but stops if the profit decreases. Default is 3%.
Fixed Ratio : This is the amount of gain or loss at which the order quantity is changed. Default is 400, which means that for each $400 gain or loss, the order size is increased or decreased by a user-selected amount.
Increasing Order Amount : This is the amount to be added to or subtracted from orders when the fixed ratio is reached. The default is $200, which means that for every $400 gain, $200 is reinvested in the strategy. On the other hand, for every $400 loss, the order size is reduced by $200.
Initial capital : $1000
Fees : Interactive Broker fees apply to this strategy. They are set at 0.18% of the trade value.
Slippage : 3 ticks or $0.03 per trade. Corresponds to the latency time between the moment the signal is received and the moment the order is executed by the broker.
Important : A bot has been used to test the different parameters and determine which ones maximize return while limiting drawdown. This strategy is the most optimal on BITSTAMP:ETHUSD with a timeframe set to 6h. Parameters are set as follows :
MA type: RWMA
MA Length: 19
RSI Long Signal: >60
RSI Short Signal : <40
ROC MA Long Signal : <0
ROC MA Short Signal : >0
TP Activation in multiple ATR : 5
Trailing TP in percentage : 3
ENTER RULES :
The principle is very simple:
If the asset is overbought after a bear market, we are LONG.
If the asset is oversold after a bull market, we are SHORT.
We have defined a bear market as follows : Rate of Change (20) RWMA < 0
We have defined a bull market as follows : Rate of Change (20) RWMA > 0
The Rate of Change is calculated using this formula : (RWMA/RWMA(20) - 1)*100
Overbought is defined as follows : RSI > 60
Oversold is defined as follows : RSI < 40
LONG CONDITION :
RSI > 60 and (RWMA/RWMA(20) - 1)*100 < -1
SHORT CONDITION :
RSI < 40 and (RWMA/RWMA(20) - 1)*100 > 1
EXIT RULES FOR WINNING TRADE :
We have a trailing TP allowing us to exit once the price has reached the "TP Activation in multiple ATR" parameter, i.e. 5*ATR by default in the profit direction. TP trailing is triggered at this point, not limiting our gains, and securing our profits at 3% below this trigger threshold.
Remember that the True Range is : maximum(H-L, H-C(1), C-L(1))
with C : Close, H : High, L : Low
The Average True Range is therefore the average of these TRs over a length defined by default in the strategy, i.e. 20.
RISK MANAGEMENT :
This strategy may incur losses. The method for limiting losses is to set a Stop Loss equal to 3*ATR. This means that if the price moves against our position and reaches three times the ATR, we exit with a loss.
Sometimes the ATR can result in a SL set below 10% of the trade value, which is not acceptable. In this case, we set the SL at 10%, limiting losses to a maximum of 10%.
MONEY MANAGEMENT :
The fixed ratio method was used to manage our gains and losses. For each gain of an amount equal to the value of the fixed ratio, we increase the order size by a value defined by the user in the "Increasing order amount" parameter. Similarly, each time we lose an amount equal to the value of the fixed ratio, we decrease the order size by the same user-defined value. This strategy increases both performance and drawdown.
Enjoy the strategy and don't forget to take the trade :)

2 Moving Averages | Trend FollowingThe trading system is a trend-following strategy based on two moving averages (MA) and Parabolic SAR (PSAR) indicators.
How it works:
The strategy uses two moving averages: a fast MA and a slow MA.
It checks for a bullish trend when the fast MA is above the slow MA and the current price is above the fast MA.
It checks for a bearish trend when the fast MA is below the slow MA and the current price is below the fast MA.
The Parabolic SAR (PSAR) indicator is used for additional trend confirmation.
Long and short positions can be turned on or off based on user input.
The strategy incorporates risk management with stop-loss orders based on the Average True Range (ATR).
Users can filter the backtest date range and display various indicators.
The strategy is designed to work with the date range filter, risk management, and user-defined positions.
Features:
Trend-following strategy.
Two customizable moving averages.
Parabolic SAR for trend confirmation.
User-defined risk management with stop-loss based on ATR.
Backtest date range filter.
Flexibility to enable or disable long and short positions.
This trading system provides a comprehensive approach to trend-following and risk management, making it suitable for traders looking to capture trends with controlled risk.

IU Break of any session StrategyHow this script works:
1. This script is an intraday trading strategy script which buy and sell on the bases of user-defined intraday session range breakout and gives alert(if the alert is set) message too when the new position is open.
2. It calculate the session as per the user inputs or user defined custom session.
3. The script stores the highest and lowest value of the whole session.
4. It take a long position on the first break and close above the highest value.
5. It take a short position on the break and close below the lowest value.
6. The script takes one position in one day.
7. The stop loss for this script is the previous low(if long) or high(if short).
8. Take profit is 1:2 and it's adjustable.
9. This script work on every kind of market.
How The Useful For The User :
1. User can backtest any session range breakout he wants to trade.
2. User can get alert when the new position is open.
3. User can change the Risk to Reward in order to find the best Risk to Reward.
4. User can see the highest and lowest value of the session with respect to analyzing his trading objective.
5. This strategy script highlights which session range breakout performs best and which performs worst.

SOFEX High-End Indicators + BacktestingBINANCE:BTCUSDT.P BINANCE:ETHUSDT.P
Introducing the first publicly available suite of indicators for Bitcoin and Ethereum by Sofex - the High-End Indicators & Backtesting System.
🔬 Trading Philosophy
The High-End Indicators & Backtesting system offers both trend-following and mean-reversal algorithms to provide traders with a deep insight into the highly volatile cryptocurrency markets, known for their market noise and vulnerability to manipulation.
With these factors in mind, our indicators are designed to sidestep most potentially false signals. This is facilitated further by the "middle-ground" time frame (1 Hour) we use. Our focus is on the two largest cryptocurrencies: Bitcoin and Ethereum , which provide high liquidity, necessary for reliable trading.
Therefore, we recommend using our suite on these markets.
The backtesting version of the Sofex High-End Indicators includes mainly trend-following indicators. This is because our trading vision is that volatility in cryptocurrency markets is a tool that should be used carefully, and many times avoided. Furthermore, mean-reversal trading can lead to short-term profits, but we have found it less than ideal for long-term trading.
The script does not aim to make a lot of trades, or to always remain in a position and switch from long to short. Many times there is no direction and the market is in "random walk mode", and chasing trades is futile.
Based on our experience, it is preferable if traders remain neutral the majority of the time and only enter trades that can be exited in the foreseeable future. Trading just for the sake of it ultimately leads to loss in the long-run.
Expectations of performance should be realistic.
We also focus on a balanced take-profit to stop-loss ratio. In the default set-up of the script, that is a 2% : 2% (1:1) ratio. A relatively low stop loss and take profit build onto our idea that positions should be exited promptly. There are many options to edit these values, including enabling trailing take profit and stop loss. Traders can also completely turn off TP and SL levels, and rely on opposing signals to exit and enter new trades.
Extreme scenarios can happen on the cryptocurrency markets, and disabling stop-loss levels completely is not recommended. The position size should be monitored since all of it is at risk with no stop-loss.
We take pride in presenting this comprehensive suite of trading indicators, designed for both manual and automated use. Although automated use leads to increased efficiency, traders are free to incorporate any of our indicators into their own manual trading strategy.
⚙️ Indicators
By default, all indicators are enabled for both Long and Short trades.
Extreme Trend Breakouts
The Extreme Trend Breakouts indicator seeks to follow breakouts of support and resistance levels, while also accounting for the unfortunate fact that false signals can be generated on these levels. The indicator combines trend-breakout strategies with various other volatility and direction measurements. It works best in the beginning of trends.
Underpinning this indicator are renowned Perry Kaufman's Adaptive Moving Averages (PKAMA) alongside our proprietary adaptive moving averages. These dynamic indicators adjust their parameters based on recent price movements, attempting to catch trends while maintaining consistent performance in the long run.
In addition, our modification of the TTM Squeeze indicator further enhances the Extreme Trend Breakouts indicator, making it more responsive, especially during the initial stages of trends and filtering of "flat" markets.
High-Volatility Trend Follower
The High-Volatility Trend Follower indicator is based around the logic of evading market conditions where volatility is low (choppy markets) and aggressively following confirmed trends. The indicator works best during strong trends, however, it has the downside of entering trades at trend tops or bottoms.
This indicator also leverages our proprietary adaptive moving averages to identify and follow high-volatility trends effectively. Furthermore, it uses the Average Directional Index, Aroon Oscillator, ATR and a modified version of VWAP, to categorize trends into weak or strong ones. The VWAP indicator is used to identify the monetary (volume) inflow into a given trend, further helping to avoid short-term manipulations.
Low-Volatility Reversal
The Low-Volatility Reversal aims at plugging the holes that trend-following indicators ignore. It specifically looks for choppy markets. Using proven concepts such as Relative Strength Index and volume measurements, among others, this indicator finds local tops and bottoms with good accuracy. It works best in choppy markets with low to medium volatility. It has a downside that all reversals have, losing trades at the end of choppy markets and in the beginning of big trends.
This indicator, like the others, employs PKAMA in conjunction with our proprietary adaptive moving averages, and an Average PSAR indicator to seek out "sideways" markets. Furthermore, Bollinger Bands with an adaptive basis line is used, with the idea of trading against the short-term trends by looking at big deviations in price movement. The above mentioned indicators attempt to catch local tops and bottoms in markets.
Adaptive Trend Convergence
The Adaptive Trend Convergence aims at following trends while avoiding entering positions at local bottoms and tops. It does so by comparing a number of adaptive moving averages and looking for convergence among them. Adaptive filtering techniques for avoiding choppy markets are also used.
This indicator utilizes our proprietary adaptive moving averages, and an Average Price Range indicator to identify trend convergence and divergence effectively, preventing false signals during volatile market phases. It also makes use of Bollinger Bands with an adaptive moving average basis line and price-action adjusted deviation. Contrasting to the Low-Volatility Reversal condition described above, the Bollinger Bands used here attempt to follow breakouts outside of the lower and upper bands.
Double-Filtered Channel Breakouts
The Double-Filtered Channel Breakouts indicator is made out of adaptive channel-identifying indicators. The indicator then follows trends that significantly diverge from the established channels. This aims at following extreme trends, where rapid, continuous movements in either direction occur. This indicator works best in very strong trends and follows them relentlessly. However, these strong trends can end in strong reversals, and the indicator can be stopped out on the last trade.
Our Double-Filtered Channel Breakouts indicator is built on a foundation of adaptive channel indicators. We've harnessed the power of Keltner Channels and Bollinger Band Channels, with a similar approach used in the Adaptive Trend Convergence indicator. The basis and upper/lower bands of the channels do not rely on fixed deviation parameters, rather on adaptive ones, based on price action and volatility. This combination seeks to identify and follows extreme trends.
Direction Tracker
The Direction Tracker indicator is made out of a central slower, adaptive moving average that clearly recognizes global, long-term trends. Combined with direction and range indicators, among others, this indicator excels at finding the long-term trend and ignoring temporary pullbacks in the opposite direction. It works best at the beginning and middle of long and strong trends. It can fail at the end of trends and on very strong historical resistance lines (where sharp reversals are common).
Our Direction Tracker indicator integrates an adaptive SuperTrend indicator into its core, alongside our proprietary adaptive moving averages, to accurately identify and track long-term trends while mitigating temporary pullbacks. Furthermore, it uses Average True Range, ADX and other volatility indicators to attempt to catch unusual moves on the market early-on.
📟 Parameters Menu
To offer traders flexibility, our system comes with a comprehensive parameter menu:
Preset Selection : Choose between Bitcoin or Ethereum presets to tailor the indicators to your preferred cryptocurrency market.
Global Signal Direction: Set the global signal direction as Long, Short, or Both, depending on your trading strategy.
Global Sensitivity Parameter : Adjust the system's sensitivity to adapt to different trend-following conditions, particularly beneficial during higher-strength trends.
Source of Signals : Toggle individual indicators on or off according to your preference. By default, all indicators are enabled. Customize the indicators to trade Long, Short, or Both, aligning them with your desired market exposure.
Confirmation of Signals : Set the minimum number of confirmed signals on the same bar, ensuring signals are generated only when specific confirmation criteria are met. The default value is one, and it can be adjusted for both Long and Short signals.
Exit of Signals : You have options regarding Take-Profit (TP) and Stop-Loss (SL) levels. Enable TP/SL levels to exit trades at predetermined levels, or disable them to rely on direction changes for exits. Be aware that removing stop losses can introduce additional risk, and position sizing should be carefully monitored.
By enabling Trailing TP/SL, the system switches to a trailing approach, allowing you to:
- Place an initial customizable SL.
- Specify a level (%) for the Trailing SL to become active.
- When the activation level is reached, the system moves the trailing stop by a given Offset (%).
Additionally, you can enable exit at break-even, where the system places an exit order when the trail activation level is reached, accounting for fees and slippage.
Alert Messages : Define the fields for alert messages based on specific conditions. You can set up alerts to receive email, SMS, and in-app notifications. If you use webhooks for alerts, exercise caution, as these alerts can potentially execute trades without human supervision.
Backtesting : Default backtesting parameters are set to provide realistic backtesting performance:
- 0.04% Commission per trade (for both entries and exits)
- 3 ticks Slippage (highly dependent on exchange)
- Initial capital of $1000
- Order size of $1000
While the order size is equal to the initial capital, the script employs a 2% stop-loss order to limit losses and attempts to prevent risky trades from creating big losses. The order size is a set dollar value, so that the backtesting performance is linear, instead of using % of capital which may result in unrealistic backtesting performance.
Risk Disclaimer
Please be aware that backtesting results, while valuable for statistical overview, do not guarantee future performance in any way. Cryptocurrency markets are inherently volatile and risky. Always trade responsibly and do not risk more than you can afford to lose.

[tradinghook] - Renko Trend Reversal Strategy V2Title: Renko Trend Reversal Strategy
Short Title: - Renko TRS
> Special thanks to for manually calculating `renkoClose` and `renkoOpen` values in order to remove the infamous repaint issue
Description:
The Renko Trend Reversal Strategy ( - Renko TRS) is a powerful and original trading approach designed to identify trend reversals in financial markets using Renko charts. Renko charts differ from traditional time-based charts, as they focus solely on price movements and ignore time, resulting in a clearer representation of market trends. This strategy leverages Renko charts in conjunction with the Average True Range (ATR) to capture trend reversals with high precision and effectiveness.
Key Concepts:
Renko Charts: Renko charts are unique chart types that only plot price movements beyond a predefined brick size, ignoring time and noise. By doing so, they provide a more straightforward depiction of market trends, eliminating insignificant price fluctuations and making it easier to spot trend reversals.
Average True Range (ATR): The strategy utilizes the ATR indicator, which measures market volatility and provides valuable insights into potential price movements. By setting the brick size of the Renko chart based on the ATR, the strategy adapts to changing market conditions, ensuring optimal performance across various instruments and timeframes.
How it Works:
The Renko Trend Reversal Strategy is designed to identify trend reversal points and generate buy or sell signals based on the following principles:
Renko Brick Generation: The strategy calculates the ATR over a user-defined period (ATR Length) and utilizes this value to determine the size of Renko bricks. Larger ATR values result in bigger bricks, capturing higher market volatility, while smaller ATR values create smaller bricks for calmer market conditions.
Buy and Sell Signals: The strategy generates buy signals when the Renko chart's open price crosses below the close price, indicating a potential bullish trend reversal. Conversely, sell signals are generated when the open price crosses above the close price, suggesting a bearish trend reversal. These signals help traders identify potential entry points to capitalize on market movements.
Stop Loss and Take Profit Management: To manage risk and protect profits, the strategy incorporates dynamic stop-loss and take-profit levels. The stop-loss level is calculated as a percentage of the Renko open price, ensuring a fixed risk amount for each trade. Similarly, the take-profit level is set as a percentage of the Renko open price to secure potential gains.
How to Use:
Inputs: Before using the strategy, traders can customize several parameters to suit their trading preferences. These inputs include the ATR Length, Stop Loss Percentage, Take Profit Percentage, Start Date, and End Date. Adjusting these settings allows users to optimize the strategy for different market conditions and risk tolerances.
Chart Setup: Apply the - Renko TRS script to your desired financial instrument and timeframe on TradingView. The Renko chart will dynamically adjust its brick size based on the ATR Length parameter.
Buy and Sell Signals: The strategy will generate green "Buy" labels below bullish reversal points and red "Sell" labels above bearish reversal points on the Renko chart. These labels indicate potential entry points for long and short trades, respectively.
Risk Management: The strategy automatically calculates stop-loss and take-profit levels based on the user-defined percentages. Traders can ensure proper risk management by using these levels to protect their capital and secure profits.
Backtesting and Optimization: Before implementing the strategy live, traders are encouraged to backtest it on historical data to assess its performance across various market conditions. Adjust the input parameters through optimization to find the most suitable settings for specific instruments and timeframes.
Conclusion:
The - Renko Trend Reversal Strategy is a unique and versatile tool for traders looking to identify trend reversals with greater accuracy. By combining Renko charts and the Average True Range (ATR) indicator, this strategy adapts to market dynamics and provides clear entry and exit signals. Traders can harness the power of Renko charts while effectively managing risk through stop-loss and take-profit levels. Before using the strategy in live trading, backtesting and optimization will help traders fine-tune the parameters for optimal performance. Start exploring trend reversals with the - Renko TRS and take your trading to the next level.
(Note: This description is for illustrative purposes only and does not constitute financial advice. Traders are advised to thoroughly test the strategy and exercise sound risk management practices when trading in real markets.)

[tradinghook] - Renko Trend Reversal Strategy - Renko Trend Reversal Strategy
Short Title: - Renko TRS
Description:
The Renko Trend Reversal Strategy ( - Renko TRS) is a powerful and original trading approach designed to identify trend reversals in financial markets using Renko charts. Renko charts differ from traditional time-based charts, as they focus solely on price movements and ignore time, resulting in a clearer representation of market trends. This strategy leverages Renko charts in conjunction with the Average True Range (ATR) to capture trend reversals with high precision and effectiveness.
Key Concepts:
Renko Charts: Renko charts are unique chart types that only plot price movements beyond a predefined brick size, ignoring time and noise. By doing so, they provide a more straightforward depiction of market trends, eliminating insignificant price fluctuations and making it easier to spot trend reversals.
Average True Range (ATR): The strategy utilizes the ATR indicator, which measures market volatility and provides valuable insights into potential price movements. By setting the brick size of the Renko chart based on the ATR, the strategy adapts to changing market conditions, ensuring optimal performance across various instruments and timeframes.
How it Works:
The Renko Trend Reversal Strategy is designed to identify trend reversal points and generate buy or sell signals based on the following principles:
Renko Brick Generation: The strategy calculates the ATR over a user-defined period (ATR Length) and utilizes this value to determine the size of Renko bricks. Larger ATR values result in bigger bricks, capturing higher market volatility, while smaller ATR values create smaller bricks for calmer market conditions.
Buy and Sell Signals: The strategy generates buy signals when the Renko chart's open price crosses below the close price, indicating a potential bullish trend reversal. Conversely, sell signals are generated when the open price crosses above the close price, suggesting a bearish trend reversal. These signals help traders identify potential entry points to capitalize on market movements.
Stop Loss and Take Profit Management: To manage risk and protect profits, the strategy incorporates dynamic stop-loss and take-profit levels. The stop-loss level is calculated as a percentage of the Renko open price, ensuring a fixed risk amount for each trade. Similarly, the take-profit level is set as a percentage of the Renko open price to secure potential gains.
How to Use:
Inputs: Before using the strategy, traders can customize several parameters to suit their trading preferences. These inputs include the ATR Length, Stop Loss Percentage, Take Profit Percentage, Start Date, and End Date. Adjusting these settings allows users to optimize the strategy for different market conditions and risk tolerances.
Chart Setup: Apply the - Renko TRS script to your desired financial instrument and timeframe on TradingView. The Renko chart will dynamically adjust its brick size based on the ATR Length parameter.
Buy and Sell Signals: The strategy will generate green "Buy" labels below bullish reversal points and red "Sell" labels above bearish reversal points on the Renko chart. These labels indicate potential entry points for long and short trades, respectively.
Risk Management: The strategy automatically calculates stop-loss and take-profit levels based on the user-defined percentages. Traders can ensure proper risk management by using these levels to protect their capital and secure profits.
Backtesting and Optimization: Before implementing the strategy live, traders are encouraged to backtest it on historical data to assess its performance across various market conditions. Adjust the input parameters through optimization to find the most suitable settings for specific instruments and timeframes.
Conclusion:
The - Renko Trend Reversal Strategy is a unique and versatile tool for traders looking to identify trend reversals with greater accuracy. By combining Renko charts and the Average True Range (ATR) indicator, this strategy adapts to market dynamics and provides clear entry and exit signals. Traders can harness the power of Renko charts while effectively managing risk through stop-loss and take-profit levels. Before using the strategy in live trading, backtesting and optimization will help traders fine-tune the parameters for optimal performance. Start exploring trend reversals with the - Renko TRS and take your trading to the next level.
(Note: This description is for illustrative purposes only and does not constitute financial advice. Traders are advised to thoroughly test the strategy and exercise sound risk management practices when trading in real markets.)

Volatility Capture RSI-Bollinger - Strategy [presentTrading]- Introduction and how it is different
The 'Volatility Capture RSI-Bollinger - Strategy ' is a trading strategy that combines the concepts of Bollinger Bands (BB), Relative Strength Index (RSI), and Simple Moving Average (SMA) to generate trading signals. The uniqueness of this strategy is it calculates which is a dynamic level between the upper and lower Bollinger Bands based on the closing price. This unique feature allows the strategy to adapt to market volatility and price movements.
The market in Crypto and Stock are highly volatile, making them suitable for a strategy that uses Bollinger Bands. The RSI can help identify overbought or oversold conditions in this often speculative market.
BTCUSD 4hr chart
(700.hk) 3hr chart
Remember, the effectiveness of a trading strategy also depends on other factors such as the timeframe used, the specific settings of the indicators, and the overall market conditions. It's always recommended to backtest and paper trade a strategy before using it in live trading.
- Strategy, How it Works
Dynamic Bollinger Band: The strategy works by first calculating the upper and lower Bollinger Bands based on the user-defined length and multiplier. It then uses the Bollinger Bands and the closing price to dynamically adjust the presentBollingBand value. In the end, it generates a long signal when the price crosses over the present Bolling Band and a short signal when the price crosses under the present Bolling Band.
RSI: If the user has chosen to use RSI for signals, the strategy also calculates the RSI and its SMA, and uses these to generate additional long and short signals. The RSI-based signals are only used if the 'Use RSI for signals' option is set to true.
The strategy then checks the chosen trading direction and enters a long or short position accordingly. If the trading direction is set to 'Both', the strategy can enter both long and short positions.
Finally, the strategy exits a position when the close price crosses under the present Bolling Band for a long position, or crosses over the present Bolling Band for a short position.
- Trade direction
The strategy also includes a trade direction parameter, allowing the user to choose whether to enter long trades, short trades, or both. This makes the strategy adaptable to different market conditions and trading styles.
- Usage
1. Set the input parameters as per your trading preferences. You can choose the price source, the length of the moving average, the multiplier for the ATR, whether to use RSI for signals, the RSI and SMA periods, the bought and sold range levels, and the trading direction.
2. The strategy will then generate buy and sell signals based on these parameters. You can use these signals to enter and exit trades.
- Default settings
1. Source: hlc3
2. Length: 50
3. Multiplier: 2.7183
4. Use RSI for signals: True
5. RSI Period: 10
6. SMA Period: 5
7. Bought Range Level: 55
8. Sold Range Level: 50
9. Trade Direction: Both
- Strategy's default Properties
1. Default Quantity Type: 'strategy.percent_of_equity'
2. commission_value= 0.1, commission_type=strategy.commission.percent, slippage= 1: These parameters set the commission and slippage for the strategy. The commission is set to 0.1% of the trade value, and the slippage (the difference between the expected price of a trade and the price at which the trade is executed) is set to 1.
3. default_qty_type = strategy.percent_of_equity, default_qty_value = 15: These parameters set the default quantity for trades. The default_qty_type is set to strategy.percent_of_equity, which means that the size of each trade will be a percentage of the account equity. The default_qty_value is set to 15, which means that each trade will be 15% of the account equity.
4. initial_capital= 10000: This parameter sets the initial capital for the strategy to $10,000.

METRIC-TREND-TRADERThis script is a Fully Automated trading script meant to be used with "Oanda" broker and the plug-ins for algorithmic trading automation.( FOREX ONLY)
This script is meant to capture "TREND FOLLOWING " for intraday charts (1hour) preferably and will hold for days / weeks .trading on forex markets.
(The combination of indicators includes a short high and low price channel and a longer term high and low price channel)
This script is original in description as being automated to try and capture dynamic trending markets with both long and short fractal price channels. although trend trading is not an original concept. trend trading with this dynamic indicator allows the user visualize both short term and longer term price action at the same time, helping to make better trading decisions. the channels are designed to buy breakouts in the direction of the longer term trend while trailing stop a built-in stop loss that allows normal market movement while attempting to lock in flexible profits.
The concept of this indicator is be able to quickly visualize trends by high lighting the large green areas beneath price "when trending long" which is the difference between the (user defined) short term lows and the (user defined) Long period price lows.
For "down trending" markets a large red area above price will be displayed and this is the difference between the (user defined) short term highs and the (user defined) long term highs.
This strategy uses a lower than reward profile to jump in direction of market moves for continuation,
(1 risk to 4 reward)
in the likelihood the instrument will continue (example) 200 pips before it reverts 50 pips in the counter direction.
This strategy should only be used in markets that you believe are "TRENDING" at the time of trading otherwise you risk trend trading a range market.
This script uses a (user defined period) of short term high and low price ( green/red color) and (user defined period) Long Term high and low price (green/red) chosen in the indicator settings menu.
The default parameters are 10 with a (minimum of 1 and maximum of 10000) for the short term channel and 50 with a (minimum of 1 and maximum of 10000) for the long term price channel , the default parameters = roughly 2 days "long term" and 10 hours "short term" of price action on the (1 hour) chart.
Strategy entries and exits , for Long trades the trade will be entered if the short term high crosses above the Long Term high and the Short term low is not equal to the Long term low . the trade will exit if profit or stop loss are hit or if the Short term low crosses under the long term low.
For Short trades the trade will enter short if , the short term low crosses under the long term low and the short term high is not equal to the long term high. the trade will exit if profit or stop loss are hit or the short term high crosses over the long term high
"The default parameters should be kept unless you fully understand the complete strategy"
There are two very important inputs to be selected at the user setting menu "Long Only " and "Short Only" if you are looking to place long trades only select "Long Only" or for short trades select " Short Only" it is not recommended to keep both selected as it will trade both sides!
When the trade is entered a red , a blue and green horizontal dotted line will appear on the chart.
the blue line is the strategy entry price , the red line is the stop loss price , and the green line is the take profit price . the colors will invert if the trade is long or short.
(Setting alerts should be done in the indicator settings menu, and the parameters you chose will determine the stop loss/target and the amount of "units = (position size)" you wish to trade for the (forex only) markets. using "alert() function calls only" is the only alert that should be used with this strategy.
(note : when "alert() function calls only" is set two messages will be sent, one closing any open position in the opposite direction and one placing the new order regardless if you are currently in a trade or not)
Trade targets , stoploss and trade position size are a user defined variables entered in the indicator settings menu. (target pips minimum 0 and a maximum of 1000)(stop pips minimum of 0 and maximum of 1000)
Back test date range is included in the script for back testing different data periods.
the back ground will be colored a transparent navy blue if the period you are looking trading is with in the date range( note: to place live trades the end date will need to be in the future)
this is also adjustable in the settings menu
The avoid spread filter is a user defined time in which the spread is typically higher than average, applying this filter avoids trades in the specified time. When this filter is applied there will be a transparent red back ground color in the specified time.
Back test default setting are equivocal to OANDA:USDJPY
at the time of this publication placing trades with the "Oanda" broker are as follows , USD units = 2000 equal 2000 USD position size . "Oanda" current leverage is 20 to 1 for this particular pair and commission is paid in spread (1.4) pips = 0.19 USD per trade , Margin required for the trade is 100.0 USD , Position sizing = 10% of a 1000 USD account.
OANDA:USDJPY

NIFTY 50 5mint StrategyThis is an intraday strategy for NIFTY50 Based First candle High and Low breakout.
The strategy takes user inputs for the start and end dates, start and end months, and start and end years, which define the time range to trade. The user can also specify the maximum number of trades to take during the time range and the length of the Exponential Moving Average ( EMA ) used in the strategy
In this strategy, the First candle's high and low are calculated and used as entry and exit points for trades. If the close price breaks above the First candle's high, a buy signal is generated. Conversely, if the close price breaks below the First candle's low, a sell signal is generated.
The strategy uses the Exponential Moving Average ( EMA ) as a filter to close entered positions either long or short, EMA also acts Target. If the close price falls below the EMA, a long position is closed, and if the close price rises above the EMA, a short position is closed or the PreviousCandleClose is above the First candle's high a short position is closed, When the PreviousCandleClose is below the First candle's low a long position is closed, First candle's high act as Stoploss
The strategy limits the number of trades taken within the specified time range, and if the time range is exceeded, all positions are closed.
Finally, the strategy plots the First candle's high and low, EMAs on the chart for visual reference.
Default settings work best with the 5mint candle, you may tweak settings according to your needs.
backtesting helps in interpreting how the trading strategy would have behaved in the past, and forward testing (paper trading) informs the traders how it would perform now.

Baseline Cross Qualifier Volatility Strategy with HMA Trend BiasFor trading ES on 30min Chart
Trading Rules
Post Baseline Cross Qualifier (PBCQ): If price crosses the baseline but the trade is invalid due to additional qualifiers, then the strategy doesn't enter a trade on that candle. This setting allows you override this disqualification in the following manner: If price crosses XX bars ago and is now qualified by other qualifiers, then the strategy enters a trade.
Volatility: If price crosses the baseline, we check to see how far it has moved in terms of multiples of volatility denoted in price (ATR x multiple). If price has moved by at least "Qualifier multiplier" and less than "Range Multiplier", then the strategy enters a trade. This range is shown on the chart with yellow area that tracks price above/blow the baseline. Also, see the dots at the top of the chart. If the dots are green, then price passes the volatility test for a long. If the dots are red, then price passes the volatility test for a short.
Take Profit/Stoploss Quantity Removed
1 Take Profit: 100% of the trade is closed when the profit target or stoploss is reached.
2 Take Profits: Quantity is split 50/50 between Take Profit 1 and Take Profit 2
3 Take Profits: Quantify is split 50/25/25.
Stratgey Inputs
Baseline Length
37
Post Baseline Cross Qualifier Enabled
On
Post Baseline Cross Qualifier Bars Ago
9
ATR Length
9
Volatility Multiplier
0
Volatility Range Multiplier
10
Volatility Qualifier Multiplier
2
Take Profit Type
1 Take Profit
HMA Length
11

Token Metrics IndicatorThe Token Metrics Combined Indicator v2 is a comprehensive technical analysis tool designed to output Long/Short signals for crypto assets on TradingView. It combines multiple indicators, including Token Metrics Clouds, Token Metrics Trend Lines , Token Metrics Channels, and signals, to give a comprehensive outlook on the market trend and potential entry/exit points.
Users can backtest the signals to understand the strategy's historical performance, learn how to use it, identify its pros and cons, and determine the market conditions it best suits. It is important to note that the backtesting performance does not indicate future results.
The methods for calculating fixed stop-losses vary depending on the trading pattern. A fixed stop-loss is used for long-term trading, while a trading stop-loss is used for high-frequency trading. This provides flexible investment risk management, allowing you to assign different stop-loss percentages to different trading strategies.
The Length input allows users to control the indicator’s sensitivity, with a default value of 20 bars for long-term trading and 9 bars for high-frequency trading. The Adjustment Factor input has a default value of 0.1 and can be adjusted to adapt to changing levels of volatility . The Stop-loss input allows users to control their risk tolerance, with a default value of 8% for long-term trading and 2% for high-frequency trading.
Token Metrics Clouds incorporates a bullish / bearish trend indicator, which uses two adaptive moving averages that adapt to volatility , reducing false trend signals during range-bound environments and providing a more accurate representation of market trends.
The Token Metrics Trendline is a long-term indicator that uses an adaptive moving average to identify long-term trends. This can also be used for long-term resistance and support levels, providing a comprehensive overview of the current market situation for both long-term and high-frequency traders.
The Token Metrics Signals indicator provides long, short, and close signals, indicating when to enter and exit long or short positions based on the TM trend-following strategy.
The Token Metrics Channels indicator is a top/bottom indicator that adjusts to current levels of volatility . This uses adaptive Donchian channels to determine the previous short-term swing high and low, providing insight into where short-term resistance or support might be forming and where breakouts can occur. The look-back periods change according to the strategy time frame, offering a flexible and dynamic approach to market analysis.
Long-term trading is a trend-following strategy best suited for daily and weekly timeframes. This strategy works well in trending markets but may produce false signals in choppy or range-bound markets.
High-frequency trading is a mean-reverting strategy best suited for 15-minute, 30-minute, and 1-hour timeframes. This strategy performs well in choppy or range-bound markets but may not be effective in strong trending markets.

APIBridge Candlestick Reversal SystemStrategy Premise
This strategy uses the Wick Reversal System introduced in Pivot Boss and generates signals based on Candlestick Patterns.
– Wick Reversal System
– Extreme Reversal System
– Outside Reversal System
– Doji Reversal System
Wick Reversal System:
1. For a Bullish reversal wick to exist, the close of the bar should fall within the top 35% of the overall range of the candle.
2. For a bearish reversal wick to exist, the close of the bar should fall within the bottom 35% of the overall range of the candle.
Extreme Reversal System:
1. The first bar of the pattern is about two times larger than the average size of the candles in the look-back period.
2. The body of the first bar of the pattern should encompass more than 50% of the bar’s total range, but usually not more than 85%.
3. The second bar of the pattern opposes the first. If the first bar of the pattern is bullish (C > 0), then the second bar must be bearish (C < 0). If the first bar is bearish (C < 0), then the second bar must be bullish (C > 0).
Outside Reversal System:
1. The Engulfing bar of a bullish outside reversal setup has a low that is below the prior bar’s low (L < L) and a close that is above the prior bar’s high (C > H).
2. The Engulfing bar of a bearish outside reversal setup has a high that is above the prior bar’s high (H > H) and a close that is below the prior bar’s low (C < L).
3. The Engulfing bar is usually 5 to 25 percent larger than the size of the average bar in the look-back period.
Doji Reversal System:
1. The open and close prices of the Doji should fall within 10 percent of each other, as measured by the total range of the Candlestick .
2. For a Bullish Doji , the high of the Doji Candlestick should be below the ten-period Simple Moving Average (H SMA (10)).
4. For a Bearish Doji , one of the two bars following the Doji must close beneath the low of the Doji (C < L or C < L).
5. For a Bullish Doji setup, one of the two bars following the Doji must close above the high of the Doji (C > H) or C > H)
Strategy Logic
Long Entry:
When Low Pivot Point and Wick Reversal System and Bullish Wick Reversal Setup Pattern Send, LE
OR When Low Pivot Point and Extreme Reversal System and Bullish Extreme Reversal setup Send ,LE
OR When Low Pivot Point and Outside Reversal System and Bullish Outside Reversal Setup Send LE
OR When Low Pivot Point and Doji Reversal System and Bullish Doji Reversal Setup Send, LE
Long Exit:
Either when SL or Target is hit. If SL/ TGT is not hit and
When High Pivot Point and Wick Reversal System and Bearish Wick Reversal Setup Pattern Send LXSE
OR When High Pivot Point Extreme Reversal System and Bearish Extreme Reversal setup Send LXSE
OR When High Pivot Point Outside Reversal System and Bearish Outside Reversal Setup Send LXSE
OR When High Pivot Point Doji Reversal System and Bearish Doji Reversal Setup Send, LXSE
Short Entry:
When High Pivot Point and Wick Reversal System and Bearish Wick Reversal Setup Pattern Send SE
OR When High Pivot Point Extreme Reversal System and Bearish Extreme Reversal setup Send SE
OR When High Pivot Point Outside Reversal System and Bearish Outside Reversal Setup Send SE
OR When High Pivot Point Doji Reversal System and Bearish Doji Reversal Setup Send, SE
Short Exit:
Either when SL or Target is hit. If SL/ TGT is not hit and
When Low Pivot Point and Wick Reversal System and Bullish Wick Reversal Setup Pattern Send, SXLE
OR When Low Pivot Point and Extreme Reversal System and Bullish Extreme Reversal setup Send ,SXLE
OR When Low Pivot Point and Outside Reversal System and Bullish Outside Reversal Setup Send SXLE
OR When Low Pivot Point and Doji Reversal System and Bullish Doji Reversal Setup Send, SXLE
Candlestick Reversal System Algo Strategy Parameters for TradingView Charts
1.Length: This is number of bars used to calculated Ex: 14 à previous 14 candles are used
2.Backtesting : Use this to backtest the strategy between Starting and Ending Date and time , it can also be used to set trades in future time
3.Alert_Message : Need to copy while creating alert into Message Box
4.Trade Setup : Intraday / Positional (Selecct accordingly)
5.Start Time Stop Time (Session 1) : Intraday / Positional start time and end time of trade for session 1
6.End Session 1 : Define time to exit any existing position taken in session 1 so that exchange charges will not apply
7.Use Second Session : Check this to use second intraday session
8.Start Time Stop Time (Session 2) : Intraday / Positional start time and end time of trade for session 2
9.End Session 1 : Define time to exit any existing position taken in session 2 so that exchange charges will not apply
10.Use Target : check if you want to set required target if not cheque will not applicable
11.Use StopLoss : Cheque if you want to set stop loss if not cheque will not applicable
12.Trailling Stoploss : Cheque if you want to set trailing stop loss if not cheque will not applicable
13.Point Or Percentage For TG SL : Use Points or Percentage as per your choice
14.Target : Set as per the selection of (Point Or Percentage For TG SL)
15.Stop Loss : Set as per the selection of (Point Or Percentage For TG SL)
16.TSL_Type : Select as per your logic in %/ATR/Points
17.TSL_Input : Set in case you select %/Points in TSL_Type
18.ATR Length : Set as per your logic if you select ATR in the field of TSL_Type
19.ATR_Mult : Set as per your logic if you select ATR in the field of TSL_Type
20.Segment : Select segment of your logic EQ/FUTIDX/FUTSTK/OPTIDX/OPTSTK/FUTCUR/FUTCUM (Used in case of option / Futures )
21.Select Expiry Date : Select the expiry date of your trade as per the segment you selected (Used in case of option / Futures )
22.Select Expiry Month : Select the expiry Month of your trade as per the segment you selected (Used in case of option / Futures )
23.Year : Select the expiry Year of your trade as per the segment you selected (Used in case of option / Futures )
24.Quantity : Enter the quantity in which you want to trade (Used in case of option / Futures )
25.Product Type : Select MIS/Normal/ CNC as per your logic (Used in case of option / Futures )
26.Order Type : Select Market/Limit as per your logic (Used in case of option / Futures )
27.Strategy Tag : Enter the value in case you are using webhook / advance template in APIBridgeTM
28.Lotsize : Enter the lotsize as per your lotic and quentity selection (Used in case of option / Futures )
29.STEP (OTM/ATM/ ITM ) : Select OTM(+1)/ATM(0)/ ITM (-1) as per your logic works in case of options only
30.DIFFERENCE_BETWEEN 2 STRIKE : Select difference of 2 strikes you have used in APIBridge symbol setting list, like for Nifty 50 BankNifty 100
31.APIB Port : Set as per provided to you by Algoji in case of webhook / advance templet
The Segment full form is given below
EQ Equity
FUTIDX Future Index
FUTSTK Future Stock
OPTIDX Index Option
OPTSTK Stock Option
FUTCUR Futcur Currency
FUTCUM Future Commodity
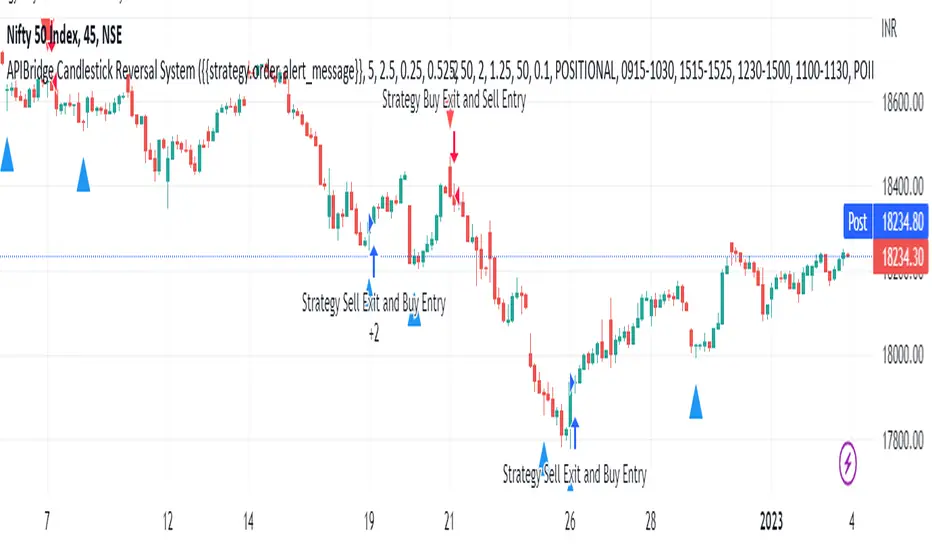
12/26-IT strategyBase of this Strategy is crossover of 12EMA on 26EMA.
Also multiple other criteria has to meet for buy signal, Criterias mentioned below
//////////////////////////////////
There two entry option to select. Either one or both can be selected:
1. Only 12/26 Cross over
a. 12/26 crossover.
b. RSI (14) value to be between a range (RSI is inbuilt, but lower and upper range can be defined in settings)
c. MACD (12, 26) to be positive and above signal line (this is inbuilt)
2. Recent 12/26 Cross over and closing above pivot point(resistance)
a. 12/26 crossover has to be recent, CrossOverLookbackCandles value will look for crossover in # previous candles..
b. RSI (14) value to be between a range (RSI is inbuilt, but lower and upper range can be defined in settings)
c. MACD (12, 26) to be positive and above signal line (this is inbuilt)
d. closing above resistance line
//////////////////////////////////
For Exit we have three options. you can select any SL as per your need, multiple SLs can also be selected
1. Trailing Stop Loss.
Source for TSL is adjustable(open, close, high or low), also you have to mention % below your source TSL has to be placed.
Once closing is below TSL, exit will be triggered.
2. Closing below 7SMA
After 7SMA SL is enabled, 7SMA will be plotted on chart and exit signal will be triggered when closing is below 7SMA.
Choose this option for LESS risk and rewards
3. 12/26 Crossdown
Once 12EMA crossdown below 26EMA, exit will be triggered.
Choose this option for HIGH risk and rewards
//////////////////////////////////
Resistance line is plotted based on left and right candles, if 10(can be changed) is used for both left and right, indicator will look for 10 candles in left and 10 candles in right and if both left and right candle are lower then a line is plotted.
Source has to be selected (close or high)
//////////////////////////////////
Qty mentioned in Buy trigger will be based on BUYVALUE entered
//////////////////////////////////
Multiple Target option is available, if first target is matched how much percentage of qty to be sold can be defined.
If you wish to have only one Target, then exit qty in first target must be 100