OXE MTF Range Breakout Pro v3OXE MTF Range Breakout Pro v3
Complete Trading Guide for Members
📊 INTRODUCTION
OXE MTF Range Breakout Pro is a professional-grade indicator designed to identify high-probability breakout trades from consolidation ranges. It combines price action analysis with multi-timeframe confluence to filter out false breakouts and deliver quality signals.
What Makes This Indicator Unique?
Unlike simple breakout indicators that trigger on every range break, OXE uses a 5-layer confluence system to ensure you only take trades when multiple factors align:
✅ Range Detection - Identifies legitimate consolidation zones
✅ Volume Confirmation - Requires volume spike on breakout
✅ RSI Filter - Ensures momentum supports the move
✅ Candle Strength - Strong breakout candle required
✅ HTF Trend Alignment - Trade WITH the higher timeframe trend
Result: Fewer signals, but significantly higher win rate.
🎯 HOW IT WORKS
The Trading Cycle
SCANNING → FORMING → LOCKED → BREAKOUT → SIGNAL (or BLOCKED)
Phase 1: SCANNING
The indicator continuously scans for price consolidation (sideways movement within a defined range).
Phase 2: FORMING
When price starts consolidating, the indicator begins counting bars. You'll see this in the panel as "FORMING".
Phase 3: LOCKED
Once consolidation meets the minimum bar requirement (default: 5 bars), the range becomes LOCKED. A purple box appears on chart showing the exact range boundaries.
Phase 4: BREAKOUT
When price breaks above/below the locked range:
All confluence filters pass → ✅ SIGNAL (Green/Red arrow + colored box)
One or more filters fail → ❌ BLOCKED (Gray box + X marker showing which filter failed)
📈 RECOMMENDED SETTINGS
Default Setup: M5 Chart + H1 HTF Filter
SettingValueReasonChart TimeframeM5Best balance of signals and qualityHTF Timeframe60 (H1)Filters against major trendRange Lookback15 bars~1 hour of consolidation on M5Min Consolidation5 barsConfirms real range, not just pauseVolume Spike1.2x20% above average confirms interestRSI FilterONPrevents counter-trend entriesStrong CandleON (40%)Ensures conviction on breakout
🔧 SETTINGS EXPLAINED
Range Detection
SettingDescriptionRecommendedRange Lookback BarsHow many bars to analyze for range15Max Range Size (x ATR)Maximum range width relative to ATR2.5Min Consolidation BarsMinimum bars before range is valid5
💡 Tip: Lower "Min Consolidation Bars" = more signals but lower quality. Higher = fewer but better signals.
Breakout Settings
SettingDescriptionRecommendedBreakout Trigger"Close" = candle must close beyond rangeCloseBreakout Buffer %Extra % beyond range for confirmation0.0
💡 Tip: Use "Close" for fewer false breakouts. Use "Wick" for earlier entries (but more risk).
Confluence Filters
FilterWhat It DoesWhen to DisableVolume FilterRequires 1.2x average volumeLow-volume assetsRSI FilterBUY needs RSI > 45, SELL needs RSI < 55Strong momentum tradesStrong CandleBreakout candle body ≥ 40% of rangeVolatile marketsHTF Trend FilterMust align with H1 EMA trendCounter-trend scalps
📊 READING THE CHART
Box Colors
ColorMeaning🟣 PurpleActive range being monitored🟢 GreenValid BUY breakout (all filters passed)🔴 RedValid SELL breakout (all filters passed)⬜ GrayBLOCKED breakout (one or more filters failed)
Signal Labels
LabelMeaning▲ BUYValid long entry signal▼ SELLValid short entry signal✗ VolBreakout blocked - volume too low✗ RSIBreakout blocked - RSI filter failed✗ CandleBreakout blocked - weak breakout candle✗ HTFBreakout blocked - against higher timeframe trend
Target Lines (After Signal)
LineDescriptionTP1Take Profit 1 = 1.0x range sizeTP2Take Profit 2 = 1.5x range sizeTP3Take Profit 3 = 2.0x range sizeSLStop Loss = opposite side of range
📋 INFO PANEL EXPLAINED
The panel in the top-right shows real-time status:
FieldDescriptionStateSCANNING / FORMING / LOCKEDRange HighUpper boundary of locked rangeRange LowLower boundary of locked rangeSizeRange size in price unitsConsol BarsHow many bars in current consolidationVolume✓ SPIKE = volume filter passingRSICurrent RSI value (green > 50, red < 50)Candle✓ STRONG = current candle meets body %HTF▲ BULL / ▼ BEAR = H1 trend directionLast SignalMost recent signal direction
🎮 TRADING STRATEGY
Entry Rules
For BUY Signal:
✅ Range box turns GREEN
✅ "▲ BUY" label appears
✅ HTF shows "▲ BULL"
✅ Volume shows "✓ SPIKE"
→ Enter at candle close
For SELL Signal:
✅ Range box turns RED
✅ "▼ SELL" label appears
✅ HTF shows "▼ BEAR"
✅ Volume shows "✓ SPIKE"
→ Enter at candle close
Exit Strategy
Conservative Approach:
Exit 100% at TP1 (1:1 risk/reward)
Balanced Approach:
Exit 50% at TP1
Exit 30% at TP2
Exit 20% at TP3 (or trail stop)
Aggressive Approach:
Exit 33% at TP1
Exit 33% at TP2
Let 34% run with trailing stop
Stop Loss
Always use the SL line shown on chart
SL is placed at the opposite side of the range
Never move SL further away
⚠️ UNDERSTANDING BLOCKED SIGNALS (GRAY BOXES)
Gray boxes are learning opportunities. They show where a breakout WOULD have triggered, but was blocked by filters.
Why Blocked Signals Matter:
Validation - Many gray boxes that would have failed = filters working correctly
Filter Tuning - If good moves are getting blocked, consider adjusting that filter
Market Context - Many blocked signals = choppy market, reduce position size
Common Block Reasons:
BlockWhat It MeansAction✗ VolNo institutional interestWait for volume✗ RSICounter-trend moveDon't fight momentum✗ CandleWeak breakout convictionWait for stronger break✗ HTFAgainst major trendHigher risk trade
💡 Pro Tip: If you see "✗ HTF" but the breakout worked anyway, you found a potential reversal setup - but these require advanced skills.
📅 BEST TRADING TIMES
For XAUUSD (Gold):
SessionTime (GMT)QualityLondon Open07:00 - 10:00⭐⭐⭐⭐⭐ BESTNY Open12:00 - 15:00⭐⭐⭐⭐⭐ BESTLondon/NY Overlap12:00 - 16:00⭐⭐⭐⭐⭐ BESTLondon Close15:00 - 17:00⭐⭐⭐ GoodAsian Session00:00 - 07:00⭐⭐ Avoid
For Forex Pairs:
Trade during the relevant session for that currency:
EUR/USD → London + NY
GBP/USD → London + NY
USD/JPY → Tokyo + NY
AUD/USD → Tokyo + Sydney
🛡️ RISK MANAGEMENT RULES
Position Sizing
Account RiskPer Trade RiskRationaleConservative0.5% - 1%Best for learningModerate1% - 2%Standard approachAggressive2% - 3%Experienced only
Daily Limits
Max trades per day: 3-5
Max daily loss: 3% of account
Stop trading after: 2 consecutive losses
The 3-Strike Rule
Strike 1: Loss → Reduce position size by 50%
Strike 2: Another loss → Stop trading for the day
Strike 3: Third loss day in a row → Take 1-2 days off
❌ COMMON MISTAKES TO AVOID
MistakeWhy It's BadSolutionEntering before signalAnticipating breakouts fails oftenWait for confirmed signalIgnoring gray boxesThey show the filter is workingTrust the systemTrading against HTFLower probabilityOnly trade WITH trendMoving stop lossOne big loss wipes many winsAccept the lossOvertradingQuality > quantity3-5 trades max/dayTrading newsUnpredictable spikesAvoid 30min before/after
🔄 QUICK START CHECKLIST
Before each trade, confirm:
Chart is on M5 timeframe
HTF filter set to 60 (H1)
Range box is LOCKED (not just forming)
Box turned GREEN or RED (not gray)
Signal label shows ▲ BUY or ▼ SELL
Panel shows ✓ SPIKE for volume
HTF trend aligns with signal direction
Current time is London or NY session
No major news in next 30 minutes
Risk is 1-2% maximum
📱 ALERT SETUP
To receive alerts on your phone:
Click the Alert button (clock icon) in TradingView
Select OXE MTF Range Breakout Pro v3
Choose condition: "BUY" or "SELL"
Set notification: App notification + Sound
Create separate alerts for BUY and SELL
💡 Tip: Set alerts on multiple pairs to catch more opportunities.
📊 PERFORMANCE EXPECTATIONS
Based on proper usage with recommended settings:
MetricExpected RangeWin Rate55% - 65%Average R:R1.5 : 1Signals per Day2-5 on M5Monthly Return5% - 15% (with 1% risk)Max Drawdown5% - 10%
⚠️ Disclaimer: Past performance doesn't guarantee future results. Always trade with capital you can afford to lose.
🆘 TROUBLESHOOTING
IssueSolutionNo signals appearingCheck if filters are too strict, especially HTFToo many gray boxesMarket is choppy - reduce trading or loosen one filterSignals always wrong directionHTF filter may be lagging - reduce HTF EMA lengthRange boxes too smallIncrease "Max Range Size (x ATR)"Range boxes too largeDecrease "Max Range Size (x ATR)"
📞 SUMMARY
OXE MTF Range Breakout Pro v3 is designed to help you:
✅ Identify high-quality consolidation ranges
✅ Filter false breakouts with multi-layer confluence
✅ Enter only when multiple factors align
✅ Exit with clear TP/SL targets
✅ Learn from blocked signals (gray boxes)
For mid to long term trades, use the indicator on H1 with Daily as the HTF filter.
Remember: The gray boxes showing blocked signals are a FEATURE, not a bug. They prove the filters are working to keep you out of low-probability trades.
Trade smart. Trade with confluence. Trade OXE.
© OXE Trading Systems - For Members Only
Cari skrip untuk "range"

Control Candle Range [UkutaLabs]Control Candle Range
█ OVERVIEW
The Control Candle Range is a powerful trading tool that automatically identifies control candles in real time. The versatile ranges drawn by this indicator can be used in a variety of trading strategies because they can be used as ranges as well as areas of support and resistance.
The purpose of this script is to simplify the trading experience of users by automatically identifying and displaying Control Candle Ranges.
█ USAGE
A Control Candle is a candle that is followed by two consecutive inside candles. When this pattern is detected, this indicator will automatically identify it and draw a range in real time. This range will continue to extend as long as candles continue to close within the range of the Control Candle. It is important to note that a Control Candle is still valid if the price action exits its range as long as it closes within its range.
This script also supports higher time frame mapping, allowing you to draw Control Candle Ranges from higher timeframes onto lower timeframe charts. This is a powerful feature that allows users to see multiple timeframes worth of information at a glance on one single chart.
Each Control Candle Range will also be displayed with a label to allow users to understand at a glance which timeframe the range is being drawn from. These labels can be turned off in the settings.
The user also has the ability to adjust the color of each timeframe’s ranges.
█ SETTINGS
Configuration
• Show Labels: Determines whether or not identifying labels are displayed on ranges.
• Label Size: Determines the size of labels.
• Text Alignment: Determines where labels are drawn on ranges.
• Max Display: Determines the maximum number of ranges that can be drawn from each timeframe.
Current Timeframe
• Display (On/Off): Determines whether or not ranges from the current timeframe will be drawn on the chart.
• Color: Determines the color of ranges drawn from the current timeframe.
5 Minute (Higher Timeframe)
• Display (On/Off): Determines whether or not ranges from the 5 minute timeframe will be drawn on the chart.
• Color: Determines the color of ranges drawn from the 5 minute timeframe.
15 Minute (Higher Timeframe)
• Display (On/Off): Determines whether or not ranges from the 15 minute timeframe will be drawn on the chart.
• Color: Determines the color of ranges drawn from the 15 minute timeframe.
30 Minute (Higher Timeframe)
• Display (On/Off): Determines whether or not ranges from the 30 minute timeframe will be drawn on the chart.
• Color: Determines the color of ranges drawn from the 30 minute timeframe.
60 Minute (Higher Timeframe)
• Display (On/Off): Determines whether or not ranges from the 60 minute timeframe will be drawn on the chart.
• Color: Determines the color of ranges drawn from the 60 minute timeframe.
240 Minute (Higher Timeframe)
• Display (On/Off): Determines whether or not ranges from the 240 minute timeframe will be drawn on the chart.
• Color: Determines the color of ranges drawn from the 240 minute timeframe.
Daily (Higher Timeframe)
• Display (On/Off): Determines whether or not ranges from the daily timeframe will be drawn on the chart.
• Color: Determines the color of ranges drawn from the daily timeframe.

HoplaRanges 2.0 Range Gates & Shelves-Style StructureHoplaRanges v6 maps price structure using tick-accurate 3-based range shelves and key gate levels inside each range: 3/11/17/29/41/47/53/59/71/83/89/97.
It’s built for clean execution and planning: configurable range width, Shelves-style scroll + extend, independent high/low boundary colors, and flexible label behavior (including right-edge labels even when levels stop at price).
What it does
Builds a repeating 3-based range grid around current price using a tick-native step.
Draws multiple ranges above and below the current anchored range.
Plots selected gate pairs inside every range:
3–97, 11–89, 17–83, 29–71, 41–59, 47–53
Lets you accent specific gate pairs (thickness and optional accent color).
Gives you Shelves-style controls:
Scroll (follow live price) or static anchoring
Range width (bars) to control history footprint
Independent Extend Right for levels and for high/low boundaries
Labels are fully configurable:
Toggle ON/OFF
Optional dynamic labels (append the live price)
Optional right-edge labels independent from whether levels extend right
Quick Start (recommended)
Start with a sensible range size
Most intraday charts: 27 or 81
If levels feel too tight/noisy → go bigger (81 → 243)
If levels feel too wide/slow → go smaller (81 → 27)
Keep it readable
Number of ranges to show: 2
Range width (bars): 150–300
Choose your display style
Scroll: ON for live trading
Extend Right (levels):
ON for forward planning and target mapping
OFF for a minimalist “stop at price” look
Labels to right edge:
ON if you want shelf-like right margin labeling
OFF if you want labels pinned at price
Reduce clutter
If needed, keep only the highest ROI gates:
47–53 (equilibrium) and 3–97 (extremes)
Recommended Presets (practical starting points)
Indices (NQ / ES)
Intraday (1–5m)
3-range: 81
Ranges to show: 2–3
Range width: 150–300
Extend Right (levels): ON
Labels: right edge ON, dynamic OFF
Scalping (15s–1m)
3-range: 27
Ranges to show: 2
Range width: 100–200
Consider enabling fewer gates (e.g., 47–53 + 17–83 + 3–97)
Gold (GC)
Intraday (1–5m)
3-range: 243
Ranges to show: 2
Range width: 200–400
Extend Right (levels): ON
Crypto (BTC / ETH)
Intraday (1–5m)
3-range: 81 (or 243 in high volatility)
Ranges to show: 2–3
Range width: 200–400
Extend Right (levels): ON
FX Majors
Intraday (5–15m)
3-range: 27 (or 81 if too tight)
Ranges to show: 2
Range width: 200–400
Extend Right (levels): optional (OFF for clean tape-style charts)
How traders typically use HoplaRanges v6
Equilibrium mapping: 47–53 often behaves like a decision shelf / mean magnet.
Premium/discount framing: 3/11/17 represent discount zones; 83/89/97 represent premium zones.
Rotation planning: set expectations for moves from one gate to the next (e.g., 47→53→59→71→83).
Reaction zones: watch for taps, rejections, acceptance, and displacement around gates.
This is a structure tool: it gives you a consistent map. Your execution still depends on your confirmations and rules.
FAQ
Labels aren’t far enough to the right.
Increase Label offset (bars to the right).
I want levels to project forward like shelves.
Turn ON Extend Right (levels).
I want lines to stop at price but labels on the right margin.
Turn OFF Extend Right (levels) and turn ON Labels to right edge.
It looks too busy.
Reduce “ranges to show” to 1–2 and disable some gate pairs (keep 47–53 + 3–97 as a strong baseline).
Changelog
v6 (Public Release)
Full rebuild in Pine Script v6, self-contained.
Tick-accurate step sizing for stable behavior across markets.
Independent colors for Range LOW and Range HIGH boundaries.
Shelves-style controls: Scroll, Range width, and independent Extend Right for levels and boundaries.
Labels: toggle, dynamic price option, and right-edge placement independent from level extension.
Accent system: thickness-only mode or accent color + thickness.
Risk & Disclaimer
This indicator is provided for educational and informational purposes only. It is not financial advice and does not provide guaranteed trade signals. Trading involves risk, and you are responsible for all decisions, risk management, and outcomes. Past behavior around levels does not guarantee future results.

ICT CBDR Range |MC|This indicator plots the CBDR Range on the Chart (Credits go to TFlab)
💎 What Is the Central Bank Dealers Range (CBDR)? 💎
In the Inner Circle Trader (ICT) Strategy, the CBDR identifies the projected high and low of a trading day. This range is calculated between 2:00 PM and 8:00 PM New York time. By observing specific deviations from the average price within this window, traders estimate potential price movements for the next session.
The range is derived from average price action.
Deviation levels above and below this average help forecast price behavior.
These deviations indicate how far prices may extend from the central range.
💎 Ideal Range Parameters for CBDR 💎
To optimize CBDR effectiveness, traders should consider the following:
Range Height: Determined by measuring the highest and lowest price within the CBDR window. It is preferable to use candlestick bodies, although wicks can be considered when body size is minimal.
Optimal Range: The most reliable CBDR measurements occur within a range of 10 to 20 pips, ideally remaining under 40 pips.
Large Ranges: When the range exceeds 40 pips, short-term trades tend to perform more favorably.
💎 Benefits of Implementing CBDR 💎
Using the Central Bank Dealers Range offers multiple advantages:
Improved Price Forecasting: Enhances accuracy in predicting price movements.
Risk Minimization: Enables traders to avoid unfavorable trade conditions.
Higher Success Probability: Identifies high-probability trade setups.
Versatility: Applicable to various assets and timeframes.
💎 How to Apply CBDR in Daily Trading 💎
Each trading day, the market tends to move price 1–2 times the CBDR range against the prevailing trend to gather liquidity. Following this, a directional move in line with the trend often occurs, typically equivalent to four times the CBDR range.
💎 Bearish Market Scenario 💎
On bearish days:
Price may exceed the upper CBDR boundary by a maximum of two units.
A typical move is one unit above the range to collect stop orders.
The projected daily low is often three units below the CBDR, usually forming at the end of the London session.
💎 Bullish Market Scenario 💎
On bullish days:
Price generally drops no more than two units below the CBDR.
A downward movement of one unit is common to gather liquidity.
The projected high of the day appears three units above the CBDR, typically near the London session close.
💎 Best Timeframes for CBDR Strategy 💎
CBDR is most effective on the following intraday timeframes:
15-Minute Chart: Offers precise insight into short-term price fluctuations.
30-Minute Chart: Provides a broader perspective for swing trading and market planning.
💎 Most Suitable Markets and Pairs for CBDR 💎
Originally developed for NASDAQ and S&P 500, the CBDR approach has since been adapted for other financial instruments.
Recommended Currency Pairs:
GBP/USD
EUR/USD
Precious Metals:
XAU/USD
XAG/USD
These markets demonstrate favorable price behavior around the CBDR, making them ideal for this strategy.
Happy Trading!

Cold Brew Ranges🧭 Core Logic and Calculation
The fundamental logic for each range (OR and CR) is identical:
Time Definition: Each range is defined by a specific Start Time and a fixed 30-second duration. The timestamp function, using the "America/New_York" time zone, is used to calculate the exact start time in Unix milliseconds for the current day.
Example: t0200 = timestamp(TZ, yC, mC, dC, 2, 0, 0) sets the start time for the 02:00 OR to 2:00:00 AM NY time.
Range Data Collection: The indicator uses the request.security_lower_tf() function to collect the High (hArr) and Low (lArr) prices of all bars that fall within the defined 30-second window, using a user-specified, sub-chart-timeframe (openrangetime, defaulted to "1" second, "30S", or "5" minutes). This ensures high precision in capturing the exact high and low during the 30-second window.
High/Low Determination: It iteratively finds the absolute highest price (OR_high) and the absolute lowest price (OR_low) recorded by the bars during that 30-second window.
Range Locking: Once the current chart bar's time (lastTs) passes the 30-second End Time (tEnd), the High and Low are locked (OR_locked = true), meaning the range calculation is complete for the day.
Drawing: Upon locking, the range is drawn on the chart using line.new for the High, Low, and Equilibrium, and box.new for the shaded fill. The lines are extended to a subsequent time anchor point (e.g., the 02:00 OR is extended to 08:20, the 09:30 OR is extended to 16:00).
Equilibrium (EQ): This is calculated as the simple average (midpoint) of the High and Low of the range.
EQ=
2
OR_High+OR_Low
⏰ Defined Trading Ranges
The indicator defines and tracks the following specific 30-second ranges:
Range Name Type Start Time (NY) Line Extension End Time (NY) Common Market Context
02:00 OR Opening 02:00:00 08:20:00 Asian/European Market Overlap
08:20 OR Opening 08:20:00 16:00:00 Pre-New York Open
09:30 OR Opening 09:30:00 16:00:00 New York Stock Exchange Open (Most significant OR)
18:00 OR Opening 18:00:00 20:00:00 Futures Market Open (Sunday/Monday)
20:00 OR Opening 20:00:00 Next Day's session start Asian Session Start
15:50 CR Closing 15:50:00 20:00:00 New York Close Range
⚙️ Key User Inputs and Customization
The script offers extensive control over which ranges are displayed and how they are visualized:
Range Time & History
openrangetime: Sets the sub-timeframe (e.g., "1" for 1 second) used to calculate the precise High/Low of the 30-second range. Crucial for accuracy.
showHistory: A toggle to show the ranges from previous days (up to a histCap of 50 days).
Range Toggles and Styling
On/Off Toggles: Independent input.bool (e.g., OR_0200_on) to enable or disable the display of each individual range.
Colors & Width: Separate color and width inputs for the High/Low lines (hlC), the Equilibrium line (eqC), and the background fill (fillC) for each range.
Line Styles: Global inputs for the line styles of High/Low (lineStyleInput) and Equilibrium (eqLineStyleInput) lines (Solid, Dotted, or Dashed).
showFill: Global toggle to enable the shaded background box that highlights the area between the High and Low.
Extensions
The script calculates and plots extensions (multiples of the initial range) above the High and below the Low.
showExt: Toggles the visibility of the extension lines.
useRangeMultiples: If true, the step size for each extension level is equal to the initial range size:
Step=Range=OR_High−OR_Low
If false, the step size is a fixed value defined by stepPts (e.g., 60.0 points, which is a common value for NQ futures).
stepCnt: Determines how many extension levels (multiples) are drawn above and below the range (default is 10).
📈 Trading Strategy Implications
The Cold Brew Ranges indicator is a tool for session-based support and resistance and range breakout/reversal strategies.
Key Support/Resistance: The High and Low of these defined opening ranges often act as strong, predefined price levels. Traders look for price rejection off these boundaries or a breakout with conviction.
Equilibrium (Midpoint): The EQ often represents a fair value for that specific session's opening. Movements away from it are seen as opportunities, and a return to it is common.
Extensions: The range extensions serve as potential profit targets or stronger, layered support/resistance levels if the market trends aggressively after the opening range is set.
The core idea is that the activity in the first 30 seconds of a significant trading session (like the NYSE or a market session open) sets a bias and initial boundary for the trading period that follows.

ADR% / CDR% Range Analyzer - PajameinThe "ADR%/CDR% Range Analyzer" is a versatile TradingView indicator designed for traders who want to monitor and compare the "Average Daily Range (ADR%)" and "Current Daily Range (CDR%)" in real-time. ADR% represents the average percentage range (high-low relative to low) over a user-defined number of daily bars, helping you gauge a stock's typical volatility. CDR% shows the current session's range as a percentage, either intraday (customizable from start to end price) or full daily, allowing you to assess how the current bar's movement stacks up against historical norms.
Key features include:
- "Visual Comparison": Displays both values as clean labels on the chart with customizable positions (separate or combined).
- "Dynamic Background Coloring": CDR% label background changes color based on its relation to ADR%—light green for low volatility (< low threshold), light blue for neutral (between thresholds), and light red for high volatility (> high threshold). This helps quickly spot expansion or contraction in daily moves.
- "Flexibility": Works on any timeframe, with options for intraday customization and anti-clipping adjustments for multi-pane layouts.
This indicator is ideal for day traders, swing traders, or anyone tracking volatility breakouts, range-bound setups, or risk management based on expected daily moves.
Input Settings Guide
Here's a breakdown of each setting and how it enhances your trading workflow:
- "Show ADR%" (Boolean, default: true)
Toggle to display/hide the ADR% label. Use this to declutter your chart when focusing solely on current range.
- "Show CDR%" (Boolean, default: true)
Toggle to display/hide the CDR% label. Ideal for charts where you only need historical average or current metrics.
- "ADR% Length" (Integer, default: 20, min: 1)
Number of daily bars for averaging the range percentage. Shorter lengths (e.g., 10) for recent volatility; longer (e.g., 50) for broader trends.
- "CDR%: Start" (Source, default: low)
Starting price for intraday CDR% (e.g., open, previous close). Customize for specific range measurements like gap fills.
- "CDR%: End" (Source, default: high)
Ending price for intraday CDR% (e.g., low, close). Pair with Start for targeted ranges, like open-to-low for downside capture.
- "Intraday Display" (String dropdown: "Intraday CDR%", "Daily CDR%", default: "Daily CDR%")
Switch between real-time intraday calculation (dynamic updates) or fixed daily value (stable, non-repainting).
- "Low Threshold %" (Float, default: 40.0, range: 0-100)
Percentage of ADR% below which CDR% gets the low (green) background. Lower it (e.g., 30%) for stricter low-volatility alerts.
- "High Threshold %" (Float, default: 60.0, range: 0-100)
Percentage of ADR% above which CDR% gets the high (red) background. Raise it (e.g., 70%) to highlight only extreme expansions.
- "ADR% Text Color" (Color picker, default: black)
Foreground color for ADR% text. Choose contrasting colors for dark/light themes.
- "CDR% Text Color" (Color picker, default: black)
Foreground color for CDR% text. Ensures readability over dynamic backgrounds.
- "Low CDR% Background (below low threshold)" (Color picker, default: light green with 70% transparency)
Background for subdued ranges. Adjust opacity for subtlety.
- "Mid CDR% Background (between thresholds)" (Color picker, default: light blue with 70% transparency)
Neutral background for typical moves.
- "High CDR% Background (above high threshold)" (Color picker, default: light red with 70% transparency)
Alert-style background for breakouts.
- "Cell Height %" (Integer, default: 8, range: 1-20)
Vertical padding for labels as a percentage of chart height. Increase (e.g., 12) in multi-pane layouts to prevent text clipping; decrease for compact views.
- "ADR% Position" (String dropdown: Top/Bottom/Middle Left/Right/Center, default: Bottom Right)
Placement of ADR% label. Use separate positions for side-by-side comparison.
- "CDR% Position" (String dropdown: Top/Bottom/Middle Left/Right/Center, default: Bottom Right)
Placement of CDR% label. Matching positions auto-stacks them vertically.
- "Text Size" (String dropdown: Tiny/Small/Normal/Large, default: Normal)
Font size for labels. "Small" for dense charts; "Normal" for clarity.
Usage Tips
- "Volatility Trading": Set thresholds to 50%/80% for spotting range expansions during news events.
- "Multi-Timeframe": Apply on 5-min charts with daily ADR for intraday targets (e.g., aim for 80% of ADR).
- "Customization": For forex/crypto, tweak Start/End to session opens. Test in replay mode to verify non-repainting.
- "Limitations": Intraday mode updates live but may not repaint until bar close; daily mode is fixed.

Advanced Range Theory - ART📊 Advanced Range Theory (ART): The Institutional Blueprint
Stop drawing lines. Start reading the blueprint of the market. Advanced Range Theory (ART) is not another support and resistance indicator; it is a military-grade market structure engine designed to decode the language of institutional capital. It operates on a single, powerful premise: markets move in phases of consolidation and expansion, and the key to anticipation lies in understanding the complete lifecycle of these phases.
ART provides a living, breathing map of the battlefield, identifying institutional accumulation zones and tracking them with unparalleled precision from their inception as "Pending" ranges to their ultimate classification after a breakout. This is your X-ray into the market's skeletal structure.
🔬 THEORETICAL FRAMEWORK: THE ARCHITECTURE OF PRICE ACTION
ART is built on a multi-layered system of logic that moves beyond static levels. It treats ranges as dynamic entities with a narrative—a beginning, a middle, and an end. The core of the system is the dynamic classification engine, which analyzes not just the range, but the character of the price action that resolves it.
1. The Range Lifecycle: From Accumulation to Classification
This is the revolutionary heart of ART. A range's true identity is only revealed by how it is broken.
Phase 1: PENDING (Yellow): A new range is identified based on a period of price consolidation (a "parent" candle followed by a minimum number of "inside" candles). At this stage, it is a neutral zone of potential energy—an area where institutions are likely building positions. It is a question the market has not yet answered.
Phase 2: MITIGATION & CLASSIFICATION: When price breaks out and reaches a calculated extension level, the range is considered "mitigated." At this exact moment, ART analyzes the breakout's DNA to classify the range's true intent:
TYPE 1 - BREAKOUT (Blue): Characterized by a strong, impulsive move with confirming volume. This is a high-conviction breakout, signaling aggressive institutional participation and the likely start of a new trend. It is a statement of intent.
TYPE 2 - REVERSAL (Orange): Occurs when price attempts to break one way but is aggressively rejected, reversing and breaking out the other side. This signals absorption and a "failed auction," often marking significant market turning points.
TYPE 3 - PIVOT (Green): A more balanced breakout, lacking the explosive momentum of a Type 1. This often represents a resolution after a period of indecision or a pivot within a larger trading range.
2. The Hierarchical Map: Source & S/R Levels
ART doesn't just draw boxes; it builds a genealogical map of market structure.
SOURCE LEVEL (Thick Gold Line): This is the "genesis" point—the most recently mitigated range. It acts as the primary point of origin for the current market swing and serves as a critical level for determining overall bias. Price action above the Source is generally bullish; below is bearish.
S/R LEVELS (Cyan Lines): When a range is mitigated, the price level where it broke becomes a key Support/Resistance zone for the future. ART tracks the two most recent S/R levels, as these often act as powerful magnets or rejection points for price.
3. The Multi-Factor Validation Engine
To eliminate noise and focus only on institutionally significant ranges, every potential range must pass a rigorous quality control check:
Time-Based Consolidation: Requires a minimum number of consecutive inside candles (minInsideCandles), ensuring a true period of balance.
Volatility-Based Significance: The range's size must be greater than a multiple of the Average True Range (minRangeSize), filtering out insignificant micro-consolidations.
Participation Confirmation: The parent candle of the range is checked against average volume to ensure there was meaningful activity during its formation.
⚙️ THE COMMAND CONSOLE: CONFIGURING YOUR ART ENGINE
Every input is designed to give you granular control over the detection engine, allowing you to tune ART to any market or timeframe with precision. Each tooltip in the script provides a deep dive, but here is a summary of the core controls.
🎯 ART Detection Engine
Minimum Inside Candles: The soul of the detection algorithm. It defines the minimum number of bars that must be contained within a single "parent" candle to qualify as a range. Higher values (3-4) find major, significant consolidation zones. Lower values (1-2) are more sensitive and will identify shorter-term accumulation patterns.
Extension Multiplier & Fibonacci Extension: These control the profit target projections. The Extension Multiplier uses a simple measured move (e.g., 1.0 = a 1:1 projection of the range's height). The Fibonacci Extension uses the golden ratio (1.618) for harmonically-derived targets.
Mitigation Method (Cross vs. Close): Determines how a breakout is confirmed. Cross is more responsive, triggering as soon as price touches the extension. Close is more conservative, requiring a full candle to close beyond the level, which helps filter out fake-outs from wicks.
Min Range Size (ATR): A crucial noise filter. It ensures that ART ignores tiny, insignificant ranges by requiring a range's height to be a certain multiple of the current market volatility (ATR).
📊 Display & Visual Configuration
These settings give you full control over the visual interface. You can toggle every single element—from the Webb Scanner to the S/R Levels—to create a clean or a comprehensive view. Choose a color theme that suits your charting environment or define a fully custom palette.
🕸️ Webb Analysis Scanner
This is a unique real-time flow analysis tool. It draws dynamic, animated lines from the current price to recent historical points. This visualization helps reveal hidden "tendrils" of momentum and short-term support/resistance that are not immediately obvious, acting as a "sonar" for immediate price flow.
📊 THE ANALYTICS HUB: YOUR DASHBOARD DECODED
The dashboard provides a real-time, at-a-glance intelligence briefing on the current state of market structure as seen by the ART engine.
RANGE METRICS: This section is a "census" of the market's structure. It tells you the total number of ranges identified, how many are still Pending (awaiting a breakout), how many are Unmitigated (active but not yet broken), and how many have been Mitigated (classified and complete).
TYPE BREAKDOWN: This is a powerful gauge of market character. A high count of Type 1 (Breakout) ranges suggests a strong, trending environment. A rising number of Type 2 (Reversal) ranges can signal market exhaustion and potential trend changes. A dominant Type 3 (Pivot) count indicates a balanced, rotational market.
KEY GUIDE: The Large dashboard includes a full legend, so you never have to guess what a line or color represents. It's your built-in user manual.
🎨 DECODING THE BLUEPRINT: A VISUAL INTERPRETATION GUIDE
Every line and color in ART is designed for instant, intuitive understanding.
The Range Lines:
Yellow Lines: A Pending range. This is an active zone of accumulation. Pay close attention.
Colored Lines (Blue/Orange/Green): An unmitigated, classified range. The color tells you its breakout character.
Dotted Lines: A Mitigated range. Its story has been told. These historical levels can still act as support or resistance.
The Identification Zones: These colored boxes appear at a range's origin point after it has been classified. They are the "birth certificate" of the range, permanently marking its type (Breakout, Reversal, or Pivot) and providing an immediate visual history of market behavior.
The Hierarchical Lines:
Thick Gold Line (Source): The most important line on your chart. It is the anchor for your bias.
Cyan Lines (S/R): High-probability decision points. Expect reactions here.
Purple Dotted Lines (Extensions): Logical, calculated profit targets for breaking ranges.
🔧 THE ARCHITECT'S VISION: THE DEVELOPMENT JOURNEY
ART was born from a deep frustration with the static and subjective nature of traditional market structure analysis. Drawing lines by hand is inconsistent, and most indicators are reactive, only confirming what has already happened. The goal was to create a proactive, objective, and dynamic framework that could think about the market in terms of phases and lifecycles.
The breakthrough came from a simple shift in perspective: a range's true character isn't defined when it forms, but by how it resolves. This led to the development of the "post-breakout classification engine," which waits for the market to show its hand before assigning a definitive type. The Webb Scanner was inspired by the desire to visualize the unseen, to create a tool that could feel the immediate "pull" and "push" of price flow. The result is not just an indicator; it is a new language for interpreting price action, built on a foundation of logic, clarity, and precision.
⚠️ RISK DISCLAIMER & BEST PRACTICES
Advanced Range Theory is a professional-grade analytical tool designed to enhance a trader's decision-making process. It does not provide direct buy or sell signals. The levels and classifications it generates are based on historical price action and mathematical probabilities. All trading involves substantial risk, and past performance is not indicative of future results. Always use this tool in conjunction with a robust risk management plan.
"I fear not the man who has practiced 10,000 kicks once, but I fear the man who has practiced one kick 10,000 times."
— Dskyz, Trade with insight. Trade with anticipation.
— Bruce Lee

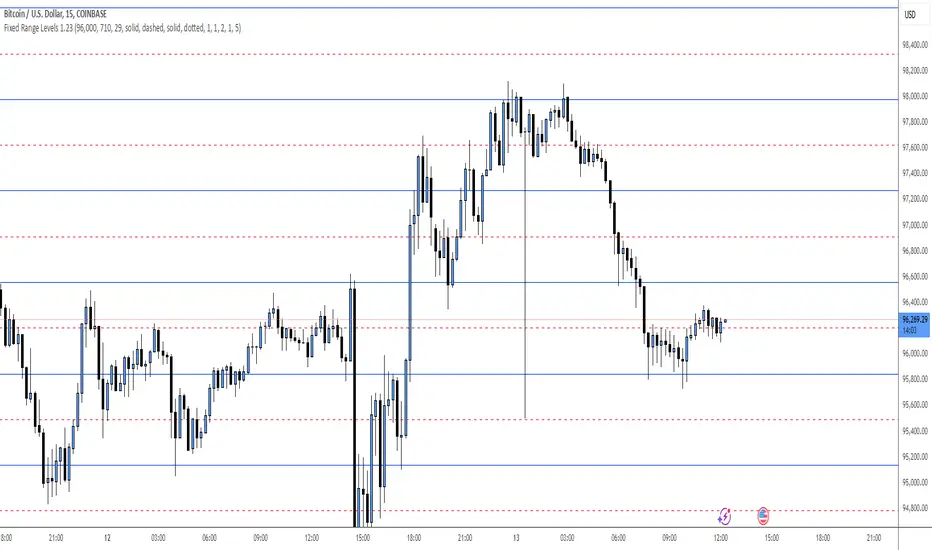
Fixed Range LevelsThis indicator draws horizontal price levels on your chart based on a starting price and a range size that you define. It can also draw midpoint lines between the main levels if enabled.
Here's a breakdown of its functionality:
Key Features:
Starting Price:
You define a starting price (e.g., 21630).
The indicator calculates a corrected base price by rounding the starting price to the nearest multiple of the range size.
Range Size:
You define a range size (e.g., 71).
The indicator draws horizontal lines at intervals of the range size above and below the corrected base price.
Dual Ranges:
You can define two range sizes (e.g., 71 and 29).
The indicator can draw levels for both ranges simultaneously or individually, depending on your settings.
Midpoint Lines:
If enabled, the indicator draws midpoint lines between the main levels.
For example, if the main levels are at 21584 and 21655, the midpoint line will be at 21619.5.
Customizable Styles:
You can customize the line style (solid, dotted, dashed) and color for both the main levels and midpoint lines.
Dynamic Levels:
The levels are recalculated and redrawn dynamically based on the starting price and range size.
How It Works:
Corrected Base Price Calculation:
The indicator calculates the corrected base price using the formula:
pinescript
Copy
correctedBasePrice = math.floor(startingPrice / rangeSize) * rangeSize
For example, if startingPrice = 21630 and rangeSize = 71:
Copy
correctedBasePrice = math.floor(21630 / 71) * 71 = 304 * 71 = 21584
Drawing Levels:
The indicator draws horizontal lines at intervals of the range size above and below the corrected base price.
For example, if rangeSize = 71 and maxLevels = 5, the levels will be drawn at:
Copy
21584 - (5 * 71) = 21249
21584 - (4 * 71) = 21320
...
21584 + (5 * 71) = 21939
Midpoint Lines:
If enabled, the indicator draws midpoint lines between the main levels.
For example, if the main levels are at 21584 and 21655, the midpoint line will be at:
Copy
(21584 + 21655) / 2 = 21619.5
Dual Ranges:
If you enable both ranges, the indicator will draw levels for both range sizes simultaneously.
For example, if rangeSize1 = 71 and rangeSize2 = 29, the indicator will draw two sets of levels:
Levels at intervals of 71 (e.g., 21584, 21655, 21726, ...).
Levels at intervals of 29 (e.g., 21634, 21663, 21692, ...).
Example Use Case:
Imagine you're trading a stock or cryptocurrency, and you want to identify key support and resistance levels based on a specific price range. Here's how you can use this indicator:
Set the Starting Price:
For example, if the current price is 21630, you can set this as the starting price.
Define the Range Size:
If you believe the price moves in increments of 71, set rangeSize1 = 71.
If you also want to track smaller increments of 29, set rangeSize2 = 29.
Enable Midpoint Lines:
If you want to see the midpoint between the main levels, enable Show Midpoint Line.
Customize Line Styles:
Choose different colors and styles for the main levels and midpoint lines to make them visually distinct.
Analyze the Chart:
The indicator will draw horizontal lines at the specified intervals, helping you identify potential support, resistance, and midpoint levels.
Why Is This Useful?
Support and Resistance Levels:
The horizontal lines act as dynamic support and resistance levels based on the range size you define.
Price Targets:
You can use the levels to identify potential price targets or areas where the price might reverse.
Midpoint Analysis:
The midpoint lines can help you identify areas of consolidation or potential breakout points.
Flexibility:
You can customize the range sizes, colors, and styles to suit your trading strategy.
Summary:
This indicator is a powerful tool for traders who want to visualize price levels and midpoints based on a specific range size. It helps you identify key levels for support, resistance, and potential price targets, making it easier to plan your trades.
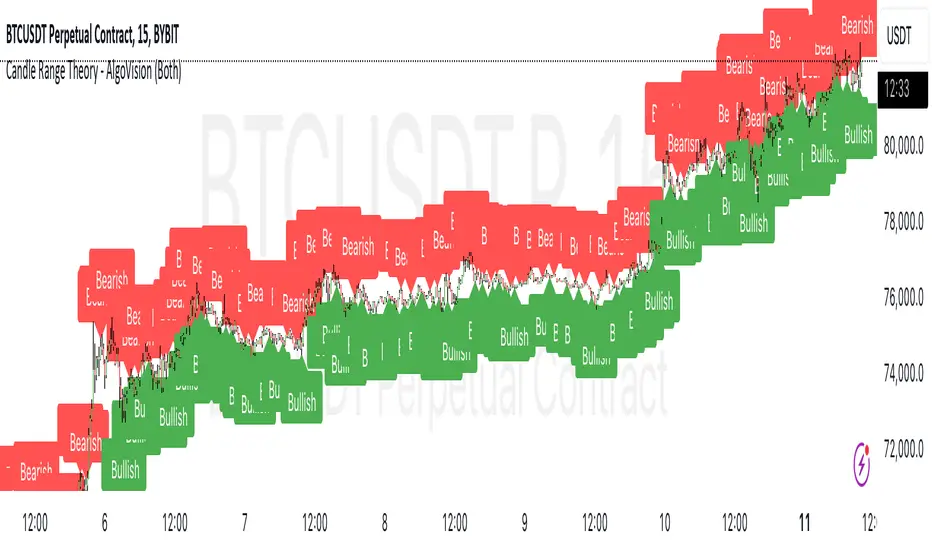
Candle Range Theory - AlgoVisionUnderstanding Candle Range Theory (CRT) in the AlgoVision Indicator
Candle Range Theory (CRT) is a structured approach to analyzing market movements within the price ranges of candlesticks. CRT is founded on the idea that each candlestick on a chart, regardless of timeframe, represents a distinct range of price action, marked by the candle's open, high, low, and close. This range gives insights into market dynamics, and when analyzed in lower timeframes, reveals patterns that indicate underlying market sentiment and institutional behaviors.
Key Concepts of Candle Range Theory
Candlestick Range: The range of a candlestick is simply the distance between its high and low. Across timeframes, this range highlights significant price behavior, with each candlestick representing a snapshot of price movement. The body (distance between open and close) shows the primary price action, while wicks (shadows) reflect price fluctuations or "noise" around this movement.
Multi-Timeframe Analysis: A higher-timeframe (HTF) candlestick can be dissected into smaller, structured price movements in lower timeframes (LTFs). By analyzing these smaller movements, traders gain a detailed view of the market’s progression within the HTF candlestick’s range. Each HTF candlestick’s high and low provide support and resistance levels on the LTF, where the price can "sweep," break out, or retest these levels.
Market Behavior within the Range: Price action within a range doesn’t move randomly; it follows structured behavior, often revealing patterns. By analyzing these patterns, CRT provides insights into the market’s intention to accumulate, manipulate, or distribute assets within these ranges. This behavior can indicate future market direction and increase the probability of accurate trading signals.
CRT and ICT Power of 3: Accumulation, Manipulation, and Distribution (AMD)
A foundational element of our CRT indicator is its combination with ICT’s Power of 3 (Accumulation, Manipulation, and Distribution or AMD). This approach identifies three stages of market movement:
Accumulation: During this phase, institutions accumulate positions within a tight price range, often leading to sideways movement. Here, price consolidates as institutions carefully enter or exit positions, erasing traces of their intent from public view.
Manipulation: Institutions often use manipulation to create false breakouts, targeting retail traders who enter the market on perceived breakouts or reversals. Manipulation is characterized by liquidity grabs, false breakouts, or stop hunts, as price momentarily moves outside the established range before quickly returning.
Distribution: Following accumulation and manipulation, the distribution phase aligns with the true market direction. Institutions now allow the market to move with the trend, initiating a stronger and more sustained price movement that aligns with their intended position.
This AMD cycle is often observed across multiple timeframes, allowing traders to refine entries and exits by identifying accumulation, manipulation, and distribution phases on smaller timeframes within the range of a higher-timeframe candle. CRT views this cycle as the "heartbeat" of the market—a continuous loop of price movements. With our indicator, you can identify this cycle on your current timeframe, with the signal candle acting as the "manipulation" candle.
How to Use the AlgoVision CRT Indicator
The AlgoVision CRT Indicator is designed to assist traders in identifying actionable points within the candle range framework. Our indicator operates by generating signals on the close of the second candle, setting up the expectation to trade the third candle as the "manipulation" candle. This is where price movement in a targeted direction typically occurs. Once you receive a signal on candle two's close, you can prepare to execute a trade on the next candle based on the manipulation phase within the CRT framework.
By setting alerts on a higher timeframe, you can receive either bullish or bearish signals that prepare you to enter trades on a lower timeframe. For instance, a bullish signal on the higher timeframe may signal to watch for a setup on the lower timeframe, allowing for precision entries during the accumulation or manipulation phases.
Conclusion By combining CRT with ICT Power of 3, the AlgoVision Indicator allows traders to leverage the CRT candlestick as a versatile tool for identifying potential market moves. This method provides beginners and seasoned traders alike with a robust framework to understand market dynamics and refine trade strategies across timeframes. Setting alerts on the higher timeframe to catch bullish or bearish CRT signals allows you to plan and execute trades on the lower timeframe, aligning your strategy with the broader market flow.
Evolution Ranger V2This indicator plots 4H and 15M ranges and fractals.
The ranges are formed by the fractals and breaks of these candles
It also shows in a label if the trend BIAS on the 4H is "UC, NFT, FT or SFT" (Long or Short)
This will give the user a BIAS for the coming trading day. So when price breaks out of the plotted range, you'll have a new bias trend change
If it trading within the range, the trend bias remains the same
UC = unconfirmed Bias => wait
NFT= No follow through => Take only trades in the opposite direction from the break
FT = Follow through. => Wait for price to retrace to the other side of the 4H range, than trade in the direction of the BIAS
SFT = Strong follow through => Take trades in the direction of the BIAS anywhere in the 4H range
It draws all the range lines you need, so you don't have to.
4H Range (also on 15M), on the 15M; external and internal ranges.
Lots of possibilities:
-Plots the fractals, so you don't need another indicator. (Option to let the fractals repaint or not)
-4H Fractal Range lines and BIAS (previous fractal break line) and a 4H-BIAS label both on the M15 and 4H charts. No more switching between 4H and 15M charts needed.
-Option to switch on/off historic ranges.
-BIAS label shows 'UC, NFT, FT and SFT' - Long and Short
-Lots of alerts, break of 4H range, 15M external and internal ranges. You can go wild with it. Select 'Alert Once per bar'
-Option to show the 'Inside bar' and in a different candle colour.
-Option to toggle the repaint of fractal when the current candle has not closed yet.
-Option to show the BIAS label only for a confirmed bar while trading in live markets. When 'Off' the BIAS label repaints, but gives information on what might come, when the current bar closes.
-Most of the lines can be adjusted for colour and style to your own liking.

FluxPulse Beacon## FluxPulse Beacon
FluxPulse Beacon applies a microstructure lens to every bar, combining directional thrust, realized volatility, and multi-timeframe liquidity checks to decide whether the tape is being pushed by real sponsorship or just noise. The oscillator's color-coded columns and adaptive burst thresholds transform complex flow dynamics into a single actionable flux score for futures and equities traders.
HOW IT WORKS
Momentum Extraction – Price differentials over a configurable pulse distance are smoothed using exponential moving averages to isolate directional thrust without reacting to single prints.
Volatility + Liquidity Normalization – The momentum stream is divided by realized volatility and multiplied by both local and higher-timeframe EMA volume ratios, ensuring pulses only appear when volatility and liquidity align.
Adaptive Thresholding – A volatility-derived standard deviation of flux is blended with the base threshold so bursts scale automatically between low-volatility and high-volatility market conditions.
Divergence Engine – Linear regression slopes compare price vs. flux to tag bullish/bearish divergences, highlighting stealth accumulation or distribution zones.
HOW TO USE IT
Continuation Entries : Go with the trend when histogram bars stay above the adaptive threshold, the signal line confirms, and trend bias agrees—this is where liquidity-backed follow-through lives.
Fade Plays : Watch for divergence alerts and shrinking compression values; when flux prints below zero yet price grinds higher, hidden selling pressure often precedes rollovers.
Session Filter : Compression percentage in the diagnostics table instantly tells you whether to trade thin overnight sessions—low compression means stand down.
VISUAL FEATURES
Dynamic background heat maps flux magnitude, while threshold lines provide a quick read on whether a pulse is statistically significant.
Diagnostics table displays live flux, signal, adaptive threshold, and compression for quick reference.
Alert-first workflow: The surface is intentionally clean—bursts and divergences are delivered via alerts instead of on-chart clutter.
PARAMETERS
Trend EMA Length (default: 34): Defines the macro bias anchor; increase for higher-timeframe confirmation.
Pulse Distance (default: 8): Controls how sensitive momentum extraction becomes.
Volatility Window (default: 21): Sample window for realized volatility normalization.
Liquidity Window (default: 55): Volume smoothing window that proxies liquidity expansion.
Liquidity Reference TF (default: 60): Select a higher timeframe to cross-check whether current volume matches institutional flows.
Adaptive Threshold (default: enabled): Disable for fixed thresholds on slower markets; enable for high-volatility assets.
Base Burst Threshold (default: 1.25): Minimum flux magnitude that qualifies as an actionable pulse.
ALERTS
The indicator includes four alert conditions:
Bull Burst: Detects upside liquidity pulses
Bear Burst: Detects downside liquidity pulses
Bull Divergence: Flags bullish delta divergence
Bear Divergence: Flags bearish delta divergence
LIMITATIONS
This indicator is designed for liquid futures and equity markets. Performance may degrade in low-volume or highly illiquid instruments. The adaptive threshold system works best on timeframes where sufficient volatility history exists (typically 15-minute charts and above). Divergence signals are probabilistic and should be confirmed with price action.
INSERT_CHART_SNAPSHOT_URL_HERE
---
## RangeLattice Mapper
RangeLattice Mapper constructs a higher-timeframe scaffolding on any intraday chart, locking in structural highs/lows, mid/quarter grids, VWAP confluence, and live acceptance/break analytics. It provides a non-repainting overlay that turns range management into a disciplined process.
HOW IT WORKS
Structure Harvesting – Using request.security() , the script samples highs/lows from a user-selected timeframe (default 240 minutes) over a configurable lookback to establish the dominant range.
Grid Construction – Midpoint and quarter levels are derived mathematically, mirroring how institutional traders map distribution/accumulation zones.
Acceptance Detection – Consecutive closes inside the range flip an acceptance flag and darken the cloud, signaling balanced auction conditions.
Break Confirmation – Multi-bar closes outside the structure raise break labels and alerts, filtering the countless fake-outs that plague breakout traders.
VWAP Fan Overlay – Session VWAP plus ATR-based bands provide a live measure of flow centering relative to the lattice.
HOW TO USE IT
Range Plays : Fade taps of the outer rails only when acceptance is active and VWAP sits inside the grid—this is where mean-reversion works best.
Breakout Plays : Wait for confirmed break labels before entering expansion trades; the dashboard's Width/ATR metric tells you if the expansion has enough fuel.
Market Prep : Carry the same lattice from pre-market into regular trading hours by keeping the structure timeframe fixed; alerts keep you notified even when managing multiple tickers.
VISUAL FEATURES
Range Tap and Mid Pivot markers provide a tape-reading breadcrumb trail for journaling.
Cloud fill opacity tightens when acceptance persists, visually signaling balance compressions ready to break.
Dashboard displays absolute width, ATR-normalized width, and current state (Balanced vs Transitional) so you can glance across charts quickly.
Acceptance Flag toggle: Keep the repeated acceptance squares hidden until you need to audit balance.
PARAMETERS
Structure Timeframe (default: 240): Choose the timeframe whose ranges matter most (4H for indices, Daily for stocks).
Structure Lookback (default: 60): Bars sampled on the structure timeframe.
Acceptance Bars (default: 8): How many consecutive bars inside the range confirm balance.
Break Confirmation Bars (default: 3): Bars required outside the range to validate a breakout.
ATR Reference (default: 14): ATR period for width normalization.
Show Midpoint Grid (default: enabled): Display the midpoint and quarter levels.
Show Adaptive VWAP Fan (default: enabled): Toggle the VWAP channel for assets where volume distribution matters most.
Show Acceptance Flags (default: disabled): Turn the acceptance markers on/off for maximum visual control.
Show Range Dashboard (default: enabled): Disable if screen space is limited, re-enable during prep sessions.
ALERTS
The indicator includes five alert conditions:
Range High Tap: Price interacted with the RangeLattice high
Range Low Tap: Price interacted with the RangeLattice low
Range Mid Tap: Price interacted with the RangeLattice mid
Range Break Up: Confirmed upside breakout
Range Break Down: Confirmed downside breakout
LIMITATIONS
This indicator works best on liquid instruments with clear structural levels. On very low timeframes (1-minute and below), the structure may update too frequently to be useful. The acceptance/break confirmation system requires patience—faster traders may find the multi-bar confirmation too slow for scalping. The VWAP fan is session-based and resets daily, which may not suit all trading styles.
---

Implied Volatility RangeThe Implied Volatility Range is a forward-looking tool that transforms option market data into probability ranges for future prices. Based on the lognormal distribution of asset prices assumed in modern option pricing models, it converts the implied volatility curve into a volatility cone with dynamic labels that show the market’s expectations for the price distribution at a specific point in time. At the selected future date, it displays projected price levels and their percentage change from today’s close across 1, 2, and 3 standard deviation (σ) ranges:
1σ range = ~68.2% probability the price will remain within this range.
2σ range = ~95.4% probability the price will remain within this range.
3σ range = ~99.7% probability the price will remain within this range.
What makes this indicator especially useful is its ability to incorporate implied volatility skew. When only ATM IV (%) is entered, the indicator displays the standard Black–Scholes lognormal distribution. By adding High IV (%) and Low IV (%) values tied to strikes above and below the current price, the indicator interpolates between these inputs to approximate the implied volatility skew. This adjustment produces a market-implied probability distribution that indicates whether the option market is leaning bullish or bearish, based on the data entered in the menu:
ATM IV (%) = Implied volatility at the current spot price (at-the-money).
High IV (%) = Implied volatility at a strike above the current spot price.
High Strike = Strike price corresponding to the High IV input (OTM call).
Low IV (%) = Implied volatility at a strike below the current spot price.
Low Strike = Strike price corresponding to the Low IV input (OTM put).
Expiration (Day, Month, Year) = Option expiration date for the projection.
Once these inputs are entered, the indicator calculates implied probability ranges and, if both High IV and Low IV values are provided, adjusts for skew to approximate the option market’s distribution. If no implied volatility data is supplied, the indicator defaults to a lognormal distribution based on historical volatility, using past realized volatility over the same forward horizon. This keeps the tool functional even without implied volatility inputs, though in that case the output represents only an approximation of ATM IV, not the actual market view.
In summary, the Implied Volatility Range is a powerful tool that translates implied volatility inputs into a clear and practical estimate of the market’s expectations for future prices. It allows traders to visualize the probability of price ranges while also highlighting directional bias, a dimension often difficult to interpret from traditional implied volatility charts. It should be emphasized, however, that this tool reflects only the market’s expectations at a specific point in time, which may change as new information and trading activity reshape implied volatility.

Options Betting Range - Extended# Options Betting Range - Extended
**Options Betting Range - Extended** is a versatile TradingView indicator designed to assist traders in identifying and visualizing optimal options trading ranges for multiple symbols. By leveraging predefined prediction and execution dates along with specific high and low price points, this indicator dynamically draws trendlines to highlight potential options betting zones, enhancing your trading strategy and decision-making process.
## **Key Features**
- **Multi-Symbol Support:** Automatically adapts to popular symbols such as SPY, IWM, QQQ, DIA, TLT, and GOOG, providing tailored options betting ranges for each.
- **Dynamic Trendlines:** Draws both dashed and solid trendlines based on user-defined prediction and execution dates, clearly marking high and low price boundaries.
- **Customizable Parameters:** Easily configure prediction and execution dates, high and low prices, and timezones to suit your specific trading requirements.
- **Single Execution:** Ensures that each trendline is drawn only once per specified prediction date, preventing clutter and maintaining chart clarity.
- **Clear Visual Indicators:** Utilizes color-coded labels to denote high (green) and low (red) price points, making it easy to identify critical trading levels at a glance.
## **How It Works**
1. **Initialization:**
- Upon adding the indicator to your chart, it initializes with predefined symbols and their corresponding high and low price points for two trendlines each.
2. **Configuration:**
- **Trendline 1:**
- **Prediction Date:** Set the year, month, and day when the trendline should be predicted.
- **Execution Date:** Define the year, month, and day when the trendline will be executed.
- **Timezone:** Choose the appropriate timezone to ensure accurate date matching.
- **Trendline 2:**
- Similarly, configure the prediction and execution dates along with the timezone.
3. **Trendline Drawing:**
- On reaching the specified prediction date, the indicator draws dashed trendlines representing the high and low price ranges.
- Solid trendlines are then drawn to solidify the high and low price boundaries.
- Labels are added to clearly mark the high and low price points on the chart.
4. **Visualization:**
- The trendlines and labels provide a visual framework for potential options trading ranges, allowing traders to make informed decisions based on these predefined levels.
## **How to Use**
1. **Add the Indicator:**
- Open your TradingView chart and apply the **Options Betting Range - Extended** indicator.
2. **Select a Symbol:**
- Ensure that the chart is set to one of the supported symbols (e.g., SPY, IWM, QQQ, DIA, TLT, GOOG) to activate the corresponding trendline configurations.
3. **Configure Trendline Parameters:**
- Access the indicator settings to input your desired prediction and execution dates, high and low prices, and select the appropriate timezone for each trendline.
4. **Monitor Trendlines:**
- As the chart progresses to the specified prediction dates, observe the dynamically drawn trendlines and labels indicating the options betting ranges.
5. **Make Informed Trades:**
- Utilize the visual cues provided by the trendlines to identify optimal entry and exit points for your options trading strategies.
## **Benefits**
- **Enhanced Strategy Visualization:** Clearly outlines potential trading ranges, aiding in the formulation and execution of precise options strategies.
- **Time-Saving Automation:** Automatically draws trendlines based on your configurations, reducing the need for manual chart analysis.
- **Improved Decision-Making:** Provides objective price levels for trading, minimizing emotional bias and enhancing analytical precision.
## **Important Considerations**
- **Timezone Accuracy:** Ensure that the timezones selected in the indicator settings align with your chart's timezone to maintain accurate date matching.
- **Chart Timeframe:** The prediction dates should correspond to the timeframe of your chart (e.g., daily, hourly) to ensure that trendlines are triggered correctly.
- **Visible Price Range:** Verify that the high and low prices set for trendlines are within the visible range of your chart to ensure that all trendlines and labels are clearly visible.
## **Conclusion**
**Options Betting Range - Extended** is a powerful tool for traders seeking to automate and visualize their options trading ranges across multiple symbols. By providing clear, customizable trendlines based on specific prediction and execution dates, this indicator enhances your ability to identify and act upon strategic trading opportunities with confidence.
---

DataDoodles ATR RangeThe "DataDoodles ATR Range" indicator provides a comprehensive visual representation of the Average True Range (ATR) levels based on the previous bar's close price . It includes both the raw ATR and an Exponential Moving Average (EMA) of the ATR to offer a smoother view of the range volatility. This indicator is ideal for traders who want to quickly assess potential price movements relative to recent volatility.
Key Features:
ATR Levels Above and Below Close: The indicator calculates and displays three levels of ATR-based ranges above and below the previous close price. These levels are visualized on the chart using distinct colors:
- 1ATR Above/Below
- 2ATR Above/Below
- 3ATR Above/Below
EMA of ATR
Includes the EMA of ATR to provide a smoother trend of the ATR values, helping traders identify long-term volatility trends.
Color-Coded Ranges: The plotted ranges are color-coded for easy identification, with warm gradient tones applied to the corresponding data table for quick reference.
Customizable Table: A data table is displayed at the bottom right corner of the chart, providing real-time values for ATR, EMA ATR, and the various ATR ranges.
Usage
This indicator is useful for traders who rely on volatility analysis to set stop losses, take profit levels, or simply understand the current market conditions. By visualizing ATR ranges directly on the chart, traders can better anticipate potential price movements and adjust their strategies accordingly.
Customization
ATR Length: The default ATR length is set to 14 but can be customized to fit your trading strategy.
Table Positioning: The data table is placed in the bottom right corner by default but can be moved as needed.
How to Use
Add the "DataDoodles ATR Range" indicator to your chart.
Observe the plotted lines for potential support and resistance levels based on recent volatility.
Use the data table for quick reference to ATR values and range levels.
Disclaimer: This indicator is a tool for analysis and should be used in conjunction with other indicators and analysis methods. Always practice proper risk management and consider market conditions before making trading decisions.

TheRookAlgo ICT DRThe Rook Algo is a powerful indicator that is useful to identify the current state of the market, it give information about the current dealing range created after price takes both sides of the market as ICT teaches. The indicator give buy and sell signals depending of the market sentiment, it works in all timeframes can be used only in one but the real benefits comes when it is used with a Higher timeframe reference.
How it works?
The Algo analyze the current and previous market structure to identify current ranges and dealing ranges, it give information about the market with the table located in the corners. The table will tell if the market is expanding higher or lower, retracing into the range, consolidating, if a move failed. Will tell if we hit discount or premium, if we might be in a turtle soup enviormment and finally If the range is small or big compared to the previous one. All this is helpful to quickly identify current market context and direction. Is important to keep in mind that this works better in trending markets must be avoided during consolidations. The algo will tell information about current range, current dealing range and previous dealing range. Is ideal to take entries when the 3 are in sync.
Once the indicator detect current market state it will plot an arrow right after the current candle close telling the possible
Market sentiment and probable direction. This signals can be tricked during consolidations. But when we are trending they work very good.
The light green arrow is plotted when price hits discount and is in a bullish enviormment and price makes a close above previous candle high. The dark green arrow is plotted when we are bullish and price makes an impulse and break the range.
The light red arrow is plotted when price hits a premium in a bearish enviormment and price makes a close below previous candle low. The dark red arrow is plotted when we are bearish and price makes and impulse breaking the range.
The white arrows are plotted when price makes a break out or change of current market state and this is counter to the current market enviormment meaning if we are bullish and we get a down impulse white arrow will be plotted. Then same if we are bearish and price makes an up impulse will plot a white arrow. This ones are usually traps but can also be a real breakout. It depends of the market context in the higher timeframe.
The Algo have the option to plot current ranges that are the lines with the cross, this lines change color depending of the market sentiment and market structure. Light Green for bullish expansion and light red for bearish expansion. Dark colors appears when the range is closed. The equilibrium price is plotted in gray, it change to black when it detect contraction and to white when detect expansion of the ranges.
ICT dealing ranges are plotted in white lines with the equilibrium point in yellow. This lines only appear while price is respecting the range and is consolidating inside and price is not expanding.
The indicator also draws some label lines to easily identify the current range and dealing range and if you want the previous dealing range. This line also tell you when price make a Break of structure and where is the ideal change or character for the timeframe we are looking for.
Lastly the The Rook have the option to enable colors in the bars this is helpful to quickly identify the market state, when price is aliged with the current market sentiment light green or red colors tell us that price is in a premium or discount. Dark and gray colors means price is already in an impulse. And finally when there is an absent of color means price is change current state similar to the white arrows. By default this colors are disable. You can edit in settings
How to use it?
After understanding how the rook communicates we can use it to follow the market direction, the best way to use it is waiting for the Range and dealing range a to be aligned for increasing probabilities we can wait for the previous dealing range too, one that’s in play we just wait for a premium or discount light green or light red signal to enter targeting first the break of the range and then holding for profits while is expanding until we get an opposite signal. This give us the possibility to hold for really big runs. See the picture below. This can be used in any timeframe so depending of the timeframe those ranges might be different but the key is to be align also with a higher timeframe direction.

Swing Ranges [ChartPrime]Swing Ranges is an indicator designed to provide traders with valuable insights into swing movements and real-time support and resistance (SR) levels. This tool detects price swings and plots boxes around them, allowing traders to visualize the market dynamics efficiently. The indicator's primary focus is on real-time support and resistance levels, empowering traders to make well-informed decisions in dynamic market conditions.
Key Features:
Swing Box Visualization:
Swing Ranges excels at detecting swings in the price data and visually representing them with boxes on the price chart. This enables traders to quickly identify swing ranges, essential for understanding market trends and potential reversal points. VWAP POCs are also provided giving areas of high activity in each block.
Real-Time Support and Resistance Levels:
The core feature of Swing Ranges is its real-time support and resistance levels. These levels are dynamically calculated based on the volume-weighted data for each specific range. The indicator displays the strength of support and resistance zones with percentage bars, indicating the ratio between bullish and bearish volume. This real-time information empowers traders to assess the strength and significance of each SR level, enhancing their ability to execute well-timed trades.
ATR (Average True Range) Value:
Swing Ranges also includes an ATR value label, which shows the Average True Range for the selected period. ATR aids traders in understanding market volatility, enabling them to set appropriate stop-loss and take-profit levels for their trades.
VWAP (Volume Weighted Average Price) Information:
Traders c an readily access the VWAP value through the indicator's label. VWAP provides insights into the average price at which an asset has been traded, helping traders identify potential fair value areas and market trends.
Price Difference Percentage:
Swing Ranges displays the percentage difference between the high and low of each swing. This information allows traders to gauge the magnitude of price movements and assess potential profit targets more effectively.
The indicator also has a NV value. If the NV is high e.g. 10% or more there is indecision in the market and the market is trying to remain in a given range.
Settings Inputs:
1. Length Control:
The Length setting input in Swing Ranges allows traders to adjust the sensitivity of the indicator to detect swings. Traders can customize the length based on their trading strategies and timeframes.
2. ATR Period Adjustment:
The ATR Period input allows traders to fine-tune the calculation period for the Average True Range. This feature enables traders to adapt the indicator to different market conditions and asset classes.
Swing Ranges: Real-Time Support and Resistance Indicator is a comprehensive tool that combines swing visualization with dynamic support and resistance levels. By focusing on real-time SR levels, this indicator equips traders with the essential information needed to make confident trading decisions in ever-changing market conditions.

Killzones & DoL's by @mohtradesThe KillZones & DoLs indicator is a comprehensive tool designed for ICT and institutional traders. It provides a clean, customizable way to visualize key time-based levels, killzone sessions, and daily/weekly/monthly statistics directly on your chart.
Key Features
1. Killzones & Sessions
Visualize the three major trading sessions with customizable boxes and time ranges:
Asia Range: Default 20:00 - 00:00 (NY Time)
London Killzone: Default 02:00 - 05:00 (NY Time)
New York Killzone: Default 09:30 - 16:00 (NY Time)
Killzone Tools:
Boxes: Draw highlighted boxes for each session.
Pivots: Automatically mark the High and Low of each session.
Midpoints: Optionally show the 50% equilibrium level of the session range.
Extensions: Extend pivot lines until they are mitigated (price touches them) or keep them for a set duration.
Alerts: Get notified when a session High or Low is broken.
2. Highs & Lows (HTF Levels)
Track significant liquidity levels from higher timeframes without switching charts:
Previous Day High/Low (PDH/PDL)
Previous Week High/Low (PWH/PWL)
Previous Month High/Low (PMH/PML)
Current High/Low of Day (HOD/LOD): Tracks the developing high and low of the current day.
Current High/Low of Week (HOW/LOW): Tracks the developing high and low of the current week.
3. Opening Price Lines
Mark key opening prices to use as support/resistance or bias confirmation:
True Day Open (00:00 NY)
Week Open
Month Open
Custom Open Lines: Configure up to 8 custom time-based open price lines (e.g., 06:00, 10:00, 14:00).
4. Separators & Statistics
Period Separators: Vertical lines marking the start of new Days, Weeks, or Months.
Range Table: Display the range (in pips/points) of recent sessions and their average to gauge volatility.
Customization
Timezone: Fully adjustable to your preferred timezone (default America/New_York).
Styling: Customize colors, line styles, widths, and label sizes for all elements.
Drawing Limits: Optimize chart cleanliness by limiting historical drawings to the last N days.
How to Use
Add the indicator to your chart.
Open Settings to enable/disable specific Killzones (Asia, London, NY).
Enable "Show PDH/PDL" or "Show HOW/LOW" to track liquidity.
Set your convenient timezone (typically NY for ICT concepts).
Use alerts to catch liquidity runs on session pivots.

Nifty Daily Movement Filter with DaysThis indicator provides detailed statistical analysis of NIFTY 50's daily percentage movements, categorized into four distinct volatility ranges with complete weekday distribution tracking.
Features:
Analyzes daily price movements from January 1, 2024 to November 28, 2025
Categorizes volatility into 4 ranges:
0.01-0.25% (Very Low - Blue)
0.26-0.50% (Low - Green)
0.51-0.75% (Medium - Orange)
0.76%+ (High - Red)
Visual Elements:
Color-coded background highlights for each volatility range
Distinct marker shapes below bars (circles, triangles, squares, diamonds)
Labels showing day of week and exact percentage change
Comprehensive statistics table with:
Total count per volatility range
Complete Monday-Friday breakdown for each range
Overall totals by day of week
Use Cases:
Identify volatility patterns across different days of the week
Track frequency of calm vs volatile trading sessions
Analyze if specific weekdays tend toward higher/lower movements
Historical volatility distribution analysis for strategy development
Risk assessment and position sizing based on historical volatility patterns

Consolidation Value Zones (Recio)Consolidation Value Zones introduces an original algorithm to identify consolidation ranges and locate areas of importance within them. This new method "looks" at the chart and draws zones based on price with the goal of producing actionable zones which appear natural, as if they were found through a human analysis.
> Consider the following...
The chart image above displays Bitcoin, at no specific date, for no specific reason. What I have done here is simply glanced at the chart for about 5 seconds, and circled a few areas which stood out as "obvious" consolidation. It does not take a savant to look at a chart and circle ranging price. However, what we have just done defies many common systems for identifying consolidation. We have located ranges of various zone lengths, as small as roughly 25 bars to as large as roughly 100 bars. Regardless of this, we still determined these zones with our eyes and brain in a few seconds, for some it's practically instant. The issue with us humans doing this, is that we are subjective. We did not really use any concrete rules to determine these areas with our eyes. So the problem becomes "How do we identify these zones in a way which seems natural to us with a repeatable system?" Because of this, my approach is simply a logical attempt to reverse engineer our human intuition.
> Consolidation Value Zones
The name of this indicator is generic. To dissect it, we are identifying consolidation ranges, then using a volume profile to determine the value zone within that range. The specific method used to identify these consolidation zones is something I've personally been referring to as the "skewer" method. Another name that may fit better is "Linear Range Alignment/Overlap".
Ultimately, the goal is to locate a single price level or range that overlaps many adjacent bars.
This should, in theory, return areas of visually obvious consolidation.
> The Skewer Method (Identification Method & Bar Gap Allowances)
One consistent concept across the different identification methods for determining consolidation is time. How long do we chop around before calling it consolidation? This is the "Identification Threshold". Once we have located a consolidation zone "this" wide, we will then consider it as consolidation.
In the chart image above, we are considering a six-bar consolidation formation. The figure on the left shows an example of a perfect raw bar overlap, we can see that the six bars all overlap at one price range. This is a perfect example of what we are looking to identify as consolidation. Unfortunately, if this was all we looked at, we would have a very scarce identification method.
For that reason, we have the example on the right, which shows the additional allowances for the identification of these ranges. At most, the example on the right shows a gapless three-bar overlap. However, if we allow the identification to bridge across the gaps, we are able to draw a zone directly through the center and still be within our parameters. This allowance is the "Bar Gap Allowance" and will determine the leniency of the identification.
Between our identification threshold and bar gap allowance, we can start to piece together how the script is "looking" at our chart.
> Detecting Consolidation (Live Detection)
To aid in transparency and user understanding, the live detection calculation can be seen on the chart as a box, skewering the recent historical bars with a number next to it, indicating the number of bars found as potential consolidation.
As we can see in the chart image above, the script, by default, is looking for a 15-bar consolidation, with a 5-bar gap allowance. In the image, the specific gap count is labeled, we can see the script scan backwards as far as it can before counting five gaps in the data. Once that occurs, the detection stops.
Notice how the zone found is a range, consisting of all price levels which meet the parameters. The lower level of the range only had two gaps, but the upper level reached five.
> Consolidation Range and Value Zones (Volume Profiles)
Once the script has identified the consolidation formation, it calculates a volume profile across the identified consolidation range. From this it calculates and draws the Point of Control (POC) and Value Area in addition to the full consolidation range.
Once we have our zones drawn, and understand what they identify, we can go one step further and apply concepts from volume profile trading.
Range High/Low: Displays the current extent of the identified consolidation.
Value High/Low: Shows the specific area within the consolidation where buyers and sellers found the most value.
POC: The single point, where the most volume was transacted during consolidation.
In a balanced market, we would anticipate price to rotate around POC, oscillating from Value High (VAH) to Value Low (VAL). In contrast, a market in motion moves directionally, building volume at new price levels as value, naturally the POC shifts with it.
> Zone Extensions
Unlike many other scripts, there is no mitigation logic at play here, since crossing a zone simply tells us "buyers and sellers are not currently active here", but it does not guarantee that value cannot return or react from previous areas of value.
Obviously the current zone will always be most relevant, but historical zones can retain relevance depending on the context of the market.
Remember: Each area of consolidation is an area where buyers and sellers were once facing off, resulting in price's consolidation. Amidst this, the value zone was the area of greatest agreement between the participants at that time. When moving outside of a range, we would typically look at historical value areas and price's interaction with them for further context.
Due to the ever changing market, there is no fixed extension lookback that will cover every scenario. By default, the Extension Lookback is "1", meaning the script will extend the most recent zone forward until a new zone is detected.
Note: For clarity, zone extensions are colored differently from core zones.
The following chart image shows a few examples of these unique interactions.
As seen in the chart image, looking to previous areas of value as well as POC can provide context in the form of acceptance or rejection at these levels, providing further insight into the auction for us to respond to.
The zones do contain logic to maintain a clean display. By default, the zones extend conditionally when price returns to the previous consolidation range. If desired, the zones can be extended regardless of price action; this can be toggled with the option "Regardless Extension Mode", as seen below.
> Hollow Candles & Zone Merging
When consolidation is identified, a hollow candle is drawn; these can be used to see exactly when each zone is identified. It is important to understand that consolidation zones stemming from the same origin are merged into one zone. This is a frequent occurrence when the consolidation threshold is passed, but the consolidation continues. For this reason you will often see multiple hollow candles in the later areas of the zones.
Similarly, zones from different origin points that overlap are also merged into one consolidation zone. This ensures that no core zones overlap.
Additionally, every time a zone is merged, a new volume profile for the area is calculated.
> Bar Gap Allowance Type (Technical Explanation)
The specific bar gap allowance value can be altered, but so can the type of allowance being used. While some analyses may benefit from counting the total amount of bar gaps within the consolidation, others may benefit from detecting based on consecutive bar gaps.
The chart image above displays the gap counts for each gap allowance type.
The total bar gap allowance type will count until the gap amount is reached, then terminate detection once the allowed number of gaps has been exceeded.
The consecutive bar gap allowance type resets its count once it finds a valid bar within range, by doing so, it only counts the bars that separate each island of in-range bars.
Both methods have merit.
> Implementation
This identification method has proven effective to identify consolidation across market types. As a result, there cannot be one configuration of settings to fit every application. Adapting the detection type and method for each trader's specific market conditions is highly recommended.
When determining parameters, it is helpful to consider time, as it plays a major role in the identification method.
On a 1D chart, the default threshold of 15 corresponds to 15 days, or about 3 weeks depending on the ticker. To identify periods of one-week consolidation, a threshold of 5 would be suitable. To detect perfect gapless weeks, a bar gap allowance of 0 could be used, as seen in the chart image below.
Additional Example:
In the chart image above, we see a 15-second forex chart over the span of a few hours. The detection parameters are set up to detect 15-minute consolidation with a 2-minute max dead zone (consecutive bar gap).
> Detection Source
By default, the script detects consolidation ranges using the full extent of candle wicks. While this is traditional, detection can also be done using only the candle bodies. These identifications are much more nuanced, detecting only from confirmed candle price action; they do not trigger at the same frequency as wick detection.
Optionally, a "Wick/Body Average" can be chosen as the source for detection; as the name implies, this uses the average value between the candle body and its respective wick.
> Additional Settings
The settings mentioned thus far serve as core parameters for identifying consolidation. The following parameters are simply included for the benefit of the advanced user. It is not recommended to adjust these settings under normal circumstances.
- Value Area Percent: Default = 68.26, while traditionally 70 for volume profiles, 68.26 is accurate to the values of a standard bell-curve distribution. The differences are minimal in application.
- VP Rows: Default = 99, Sets the number of rows to be used when calculating the Volume Profiles (VP); note that higher values will lead to a slower calculation. Max value: 999
> Final Notes
If you have made it this far, thank you for reading.
I hope you find value in this new consolidation identification system and understand the logic behind it.
That's it.
Skrip berbayar

DEE's Indicator v2 — Daily Range, Averages & Previous High/Low🇺🇸 English
This indicator is designed to help traders analyze market volatility and daily price ranges.
It includes the following features:
• 5-bar analysis: Shows high-low ranges and percentage changes of the last 5 bars.
• Daily Average Range: Calculates daily average ranges based on the last 5 bars.
• Daily AVG Lines: Plots expected top and bottom range levels based on the daily average.
• Previous Day High/Low: Automatically draws lines from the previous day's high and low.
• Timeframe Separators: Adds visual separators between days, months, and years.
• Optional arrows: Displays arrow markers for the last detected bars used in the calculation.
Use cases:
● Intraday traders can quickly measure daily progress compared to the average daily range.
● Swing traders can identify support/resistance levels from previous daily highs and lows.
● Risk managers can monitor when current volatility deviates significantly from the average.
⚠️ Notes:
The script does not generate buy/sell signals; it provides analytical tools only.
All displayed information is for visual/educational purposes and should be combined with your own trading strategy.
👉 Don’t forget to adjust the settings to suit your needs.
If you are using a multi-chart layout with different timeframes and apply this indicator to each chart, the 5-bar data will be calculated separately based on each chart’s TF. However, the “Daily AVG” section will always show the same value for the 1D timeframe.
🇺🇿 O‘zbekcha
Ushbu indikator treyderlarga bozor volatilligi va kundalik narx diapazonlarini tahlil qilishda yordam berish uchun mo‘ljallangan.
Unda quyidagi funksiyalar mavjud:
• 5-bar tahlili: So‘nggi 5 ta bar diapazoni (high–low) va foiz o‘zgarishini ko‘rsatadi.
• Kundalik o‘rtacha diapazon: So‘nggi 5 ta bar asosida o‘rtacha kundalik diapazonni hisoblaydi.
• AVG Lines: Daily AVGning yuqori va pastki diapazon darajalarini chizadi.
• Oldingi kunning High/Low darajalari: Avtomatik ravishda oldingi kunning high va low darajalarini chizadi.
• Vaqt ajratgichlari: Kunlar, oylar va yillar orasiga vizual ajratgich qo‘shadi.
• Ixtiyoriy strelkalar: Hisoblash uchun foydalanilgan so‘nggi barlarda strelka belgilarini ko‘rsatadi.
Qo‘llanilishi:
● Intraday treyderlar kundalik natijani o‘rtacha kundalik diapazon bilan tezda solishtira olishadi.
● Swing treyderlar oldingi kunning high va low darajalaridan qo‘llab-quvvatlash/qarshilik darajalarini aniqlashlari mumkin.
● Risk-menejerlar hozirgi volatillik o‘rtachadan sezilarli darajada og‘ib ketganini kuzatishlari mumkin.
⚠️ Eslatma:
Ushbu indikator sotib olish/sotish signallarini bermaydi; u faqat tahliliy vosita sifatida ishlatiladi.
Ko‘rsatilgan barcha ma’lumotlar vizual/ta’limiy maqsadlarda mo‘ljallangan bo‘lib, o‘z strategiyangiz bilan birgalikda qo‘llanilishi lozim.
👉 Sozlamalarni ehtiyojlaringizga qarab moslashtirishni unutmang.
Agar siz multi-chart rejimida turli timeframelar bilan ishlasangiz va ushbu indikatorni har bir grafikda qo‘llasangiz, 5 ta bar haqidagi ma’lumotlar har bir grafikning o‘z TFiga qarab hisoblanadi. Ammo “Daily AVG” bo‘limida esa faqat 1D timeframe uchun bir xil qiymat ko‘rsatiladi.
🇷🇺 Русский
Этот индикатор предназначен для помощи трейдерам в анализе волатильности рынка и дневных ценовых диапазонов.
Он включает в себя следующие функции:
• Анализ 5 свечей: Показывает диапазон high–low и процентные изменения последних 5 свечей.
• Средний дневной диапазон: Рассчитывает средний дневной диапазон на основе последних 5 свечей.
• Линии среднего диапазона (AVG Lines): Строит ожидаемые верхние и нижние уровни диапазона на основе среднего дневного значения.
• Максимум/минимум предыдущего дня: Автоматически наносит линии с уровнями high и low предыдущего дня.
• Разделители временных интервалов: Добавляет визуальные разделители между днями, месяцами и годами.
• Опциональные стрелки: Показывает стрелки на последних свечах, использованных в расчётах.
Применение:
● Интрадей-трейдеры могут быстро измерять дневное движение по сравнению со средним дневным диапазоном.
● Свинг-трейдеры могут определять уровни поддержки/сопротивления по максимумам и минимумам предыдущего дня.
● Риск-менеджеры могут контролировать ситуации, когда текущая волатильность значительно отклоняется от среднего.
⚠️ Примечания:
Этот индикатор не генерирует сигналы на покупку/продажу; он предоставляет только аналитические инструменты.
Вся отображаемая информация предназначена для визуальных/образовательных целей и должна использоваться совместно с вашей торговой стратегией.
👉 Не забудьте настроить параметры под свои нужды.
Если вы работаете в режиме мульти-графика с разными таймфреймами и применяете этот индикатор на каждом графике, данные по 5 барам будут рассчитываться отдельно для каждого ТФ. Однако в разделе “Daily AVG” всегда отображается одно и то же значение для таймфрейма 1D.
© Dilshod Nurmatov Shuhratovich | deetradesonline | 2025

cc AJGB Candle Range Finder with TableOverview:
The "cc AJGB Candle Range Finder with Table" is a versatile Pine Script indicator designed to identify and visualize price ranges within the 1 minute charts based on UTC+2 Time Zone. Unlike traditional range indicators, it offers three unique calculation methods to define ranges based on minute and hour interactions, displays ranges as boxes with labeled point values, and summarizes average range sizes in a customizable table. This tool is ideal for analyzing price ranges of specific time based ranges.
Features:
Customizable Time Range: Users specify a start and end minute (0-59) to define the range period (e.g., 29th to 35th minute).
Three Calculation Methods:
Minute Only: Uses the minute of each bar to identify ranges (e.g., matches user-specified minutes).
Minute - Hour: Adjusts the minute by subtracting the hour, allowing for dynamic range detection across hourly cycles.
Minute + Hour: Combines minute and hour values for a unique range calculation, useful for specific intraday patterns.
Visual Output: Draws boxes around detected ranges, with labels showing the start/end minutes and range size in points.
Summary Table: Displays the average range size (in points) for each method, with customizable position, colors, and text size.
How It Works:
The indicator evaluates each bar’s timestamp in (UTC+2 ONLY) to match user-specified minutes using one or more selected methods. When a start minute is detected, it tracks the high and low prices until the end minute, drawing a box to highlight the range and labeling it with the range size in points. A table summarizes the average range size for each method, helping traders assess typical price movements during the specified period.
Market Analysis: Compare range sizes across different methods to understand intraday volatility patterns.
Settings Customization: Adjust colors, table position, and label sizes to suit your chart preferences.
Settings:
Range to Find: Set start and end minutes.
Range Selection: Enable/disable each method and customize colors.
Range Label Size: Choose label size (Tiny to Huge).
Table Settings: Configure table position (Top, Bottom, Left, Right), sub-position, text size, and colors.
Notes:
Only works on 1 minute charts
The indicator works best using Start Times that are lower than the End Times.
Ensure the chart is set to UTC+2 Time Zone for accurate range detection.
Why It’s Unique:
Unlike standard range indicators that focus on sessions or fixed periods, this tool allows precise minute-based range detection with three distinct calculation methods, offering flexibility for data gathering. The interactive table provides quick insights into average range sizes.
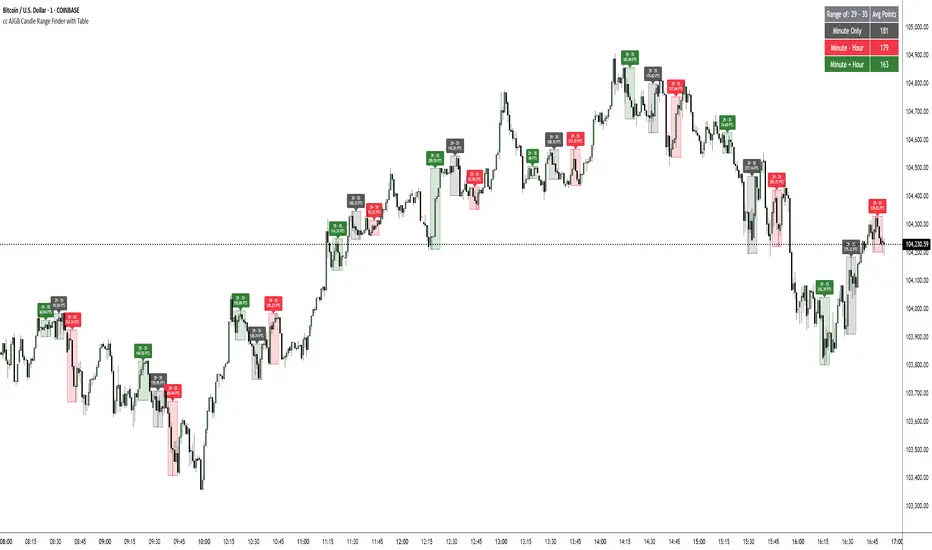
3 Wicks Range - TickSyncThe "3 Wicks Range" indicator, developed by TickSync, is a specialized technical analysis tool designed to identify and highlight potential reversal or continuation patterns in price action. This indicator focuses on detecting overlapping ranges of wicks across three consecutive candles, providing valuable insights into market dynamics.
How It Works
Upper Wick Range: The indicator analyzes the upper wicks of three consecutive candles, checking if they share a common price range. An upper wick is defined as the area between the candle's high and the higher of its open or close.
Lower Wick Range: Similarly, it examines the lower wicks of three consecutive candles for a shared price range. A lower wick is defined as the area between the candle's low and the lower of its open or close.
Visual Representation: When an overlapping range is detected, the indicator draws a semi-transparent yellow box encompassing the shared range area.
Interpretation
Upper Wick Range Overlap: This may indicate bearish pressure or resistance within the highlighted range. It could suggest areas of potential reversal or strong selling interest.
Lower Wick Range Overlap: This may signal bullish pressure or support within the highlighted range. It could indicate areas of potential reversal or strong buying interest.
Context Matters: While these overlapping ranges can be significant, they should be interpreted in conjunction with other technical analysis tools and overall market context.
Trading Applications
Use the highlighted ranges to identify potential areas of price rejection or acceptance.
These patterns could help in pinpointing possible entry or exit points, or in setting stop-loss levels.
The strength of the signal may vary based on the timeframe and prevailing trend.
Customization
Users can adjust the transparency and color of the highlighting boxes in the indicator settings to suit their chart preferences and analysis needs.
Note: The "3 Wicks Range" indicator is a tool to assist in analysis and should not be used as the sole basis for trading decisions. Always combine multiple indicators and conduct thorough analysis before making trading choices.
Developed by TickSync

[KVA] ICT Dealing rangesNaive aproach of Dynamic Detection of Dealing Ranges:
The script dynamically identifies dealing ranges based on sequences of upward or downward price movements. It uses arrays to track the highest highs and lowest lows after detecting two consecutive up or down bars, a fundamental step towards understanding market structure and potential shifts in momentum.
ICT Concept: Order Blocks & Fair Value Gaps. This aspect can be linked to the identification of order blocks (bullish or bearish) and fair value gaps. Order blocks are essentially the last bearish or bullish candle before a significant price move, which this script could approximate by identifying the highs and lows of potential reversal zones.
Red and Green Ranges for Bullish and Bearish Movements:
The script separates these movements into red (bearish) and green (bullish) ranges, effectively categorizing potential areas of selling and buying pressure.
ICT Concept: Liquidity Pools. Red ranges could be indicative of areas where selling might occur, potentially leading to liquidity pools below these ranges. Conversely, green ranges might indicate potential buying pressure, with liquidity pools above. These areas are critical for ICT traders, as they often represent zones where price may return to "hunt" for liquidity.
Horizontal Lines for High and Low Points:
The indicator draws horizontal lines at the high and low points of these ranges, offering visual cues for significant levels.
ICT Concept: Breaker Blocks & Mitigation Sequences. The high and low points of these ranges can be seen as potential breaker blocks or areas for future mitigation sequences. In ICT terms, breaker blocks are areas where institutional orders have overwhelmed retail stop clusters, creating potential entry points for trend continuation or reversal. The high and low points marked by the indicator could serve as references for these sequences, where price might return to retest these levels.
Customizability and Historical Depth:
With inputs like rangePlot and maxBarsBack, the indicator allows for customization of the number of ranges to display and how far back in the chart history it looks to identify these ranges. This flexibility is crucial for tailoring the analysis to different trading strategies and timeframes.
ICT Concept: Market Structure Analysis. The ability to adjust the depth and number of ranges plotted caters to a detailed market structure analysis, an essential component of ICT methodology. Traders can adjust these parameters to better understand the distribution of buying and selling pressure over time and how actions have shaped price movements.
