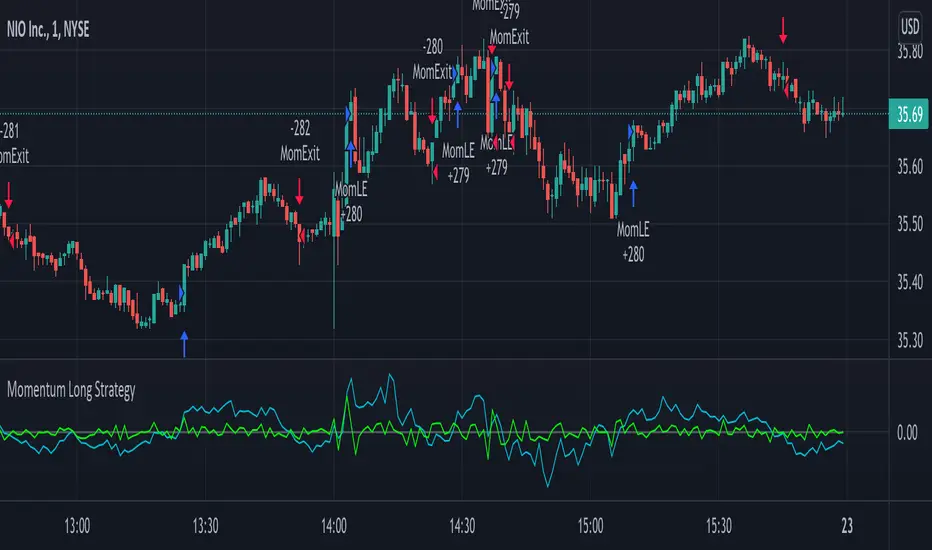
Momentum Long StrategyThis is a momentum indicator strategy that plots 2 lines on the momentum indicator and if both cross above zero a long entry is generated and if both cross below zero a long exit is generated. It also has code to check and make sure the condition is still true when launching the official alert, which helps back testing and live results line up, however be sure to enter commission and slippage into the properties to accurately reflect profits. There's also an optional "percent" option and selecting the MOM1 option in the "MOM Choice" field as it uses a slightly different calculation and may provide better results than the standard momentum calculation. The zero line plotted on the indicator so you can clearly see when lines are crossing above or below zero. Also I'd like to thank @felipecms14 for his open source momentum code. I added back testing date ranges to this so you can easily pull up and see back tested results for a certain date range. I also added a buy and sell message field in the properties so you can launch alerts that will work with automated trading services. Simply enter your buy message and sell message into those fields in the properties and then when you create an alert enter {{strategy.order.alert_message}} into the alert body and it will dynamically pull in your buy and sell messages when it fires alerts.
Cari skrip untuk "range"
Momentum StrategyThis is a momentum indicator strategy that plots 2 lines on the momentum indicator and if both cross above zero a long entry is generated and if both cross below zero a short entry is generated. It also has code to check and make sure the condition is still true when launching the official alert, which helps back testing and live results line up, however be sure to enter commission and slippage into the properties to accurately reflect profits. There's also an optional "percent" option and selecting the MOM1 option in the "MOM Choice" field as it uses a slightly different calculation and may provide better results than the standard momentum calculation. Also I'd like to thank @felipecms14 for his open source momentum code. I added back testing date ranges to this so you can easily pull up and see back tested results for a certain date range.

Hophop Reversion Strategy
█ OVERVIEW
Mean reversion is a financial term assuming that an asset's price will tend to converge to the average price over time.
Due to the trending nature of the crypto markets, mean reversion on a high timeframe could be pretty dangerous. When it comes to running mean reversion strategy on low timeframe, commission and slippage may cost more than strategy gains.
In this strategy, I tried to achieve being conservative in the trending market while avoiding trades if necessary and trading high probability reversion opportunities .
█ CONCEPTS
Strategy is build based on the combination of the momentum and the historical / implied volatility; when the price exceeds the potential volatility range, the strategy places the orders, and the target point is the mean of the expected range high and range low.
The range low and high lines displayed on the chart shows where to short or long, to make sure that the orders are limit orders; orders are placed 0.5% above/below the ranges!
Key information about the strategy
• All the orders are limit entry
• 0.02% commission is included in the backtest
• 30 ticks set for Verify Price Limit for Orders
• 30 ticks set for Slippage
• Initial version does not include the money management and hard stops hence you need to be extra cautious in trending markets
• Restricted to be used for BTC and ETH for 15 min timeframe
█ Ozet
Ortalamaya dönme, bir varlığın fiyatının zaman içinde ortalama fiyata yakınsama eğiliminde olacağını varsayan bir finansal terimdir.
Kripto piyasalarının trend egilimli doğası nedeniyle, yüksek zaman diliminde ortalamaya dönüş oldukça tehlikeli olabilir.
Ortalama geri dönüş stratejisini düşük zaman diliminde calistirmak söz konusu olduğunda, komisyon ve kayma, strateji kazanımlarından daha pahalıya mal olabilir.
Bu stratejide, gerektiğinde alım satımlardan kaçınırken ve yüksek olasılıklı ortalamaya dönüş fırsatlarını degerlendiren, trend olan piyasada ise isleme girerken temkinli olmasi uzerine calistim
█ Aciklama
Strateji, momentum ve tarihsel / zımni oynaklığın birleşimine dayalı olarak inşa edilmistir; fiyat potansiyel oynaklık aralığını aştığında, strateji emirleri verir ve hedef nokta, beklenen yüksek aralığın ve düşük aralığın ortalamasıdır.
Grafikte görüntülenen aralık alt ve üst satırları,
Stratejiye ait onemli bilgiler/b]
• Tüm emirler limit emirdir girişlidir
• Backtest performansinda %0.02 komisyon dahildir
• Limit Emir fiyat dogrulamasi icin 30 tick bekleme kullanilmistir
• Slippage için 30 tick bekleme kullanilmistir
• İlk sürüm para yönetimini ve stoploss içermez, bu nedenle trend olan piyasalarda ekstra dikkatli olmanız gerekir.
• 15 dakikalık zaman dilimi ile BTC ve ETH için kullanımla sınırlıdır
Emirlerin limit emir olduğundan emin olmak için nerede short veya long isleme girilecegini gosteren cizgilerin %0.5 üstünde/altında verilir!

All Instrument Swing Trader with Pyramids, DCA and Leverage
Introduction
This is my most advanced Pine 4 script so far. It combines my range trader algorithms with my trend following pyramids all on a single interval. This script includes my beta tested DCA feature along with simulated leverage and buying power calculations. It has a twin study with several alerts. The features in this script allow you to experiment with different risk strategies and evaluate the approximate impact on your account capital. The script is flexible enough to run on instruments from different markets and at various bar intervals. This strategy can be run in three different modes: long, short and bidirectional. The bidirectional mode has two split modes (Ping Pong and BiDir). It also generates a summary report label with information not available in the TradingView Performance report such as Rate Of Return Standard Deviation and other Sharpe Ratio input values. Notable features include the following:
- Swing Trading Paradigm
- Uni or Bidirectional trading modes
- Calculation presets for Crypto, Stocks and Forex
- Conditional Minimum Profit
- Hard stop loss field
- Two types of DCA (Positive and Negative)
- Discretionary Pyramid levels with threshold adjustment and limiter
- Consecutive loss counter with preset and label
- Reentry loss limiter and trade entry caution fields
- Simulated Leverage and margin call warning label (approximation only)
- Buying power report labels (approximation only)
- Rate Of Return report with input values for Sharpe Ratio, Sortino and others
- Summary report label with real-time status indicators
- Trend follow bias modes (Its still range trading)
- Six anti-chop settings
- Single interval strategy to reduce repaint occurrence
This is a swing trading strategy so the behavior of this script is to buy on weakness and sell on strength. As such trade orders are placed in a counter direction to price pressure. What you will see on the chart is a short position on peaks and a long position on valleys. Just to be clear, the range as well as trends are merely illusions as the chart only receives prices. However, this script attempts to calculate pivot points from the price stream. Rising pivots are shorts and falling pivots are longs. I refer to pivots as a vertex in this script which adds structural components to the chart formation (point, sides and a base). When trading in “Ping Pong” mode long and short positions are intermingled continuously as long as there exists a detectable vertex. Unfortunately, this can work against your backtest profitability on long duration trends where prices continue in a single direction without pullback. I have designed various features in the script to compensate for this event. A well configured script should perform in a range bound market and minimize losses in a trend. For a range trader the trend is most certainly not your friend. I also have a trend following version of this script for those not interested in trading the range.
This script makes use of the TradingView pyramid feature accessible from the properties tab. Additional trades can be placed in the draw-down space increasing the position size and thereby increasing the profit or loss when the position finally closes. Each individual add on trade increases its order size as a multiple of its pyramid level. This makes it easy to comply with NFA FIFO Rule 2-43(b) if the trades are executed here in America. The inputs dialog box contains various settings to adjust where the add on trades show up, under what circumstances and how frequent if at all. Please be advised that pyramiding is an advanced feature and can wipe out your account capital if your not careful. You can use the “Performance Bond Leverage” feature to stress test your account capital with varying pyramid levels during the backtest. Use modest settings with realistic capital until you discover what you think you can handle. See the“Performance Bond Leverage” description for more information.
In addition to pyramiding this script employs DCA which enables users to experiment with loss recovery techniques. This is another advanced feature which can increase the order size on new trades in response to stopped out or winning streak trades. The script keeps track of debt incurred from losing trades. When the debt is recovered the order size returns to the base amount specified in the TV properties tab. The inputs for this feature include a limiter to prevent your account from depleting capital during runaway markets. The main difference between DCA and pyramids is that this implementation of DCA applies to new trades while pyramids affect open positions. DCA is a popular feature in crypto trading but can leave you with large “bags” if your not careful. In other markets, especially margin trading, you’ll need a well funded account and much experience.
To be sure pyramiding and dollar cost averaging is as close to gambling as you can get in respectable trading exchanges. However, if you are looking to compete in a Forex contest or want to add excitement to your trading life style those features could find a place in your strategies. Although your backtest may show spectacular gains don’t expect your live trading account to do the same. Every backtest has some measure to data mining bias. Please remember that.
This script is equipped with a consecutive loss counter. A limit field is provided in the report section of the input dialog box. This is a whole number value that, when specified, will generate a label on the chart when consecutive losses exceed the threshold. Every stop hit beyond this limit will be reported on a version 4 label above the bar where the stop is hit. Use the location of the labels along with the summary report tally to improve the adaptability of system. Don’t simply fit the chart. A good trading system should adapt to ever changing market conditions. On the study version the consecutive loss limit can be used to halt live trading on the broker side (managed manually).
This script can simulate leverage applied to your account capital. Basically, you want to know if the account capital you specified in the properties tab is sufficient to trade this script with the order size, pyramid and DCA parameters needed. TradingView does not halt trading when the account capital is depleted nor do you receive notification of such an event. Input the leverage you intend to trade with and simulate the stress on your account capital. When the check box labeled “Report Margin Call” is enabled a marker will plot on the chart at the location where the threshold was breached. Additionally, the Summary Report will indicated such a breach has occurred during the backtest. Please note that the margin calculation uses a performance bond contract model which is the same type of leverage applied to Forex accounts. This is not the same leverage as stock margin accounts since shares are not actually borrowed. It is also not applicable to futures contracts since we do not calculate maintenance margin. Also note that the account margin and buying power are calculated using the U.S. Dollar as a funding currency. Margin rules across the globe vary considerably so use this feature as an approximation. The “Report Margin Call” plot only appears on negative buying power which is well beyond the NFA enforced margin closeout price. Vary the order size and account capital and activate the buying power plot to get as close as you can to the desired margin call threshold. Also keep in mind that rollover fees, commissions, spreads, etc affect the margin call in actual live trading. This feature does not include any of those costs.
Inputs
The script input dialog box is divided into five sections. The last section, Section 5, contains all of the script reporting options. Notable reporting options are the inputs which provide support for calculating actual Sharpe Ratios and other risk / performance metrics. The TradingView performance report does not produce a scalable Sharpe Ratio which is unfortunate considering the limited data supplied to the backtest. Three report fields made available in this section are intended to enable users to measure the performance of this script using various industry standard risk metrics. In particular, The Sharpe Ratio, Sortino Ratio, Alpha Calculation, Beta Calculation, R-Squared and Monthly Standard Deviation. The following fields are dedicated to this effort:
– ROR Sample Period - Integer number which specifies the rate of return period. This number is a component of the Sharpe Ratio and determines the number of sample periods divisible in the chart data. The number specified here is the length of the period measured in bar intervals. Since the quantity of TradingView historical data is limited this number should reflect the scalar value applied to your Sharpe calculation. When the checkbox “Report Period ROR” is enabled red boxes plot on the dates corresponding to the ROR sample period. The red boxes display information useful in calculating various risk and performance models. Ongoing buying power is included in the period report which is especially useful in assessing the DCA stress on account capital. Important: When the “ROR Sample Period” is specified the script computes the ROR mean value and displays the result in the summary report label on the live end of the chart. Use this number to calculate the historical standard deviation of period returns.
– Return Mean Value - This is the ROR mean value which is displayed in the summary report field “ROR Mean”. Enter the value shown in the summary report here in order to calculate the standard deviation of returns. Once calculated the result is displayed in the summary report field “Standard Dev”. Please note that ROR and standard deviation are calculated on the quote currency of the chart and not the account currency. If you intend to calculate risk metrics based on other denominated returns use the period calculations in a spreadsheet. Important: Do not change the account denomination on the properties tab simply to force a dollar calculation. It will alter the backtest itself since the minimum profit, stop-loss and other variables are always measured in the quote currency of the chart.
– Report Period ROR - This checkbox is used to display the ROR period report which plots a red label above the bars corresponding to the ROR sample period. The sample period is defined by the value entered into the “ROR Sample Period” field. This checkbox only determines if the period labels plot on the chart. It does not enable or disable the ROR calculation itself. Please see input description“ROR Sample Period” for a detailed description of this feature.
Design
This script uses twelve indicators on a single time frame. The original trading algorithms are a port from a much larger program on another trading platform. I’ve converted some of the statistical functions to use standard indicators available on TradingView. The setups make heavy use of the Hull Moving Average in conjunction with EMAs that form the Bill Williams Alligator as described in his book “New Trading Dimensions” Chapter 3. Lag between the Hull and the EMAs form the basis of the entry and exit points. The vertices are calculated using one of five featured indicators. Each indicator is actually a composite of calculations which produce a distinct mean. This mathematical distinction enables the script to be useful on various instruments which belong to entirely different markets. In other words, at least one of these indicators should be able generate pivots on an arbitrarily selected instrument. Try each one to find the best fit.
The entire script is around 2200 lines of Pine code which pushes the limits of what can be created on this platform given the TradingView maximums for: local scopes, run-time duration and compile time. This script incorporates code from both my range trader and trend following published programs. Both have been in development for nearly two years and have been in beta test for the last several months. During the beta test of the range trading script it was discovered that by widening the stop and delaying the entry, add on trading opportunities appeared on the chart. I determined that by sacrificing a few minor features code space could be made available for pyramiding capability in the range trader. The module has been through several refactoring passes and makes extensive use of ternary statements. As such, It takes a full three minutes to compile after adding it to a chart. Please wait for the hovering dots to disappear before attempting to bring up the input dialog box. For the most part the same configuration settings for the range script can be applied to this script.
Inputs to the script use cone centric measurements in effort to avoid exposing adjustments to the various internal indicators. The goal was to keep the inputs relevant to the actual trade entry and exit locations as opposed to a series of MA input values and the like. As a result the strategy exposes over 70 inputs grouped into long or short sections. Inputs are available for the usual minimum profit and stop-loss as well as safeguards, trade frequency, pyramids, DCA, modes, presets, reports and lots of calibrations. The inputs are numerous, I know. Unfortunately, at this time, TradingView does not offer any other method to get data in the script. The usual initialization files such as cnf, cfg, ini, json and xml files are currently unsupported.
I have several example configuration settings that I use for my own trading. They include cryptocurrencies and forex instruments on various time frames.
Indicator Repainting and Anomalies
Indicator repainting is an industry wide problem which mainly occurs when you mix backtest data with real-time data. It doesn't matter which platform you use some form of this condition will manifest itself on your chart over time. The critical aspect being whether live trades on your broker’s account continue to match your TradingView study.
Based on my experience with Pine, most of the problems stem from TradingView’s implementation of multiple interval access. Whereas most platforms provide a separate bar series for each interval requested, the Pine language interleaves higher time frames with the primary chart interval. The problem is exacerbated by allowing a look-ahead parameter to the Security function. The goal of my repaint prevention is simply to ensure that my signal trading bias remains consistent between the strategy, study and broker. That being said this is what I’ve done address this issue in this script:
1. This script uses only 1 time frame. The chart interval.
2. Every entry and exit condition is evaluated on closed bars only.
3. No security functions are called to avoid a look-ahead possibility.
4. Every contributing factor specified in the TradingView wiki regarding this issue has been addressed.
5. Entry and exit setups are not reliant on crossover conditions.
6. I’ve run a 10 minute chart live for a week and compared it to the same chart periodically reloaded. The two charts were highly correlated with no instances of completely opposite real-time signals. I do have to say that there were differences in the location of some trades between the backtest and the study. But, I think mostly those differences are attributable to trading off closed bars in the study and the use of strategy functions in the backtest.
The study does indeed bring up the TV warning dialog. The only reason for this is because the script uses an EMA indicator which according to TradingView is due to “peculiarities of the algorithm”. I use the EMA for the Bill Williams Alligator so there is no way to remove it.
One issue that comes up when comparing the strategy with the study is that the strategy trades show on the chart one bar later than the study. This problem is due to the fact that “strategy.entry()” and “strategy_exit()” do not execute on the same bar called. The study, on the other hand, has no such limitation since there are no position routines.
Please be aware that the data source matters. Cryptocurrency has no central tick repository so each exchange supplies TradingView its feed. Even though it is the same symbol the quality of the data and subsequently the bars that are supplied to the chart varies with the exchange. This script will absolutely produce different results on different data feeds of the same symbol. Be sure to backtest this script on the same data you intend to receive alerts for. Any example settings I share with you will always have the exchange name used to generate the test results.
Usage
The following steps provide a very brief set of instructions that will get you started but will most certainly not produce the best backtest. A trading system that you are willing to risk your hard earned capital will require a well crafted configuration that involves time, expertise and clearly defined goals. As previously mentioned, I have several example configs that I use for my own trading that I can share with you. To get hands on experience in setting up your own symbol from scratch please follow the steps below.
The input dialog box contains over 70 inputs separated into five sections. Each section is identified as such with a makeshift separator input. There are three main areas that must to be configured: long side, short side and settings that apply to both. The rest of the inputs apply to pyramids, DCA, reporting and calibrations. The following steps address these three main areas only. You will need to get your backtest in the black before moving on to the more advanced features.
Step 1. Setup the Base currency and order size in the properties tab.
Step 2. Select the calculation presets in the Instrument Type field.
Step 3. Select “No Trade” in the Trading Mode field.
Step 4. Select the Histogram indicator from Section 2. You will be experimenting with different ones so it doesn’t matter which one you try first.
Step 5. Turn on Show Markers in Section 2.
Step 6. Go to the chart and checkout where the markers show up. Blue is up and red is down. Long trades show up along the red markers and short trades on the blue.
Step 7. Make adjustments to “Base To Vertex” and “Vertex To Base” net change and roc in Section 3. Use these fields to move the markers to where you want trades to be.
Step 8. Try a different indicator from Section 2 and repeat Step 7 until you find the best match for this instrument on this interval. This step is complete when the Vertex settings and indicator combination produce the most favorable results.
Step 9. Go to Section 3 and enable “Apply Red Base To Base Margin”.
Step 10. Go to Section 4 and enable “Apply Blue Base To Base Margin”.
Step 11. Go to Section 2 and adjust “Minimum Base To Base Blue” and “Minimum Base To Base Red”. Observe the chart and note where the markers move relative to each other. Markers further apart will produce less trades but will reduce cutoffs in “Ping Pong” mode.
Step 12. Return to Section 3 and 4 and turn off “Base To Base Margin” which was enabled in steps 9 and 10.
Step 13. Turn off Show Markers in Section 2.
Step 14. Put in your Minimum Profit and Stop Loss in the first section. This is in pips or currency basis points (chart right side scale). Percentage is not currently supported. This is a fixed value minimum profit and stop loss. Also note that the profit is taken as a conditional exit on a market order not a fixed limit. The actual profit taken will almost always be greater than the amount specified (due to the exit condition). The stop loss, on the other hand, is indeed a hard number which is executed by the TradingView broker simulator when the threshold is breached. On the study version, the stop is executed at the close of the bar.
Step 15. Return to step 3 and select a Trading Mode (Long, Short, BiDir, Ping Pong). If you are planning to trade bidirectionally its best to configure long first then short. Combine them with “BiDir” or “Ping Pong” after setting up both sides of the trade individually. The difference between “BiDir” and “Ping Pong” is that “Ping Pong” uses position reversal and can cut off opposing trades less than the specified minimum profit. As a result “Ping Pong” mode produces the greatest number of trades.
Step 16. Take a look at the chart. Trades should be showing along the markers plotted earlier.
Step 17. Make adjustments to the Vertex fields in Section 2 until the TradingView performance report is showing a profit. This includes the “Minimum Base To Base” fields. If a profit cannot be achieved move on to Step 18. Other adjustments may make a crucial difference.
Step 18. Improve the backtest profitability by adjusting the “Entry Net Change” and “Entry ROC” in Section 3 and 4.
Step 19. Enable the “Mandatory Snap” checkbox in Section 3 and 4 and adjust the “Snap Candle Delta” and “Snap Fractal Delta” in Section 2. This should reduce some chop producing unprofitable reversals.
Step 20. Increase the distance between opposing trades by adding an “Interleave Delta” in Sections 3 and 4. This is a floating point value which starts at 0.01 and typically does not exceed 2.0.
Step 21. Increase the distance between opposing trades even further by adding a “Decay Minimum Span” in Sections 3 and 4. This is an absolute value specified in the symbol’s quote currency (right side scale of the chart). This value is similar to the minimum profit and stop loss fields in Section 1.
Step 22. Improve the backtest profitability by adjusting the “Sparse Delta” in Section 3 and 4.
Step 23. Improve the backtest profitability by adjusting the “Chase Delta” in Section 3 and 4.
Step 24. Improve the backtest profitability by adjusting the “Adherence Delta” in Section 3 and 4. This field requires the “Adhere to Rising Trend” checkbox to be enabled.
Step 25. Try each checkbox in Section 3 and 4. See if it improves the backtest profitability. The “Caution Lackluster” checkbox only works when “Caution Mode” is enabled.
Step 26. Enable the reporting conditions in Section 5. Look for long runs of consecutive losses or high debt sequences. These are indications that your trading system cannot withstand sudden changes in market sentiment.
Step 27. Examine the chart and see that trades are being placed in accordance with your desired trading goals. This is an important step. If your desired model requires multiple trades per day then you should be seeing hundreds of trades on the chart. Alternatively, you may be looking to trade fewer steep peaks and deep valleys in which case you should see trades at major turning points. Don’t simply settle for what the backtest serves you. Work your configuration until the system aligns with your desired model. Try changing indicators and even intervals if you cannot reach your simulation goals. Generally speaking, the histogram and Candle indicators produce the most trades. The Macro indicator captures the tallest peaks and valleys.
Step 28. Apply the backtest settings to the study version and perform forward testing.
This script is open for beta testing. After successful beta test it will become a commercial application available by subscription only. I’ve invested quite a lot of time and effort into making this the best possible signal generator for all of the instruments I intend to trade. I certainly welcome any suggestions for improvements. Thank you all in advance.
One final note. I'm not a fan of having the Performance Overview (blue wedge) automatically show up at the end of the publish page since it could be misleading. On the EUR/USD backtest showing here I used a minimum profit of 65 pips, a stop of 120 pips, the candle indicator and a 5 pyramid max value. Also Mark Pyramid Levels (blue triangles) are enabled along with a 720 ROR Sample Period (red labels).

Long Term Swing Position Indicator Alpha VersionThis is a early version of a swing trading indicator I have been working on. It uses EMAs and ADX to find entries. This will eventually be integrated into my main trading indicator. The strategy is defaulted to start with 17,000 capital and trade with 100 percent of equity. You can test different ranges of dates by going into the settings and changing the end dates of the backtest. It is defaulted to test from 1/1/2018 to the current time. Keep in mind if you keep it set to use 100% equity it will not be able to enter positions if the initial capital is less than the price of 1 bitcoin -3.31% at the beginning of the test range. It currently has a pretty low success rate, but the average winning trade is significantly larger than the average losing trade so it still makes a significant profit. This has only been tested so far on the 15 minute and 30 minute charts for Bitfinex:BTCUSD.
The end goal for this indicator is to allow me to enter long term future positions to hold while I trade swaps on the short and medium term. This will allow me to increase profits.
This strategy will be changing significantly in the future as I test various ideas and setting configurations to maximize the effectiveness, but feel free to use it however you want.
My main indicator is currently in beta and will be finished before this one is completed, so if you want a solid indicator to trade with in the immediate future, I suggest checking that one out at
Please comment or direct message me if you have any questions of critiques, I will always respond within 24 hours. If you find out anything interesting while testing the strategy I would also appreciate it if you dropped me a message letting me know.

DOGE Stochastic RSI Pro System📌 Strategy Overview
The DOGE Stochastic RSI Pro System is a high-precision algorithm designed specifically for DOGEUSDT on the 1-hour timeframe.
It combines the power of Stochastic RSI momentum, EMA trend direction, and VWAP price positioning to generate high-probability long and short entries.
This system was optimized through multi-year backtesting and short-term adaptive tuning, showing strong performance during trending and volatility-rich periods.
📌 Technical Logic
✔ 1. Stochastic RSI Core
Entry when %K crosses %D
Detects momentum reversals early
Works effectively on DOGE volatility cycles
✔ 2. EMA Trend Filter
EMA50 above EMA150 → long-bias signals allowed
EMA50 below EMA150 → short-bias signals allowed
Prevents trading against the dominant trend
Improves signal accuracy
✔ 3. VWAP Institutional Filter
Price above VWAP → only long entries
Price below VWAP → only short entries
Avoids low-quality trades in mean-reversion zones
📌 Money Management
✔ Starting Amount: 5 USDT
✔ Take Profit: 3%
✔ Stop Loss: 3%
✔ Both Long & Short
✔ No Martingale — Clean, stable system
The strategy opens one position at a time to avoid overexposure.
📌 Recommended Settings
Pair: DOGEUSDT
Timeframe: 1H
Leverage (Bybit): 5–10× (optional, system does not enforce leverage)
Broker Execution: Bybit derivatives or spot with position sizing
📌 Backtesting Results (User Verified)
1 Year Backtest: ~57–58% win rate
2 Year Backtest: ~56% win rate
Last 3 Months: ~61% win rate
Last 30 Days: ~64% win rate
Profit Factor Range: 1.32 – 1.70
This system performs best in moderate trending + volatility expansion cycles.
📌 Notes for Users
Strategy does not repaint.
Behavior may vary depending on exchange price feeds.
Use proper risk management and test before going live.
Performance may change over time as markets shift.
📌 Access
This is an Invite-Only script.
Access is granted only to approved users.
If you'd like access, send a private request.
📌 Disclaimer
This script is for educational and research purposes only.
Not financial advice. Trading involves risk.
Past performance does not guarantee future results.

Stochastic Hash Strat [Hash Capital Research]# Stochastic Hash Strategy by Hash Capital Research
## 🎯 What Is This Strategy?
The **Stochastic Slow Strategy** is a momentum-based trading system that identifies oversold and overbought market conditions to capture mean-reversion opportunities. Think of it as a "buy low, sell high" approach with smart mathematical filters that remove emotion from your trading decisions.
Unlike fast-moving indicators that generate excessive noise, this strategy uses **smoothed stochastic oscillators** to identify only the highest-probability setups when momentum truly shifts.
---
## 💡 Why This Strategy Works
Most traders fail because they:
- **Chase prices** after big moves (buying high, selling low)
- **Overtrade** in choppy, directionless markets
- **Exit too early** or hold losses too long
This strategy solves all three problems:
1. **Entry Discipline**: Only trades when the stochastic oscillator crosses in extreme zones (oversold for longs, overbought for shorts)
2. **Cooldown Filter**: Prevents revenge trading by forcing a waiting period after each trade
3. **Fixed Risk/Reward**: Pre-defined stop-loss and take-profit levels ensure consistent risk management
**The Math Behind It**: The stochastic oscillator measures where the current price sits relative to its recent high-low range. When it's below 25, the market is oversold (time to buy). When above 70, it's overbought (time to sell). The crossover with its moving average confirms momentum is shifting.
---
## 📊 Best Markets & Timeframes
### ⭐ OPTIMAL PERFORMANCE:
**Crude Oil (WTI) - 12H Timeframe**
- **Why it works**: Oil markets have predictable volatility patterns and respect technical levels
**AAVE/USD - 4H to 12H Timeframe**
- **Why it works**: DeFi tokens exhibit strong momentum cycles with clear extremes
### ✅ Also Works Well On:
- **BTC/USD** (12H, Daily) - Lower frequency but high win rate
- **ETH/USD** (8H, 12H) - Balanced volatility and liquidity
- **Gold (XAU/USD)** (Daily) - Classic mean-reversion asset
- **EUR/USD** (4H, 8H) - Lower volatility, requires patience
### ❌ Avoid Using On:
- Timeframes below 4H (too much noise)
- Low-liquidity altcoins (wide spreads kill performance)
- Strongly trending markets without pullbacks (Bitcoin in 2021)
- News-driven instruments during major events
---
## 🎛️ Understanding The Settings
### Core Stochastic Parameters
**Stochastic Length (Default: 16)**
- Controls the lookback period for price comparison
- Lower = faster reactions, more signals (10-14 for volatile markets)
- Higher = smoother signals, fewer trades (16-21 for stable markets)
- **Pro tip**: Use 10 for crypto 4H, 16 for commodities 12H
**Overbought Level (Default: 70)**
- Threshold for short entries
- Lower values (65-70) = more trades, earlier entries
- Higher values (75-80) = fewer but higher-conviction trades
- **Sweet spot**: 70 works for most assets
**Oversold Level (Default: 25)**
- Threshold for long entries
- Higher values (25-30) = more trades, earlier entries
- Lower values (15-20) = fewer but stronger bounce setups
- **Sweet spot**: 20-25 depending on market conditions
**Smooth K & Smooth D (Default: 7 & 3)**
- Additional smoothing to filter out whipsaws
- K=7 makes the indicator slower and more reliable
- D=3 is the signal line that confirms the trend
- **Don't change these unless you know what you're doing**
---
### Risk Management
**Stop Loss % (Default: 2.2%)**
- Automatically exits losing trades
- Should be 1.5x to 2x your average market volatility
- Too tight = death by a thousand cuts
- Too wide = uncontrolled losses
- **Calibration**: Check ATR indicator and set SL slightly above it
**Take Profit % (Default: 7%)**
- Automatically exits winning trades
- Should be 2.5x to 3x your stop loss (reward-to-risk ratio)
- This default gives 7% / 2.2% = 3.18:1 R:R
- **The golden rule**: Never have R:R below 2:1
---
### Trade Filters
**Bar Cooldown Filter (Default: ON, 3 bars)**
- **What it does**: Forces you to wait X bars after closing a trade before entering a new one
- **Why it matters**: Prevents emotional revenge trading and overtrading in choppy markets
- **Settings guide**:
- 3 bars = Standard (good for most cases)
- 5-7 bars = Conservative (oil, slow-moving assets)
- 1-2 bars = Aggressive (only for experienced traders)
**Exit on Opposite Extreme (Default: ON)**
- Closes your long when stochastic hits overbought (and vice versa)
- Acts as an early profit-taking mechanism
- **Leave this ON** unless you're testing other exit strategies
**Divergence Filter (Default: OFF)**
- Looks for price/momentum divergences for additional confirmation
- **When to enable**: Trending markets where you want fewer but higher-quality trades
- **Keep OFF for**: Mean-reverting markets (oil, forex, most of the time)
---
## 🚀 Quick Start Guide
### Step 1: Set Up in TradingView
1. Open TradingView and navigate to your chart
2. Click "Pine Editor" at the bottom
3. Copy and paste the strategy code
4. Click "Add to Chart"
5. The strategy will appear in a separate pane below your price chart
### Step 2: Choose Your Market
**If you're trading Crude Oil:**
- Timeframe: 12H
- Keep all default settings
- Watch for signals during London/NY overlap (8am-11am EST)
**If you're trading AAVE or crypto:**
- Timeframe: 4H or 12H
- Consider these adjustments:
- Stochastic Length: 10-14 (faster)
- Oversold: 20 (more aggressive)
- Take Profit: 8-10% (higher targets)
### Step 3: Wait for Your First Signal
**LONG Entry** (Green circle appears):
- Stochastic crosses up below oversold level (25)
- Price likely near recent lows
- System places limit order at take profit and stop loss
**SHORT Entry** (Red circle appears):
- Stochastic crosses down above overbought level (70)
- Price likely near recent highs
- System places limit order at take profit and stop loss
**EXIT** (Orange circle):
- Position closes either at stop, target, or opposite extreme
- Cooldown period begins
### Step 4: Let It Run
The biggest mistake? **Interfering with the system.**
- Don't close trades early because you're scared
- Don't skip signals because you "have a feeling"
- Don't increase position size after a big win
- Don't revenge trade after a loss
**Follow the system or don't use it at all.**
---
### Important Risks:
1. **Drawdown Pain**: You WILL experience losing streaks of 5-7 trades. This is mathematically normal.
2. **Whipsaw Markets**: Choppy, range-bound conditions can trigger multiple small losses.
3. **Gap Risk**: Overnight gaps can cause your actual fill to be worse than the stop loss.
4. **Slippage**: Real execution prices differ from backtested prices (factor in 0.1-0.2% slippage).
---
## 🔧 Optimization Guide
### When to Adjust Settings:
**Market Volatility Increased?**
- Widen stop loss by 0.5-1%
- Increase take profit proportionally
- Consider increasing cooldown to 5-7 bars
**Getting Too Few Signals?**
- Decrease stochastic length to 10-12
- Increase oversold to 30, decrease overbought to 65
- Reduce cooldown to 2 bars
**Getting Too Many Losses?**
- Increase stochastic length to 18-21 (slower, smoother)
- Enable divergence filter
- Increase cooldown to 5+ bars
- Verify you're on the right timeframe
### A/B Testing Method:
1. **Run default settings for 50 trades** on your chosen market
2. Document: Win rate, profit factor, max drawdown, emotional tolerance
3. **Change ONE variable** (e.g., oversold from 25 to 20)
4. Run another 50 trades
5. Compare results
6. Keep the better version
**Never change multiple settings at once** or you won't know what worked.
---
## 📚 Educational Resources
### Key Concepts to Learn:
**Stochastic Oscillator**
- Developed by George Lane in the 1950s
- Measures momentum by comparing closing price to price range
- Formula: %K = (Close - Low) / (High - Low) × 100
- Similar to RSI but more sensitive to price movements
**Mean Reversion vs. Trend Following**
- This is a **mean reversion** strategy (price returns to average)
- Works best in ranging markets with defined support/resistance
- Fails in strong trending markets (2017 Bitcoin, 2020 Tech stocks)
- Complement with trend filters for better results
**Risk:Reward Ratio**
- The cornerstone of profitable trading
- Winning 40% of trades with 3:1 R:R = profitable
- Winning 60% of trades with 1:1 R:R = breakeven (after fees)
- **This strategy aims for 45% win rate with 2.5-3:1 R:R**
### Recommended Reading:
- *"Trading Systems and Methods"* by Perry Kaufman (Chapter on Oscillators)
- *"Mean Reversion Trading Systems"* by Howard Bandy
- *"The New Trading for a Living"* by Dr. Alexander Elder
---
## 🛠️ Troubleshooting
### "I'm not seeing any signals!"
**Check:**
- Is your timeframe 4H or higher?
- Is the stochastic actually reaching extreme levels (check if your asset is stuck in middle range)?
- Is cooldown still active from a previous trade?
- Are you on a low-liquidity pair?
**Solution**: Switch to a more volatile asset or lower the overbought/oversold thresholds.
---
### "The strategy keeps losing money!"
**Check:**
- What's your win rate? (Below 35% is concerning)
- What's your profit factor? (Below 0.8 means serious issues)
- Are you trading during major news events?
- Is the market in a strong trend?
**Solution**:
1. Verify you're using recommended markets/timeframes
2. Increase cooldown period to avoid choppy markets
3. Reduce position size to 5% while you diagnose
4. Consider switching to daily timeframe for less noise
---
### "My stop losses keep getting hit!"
**Check:**
- Is your stop loss tighter than the average ATR?
- Are you trading during high-volatility sessions?
- Is slippage eating into your buffer?
**Solution**:
1. Calculate the 14-period ATR
2. Set stop loss to 1.5x the ATR value
3. Avoid trading right after market open or major news
4. Factor in 0.2% slippage for crypto, 0.1% for oil
---
## 💪 Pro Tips from the Trenches
### Psychological Discipline
**The Three Deadly Sins:**
1. **Skipping signals** - "This one doesn't feel right"
2. **Early exits** - "I'll just take profit here to be safe"
3. **Revenge trading** - "I need to make back that loss NOW"
**The Solution:** Treat your strategy like a business system. Would McDonald's skip making fries because the cashier "doesn't feel like it today"? No. Systems work because of consistency.
---
### Position Management
**Scaling In/Out** (Advanced)
- Enter 50% position at signal
- Add 50% if stochastic reaches 10 (oversold) or 90 (overbought)
- Exit 50% at 1.5x take profit, let the rest run
**This is NOT for beginners.** Master the basic system first.
---
### Market Awareness
**Oil Traders:**
- OPEC meetings = volatility spikes (avoid or widen stops)
- US inventory reports (Wed 10:30am EST) = avoid trading 2 hours before/after
- Summer driving season = different patterns than winter
**Crypto Traders:**
- Monday-Tuesday = typically lower volatility (fewer signals)
- Thursday-Sunday = higher volatility (more signals)
- Avoid trading during exchange maintenance windows
---
## ⚖️ Legal Disclaimer
This trading strategy is provided for **educational purposes only**.
- Past performance does not guarantee future results
- Trading involves substantial risk of loss
- Only trade with capital you can afford to lose
- No one associated with this strategy is a licensed financial advisor
- You are solely responsible for your trading decisions
**By using this strategy, you acknowledge that you understand and accept these risks.**
---
## 🙏 Acknowledgments
Strategy development inspired by:
- George Lane's original Stochastic Oscillator work
- Modern quantitative trading research
- Community feedback from hundreds of backtests
Built with ❤️ for retail traders who want systematic, disciplined approaches to the markets.
---
**Good luck, stay disciplined, and trade the system, not your emotions.**

PA Builder [PrimeAutomation]1. PA Builder – Overview
PA Builder is not a fixed strategy; it’s a framework for building strategies. Instead of giving traders one rigid system, it provides a toolbox where entries, exits, filters, risk parameters, and automation rules can all be defined and combined. The core philosophy is confluence: the idea that a trade should only be taken when multiple independent signals agree. The Builder is built around this principle. Every module; trend, reactors, bands, reversals, volume, structure, divergences, externals can be treated as one layer of confidence. The stronger the alignment across layers, the higher the quality of the setup in theory.
In practice, this means PA Builder encourages traders to think in terms of “confluence,” not single indicators. Trend and positioning define whether you should even be looking for longs or shorts. Timing tools such as bands, reversals and candlestick structures determine when inside that broader bias you want to engage. Confirmation tools like volume and flow tell you whether capital is actually supporting the move. Filter systems then ensure that even if everything looks good locally, you still respect higher-timeframe or opposing warnings. The Builder’s philosophy is simple: enter less often, but only when conditions are genuinely in your favour.
2. Core Entry Signal Components
The entry logic in PA Builder is built on a set of signal engines that can be combined in many ways. Trend Signals form a natural foundation. They use low-lag low-pass filters, borrowed from audio signal processing, to extract directional bias from price without the classic delay of classical moving averages. The sensitivity parameter controls how reactive this engine is: lower values favour cleaner trends and fewer whipsaws, while higher values are better suited to short-term intraday trading where speed matters more than smoothness. Many traders start by requiring that Trend Signals show “all bullish” or “all bearish” before allowing any entries in that direction.
Trend signals firing short positions
On top of this directional backbone, the Dynamic Reactor behaves as an adaptive baseline. It accelerates in volatile phases and slows down during consolidation, effectively acting as a moving reference point for both trend and price position. A typical use of this module is to insist that, for long trades, the price sits above a bullish reactor; for shorts, below a bearish one. At the higher-timeframe level, the Quantum Reactor provides a VWAP-style reference that can be anchored to larger candles than the chart you are trading. A common configuration is to trade on a 15-minute chart while requiring that price is above the 4-hour Quantum Reactor for longs or below it for shorts. The “fast” and “slow” options determine how quickly this reference adapts to new information.
Timing is then refined with tools like Quantum Bands, reversals and candle structure analysis. Quantum Bands identify extremes within the current environment. In an uptrend, a tag of the lower band can be treated as a pullback rather than a breakdown; in a downtrend, the upper band acts like a shorting zone. Many traders combine “trend up and above higher-timeframe reactor” with “price temporarily below lower band” to construct a mean-reversion entry inside a larger uptrend. Reversal detection modules examine recent bars to find turning points, with shorter lookbacks capturing fast flips and longer lookbacks tracking deeper structural changes. Candle structure logic goes beyond classical candlestick names and instead focuses on whether price action confirms follow-through or reversion behaviour, with options like “2X” modes that wait for two successive confirmations before acting.
Before and after filtering using reactor applied.
Additional confirmation layers come from Volume Matrix, Money Flow, OSC True7 and divergence detection. Volume and flow tools answer whether actual capital is participating in the move or whether price is drifting on thin activity. OSC True7 categorises the state of the trend into intuitive buckets, strong, healthy, neutral, or exhausted, making it easier to avoid chasing extremes. Divergences between price and momentum can be used either as entry triggers in contrarian systems or as hard filters that block trades when warning signs are present. Finally, two external indicator inputs make it possible to integrate RSI, MACD, custom indicators or even other strategies into the Builder, either as simple thresholds or as comparative logic between two external sources (for example, requiring a fast EMA to be above a slow EMA before allowing longs).
3. Exit System & Trade Management
The exit systems in PA Builder are designed to be as vital as the entry logic. It assumes exits are not an afterthought, but half of the edge. Instead of forcing a single take profit point, the system uses a three-tier structure where you can assign different portions of the position to different targets. A common pattern is to scale out a small portion early (for example at one ATR), another portion at an intermediate level, and keep the largest slice for a deeper move. This creates a natural balance: you book something early to reduce emotional stress, while leaving room to participate in the full potential of a trend.
Targets can be defined using ATR multiples or risk-to-reward ratios that are directly tied to the initial stop distance. Using ATR keeps exits proportional to current volatility. A two ATR target in a quiet environment is very different in absolute price distance from the same multiple in a high-volatility environment, yet conceptually it represents the same “size” move. Risk-to-reward exits build on this by ensuring that if you risk one unit (1R), the reward targets are set at predefined multiples of that risk. This enforces positive expectancy at the structural level: the strategy cannot generate entries with inherently negative payoffs.
Once price begins to move in your favour, trailing logic takes over if you choose to enable it. Trailing can begin immediately from entry or only after a target has been hit. Many users prefer to let TP1 and TP2 behave as fixed profit points and then apply a trailing stop or trailing take profit to the final remainder. That way, routine winners are banked mechanically, while occasional explosive moves can be ridden for as long as the market allows. The breakeven module supports this behaviour by automatically moving stops to entry (or slightly through entry into profit) after a specified condition such as TP1 being hit. This transforms the risk profile mid trade: once breakeven has been secured, remaining size can be managed with much less psychological pressure.
The system also recognises the cost of time. Kill Switch functionality exits trades that have been open too long under mediocre conditions, typically when they are in modest profit but not progressing. This protects you from capital being tied up while better opportunities appear elsewhere. Underlying all of this are several trailing stop mechanisms: percentage-based, tick-based for very short-term strategies, TP linked trailing that activates only once a certain profit threshold has been achieved, and ATR based trailing that automatically scales the trail distance with volatility. Each method serves a slightly different profile of strategy, but all share the same aim: preserve gains and limit downside in a structured way rather than rely on discretionary judgement after the fact.
4. Filters and Risk Management
The filter systems in PA Builder formalise the idea that good trading is often about knowing when not to act. “Do Not Trade” conditions can be configured so that even a perfectly aligned bullish entry stack is overridden if certain bearish evidence is present. These can include higher timeframe reversal structures, powerful opposing divergences, or conflicting signals in key modules. By assigning conditions specifically to “Do Not Long” and “Do Not Short” rather than only to entries, you create asymmetry: buying requires bullish evidence and an absence of strong bearish warnings; selling requires the mirror.
Volatility filters extend this logic to the regime level. Some strategies are inherently suited to low volatility, range bound environments where fading extremes is profitable; others require expansion and energy to function properly. By binding trading permission to volatility ranges, you ensure that a mean-reversion system does not blindly attempt to fade a breakout, and that a momentum system does not spin its wheels in a dead, sideways market. You can even reference volatility from a higher timeframe than the one you trade, so that a five-minute strategy is still aware of the broader one-hour volatility regime it sits inside.
Applied DO NOT TRADE - removes poor signal
Risk management and position sizing are configured so each trade is expressed in units of risk rather than arbitrary size. Leverage, in this framework, is simply a scaling factor for capital efficiency; the actual risk per trade is still controlled by the distance between entry and stop and the percentage of equity you choose to expose. Reinvestment options then decide what proportion of accumulated profit is fed back into position sizing. A more aggressive reinvestment setting accelerates compounding but increases the amplitude of drawdowns; a more conservative one smooths the equity curve at the cost of slower growth. The Base Trade Value parameter ties all of this together by deciding how much nominal capital or how many contracts are committed per trade in light of your maximum allowed simultaneous positions and your intended use of leverage.
External exit conditions provide further flexibility. For example, you might design a system whose entries rely purely on PA Builder’s internal modules, but whose exits use RSI readings, moving average crosses, or a proprietary external indicator. The separation of entry and exit logic allows you to bolt on different behaviours at the tail end of trades while keeping your core signal engine intact. In all cases, the objective is the same: express risk in a controlled, repeatable way that can survive long stretches of unfavourable market conditions.
5. PDT, Cooldowns and Visual Modes
For traders subject to Pattern Day Trading rules, PA Builder includes a day-trade tracking system that counts business days correctly and respects the three-trades-in-five-days limit. This goes beyond simple compliance; it forces discipline. When intraday trading is heavily constrained, you are naturally pushed toward swing-oriented strategies with fewer, more selective entries. The tool visually marks your PDT status so you never inadvertently cross the line and trigger a lockout.
Cooldown systems address another reality: psychological vulnerability after streaks. Following several consecutive wins, many traders unconsciously loosen their standards, take marginal signals, oversize positions, or overtrade. A win-streak cooldown deliberately pauses trading after a configured number of wins, giving you time to reset. The same applies to losing streaks. After a run of losses, the strongest temptation is often to “make it back now,” which is exactly when discipline is weakest. A loss-streak cooldown enforces a break in activity during this high-risk emotional state, helping to prevent cascading damage driven by revenge trading.
Visualisation comes in two main modes. Classic mode emphasises precision: it draws explicit entry lines, stop levels, target levels and fill zones, making it easy to audit risk/reward on each trade, verify that the exit logic behaves as intended, and review historical trades in detail. Modern mode emphasises market feel: instead of focusing on exact levels, it colours candles and backgrounds to reflect momentum, profit state and dynamics.
This helps you see at a glance whether a strategy is operating in a smooth trending environment or a choppy, fragmented one, and whether current trades are broadly working or struggling. Many users develop and debug in Classic mode and then monitor live performance in Modern mode, so both representations become part of the workflow.
6. Strategy Design Workflow, Examples and Cautions
Designing with PA Builder is inherently iterative. You begin with a simple theory and a minimal configuration, perhaps just a trend filter and a basic stop/target structure, and run a backtest. You then examine where the system fails. If you see many losses occurring in counter-trend conditions, you add an additional directional filter or restrict entries with a higher-timeframe reactor condition. If you observe many small whipsaw losses, you might require candle structure confirmation or volume confirmation before allowing an entry. Each change is made one at a time and evaluated. This process gradually builds a layered system where every component has a clear purpose: some reduce drawdown, some increase win rate, some cut out only the worst trades, and others help capture more of the best ones.
A conservative swing strategy might need an agreement between short-term trend signals, a higher-timeframe Quantum position, and a bullish Dynamic Reactor state, while checking that volume supports the move and that no significant bearish reversals or divergences are present on higher timeframes. It might accept relatively few trades, but each trade would be tightly controlled, scaled out over several ATR-based targets and protected with breakeven and trailing logic. On the opposite end, an aggressive scalping configuration would relax some filters, favour faster sensitivities, use short lookback reversals, and tighten stops and targets dramatically, relying on high frequency and careful volatility filtering to maintain edge.
Throughout all of this, overfitting remains the main danger. The more parameters you tune and the more coincidental rules you add to make the backtest equity curve smoother, the more likely it is that you are capturing noise rather than a real, repeatable edge. Signs of overfitting include heavily optimised numeric values with no intuitive justification, large differences between in-sample and out-of-sample results, or strategies that work spectacularly in very specific regimes and collapse elsewhere. To mitigate this, keep strategies as simple as possible, test across different market regimes (bull, bear, range), and accept that robust systems usually look less “perfect” on the historical chart.
Bridging the gap from backtest to live trading is another critical step. Before risking capital, it is wise to paper trade the configuration for a number of trades to confirm that signal frequency, behaviour and execution align with expectations. When going live, starting with minimal size and gradually scaling up based on real-world performance helps manage both financial and psychological risk. If live results diverge significantly from backtest expectations due to slippage, fees, or changing market conditions, you can adjust, reduce size, or temporarily pause rather than commit fully to a failing configuration.
Ultimately, PA Builder is designed to be a tool for building structured, rules-driven trading systems. It gives you the tools to express your ideas, test them, refine them, and run them under controlled risk. It does not remove uncertainty or guarantee results, but it does provide a clear, transparent way to translate trading concepts into executable, testable logic, and to evolve those systems as markets change and your understanding deepens.

Gold H1 Breakout Failure (V11.0)This strategy is designed for trading XAU/USD (Gold) on the 1-hour timeframe. It identifies and trades fake breakouts of the Asian session range.
The logic is simple yet effective:
The script first marks the Asian session high and low.
Once price breaks out of this range and closes outside, it waits for confirmation by watching for price to close back inside the range.
When this re-entry occurs, the strategy takes a position in the opposite direction of the initial breakout, anticipating a false breakout or liquidity trap setup.
By focusing on these fakeouts, the strategy aims to capture reversal momentum after liquidity sweeps, making it especially effective during sessions when volatility transitions from Asia to London or New York.

SMC 自動交易 - 4HR- BTC適用# SMC Automated Trading Strategy Whitepaper - Stepped Enhanced Edition
## 1. Strategy Overview
This strategy is designed based on the Smart Money Concept (SMC), integrating Order Block (OB), Change of Character (CHoCH), and strict pullback confirmation conditions. The goal is to enhance trading accuracy and strictly control risk, specifically tailored for trading competitions, meeting the requirements of stability and efficiency.
### Core Strategy Concepts:
- Precise identification of key trend reversal points.
- Strict pullback confirmation to avoid chasing tops or bottoms.
- Clear risk management and take-profit mechanisms to maintain stable risk-reward ratio.
- Supports trading time filtering (Kill Zone) to capture prime volatility windows.
- Multiple visual aids for quick in-trade signal recognition.
## 2. Strategy Logic Flow
### 1. Kill Zone (Optional Activation)
- Default trading time: Taiwan time 15:00 - 18:00.
- Purpose: Focus on high-volatility periods to reduce false signals in choppy markets.
### 2. Order Block Detection
- Current candle range exceeds the previous candle by a specified multiplier (default 0.8).
- Bullish OB: Bullish candle with expanded range.
- Bearish OB: Bearish candle with expanded range.
- Flexible OB sensitivity adjustment according to market volatility.
### 3. Change of Character (CHoCH)
- Initial trend reversal confirmation:
- Bullish CHoCH: Close above previous candle’s high.
- Bearish CHoCH: Close below previous candle’s low.
### 4. Pullback Confirmation (Core Condition)
- Avoid premature entries by requiring a pullback to the prior OB:
- Long: Pullback touches the previous Bullish OB high.
- Short: Pullback touches the previous Bearish OB low.
### 5. Fair Value Gap (FVG) Detection (Optional)
- Detect price imbalances as additional confirmation signals.
## 3. Entry Logic
### Long Position:
- Previous Bullish OB is formed.
- Current candle completes a pullback to the prior OB high.
- Current candle closes above the previous high (CHoCH confirmation).
- (Optional) Within Kill Zone.
### Short Position:
- Previous Bearish OB is formed.
- Current candle completes a pullback to the prior OB low.
- Current candle closes below the previous low (CHoCH confirmation).
- (Optional) Within Kill Zone.
## 4. Risk Management & Exit Strategy
### Stop Loss:
- Long: Current candle’s low minus buffer points (default 50 points).
- Short: Current candle’s high plus buffer points (default 50 points).
### Take Profit:
- Default Risk-Reward Ratio (RR): 2.0 (customizable).
- Automatically calculates target take-profit level.
### Full Automation:
- This is a fully automated strategy. Orders are placed automatically upon conditions being met, requiring no manual intervention.
## 5. Visual Aids
- Bullish OB: Green upward triangle.
- Bearish OB: Red downward triangle.
- Bullish CHoCH: Blue circle.
- Bearish CHoCH: Orange circle.
- FVG: Highlighted zones (optional).
> **Advantage:** Quick market status recognition during trades, improving strategy transparency.
## 6. Strategy Advantages
✅ Dual trend reversal confirmation: OB + CHoCH.
✅ Strict pullback requirement to reduce false breakouts.
✅ Clear risk control and stable risk-reward ratio.
✅ Visual aids + time filter for clear in-trade decisions.
✅ Fully automated trading reduces human error.
## 7. Application Scenarios
- Trading competitions: Designed for high win-rate and strict risk control.
- FTMO and similar evaluation challenges.
- Intraday or swing trading strategy frameworks.
- High-volatility assets: Crypto / Forex / Index CFDs.
## 8. Risk Warning
- Strategy is based on historical backtesting; live trading should consider slippage and liquidity risks.
- During high volatility periods, use proper money management tools and strictly execute stop losses.
## 9. Version Note
Version: Stepped Enhanced Edition (Updated April 2025)
Developer: natwad3000

Dynamic Swing Anchored VWAP STRAT (Zeiierman/PineIndicators)Dynamic Swing Anchored VWAP STRATEGY — Zeiierman × PineIndicators (Pine Script v6)
A pivot-to-pivot Anchored VWAP strategy that adapts to volatility, enters long on bullish structure, and closes on bearish structure. Built for TradingView in Pine Script v6.
Full credits to zeiierman.
Repainting notice: The original indicator logic is repainting. Swing labels (HH/HL/LH/LL) are finalized after enough bars have printed, so labels do not occur in real time. It is not possible to execute at historical label points. Treat results as educational and validate with Bar Replay and paper trading before considering any discretionary use.
Concept
The script identifies swing highs/lows over a user-defined lookback ( Swing Period ). When structure flips (most recent swing low is newer than the most recent swing high, or vice versa), a new regime begins.
At each confirmed pivot, a fresh Anchored VWAP segment is started and updated bar-by-bar using an EWMA-style decay on price×volume and volume.
Responsiveness is controlled by Adaptive Price Tracking (APT) . Optionally, APT auto-adjusts with an ATR ratio so that high volatility accelerates responsiveness and low volatility smooths it.
Longs are opened/held in bullish regimes and closed when the regime turns bearish. No short positions are taken by design.
How it works (under the hood)
Swing detection: Uses ta.highestbars / ta.lowestbars over prd to update swing highs (ph) and lows (pl), plus their bar indices (phL, plL).
Regime logic: If phL > plL → bullish regime; else → bearish regime. A change in this condition triggers a re-anchor of the VWAP at the newest pivot.
Adaptive VWAP math: APT is converted to an exponential decay factor ( alphaFromAPT ), then applied to running sums of price×volume and volume, producing the current VWAP estimate.
Rendering: Each pivot-anchored VWAP segment is drawn as a polyline and color-coded by regime. Optional structure labels (HH/HL/LH/LL) annotate the swing character.
Orders: On bullish flips, strategy.entry("L") opens/maintains a long; on bearish flips, strategy.close("L") exits.
Inputs & controls
Swing Period (prd) — Higher values identify larger, slower swings; lower values catch more frequent pivots but add noise.
Adaptive Price Tracking (APT) — Governs the VWAP’s “half-life.” Smaller APT → faster/closer to price; larger APT → smoother/stabler.
Adapt APT by ATR ratio — When enabled, APT scales with volatility so the VWAP speeds up in turbulent markets and slows down in quiet markets.
Volatility Bias — Tunes the strength of APT’s response to volatility (above 1 = stronger effect; below 1 = milder).
Style settings — Colors for swing labels and VWAP segments, plus line width for visibility.
Trade logic summary
Entry: Long when the swing structure turns bullish (latest swing low is more recent than the last swing high).
Exit: Close the long when structure turns bearish.
Position size: qty = strategy.equity / close × 5 (dynamic sizing; scales with account equity and instrument price). Consider reducing the multiplier for a more conservative profile.
Recommended workflow
Apply to instruments with reliable volume (equities, futures, crypto; FX tick volume can work but varies by broker).
Start on your preferred timeframe. Intraday often benefits from smaller APT (more reactive); higher timeframes may prefer larger APT (smoother).
Begin with defaults ( prd=50, APT=20 ); then toggle “Adapt by ATR” and vary Volatility Bias to observe how segments tighten/loosen.
Use Bar Replay to watch how pivots confirm and how the strategy re-anchors VWAP at those confirmations.
Layer your own risk rules (stops/targets, max position cap, session filters) before any discretionary use.
Practical tips
Context filter: Consider combining with a higher-timeframe bias (e.g., daily trend) and using this strategy as an entry timing layer.
First pivot preference: Some traders prefer only the first bullish pivot after a bearish regime (and vice versa) to reduce whipsaw in choppy ranges.
Deviations: You can add VWAP deviation bands to pre-plan partial exits or re-entries on mean-reversion pulls.
Sessions: Session-based filters (RTH vs. ETH) can materially change behavior on futures and equities.
Extending the script (ideas)
Add stops/targets (e.g., ATR stop below last swing low; partial profits at k×VWAP deviation).
Introduce mirrored short logic for two-sided testing.
Include alert conditions for regime flips or for price-VWAP interactions.
Incorporate HTF confirmation (e.g., only long when daily VWAP slope ≥ 0).
Throttle entries (e.g., once per regime flip) to avoid over-trading in ranges.
Known limitations
Repainting: Swing labels and pivot confirmations depend on future bars; historical labels can look “perfect.” Treat them as annotations, not executable signals.
Execution realism: Strategy includes commission and slippage fields, yet actual fills differ by venue/liquidity.
No guarantees: Past behavior does not imply future results. This publication is for research/education only and not financial advice.
Defaults (backtest environment)
Initial capital: 10,000
Commission value: 0.01
Slippage: 1
Overlay: true
Max bars back: 5000; Max labels/polylines set for deep swing histories
Quick checklist
Add to chart and verify that the instrument has volume.
Use defaults, then tune APT and Volatility Bias with/without ATR adaptation.
Observe how each pivot re-anchors VWAP and how regime flips drive entries/exits.
Paper trade across several symbols/timeframes before any discretionary decisions.
Attribution & license
Original indicator concept and logic: Zeiierman — please credit the author.
Strategy wrapper and publication: PineIndicators .
License: CC BY-NC-SA 4.0 (Attribution-NonCommercial-ShareAlike). Respect the license when forking or publishing derivatives.

Hilly's Advanced Crypto Scalping Strategy - 5 Min ChartTo determine the "best" input parameters for the Advanced Crypto Scalping Strategy on a 5-minute chart, we need to consider the goals of optimizing for profitability, minimizing false signals, and adapting to the volatile nature of cryptocurrencies. The default parameters in the script are a starting point, but the optimal values depend on the specific cryptocurrency pair, market conditions, and your risk tolerance. Below, I'll provide recommended input values based on common practices in crypto scalping, along with reasoning for each parameter. I’ll also suggest how to fine-tune them using TradingView’s backtesting and optimization tools.
Recommended Input Parameters
These values are tailored for a 5-minute chart for liquid cryptocurrencies like BTC/USD or ETH/USD on exchanges like Binance or Coinbase. They aim to balance signal frequency and accuracy for day trading.
Fast EMA Length (emaFastLen): 9
Reasoning: A 9-period EMA is commonly used in scalping to capture short-term price movements while remaining sensitive to recent price action. It reacts faster than the default 10, aligning with the 5-minute timeframe.
Slow EMA Length (emaSlowLen): 21
Reasoning: A 21-period EMA provides a good balance for identifying the broader trend on a 5-minute chart. It’s slightly longer than the default 20 to reduce noise while confirming the trend direction.
RSI Length (rsiLen): 14
Reasoning: The default 14-period RSI is a standard choice for momentum analysis. It works well for detecting overbought/oversold conditions without being too sensitive on short timeframes.
RSI Overbought (rsiOverbought): 75
Reasoning: Raising the overbought threshold to 75 (from 70) reduces false sell signals in strong bullish trends, which are common in crypto markets.
RSI Oversold (rsiOversold): 25
Reasoning: Lowering the oversold threshold to 25 (from 30) filters out weaker buy signals, ensuring entries occur during stronger reversals.
MACD Fast Length (macdFast): 12
Reasoning: The default 12-period fast EMA for MACD is effective for capturing short-term momentum shifts in crypto, aligning with scalping goals.
MACD Slow Length (macdSlow): 26
Reasoning: The default 26-period slow EMA is a standard setting that works well for confirming momentum trends without lagging too much.
MACD Signal Smoothing (macdSignal): 9
Reasoning: The default 9-period signal line is widely used and provides a good balance for smoothing MACD crossovers on a 5-minute chart.
Bollinger Bands Length (bbLen): 20
Reasoning: The default 20-period Bollinger Bands are effective for identifying volatility breakouts, which are key for scalping in crypto markets.
Bollinger Bands Multiplier (bbMult): 2.0
Reasoning: A 2.0 multiplier is standard and captures most price action within the bands. Increasing it to 2.5 could reduce signals but improve accuracy in highly volatile markets.
Stop Loss % (slPerc): 0.8%
Reasoning: A tighter stop loss of 0.8% (from 1.0%) suits the high volatility of crypto, helping to limit losses on false breakouts while keeping risk manageable.
Take Profit % (tpPerc): 1.5%
Reasoning: A 1.5% take-profit target (from 2.0%) aligns with scalping’s goal of capturing small, frequent gains. Crypto markets often see quick reversals, so a smaller target increases the likelihood of hitting profits.
Use Candlestick Patterns (useCandlePatterns): True
Reasoning: Enabling candlestick patterns (e.g., engulfing, hammer) adds confirmation to signals, reducing false entries in choppy markets.
Use Volume Filter (useVolumeFilter): True
Reasoning: The volume filter ensures signals occur during high-volume breakouts, which are more likely to sustain in crypto markets.
Signal Arrow Size (signalSize): 2.0
Reasoning: Increasing the arrow size to 2.0 (from 1.5) makes buy/sell signals more visible on the chart, especially on smaller screens or volatile price action.
Background Highlight Transparency (bgTransparency): 85
Reasoning: A slightly higher transparency (85 from 80) keeps the background highlights subtle but visible, avoiding chart clutter.
How to Apply These Parameters
Copy the Script: Use the Pine Script provided in the previous response.
Paste in TradingView: Open TradingView, go to the Pine Editor, paste the code, and click "Add to Chart."
Set Parameters: In the strategy settings, manually input the recommended values above or adjust them via the input fields.
Test on a 5-Minute Chart: Apply the strategy to a liquid crypto pair (e.g., BTC/USDT, ETH/USDT) on a 5-minute chart.
Fine-Tuning for Optimal Performance
To find the absolute best parameters for your specific trading pair and market conditions, use TradingView’s Strategy Tester and optimization features:
Backtesting:
Run the strategy on historical data for your chosen pair (e.g., BTC/USDT on Binance).
Check metrics like Net Profit, Profit Factor, Win Rate, and Max Drawdown in the Strategy Tester.
Focus on a sample period of at least 1–3 months to capture various market conditions (bull, bear, sideways).
Parameter Optimization:
In the Strategy Tester, click the settings gear next to the strategy name.
Enable optimization for key inputs like emaFastLen (test range: 7–12), emaSlowLen (15–25), slPerc (0.5–1.5), and tpPerc (1.0–3.0).
Run the optimization to find the combination with the highest net profit or best Sharpe ratio, but avoid over-optimization (curve-fitting) by testing on out-of-sample data.
Market-Specific Adjustments:
Volatile Pairs (e.g., DOGE/USDT): Use tighter stop losses (e.g., 0.5–0.7%) and smaller take-profit targets (e.g., 1.0–1.2%) to account for rapid price swings.
Stable Pairs (e.g., BTC/USDT): Slightly wider stop losses (e.g., 1.0–1.2%) and take-profit targets (e.g., 1.8–2.5%) may work better.
Trending Markets: Increase emaSlowLen (e.g., to 25–30) to follow stronger trends.
Choppy Markets: Tighten bbMult (e.g., to 1.8) and lower rsiOverbought/rsiOversold (e.g., to 70/30) to filter noise.
Forward Testing:
After backtesting, run the strategy in real-time on a demo account for 1–2 weeks to validate performance under current market conditions.
Important Notes
No Universal "Best" Numbers: Optimal parameters vary by crypto pair, exchange, and market conditions (e.g., bull vs. bear market). The suggested values are a starting point based on common scalping practices.
Risk Management: Never risk more than 1–2% of your account per trade. Adjust position sizing in TradingView’s strategy settings to align with your risk tolerance.
Market Volatility: Crypto markets are highly volatile. Test the strategy on your specific pair and adjust parameters if signals are too frequent or too rare.
Not Financial Advice: This is an educational tool. Backtest thoroughly and use a demo account before trading with real funds.
If you want me to generate a chart showing backtest performance for specific parameters or to tweak the script further (e.g., adding more indicators or adjusting signal logic), let me know!can you add clear buy ans sell signs above the candles in this codeTo add clear buy and sell signals above the candles in the provided Pine Script, I'll modify the existing code to include prominent text labels directly above (for sell signals) and below (for buy signals) the candles. These labels will be larger, color-coded, and positioned to avoid clutter, ensuring they are easily visible on the chart. The core strategy logic (EMA, RSI, MACD, Bollinger Bands, candlestick patterns, and volume filter) will remain unchanged, and I'll reuse the same artifact_id since this is an update to the previous script.AdvancedCryptoScalpingStrategy.pinex-pine

The Barking Rat PROThe Barking Rat PRO is designed around high/low pivot structure to capture meaningful market reversals. It intelligently identifies turning points by combining higher high/lower low (HH/LL) pivot detection, Fair Value Gap (FVG) confirmation, volatility-aware filters, and momentum checks. Unique features, such as a one-bar flip handler and a contextual ribbon overlay, provide traders with both clarity and precision. These tools help isolate high-probability setups while filtering out low-conviction signals, making trade opportunities easier to spot and act upon.
🧠 Core Logic: Structure-First, Filtered Reversals
The strategy takes a methodical, disciplined approach, prioritizing structural pivots over random signals. By layering multiple validation checks—structural pivots, gap confirmation, volatility filters, and momentum alignment—it highlights trades with high conviction while reducing exposure to noisy market conditions. The result is a clear, repeatable framework for reversal trading that can be applied across timeframes.
HH/LL Pivot Framework
Trades are triggered based on simple structural pivots: higher highs (HH) and lower lows (LL). When a structure flip occurs, the strategy either opens a new position or executes a one-bar delayed flip if an opposing position already exists. This ensures smooth transitions and avoids premature entries on minor market swings, keeping trading decisions focused on meaningful trend shifts.
Volatility & Distance Filters
To avoid low-quality trades, entries are validated against relative volatility, ensuring that pivots represent significant market movement. Trades must also be sufficiently spaced from previous entries and separated by a minimum number of bars, which prevents overtrading and clustered signals that can dilute performance.
Momentum Filter (RSI)
The strategy optionally aligns entries with momentum conditions using RSI. Long trades are favored when RSI is relatively low, suggesting potential exhaustion on the downside, while short trades are favored when RSI is relatively high, indicating potential overextension on the upside. This additional layer improves timing, helping traders avoid entering against strong, ongoing momentum.
Background Ribbon (Contextual Visuals)
A translucent ribbon overlays the chart to provide visual context of active trades. The ribbon displays volatility envelopes and position direction: green for long trades, red for short trades. It enhances clarity by giving traders a quick visual reference of the market environment without cluttering the chart.
Why These Parameters Were Chosen
The strategy focuses only on structurally meaningful pivots to ensure high-conviction trades.
Volatility filters confirm that trade signals are significant relative to recent price action, while FVG confirmation captures institutional-style imbalances.
Momentum and spacing rules prevent low-quality entries and overtrading, while the one-bar flip handler ensures seamless transitions when the structure reverses.
Ribbon overlays provide intuitive, real-time visualization of active trades and market context.
📈 Chart Visuals: Clear & Intuitive
- Green “▲” below a candle: Long entry triggered on LL → HH structure flip
- Red “▼” above a candle: Short entry triggered on HH → LL structure flip
- Translucent Ribbon: Green when long, Red when short
🔔 Alerts: Stay Notified Without Watching
The strategy supports real-time alerts on candle close, ensuring that only fully confirmed signals trigger notifications.
You must manually configure alerts within your TradingView account. Once set up, a single alert per instrument covers all relevant entries and exits, making hands-free monitoring simple and efficient.
⚙️ Strategy Report Properties
Position size: 25% of equity per trade
Initial capital: 10,000.00 USDT
Pyramiding: 25 entries per direction
Slippage: 2 ticks
Commission: 0.055% per side
Backtest timeframe: 1-minute
Backtest instrument: HYPEUSDT
Backtesting range: Aug 11, 2025 — Aug 28, 2025
💡Why 25% Equity Per Trade?
While it's always best to size positions based on personal risk tolerance, we defaulted to 25% equity per trade in the backtesting data — and here’s why:
Backtests using this sizing show manageable drawdowns even under volatile periods
The strategy generates a sizeable number of trades, reducing reliance on a single outcome
Combined with conservative filters, the 25% setting offers a balance between aggression and control
Users are strongly encouraged to customize this to suit their risk profile.
🔍 What Makes This Strategy Unique?
HH/LL Pivot Focus: Trades pivot structure flips instead of relying on generic indicators.
Fair Value Gap Confirmation: Only pivots supported by FVGs are acted upon, reducing noise.
One-Bar Flip Handler: Ensures clean transitions when the structure reverses, avoiding same-bar conflicts.
Volatility & Spacing Filters: Trades require sufficient movement from prior entries and minimum bar spacing to maintain quality.
Momentum-Aware Entries: RSI alignment favors entries near potential exhaustion points, improving signal reliability.
Contextual Ribbon Overlay: Visualizes volatility and active positions clearly, without cluttering the chart.
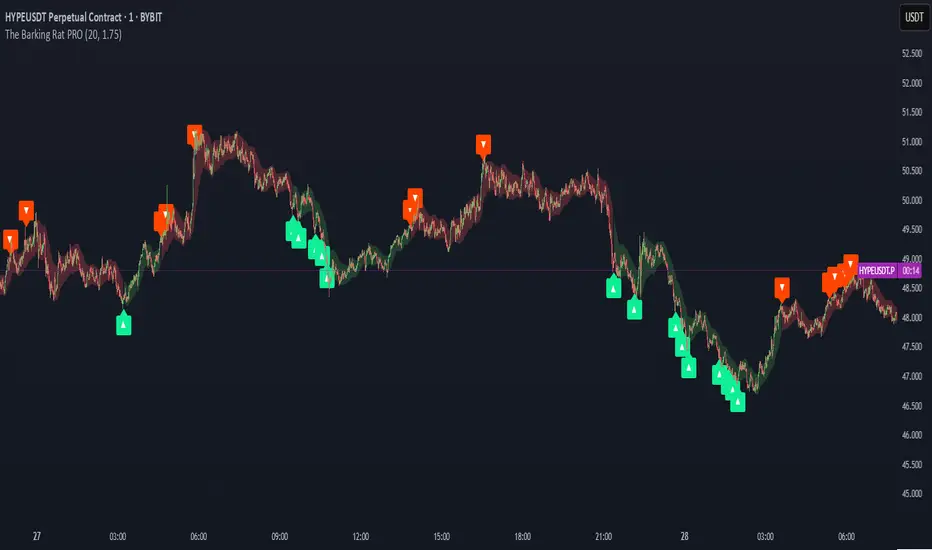
Liquidity Sweep Breakout - LSBLiquidity Sweep Breakout - LSB
A professional session-based breakout system designed for OANDA:USDJPY and other JPY pairs.
Not guesswork, but precision - built on detailed observation of institutional moves to capture clear trade direction daily.
Master the Market’s Daily Bank Flow.
---
Strategy Detail:
I discovered this strategy after carefully studying how Japanese banks influence the forex market during their daily settlement period. Banks are some of the biggest players in the financial world, and when they adjust or settle their accounts in the morning, it often creates a push in the market. From years of observation, I noticed a consistent pattern, once banks finish their settlements, the market usually continues moving in the same direction that was formed right after those actions. This daily banking flow often sets the tone for the entire trading session, especially for JPY pairs like USDJPY.
To capture this move, I built the indicator so that it follows the bank-driven trend with clear rules for entries, stop-loss (SL), and take-profit (TP). The system is designed with professional risk management in mind. By default, it assumes a $10,000 account size, risks only 1% of that balance per trade, and targets a 1:1.5 reward-to-risk ratio. This means for every $100 risked, the potential profit is $150. Such controlled risk makes the system safer and more sustainable for long-term traders. At the same time, users are not limited to this setup, they can adjust the account balance in the settings, and the indicator will automatically recalculate the lot size and risk levels based on their own capital. This ensures the strategy works for small accounts and larger accounts alike.
🌍 Why It Works
Fundamentally driven: Based on **daily Japanese banking settlement flows**.
Session-specific precision: Targets the exact window when USDJPY liquidity reshapes.
Risk-managed: Always calculates lot size based on account and risk preferences.
Automatable: With webhook + MT5 EA, it can be fully hands-free.
---
✅ Recommended
Pair: USDJPY (best observed behavior).
Timeframe: 3-Minute chart.
Platform: TradingView Premium (for webhooks).
Execution: MT5 via EA.
---
🔎 Strategy Concept
The Tokyo Magic Breakout (TMB) is built on years of session observation and the unique daily rhythm of the Japanese banking system.
Every morning between 5:50 AM – 6:10 AM PKT (09:50 – 10:10 JST), Japanese banks perform daily reconciliation and settlement. This often sets the tone for the USDJPY direction of the day.
This strategy isolates that critical moment of liquidity adjustment and waits for a clean breakout confirmation. Instead of chasing noise, it executes only when price action is aligned with the Tokyo market’s hidden flows.
---
🕒 Timing Logic
Session Start: 5:00 AM PKT (Tokyo market open range).
Magic Candle: The 5:54 AM PKT candle is marked as the reference “breakout selector.”
Checkpoints: First confirmation at 6:30 AM PKT, then every 15 minutes until 8:30 AM PKT.
* If price stays inside the magic range → wait.
* If a breakout happens but the candle wick touches the range → wait for the next checkpoint.
* If by 8:30 AM PKT no clean breakout occurs → the day is marked as No Trade Day (NTD).
👉 Recommended timeframe: 3-Minute chart (3M) for precise signals.
---
📈 Trade Execution
Entry: Clean break above/below the magic candle’s range.
Stop-Loss: Opposite side of the Tokyo session high/low.
Take-Profit: Calculated by Reward\:Risk ratio (default 1.5:1).
Lot Size: Auto-calculated based on your risk model:
* Fixed Dollar
* % of Equity
* Conservative (minimum of both).
Visuals include:
✅ Entry/SL/TP lines
✅ Shaded risk (red) and reward (green) zones
✅ Trade labels (Buy/Sell with lot size & levels)
✅ TP/SL hit markers
---
🔔 Alerts & Automation (AutoTMB)
This strategy is fully automation-ready with EA + MT5:
1. Enable alerts in TMB settings.
2. Insert your PineConnector License Key.
3. Configure your risk management preferences.
4. Create a TradingView alert → in the message box simply type:
Pine Script®
{{alert_message}}
and set the EA webhook.
Now, every breakout trade (with exact entry, SL, TP, and lot size) is sent instantly.
👉 On your MT5:
* Install the EA.
* Use the same license key.
* Run it on a VPS or local MT5 terminal.
You now have a hands-free trading system: AutoTMB.

Script_Algo - Fibo Correction Strategy🔹 Core Concept
The strategy is built on combining Fibonacci retracement levels, candlestick pattern confirmation, and trend filtering for trade selection. It performs well on the 1-hour timeframe across many cryptocurrency pairs. Particularly on LINKUSDT over the past year and a half, despite the not very optimal 1:1 risk/reward ratio.
The logic is simple: after a strong impulse move, the price often retraces to key Fibonacci levels (specifically, the 61.8% level). If a confirming candlestick (pattern) appears at this moment, the strategy looks for an entry in the direction of the main trend.
🔹 Indicators Used in the Strategy
ATR (Average True Range) — Used to calculate the stop-loss and take-profit levels.
EMA (9 and 21) — Additional moving averages for assessing the direction of movement (not directly used in entry conditions, but the logic can be expanded to include them).
SMA (Trend Filter, 20 by default) — The trend direction filter. Trades are only opened in its direction.
Fibonacci Levels — The 61.8% retracement level is calculated based on the high and low of the previous candle.
🔹 Entry Conditions
🟢 Long (Buy):
Previous Candle:
Must be green (close higher than open).
Must have a body not smaller than a specified minimum.
The upper wick must not exceed 30% of the body size.
→ This filters out "weak" or "indecisive" candles.
Current Candle:
Price touches or breaches the Fibonacci 61.8% retracement level from the previous range.
Closes above this level.
Closes above the Trend Filter (SMA) line.
A position is opened only if there are no other open trades at the moment.
🔴 Short (Sell):
Previous Candle:
Must be red (close lower than open).
Must have a body not smaller than a specified minimum.
The lower wick must not exceed 30% of the body size.
Current Candle:
Price touches or breaches the Fibonacci 61.8% retracement level from the previous range.
Closes below this level.
Closes below the Trend Filter (SMA) line.
A trade is opened only if there are no other open positions.
🔹 Risk Management
Stop-Loss = ATR × multiplier (default is 5).
Take-Profit = ATR × the same multiplier.
Thus, the default risk/reward ratio is 1:1, but it can be easily adjusted by changing the coefficient. Although, strangely enough, this ratio has shown the best results on some assets on the 1-hour timeframe.
🔹 Chart Visualization
Fibonacci level for Long — Green line with circles.
Fibonacci level for Short — Red line with circles.
Trend Filter line (SMA) — Blue.
🔹 Strengths of the Strategy
✅ Utilizes a proven market pattern — retracement to the 61.8% level.
✅ Further filters entries using trend and candlestick patterns.
✅ Simple, transparent logic that is easy to expand (e.g., adding other Fib levels, an EMA filter, etc.).
🔹 Limitations
⚠️ Performs better in trending markets; can generate false signals during ranging (sideways) conditions.
⚠️ The fixed 1:1 risk/reward ratio is not always optimal and could be refined.
⚠️ Performance depends on the selected timeframe and ATR parameters.
📌 Summary:
The strategy seeks corrective entries in the direction of the trend, confirmed by candlestick patterns. It is versatile and can be applied to forex pairs, cryptocurrencies, and stocks.
⚠️ Not financial advice. Pay close attention to risk management to avoid blowing your account. The strategy is not repainting — I have personally verified it through real testing — but it may not necessarily replicate the same results in the future, as the market is constantly changing. Test it, profit, and good luck to everyone!

Candlestick Pattern Strategy with Smart Stop-Loss Management🔹 Strategy Overview
This strategy combines candlestick patterns with trend filtering and EMA channel confirmation to identify high-probability trading opportunities. It features a smart stop-loss management system that moves to breakeven once the trade reaches a predefined profit threshold.
📊 Key Features
✅ Multiple Candlestick Patterns – Detects classic reversal patterns like:
Hammer & Hanging Man
Bullish & Bearish Engulfing
Piercing Line & Dark Cloud Cover
Morning & Evening Star
Doji Star (Neutral Signal)
✅ Trend & EMA Channel Filters
Trend EMA (100-period) – Ensures trades align with the broader trend.
EMA Channel (50-period ± % range) – Filters trades within a defined volatility range.
✅ Flexible Trade Management
Fixed Target Points – Take profit at a predefined distance.
Trailing Stop to Cost – Moves stop-loss to breakeven after reaching a specified profit threshold.
✅ Customizable Trade Direction
Long Only / Short Only / Both – Adapt to bullish, bearish, or neutral markets.
✅ Time-Based Execution
Intraday Mode – Trades only within specified session hours.
Positional Mode – Holds trades beyond the session.
⚙️ Input Parameters
Trend Filter – Enable/disable trend alignment with EMA.
EMA Channel Filter – Adjust channel width for volatility control.
Candlestick Patterns – Toggle individual patterns on/off.
Target Points & Trail Trigger – Customize profit-taking and SL management.
Trade Type – Switch between intraday and positional trading.
📈 Entry Conditions
Long Entry:
Bullish candlestick pattern (Hammer, Bullish Engulfing, Piercing Line, Morning Star).
Price above Trend EMA (if enabled).
RSI < 30 (oversold confirmation).
Within EMA Channel (if enabled).
Short Entry:
Bearish candlestick pattern (Hanging Man, Bearish Engulfing, Dark Cloud Cover, Evening Star).
Price below Trend EMA (if enabled).
RSI > 70 (overbought confirmation).
Within EMA Channel (if enabled).
📉 Exit Conditions
Take Profit (TP): Fixed target based on points.
Stop-Loss (SL): Moves to breakeven after hitting the trail trigger.
📊 Visual Indicators
Trend EMA (Orange Line) – Main trend direction.
EMA Channel (Blue Lines) – Volatility range.
Buy/Sell Labels – Entry signals below/above bars.
Doji Star (Gray Cross) – Neutral signal.
🎯 Best Suited For
Swing Traders (Positional Mode)
Intraday Traders (Scalping with tight stops)
Price Action Enthusiasts (Candlestick-based entries)
🔗 Try it out and customize it to fit your trading style! 🚀

POCTraderX Pro— Structure & Precision Algorithm POCTraderX Pro is a market analysis system designed to accurately identify key interest zones and price turning points. It combines advanced Price Action reading with a dynamic filtering process that adapts signals according to market volatility and internal structure.
Methodology
The algorithm analyzes the sequence of relevant highs and lows (HH, HL, LL, LH) along with the price location in relation to Point of Control levels and consolidation ranges.
It uses multi–timeframe confirmations to filter out false breakouts and optimize trade entries.
In high–volatility conditions, it automatically adjusts validation levels to maintain a favorable risk/reward ratio.
Configuration
Recommended timeframes: from 1–minute to daily, depending on the trading style.
Applicable markets: indices, forex, commodities, and cryptocurrencies.
Adjustable parameters:
Structure detection sensitivity.
Enable/disable volatility filters.
Show/hide control zones and previous ranges.
Purpose
Provide a clear reading of market structure and critical zones to help traders execute trades with greater consistency and avoid entries in low–probability areas.
Important Notes
This script is closed–source to protect its internal methodology, but it is based on an original combination of structural analysis and zone validation not available in free indicators.
It does not produce automatic buy or sell signals without context; it is intended to be integrated into a complete trading strategy.
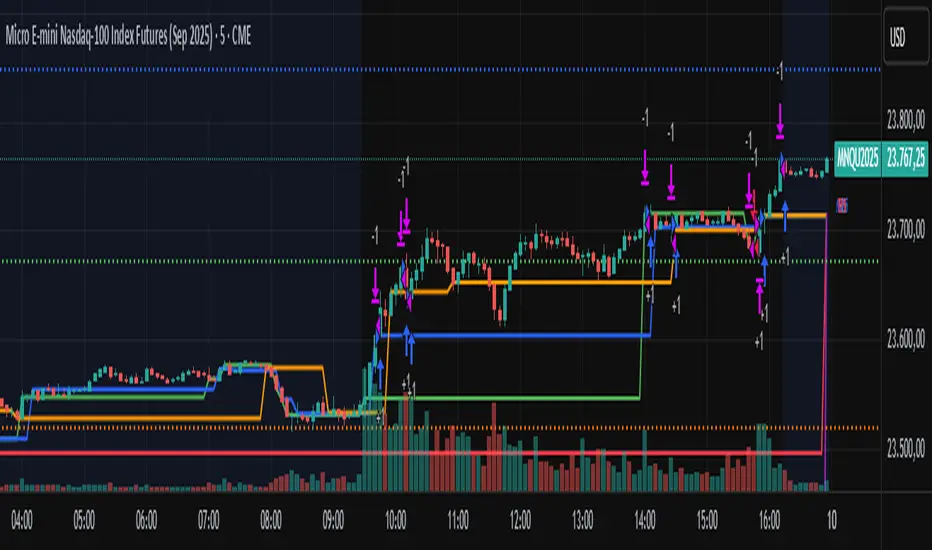
AIChannel StrategyAIChannel Strategy is a long-only breakout system that trades when price closes above a dynamic upper band derived from a Gaussian-style filter. The channel width adapts to volatility using True Range, so signals naturally thin out during quiet markets and expand during trends.
How it works (under the hood)
Builds a Gaussian-like smoothing filter by cascading EMAs (AIFilter) using a tunable number of poles.
Optionally applies lag reduction (simple look-ahead compensation) and a Fast Response mode (averages with a 1-pole version).
Computes upper/lower bands:
upper = filter + (filter of True Range) × multiplier
lower = filter − (filter of True Range) × multiplier
Entry: when close crosses above the upper band and the bar time is within the selected date range.
Exit: when close crosses back below the upper band.
Includes an equity-line plot and optional (commented) CAGR / Max-DD ratio calculation for quick performance diagnostics.
Inputs (quick guide)
Source (src) – default hlc3.
Poles (1–9) – more poles → smoother, slower filter. Default 4.
Period – base smoothing length (default 144).
Range Multiplier – scales band width (default 1.414).
Reduced Lag – simple lag compensation toggle.
Fast Response – blends in a 1-pole filter for snappier turns.
Start/End Date – trades only inside this window (default 2018-01-01 → 2069-01-01).
Default backtest settings (in code)
1D timeframe (recommended for BTCUSD).
100% of equity per trade (strategy.percent_of_equity = 100).
Commission 0.1%, 1 tick slippage.
No shorts, no pyramiding beyond one position.
Best use
Designed for trend-following on assets with powerful expansions (e.g., BTCUSD 1D).
If your market is choppy, consider increasing Period and/or Range Multiplier, or enabling Fast Response off (for fewer signals).
Notes & Limitations
Exits are only by crossunder of the upper band; there is no explicit stop-loss or take-profit in this base version.
The CAGR/Max-DD lines are computed but plots are commented out—uncomment if you want to visualize them.
As with all backtests, results depend on exchange feed, session, commissions, and slippage.
Disclaimers
This script is for research/education. It is not financial advice. Always validate on your own data and risk parameters before live use.
Keywords / Tags
Trend, Breakout, Gaussian, EMA, Volatility, True Range, BTCUSD, Long-Only, Daily, Systematic
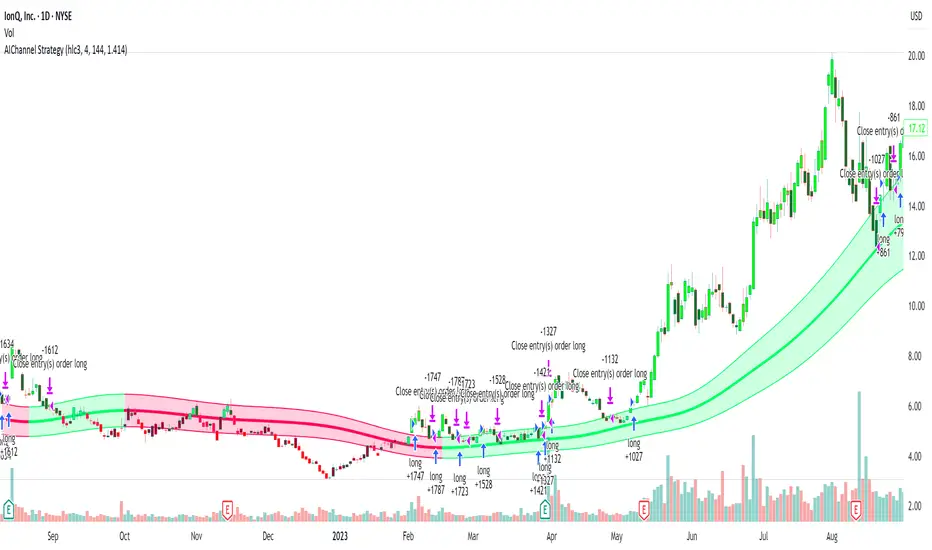
Auto Intelligence Selective Moving Average(AI/MA)# 🤖 Auto Intelligence Moving Average Strategy (AI/MA)
**AI/MA** is a state-adaptive moving average crossover strategy designed to **maximize returns from golden cross / death cross logic** by intelligently switching between different MA types and parameters based on market conditions.
---
## 🎯 Objective
To build a moving average crossover strategy that:
- **Adapts dynamically** to market regimes (trend vs range, rising vs falling)
- **Switches intelligently** between SMA, EMA, RMA, and HMA
- **Maximizes cumulative return** under realistic backtesting
---
## 🧪 materials amd methods
- **MA Types Considered**: SMA, EMA, RMA, HMA
- **Parameter Ranges**: Periods from 5 to 40
- **Market Conditions Classification**:
- Based on the slope of a central SMA(20) line
- And the relative position of price to the central line
- Resulting in 4 regimes: A (Bull), B (Pullback), C (Rebound), D (Bear)
- **Optimization Dataset**:
- **Bybit BTCUSDT.P**
- **1-hour candles**
- **2024 full-year**
- **Search Process**:
- **Random search**: 200 parameter combinations
- Evaluated by:
- `Cumulative PnL`
- `Sharpe Ratio`
- `Max Drawdown`
- `R² of linear regression on cumulative PnL`
- **Implementation**:
- Optimization performed in **Python (Pandas + Matplotlib + Optuna-like logic)**
- Final parameters ported to **Pine Script (v5)** for TradingView backtesting
---
## 📈 Performance Highlights (on optimization set)
| Timeframe | Return (%) | Notes |
|-----------|------------|----------------------------|
| 6H | +1731% | Strongest performance |
| 1D | +1691% | Excellent trend capture |
| 12H | +1438% | Balance of trend/range |
| 5min | +27.3% | Even survives scalping |
| 1min | +9.34% | Robust against noise |
- Leverage: 100x
- Position size: 100%
- Fees: 0.055%
- Margin calls: **none** 🎯
---
## 🛠 Technology Stack
- `Python` for data handling and optimization
- `Pine Script v5` for implementation and visualization
- Fully state-aware strategy, modular and extendable
---
## ✨ Final Words
This strategy is **not curve-fitted**, **not over-parameterized**, and has been validated across multiple timeframes. If you're a fan of dynamic, intelligent technical systems, feel free to use and expand it.
💡 The future of simple-yet-smart trading begins here.

Simple DCA Strategy----
### 📌 **Simple DCA Strategy with Backtest Date Filter**
This strategy implements a **Dollar-Cost Averaging (DCA)** approach for long positions, including:
* ✅ **Base Order Entry:** Starts a position with a fixed dollar amount when no position is open.
* 🔁 **Safety Orders:** Buys additional positions when the price drops by a defined percentage, increasing position size with each new entry using a multiplier.
* 🎯 **Take Profit Exit:** Closes all positions when the price reaches a profit target (in % above average entry).
* 🗓️ **Backtest Date Range:** Allows users to specify a custom start and optional end date to run the strategy only within that time window.
* 📊 **Plots:** Visualizes average entry, take profit level, and safety order trigger line.
#### ⚙️ Customizable Inputs:
* Base Order Size (\$)
* Price Deviation for Safety Orders (%)
* Maximum Safety Orders
* Order Size Multiplier
* Take Profit Target (%)
* Start and End Dates for Backtesting
This is a **long-only strategy** and is best used for backtesting performance of DCA-style accumulation under different market conditions.
----

RSI-Adaptive T3 + Squeeze Momentum Strategy✅ Strategy Guide: RSI-Adaptive T3 + Squeeze Momentum Strategy
📌 Overview
The RSI-Adaptive T3 + Squeeze Momentum Strategy is a dynamic trend-following strategy based on an RSI-responsive T3 moving average and Squeeze Momentum detection .
It adapts in real-time to market volatility to enhance entry precision and optimize risk.
⚠️ This strategy is provided for educational and research purposes only.
Past performance does not guarantee future results.
🎯 Strategy Objectives
The main objective of this strategy is to catch the early phase of a trend and generate consistent entry signals.
Designed to be intuitive and accessible for traders from beginner to advanced levels.
✨ Key Features
RSI-Responsive T3: T3 length dynamically adjusts according to RSI values for adaptive trend detection
Squeeze Momentum: Combines Bollinger Bands and Keltner Channels to identify trend buildup phases
Visual Triggers: Entry signals are generated from T3 crossovers and momentum strength after squeeze release
📊 Trading Rules
Long Entry:
When T3 crosses upward, momentum is positive, and the squeeze has just been released.
Short Entry:
When T3 crosses downward, momentum is negative, and the squeeze has just been released.
Exit (Reversal):
When the opposite condition to the entry is triggered, the position is reversed.
💰 Risk Management Parameters
Pair & Timeframe: BTC/USD (30-minute chart)
Capital (simulated): $30,00
Order size: `$100` per trade (realistic, low-risk sizing)
Commission: 0.02%
Slippage: 2 pips
Risk per Trade: 5%
Number of Trades (backtest period): 181
📊 Performance Overview
Symbol: BTC/USD
Timeframe: 30-minute chart
Date Range: January 1, 2024 – July 3, 2025
Win Rate: 47.8%
Profit Factor: 2.01
Net Profit: 173.16 (units not specified)
Max Drawdown: 5.77% or 24.91 (0.79%)
⚙️ Indicator Parameters
Indicator Name: RSI-Adaptive T3 + Squeeze Momentum
RSI Length: 14
T3 Min Length: 5
T3 Max Length: 50
T3 Volume Factor: 0.7
BB Length: 27 (Multiplier: 2.0)
KC Length: 20 (Multiplier: 1.5, TrueRange enabled)
🖼 Visual Support
T3 slope direction, squeeze status, and momentum bars are visually plotted on the chart,
providing high clarity for quick trend analysis and execution.
🔧 Strategy Improvements & Uniqueness
Inspired by the RSI Adaptive T3 by ChartPrime and Squeeze Momentum Indicator by LazyBear ,
this strategy fuses both into a hybrid trend-reversal and momentum breakout detection system .
Compared to traditional trend-following methods, it excels at capturing early trend signals with greater sensitivity .
✅ Summary
The RSI-Adaptive T3 + Squeeze Momentum Strategy combines momentum detection with volatility-responsive risk management.
With a strong balance between visual clarity and practicality, it serves as a powerful tool for traders seeking high repeatability.
⚠️ This strategy is based on historical data and does not guarantee future profits.
Always use appropriate risk management when applying it.

Bollinger Band Breakout With Volatility StoplossDetailed Explanation of the Bollinger Band Breakout With Volatility Stoploss System
Introduction
The "Bollinger Band Breakout With Volatility Stoploss" system is a trading strategy designed to exploit price volatility in financial markets using the Bollinger Bands indicator, a widely recognized tool developed by John Bollinger. This system adapts the traditional Bollinger Bands framework into a Volatility Breakout strategy, focusing on capturing significant price movements by leveraging customized parameters and precise trading rules. The system operates exclusively on long positions, employs a daily timeframe, and incorporates dynamic risk management techniques to optimize trade outcomes while preserving capital.
System Parameters
The system modifies the standard Bollinger Bands configuration to suit its breakout methodology:
Standard Deviation (SD): Set to 1x, determining the width of the bands relative to the central moving average. This tighter setting enhances sensitivity to price movements, making the system responsive to smaller volatility shifts compared to the conventional 2x SD.
Period: A 30-day (1-month) lookback period is used to calculate the bands, providing a balance between capturing medium-term price trends and avoiding excessive noise from shorter timeframes.
Moving Average Type: The system uses an Exponential Moving Average (EMA) instead of the Simple Moving Average (SMA). The EMA places greater weight on recent price data, making it more responsive to current market conditions and better suited for detecting breakout opportunities in dynamic markets.
Core Concept
The Bollinger Band Breakout system is built on the principle of Volatility Breakout, which seeks to capitalize on significant price movements when the price breaks out of a defined volatility range. The Bollinger Bands, consisting of an EMA as the central line and two bands (Upper and Lower) calculated as the EMA plus or minus 1x SD, define this range. The system operates on a Daily Chart (D) timeframe, making it suitable for traders who prefer analyzing and executing trades based on daily price action. By focusing solely on Long Positions (buying low and selling high), the system avoids short-selling, aligning with strategies that capitalize on upward price momentum.
The core idea is to use the 1x SD multiplier over a 30-day period to establish a dynamic price range that reflects recent market volatility. Breakouts above the Upper Band signal potential buying opportunities, while penetrations below the Lower Band indicate exits, ensuring trades are aligned with significant price movements.
Trading Signals
The system generates clear entry and exit signals based on price interactions with the Bollinger Bands:
Buy Signal: A buy signal is triggered when the closing price of a daily candle exceeds the Upper Bollinger Band (EMA + 1x SD over 30 days). The trade is entered at the opening price of the subsequent candle, ensuring the breakout is confirmed by the close of the prior day. This approach minimizes false signals by waiting for a definitive breach of the volatility threshold.
Sell Signal: A sell signal occurs when the closing price falls below the Lower Bollinger Band (EMA - 1x SD over 30 days). The position is exited at the opening price of the next candle, allowing the trader to lock in profits or limit losses when the price reverses or loses momentum.
Risk Management
Risk management is a cornerstone of the system, ensuring capital preservation and disciplined trade execution:
Initial Stoploss: The stoploss is set at the Lower Bollinger Band of the candle that triggered the buy signal. This level acts as a volatility-based threshold, below which the trade is deemed invalid, prompting an immediate exit to protect capital. Traders have two options for implementing the stoploss:
Pending Stoploss: A predefined stoploss order placed at the Lower Band level.
Conditional Exit: Using the sell signal condition (price closing below the Lower Band) as the exit trigger, effectively aligning the stoploss with the system’s exit rules.
Position Sizing: The system employs Fixed Fractional Position Sizing with a risk per trade capped at 3% of the account balance. The position size is calculated based on the distance between the entry price and the Initial Stoploss, incorporating Volatility Position Sizing. This method adjusts the trade size according to the market’s volatility, ensuring that risk remains consistent across varying market conditions. Two options are available for managing capital:
Gear Up Option: Profits from previous trades are reinvested into the account’s capital, increasing the base for calculating the next position size. This compounding approach can amplify returns but also increases risk exposure.
Fixed Equity Option: Profits from previous trades are withdrawn, and only the remaining capital is used for calculating the next position size. This conservative approach prioritizes capital preservation by not compounding gains.
Trailing Stop: The system uses the Lower Bollinger Band as a dynamic trailing stop, which adjusts with price movements and volatility. This ensures that profits are protected during favorable trends while allowing the trade to remain open as long as the price stays above the Lower Band. The trailing stop aligns with the sell signal condition, maintaining consistency in the system’s exit strategy.
Supporting Indicators
The system incorporates two additional indicators to enhance market analysis and decision-making:
Bollinger Band Width (BBW): BBW measures the distance between the Upper and Lower Bollinger Bands relative to the EMA, serving as a proxy for market volatility.
A high BBW indicates significant price volatility, often associated with strong trends or large price movements, which may confirm the strength of a breakout.
A low BBW suggests low volatility, potentially signaling a period of consolidation or "squeeze" that could precede a breakout. This can help traders anticipate potential trade setups.
The BBW calculation uses the EMA to maintain consistency with the system’s core parameters.
Bollinger Band Ratio (BBR) or %B: BBR measures the price’s position relative to the Bollinger Bands, providing insight into market conditions.
BBR > 1: The price is above the Upper Band, indicating potential overbought conditions or strong upward momentum, which aligns with the system’s buy signal.
BBR < 0: The price is below the Lower Band, suggesting oversold conditions or downward momentum, corresponding to the sell signal or stoploss trigger.
BBR between 0 and 1: The price is within the bands, indicating a neutral state where no immediate action is required.
Like BBW, BBR is calculated using the EMA for consistency.
Backtesting and Implementation
To evaluate the system’s performance, traders can utilize the Backtest Parameter function, which allows for testing the strategy across user-defined time periods. This feature enables traders to assess the system’s effectiveness under various market conditions, optimize parameters, and refine their approach based on historical data.
Conclusion
The Bollinger Band Breakout With Volatility Stoploss system is a robust, volatility-driven trading strategy that combines the predictive power of Bollinger Bands with disciplined risk management. By focusing on long positions, using a 1x SD multiplier, and incorporating EMA-based calculations, the system is designed to capture significant price breakouts while minimizing risk through dynamic stoplosses and volatility-adjusted position sizing. The inclusion of BBW and BBR indicators provides additional context for assessing market conditions, enhancing the trader’s ability to make informed decisions. With its structured approach and backtesting capabilities, this system is well-suited for traders seeking a systematic, data-driven method to trade in volatile markets.

SOXL Trend Surge v3.0.2 – Profit-Only RunnerSOXL Trend Surge v3.0.2 – Profit-Only Runner
This is a trend-following strategy built for leveraged ETFs like SOXL, designed to ride high-momentum waves with minimal interference. Unlike most short-term scalping scripts, this model allows trades to develop over multiple days to even several months, capitalizing on the full power of extended directional moves — all without using a stop-loss.
🔍 How It Works
Entry Logic:
Price is above the 200 EMA (long-term trend confirmation)
Supertrend is bullish (momentum confirmation)
ATR is rising (volatility expansion)
Volume is above its 20-bar average (liquidity filter)
Price is outside a small buffer zone from the 200 EMA (to avoid whipsaws)
Trades are restricted to market hours only (9 AM to 2 PM EST)
Cooldown of 15 bars after each exit to prevent overtrading
Exit Strategy:
Takes partial profit at +2× ATR if held for at least 2 bars
Rides the remaining position with a trailing stop at 1.5× ATR
No hard stop-loss — giving space for volatile pullbacks
⚙️ Strategy Settings
Initial Capital: $500
Risk per Trade: 100% of equity (fully allocated per entry)
Commission: 0.1%
Slippage: 1 tick
Recalculate after order is filled
Fill orders on bar close
Timeframe Optimized For: 45-minute chart
These parameters simulate an aggressive, high-volatility trading model meant for forward-testing compounding potential under realistic trading costs.
✅ What Makes This Unique
No stop-loss = fewer premature exits
Partial profit-taking helps lock in early wins
Trailing logic gives room to ride large multi-week moves
Uses strict filters (volume, ATR, EMA bias) to enter only during high-probability windows
Ideal for leveraged ETF swing or position traders looking to hold longer than the typical intraday or 2–3 day strategies
⚠️ Important Note
This is a high-risk, high-reward strategy meant for educational and testing purposes. Without a stop-loss, trades can experience deep drawdowns that may take weeks or even months to recover. Always test thoroughly and adjust position sizing to suit your risk tolerance. Past results do not guarantee future returns. Backtest range: May 8, 2020 – May 23, 2025
