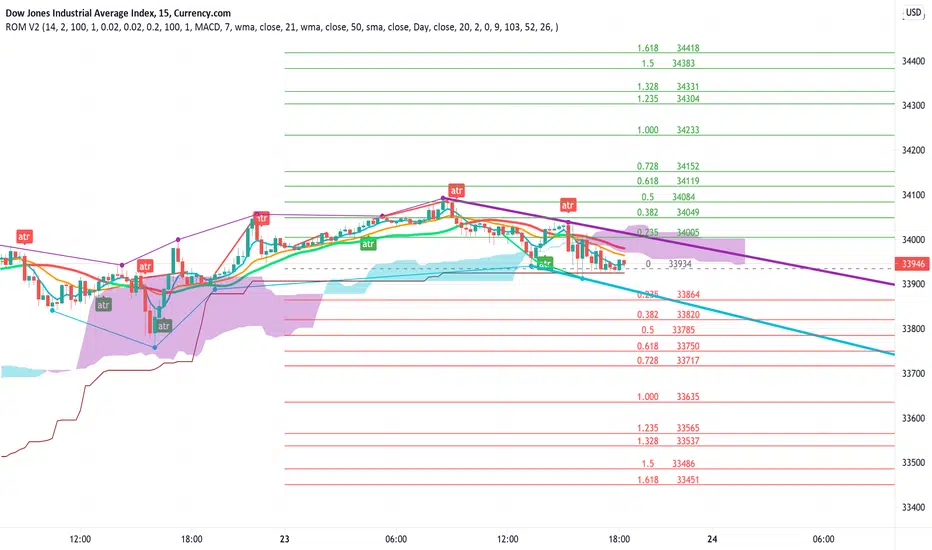
Rain On Me V2As promised, here is Rain On Me Indicator V2! As the name suggests, this indicator will rain money down on you. More seriously, Rain On Me V2 is a complete overhaul of the V1.
For those who are new to this indicator or for those who already knew it, here is a complete description of this indicator.
This indicator contains:
-Fully configurable multi-timeframe buy or sell signals based on ATR with the possibility to set the period, deviation, period of the ATR and choose the source or type of signals: RMA, SMA , EMA, WMA, VWMA, SMMA, KMA, TMA, HullMA, DEMA, TEMA, CTI.
-Colouring of candles on ATR. (green and red).
-Buy or sell signals with VPT (based on st_dev) with the possibility of adjusting the period and the multiplier. (Only works in markets with available volume information flows).
-Trend Parabolic SAR (Up / Down) fully configurable.
-Divergences with the possibility of choosing among the following signals: MACD, OBV, RSI, CCI.
-3 Moving averages with the possibility of choosing their values and their type for each one: SMA, EMA, RMA, WMA, VWMA. (default: WMA 1 = 7, WMA 2 = 21 and SMA 3 = 50).
-Fibonacci on 10 levels with level 0 in the middle. This Fibonacci helps a lot as it can make it easy for you to find an entry / exit point, a trend and even where to place your Take Profit and Stop Loss.
-Fully customizable Bollinger Band.
-Fully customizable Ichimoku cloud.
-Multi-timeframe Trendline that tells you the true trend of the current market based on volume. (Only works in markets with available volume information flows). It can change from green (for an uptrend) or red (downtrend) color.
To place an alert, always choose the "Once per bar" option.
You can place alerts on the following options:
-GO Buy / GO Sell (ATR).
-VPT Buy / Sell.
-PSAR (Up / Down).
-Divergences (Bullish / Bearish).
-Crossing of moving averages 1 and 2.
-Fibonacci key levels (0.382, 0.5 and 0.618) for Crossunder and Crossover in an uptrend or downtrend.
You can choose to show or hide from the chart all the options mentioned above.
Never follow buy or sell signals stupidly. Always watch that all the indicators are going in the same direction, that you are not in a range zone, that there is no resistance etc ...
Always wait for confirmation after a buy or sell alert before entering a position to make sure the label stays on the chart and doesn't disappear.
Please feel free to give your ideas, suggestions or bug reports in the comments area to help me improve it.
A BIG THANKS TO QUANTNOMAD FOR GIVING ME ITS AUTHORIZATION TO USE, MODIFY AND REPUBLIC ITS "Ultimate Pivot Points Alerts" script indicator:
Good trade everyone! And remember, money management is the most important!
Cari skrip untuk "psar"
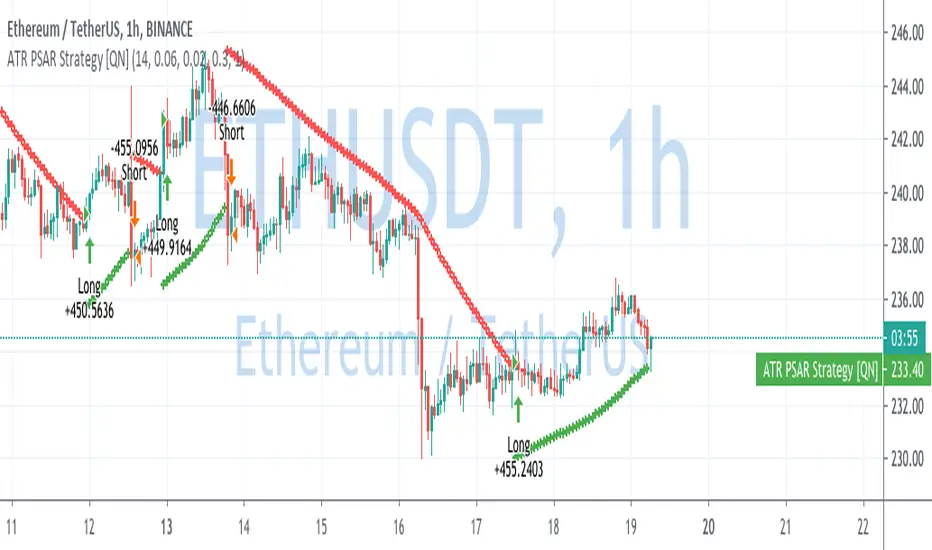
ATR Parabolic SAR Strategy [QuantNomad]I created a version of Parabolic SAR when I accelerate it not based on the difference from the extreme point but based on current ATR. So the idea is that for a more volatile market it should move faster.
Performance is calculated based on 25% equity invested and 0.1% commission.
What do you think about it? Does it make sense to do something like that?
Do you have in mind other ways I can accelerate it when the market starts to be more volatile?
Disclaimer
Please remember that past performance may not be indicative of future results.
Due to various factors, including changing market conditions, the strategy may no longer perform as good as in historical backtesting.
This post and the script don’t provide any financial advice.
Rain On Me IndicatorFinally, we made it :D
Rain On Me Indicator, As the name suggests this indicator will make money rain on you. More seriously, this indicator contains :
This indicator contains:
-Bullish and bearish RSI divergences showing on chart with alerts.
-Parabolic SAR with Labels on chart with buying or selling alerts.
-3 Moving Average (MA 1 : 7, MA 2 : 21 MA 3 HIDDEN : 50 (Cross alerts for Pullback)
-Customizable Bollinger band
-Fibonacci on 10 levels with the level 0 to the middle. This Fibonacci help a lot since it can let you find easily entry/exit point, trend and even where to place your Take Profit and Stop Loss. It have alerts for most important levels (0.382, 0.§, 0.618) for Crossunder and Crossover in Bullish or Bearish trend.
-Fully Customizable Ichimoku Cloud.
-Trend Buy/Sell Labels on chart with buying or selling signal alerts.
-Trend color visible on candles.
If an alert trigger of Buy/Sell Signal with the same alert based on PSAR, so you can be confident to enter in position. Alway checking fibs level that is the key thing with this indicator. the script has been set to have the best possible results on as many market as possible. But.best result for zfter backtesting is on
Forex : EUR/USD, USDJPY, USDCAD.
Indice : S&P500, NASDAQ, DOWJONES
Commodities : OIL, WTI
Everything work on following timeframe :
15MN, 1H, 4H, DAILY, WEEKLY.
So that you can avoid having to set it again, whether it be in minutes, hours, days, months.
So you can easily trade in the mode that suits you best. It works well on everything from indices to forex to commodities etc. I thank all those who allowed me to carry out this project. IF you feelt free to give your ideas, suggestions, for improve it by sending me messages.
This is really a first version sp it may contain bugs / errors that will be fixed over time.
A BIG THANK YOU TO QUANTNOMAD WHO GIVE ME HIS PERMISSION TO USE, MODIFY AND REPUBLISH HIS "Ultimate Pivot Points Alerts" Script Indicator :
Good trade to all !

Candle Type w/2Up + 2Dn v2.0This script builds on Candle Type w/2Up + 2Dn by incorporating signals for inside + up, outside + up, + rev strat set-ups. All of these can be turned off if they compete w/ other indicators or just clutter up the chart.
Briefly, the script works based on #thestrat developed by Rob Smith and the 1-2-3 bar script coded by @Crinklebine. Candle Type w/2Up + 2Dn is a "fork" of @Crinklebine's excellent indicator. I find the visualization of U-D-I-O (up/dn/inside/outside candles) easier to scan through 100's of charts than 1-2-3's. This is just personal preference, but they work based on the exact same principles. Performance is enhanced with a trend filter like @boardriderb's "TC" script or similar timeframe continuity filters based on the #thestrat developed by Rob Smith. I also prefer an ATR-based trailing stop; Rob recommends pSAR for trailing stops.
Together these indicators form a power system, but users are still responsible for their own trade management, entries & exits, risk profiles, stop loss, etc.

TKP Short/Long IndicatorThis script uses T3 Moving averages and a modified Parabolic Sar Calculation to help Identify trend reversals, but can also keep you in the predominant direction of strong trending price action.

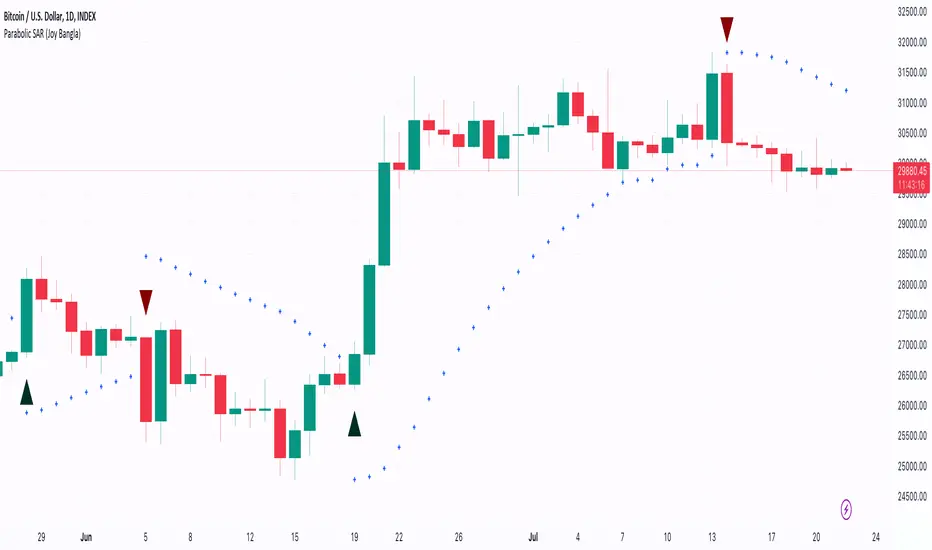
Parabolic SAR Alerts (on close) [QuantNomad]This is study with alerts for my previously published strategy:
Use "Once Per Bar Close" alerts.

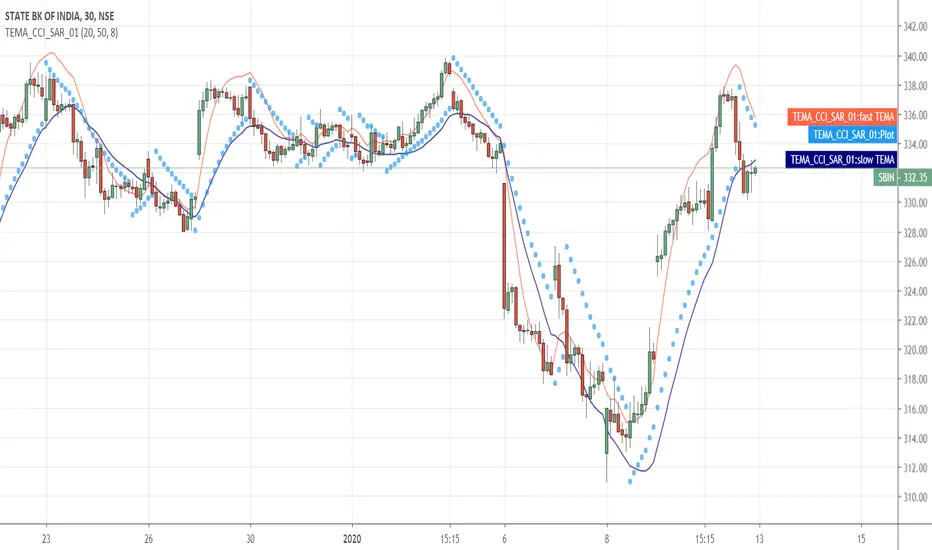
TEMA_CCI_SAR_01This strategy is using TEMA and PSAR for buying selling. Educational.
Disclaimer: if you this tool for trading which may cause losses and profits which myself or Tradingview and its partners wont responsible for it.
Market Adaptive Stop-LossI realized that the zone changes in the stoploss remained slow, so I couldn't make enough use of the characteristics of technical indicators when opening positions.
This pushed me to keep stop-loss under the influence of a dependent variable.
This script helped me a lot (everget) :
I've redesigned the stop-loss to be affected by intersections.
Therefore, this script is also suitable for adaptive moving averages, fractional periods.
Script features:
1.You can select calculation methods created by using various technical analysis methods from the scripts' settings:
-Moving Average Convergence Divergence ( Macd )
-Stochastic Oscillator ( Stoch )
-Stochastic Relative Strength Index (StochRSI)
-Stochastic Money Flow Index (StochMFI ) (More info : )
-Know Sure Thing ( KST )
-OBV ( On Balance Volume )
-SMA ( Simple Moving Average )
-EMA ( Exponential Moving Average )
-FISHERTRANSFORM ( Fisher Transform )
-AWESOMEOSCILLATOR( Awesome Oscillator )
-PSAR ( Parabolic Stop and Reverse - Parabolic SAR )
-HULLMA( Hull Moving Average )
-VWMA ( Volume Weighted Moving Average )
-RMA (Moving Average using in Relative Strength Index calculations.)
-COG (Center of Gravity )
-ACC-DIST ( Accumulation / Distribution Index )
2 - The region is determined according to the above calculation methods and if it is larger or smaller than the previous stop loss level.
And if the price in the negative zone is lower than the stoploss, it is the exact signal and is shown with more highlighted colors.
And, in the positive zone, where the price is greater than the stoploss, the trade zones are certain.
Shown with more highlighted colors.
If the zones are correct but stop-loss is not suitable for opening positions:
In other words, if the stop-loss is above/under the highest-lowest levels in the positive zone or if the stop loss is located in the lower zone in the negative zone, these zones are shown to be darker and dimmed so that they do not cause false movements.
*** SUMMARY : As a result, you can use this script with support and resistances,and trend lines to get good results.
I hope it helps in your analyzes. Best regards.

Relative Candle Volatility IndexI am not certain if something similar is already available out there. However, here's my own implementation of my simple idea of using the length of the candle-body, or wicks (high-low), to derive a Relative Volatility Index / Oscillator.
In summary: When the R.CVI is significantly positive, it indicates a sudden increase in volatility; whereas, when the R.CVI drops significantly negative, it indicates a sudden decrease in volatility -- in relative to the (just prior) market trend.
If you do wish to copy, modify, and publish an alternate version base on this script, please do not plagiarize and kindly reference/link back to this original script. =D
~ * ~ * ~ * ~ * ~ * ~ * ~ * ~ * ~ * ~ * ~ * ~ * ~ * ~ * ~ * ~ * ~ * ~ * ~ * ~ * ~
Note:
In no way is this intended as a financial/investment/trading advice. You are responsible for your own investment decisions and trades.
Please exercise your own judgement for your own trades base on your own risk-aversion level and goals as an investor or a trader. The use of OTHER indicators and analysis in conjunction (tailored to your own style of investing/trading) will help improve confidence of your analysis, for you to determine your own trade decisions.
~ * ~ * ~ * ~ * ~ * ~ * ~ * ~ * ~ * ~ * ~ * ~ * ~ * ~ * ~ * ~ * ~ * ~ * ~ * ~ * ~
Please check out my other indicators sets and series, e.g.
LIVIDITIUM (dynamic levels),
AEONDRIFT (multi-levels standard deviation bands),
FUSIONGAPS (MA based oscillators),
MAJESTIC (Momentum/Acceleration/Jerk Oscillators),
PRISM (pSAR based oscillator, with RSI/StochRSI as well as Momentum/Acceleration/Jerk indicators),
PDF (parabolic SAR /w HighLow Trends Indicator/Bar-color-marking + Dynamic Fib Retrace and Extension Level)
and more to come.
Constructive feedback and suggestions are welcome.
~ JuniAiko
(=^~^=)v~


APEX - Parabolic SARSorry to all my fans I have been overwhelmed with work and I need a couple of weeks off ... but now I have vacation time and I should be fit in a bit.
This is a for meant for the Apex Trader I very much enjoy and is long overdue.
Looks like the normal implementation of PSAR in TA-Lib is using no start compared to the Standard that TV delivers thus to make the user more comfortable this tiny change :)
Wish you all good luck and a lot of love!

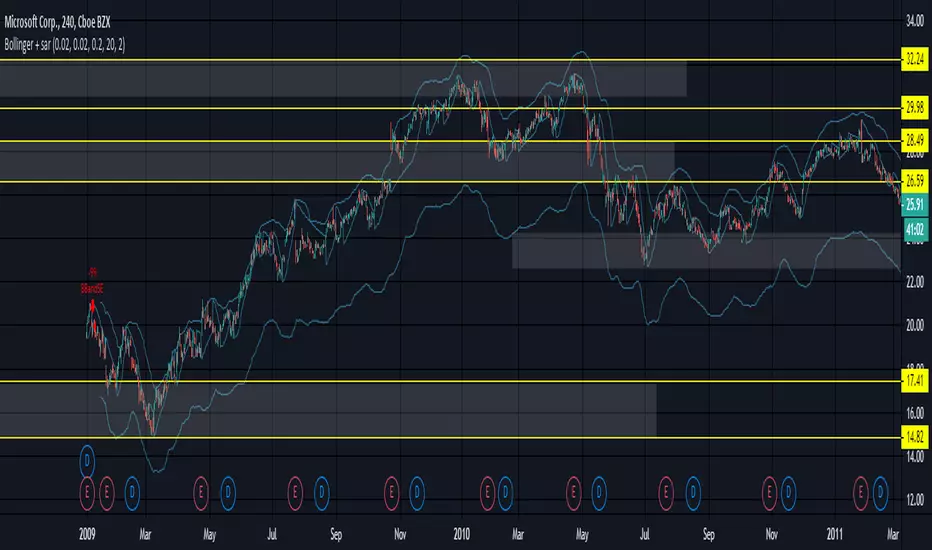
Bollinger + sarProblem with change in bollingerbands when adding psar short condition - and i dont know why.
Anyone - any ideas?
SARSI Reversal StrategySimple reversal strategy based on 'Parabolic Stop and Reverse' and 'Relative Stength Index' indicators.

LINEdicator - Trendanalysis toolThis indicator creates an trend channel based on an EMA/SMA combo and a Parabolc SAR indicator.
Watch for the peaks and the size of the red/green channel for possible trend change.
Can also be used as an Entry/Exit/Stop-Loss setting tool.

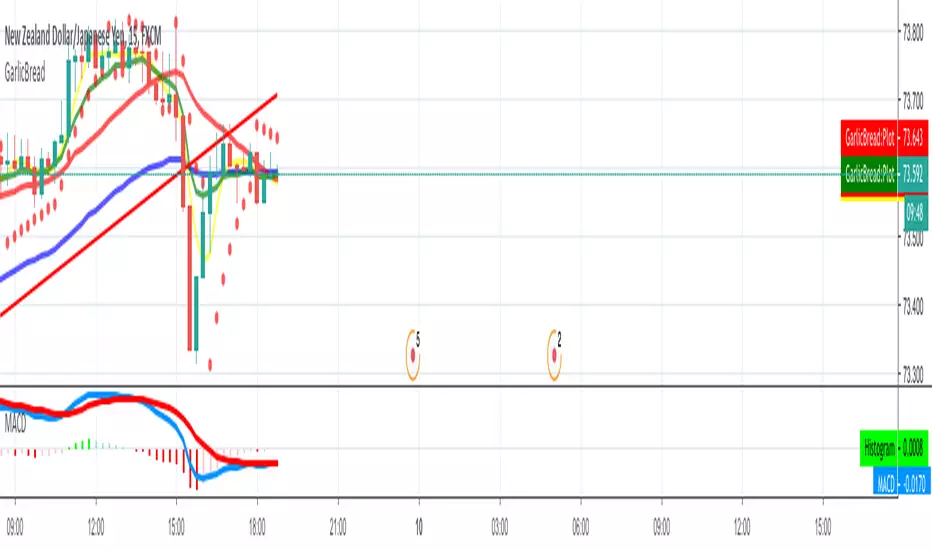
GarlicBread 2019 Without the Bollinger Bands 4 Moving Average Indicators / Without the Bollinger Bands / with 0.06 PSAR
Kozlod - Parabolic SAR Strategy AlertsAlerts for standard Parabolic SAR Strategy.
It works best with "Once per bar" option.

Parabolic SAR & Arnoud Legoux Moving Avarage StrategyIn the first short signal example, after price closes below the ALMA and the parabolic SAR plots above the price high, sell signal is opened with the stops trailed to the PSAR values until the trade is stopped out.
Similarly, you can see a long position where price cuts above the ALMA and the Parabolic SAR plots below the price low. Using these values as the trailing stop levels, we can stay long into the trade until the trade is stopped out.
Find out optimal values by trying. May not produce accurate results in horizontal markets. Thank you.

makemoneyThis system design for you in order to make you money :) I hope...
1. the donochian channel is based on color of high and low price (easy to see where the bars exist)
2. resitance and support are drawn by bolinger system (black and red dots)
3. buy and sell are based on volume model (B and S ) with alerts
4. when PSAR and the buy or sell are in agrreement this are called strong buy or sell points shown in green and red trinangle
5. you can use stop loss or take profit based on system in volume model
using the system very easy and I hope you make noney on it either shorting or longing
I normaly use 1 hour and 30 min charts . you can try another time frames if it work to you
the code is open so you can modify , chane or do what ever you want with it


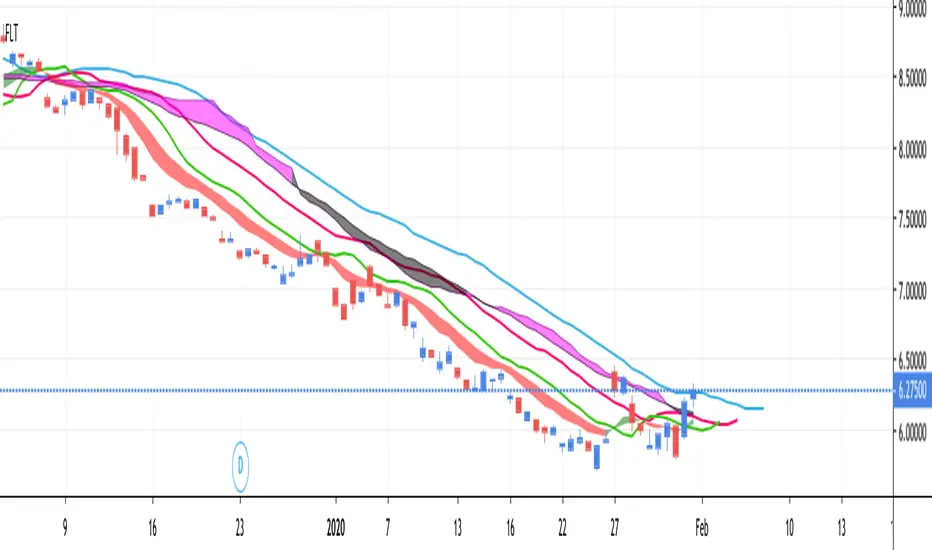
FLT - Fully Loaded TacoThis is a very full indicator.
NOTICE: By default, ALL indicators are turned off in the settings, except for the Bollinger Band, in order to facilitate faster load times.
Features can easily be turned on/off in the settings. You can have as many or as few as you want.
FEATURE LIST:
3 SMAs (Fast, Medium, Slow)
3 EMAs (Fast, Medium, Slow)
Support & Resistance Lines (Lime Color)
Parabolic Support & Resistance (Red dots above, Blue dots below)
Keltner Channel (purple channel lines)
Bollinger Band (Blue Cloud; Center & Borders hidden by default)
TTM Squeeze (Purple Background Color on Chart)
VWAP (Vibrant Blue Glowing Line, Intraday Only)
Fibonacci Retracement (Multicolor, Intraday Only)
Ichimoku Cloud (Standard Colors)
Combo Basic IndicatorsThe indicator consists of multiple time frame SMA and PSAR, the very basic indicator but could be profitable.
SMA can be used as dynamic Support-Resistant levels, and value of higher time frame are considered more significant (major level).
For example, Bitcoin currently has weekly support at 6568$, and regarding to SMA of lower time frame (Day, 4H,..) that are near then concluded as sideways condition.
However, trading opportunities still can be found for short term and tight range (scalping).

