Dual Strategy Selector V2 - CryptogyaniOverview:
This script provides traders with a dual-strategy system that they can toggle between using a simple dropdown menu in the input settings. It is designed to cater to different trading styles and needs, offering both simplicity and advanced filtering techniques. The strategies are built around moving average crossovers, enhanced by configurable risk management tools like take profit levels, trailing stops, and ATR-based stop-loss.
Key Features:
Two Strategies in One Script:
Strategy 1: A classic moving average crossover strategy for identifying entry signals based on trend reversals. Includes user-defined take profit and trailing stop-loss options for profit locking.
Strategy 2: An advanced trend-following system that incorporates:
A higher timeframe trend filter to confirm entry signals.
ATR-based stop-loss for dynamic risk management.
Configurable partial take profit to secure gains while letting the trade run.
Highly Customizable:
All key parameters such as SMA lengths, take profit levels, ATR multiplier, and timeframe for the trend filter are adjustable via the input settings.
Dynamic Toggle:
Traders can switch between Strategy 1 and Strategy 2 with a single dropdown, allowing them to adapt the strategy to market conditions.
How It Works:
Strategy 1:
Entry Logic: A long trade is triggered when the fast SMA crosses above the slow SMA.
Exit Logic: The trade exits at either a user-defined take profit level (percentage or pips) or via an optional trailing stop that dynamically adjusts based on price movement.
Strategy 2:
Entry Logic: Builds on the SMA crossover logic but adds a higher timeframe trend filter to align trades with the broader market direction.
Risk Management:
ATR-Based Stop-Loss: Protects against adverse moves with a volatility-adjusted stop-loss.
Partial Take Profit: Allows traders to secure a percentage of gains while keeping some exposure for extended trends.
How to Use:
Select Your Strategy:
Use the dropdown in the input settings to choose Strategy 1 or Strategy 2.
Configure Parameters:
Adjust SMA lengths, take profit, and risk management settings to align with your trading style.
For Strategy 2, specify the higher timeframe for trend filtering.
Deploy and Monitor:
Apply the script to your preferred asset and timeframe.
Use the backtest results to fine-tune settings for optimal performance.
Why Choose This Script?:
This script stands out due to its dual-strategy flexibility and enhanced features:
For beginners: Strategy 1 provides a simple yet effective trend-following system with minimal setup.
For advanced traders: Strategy 2 includes powerful tools like trend filters and ATR-based stop-loss, making it ideal for challenging market conditions.
By combining simplicity with advanced features, this script offers something for everyone while maintaining full transparency and user customization.
Default Settings:
Strategy 1:
Fast SMA: 21, Slow SMA: 49
Take Profit: 7% or 50 pips
Trailing Stop: Optional (disabled by default)
Strategy 2:
Fast SMA: 20, Slow SMA: 50
ATR Multiplier: 1.5
Partial Take Profit: 50%
Higher Timeframe: 1 Day (1D)
Cari skrip untuk "profit"

Roman's Ranges(GOLD FUTURES)This indicator provides the user with Gold Future's previous day’s range and how long it took for the price to reach its first extreme for the day. This information is used to predict the most probable daily direction trend and estimate how long you should expect to hold your winning trade. The distance and time are based on the market open candle (6:30 am). It measures from the retracement wick of the candle to the last 5m close of the day’s first extreme low or high point. It also includes that distance in pts.
Previous market data does not guarantee future results, however, you can leverage the knowledge of the previous day’s ranges to set reasonable take profit levels and when your target is not met automatically, you know how long it took on the previous day to reach the day’s first low/high. If you are nearing that amount of time and your trade is not as profitable as expected, it is easier to get out with less profits using this estimated time rather than hoping the market closes in your favor.
Markets go through cycles and it can be difficult to trade them all if you have a fault expectation how how far the price is expected to move. Price tends to deviate slowly from the average ranges slightly day after day, but you can expect an average range to prevail throughout the week +/- 3 points. It can be very easy to be stuck on 5-point take-profit levels that you don’t pay attention to the average range being twice or three times that distance. The same can be said for the opposite scenario with having higher profit expectations than reasonably possible.
This indicator and my statements are not financial advice. This is meant for educational purposes only.

Trend Trader-RemasteredThe script was originally coded in 2018 with Pine Script version 3, and it was in invite only status. It has been updated and optimised for Pine Script v5 and made completely open source.
Overview
The Trend Trader-Remastered is a refined and highly sophisticated implementation of the Parabolic SAR designed to create strategic buy and sell entry signals, alongside precision take profit and re-entry signals based on marked Bill Williams (BW) fractals. Built with a deep emphasis on clarity and accuracy, this indicator ensures that only relevant and meaningful signals are generated, eliminating any unnecessary entries or exits.
Key Features
1) Parabolic SAR-Based Entry Signals:
This indicator leverages an advanced implementation of the Parabolic SAR to create clear buy and sell position entry signals.
The Parabolic SAR detects potential trend shifts, helping traders make timely entries in trending markets.
These entries are strategically aligned to maximise trend-following opportunities and minimise whipsaw trades, providing an effective approach for trend traders.
2) Take Profit and Re-Entry Signals with BW Fractals:
The indicator goes beyond simple entry and exit signals by integrating BW Fractal-based take profit and re-entry signals.
Relevant Signal Generation: The indicator maintains strict criteria for signal relevance, ensuring that a re-entry signal is only generated if there has been a preceding take profit signal in the respective position. This prevents any misleading or premature re-entry signals.
Progressive Take Profit Signals: The script generates multiple take profit signals sequentially in alignment with prior take profit levels. For instance, in a buy position initiated at a price of 100, the first take profit might occur at 110. Any subsequent take profit signals will then occur at prices greater than 110, ensuring they are "in favour" of the original position's trajectory and previous take profits.
3) Consistent Trend-Following Structure:
This design allows the Trend Trader-Remastered to continue signaling take profit opportunities as the trend advances. The indicator only generates take profit signals in alignment with previous ones, supporting a systematic and profit-maximising strategy.
This structure helps traders maintain positions effectively, securing incremental profits as the trend progresses.
4) Customisability and Usability:
Adjustable Parameters: Users can configure key settings, including sensitivity to the Parabolic SAR and fractal identification. This allows flexibility to fine-tune the indicator according to different market conditions or trading styles.
User-Friendly Alerts: The indicator provides clear visual signals on the chart, along with optional alerts to notify traders of new buy, sell, take profit, or re-entry opportunities in real-time.

Supertrend StrategyThe Supertrend Strategy was created based on the Supertrend and Relative Strength Index (RSI) indicators, widely respected tools in technical analysis. This strategy combines these two indicators to capture market trends with precision and reliability, looking for optimizing exit levels at oversold or overbought price levels.
The Supertrend indicator identifies trend direction based on price and volatility by using the Average True Range (ATR). The ATR measures market volatility by calculating the average range between an asset’s high and low prices over a set period. It provides insight into price fluctuations, with higher ATR values indicating increased volatility and lower values suggesting stability. The Supertrend Indicator plots a line above or below the price, signaling potential buy or sell opportunities: when the price closes above the Supertrend line, an uptrend is indicated, while a close below the line suggests a downtrend. This line shifts as price movements and volatility levels change, acting as both a trailing stop loss and trend confirmation.
To enhance the Supertrend strategy, the Relative Strength Index (RSI) has been added as an exit criterion. As a momentum oscillator, the RSI indicates overbought (usually above 70) or oversold (usually below 30) conditions. This integration allows trades to close when the asset is overbought or oversold, capturing gains before a possible reversal, even if the percentage take profit level has not been reached. This mechanism aims to prevent losses due to market reversals before the Supertrend signal changes.
### Key Features
1. **Entry criteria**:
- The strategy uses the Supertrend indicator calculated by adding or subtracting a multiple of the ATR from the closing price, depending on the trend direction.
- When the price crosses above the Supertrend line, the strategy signals a long (buy) entry. Conversely, when the price crosses below, it signals a short (sell) entry.
- The strategy performs a reversal if there is an open position and a change in the direction of the supertrend occurs
2. **Exit criteria**:
- Take profit of 30% (default) on the average position price.
- Oversold (≤ 5) or overbought (≥ 95) RSI
- Reversal when there is a change in direction of the Supertrend
3. **No Repainting**:
- This strategy is not subject to repainting, as long as the timeframe configured on your chart is the same as the supertrend timeframe .
4. **Position Sizing by Equity and risk management**:
- This strategy has a default configuration to operate with 35% of the equity. At the time of opening the position, the supertrend line is typically positioned at about 12 to 16% of the entry price. This way, the strategy is putting at risk about 16% of 35% of equity, that is, around 5.6% of equity for each trade. The percentage of equity can be adjusted by the user according to their risk management.
5. **Backtest results**:
- This strategy was subjected to deep backtesting and operations in replay mode, including transaction fees of 0.12%, and slippage of 5 ticks.
- The past results in deep backtest and replay mode were compatible and profitable (Variable results depending on the take profit used, supertrend and RSI parameters). However, it should be noted that few operations were evaluated, since the currency in question has been created for a short time and the frequency of operations is relatively small.
- Past results are no guarantee of future results. The strategy's backtest results may even be due to overfitting with past data.
Default Settings
Chart timeframe: 2h
Supertrend Factor: 3.42
ATR period: 14
Supertrend timeframe: 2 h
RSI timeframe: 15 min
RSI Lenght: 5 min
RSI Upper limit: 95
RSI Lower Limit: 5
Take Profit: 30%
BYBIT:1000000MOGUSDT.P

Statistical ArbitrageThe Statistical Arbitrage Strategy, also known as pairs trading, is a quantitative trading method that capitalizes on price discrepancies between two correlated assets. The strategy assumes that over time, the prices of these two assets will revert to their historical relationship. The core idea is to take advantage of mean reversion, a principle suggesting that asset prices will revert to their long-term average after deviating significantly.
Strategy Mechanics:
1. Selection of Correlated Assets:
• The strategy focuses on two historically correlated assets (e.g., equity index futures like Dow Jones Mini and S&P 500 Mini). These assets tend to move in the same direction due to similar underlying fundamentals, such as overall market conditions. By tracking their relative prices, the strategy seeks to exploit temporary mispricings.
2. Spread Calculation:
• The spread is the difference between the prices of the two assets. This spread represents the relationship between the assets and serves as the basis for determining when to enter or exit trades.
3. Mean and Standard Deviation:
• The historical average (mean) of the spread is calculated using a Simple Moving Average (SMA) over a chosen period. The strategy also computes the standard deviation (volatility) of the spread, which measures how far the spread has deviated from the mean over time. This allows the strategy to define statistically significant price deviations.
4. Entry Signal (Mean Reversion):
• A buy signal is triggered when the spread falls below the mean by a multiple (e.g., two) of the standard deviation. This indicates that one asset is temporarily undervalued relative to the other, and the strategy expects the spread to revert to its mean, generating profits as the prices converge.
5. Exit Signal:
• The strategy exits the trade when the spread reverts to the mean. At this point, the mispricing has been corrected, and the profit from the mean reversion is realized.
Academic Support:
Statistical arbitrage has been widely studied in finance and economics. Gatev, Goetzmann, and Rouwenhorst’s (2006) landmark study on pairs trading demonstrated that this strategy could generate excess returns in equity markets. Their research found that by focusing on historically correlated stocks, traders could identify pricing anomalies and profit from their eventual correction.
Additionally, Avellaneda and Lee (2010) explored statistical arbitrage in different asset classes and found that exploiting deviations in price relationships can offer a robust, market-neutral trading strategy. In these studies, the strategy’s success hinges on the stability of the relationship between the assets and the timely execution of trades when deviations occur.
Risks of Statistical Arbitrage:
1. Correlation Breakdown:
• One of the primary risks is the breakdown of correlation between the two assets. Statistical arbitrage assumes that the historical relationship between the assets will hold in the future. However, market conditions, company fundamentals, or external shocks (e.g., macroeconomic changes) can cause these assets to deviate permanently, leading to potential losses.
• For instance, if two equity indices historically move together but experience divergent economic conditions or policy changes, their prices may no longer revert to the expected mean.
2. Execution Risk:
• This strategy relies on efficient execution and tight spreads. In volatile or illiquid markets, the actual price at which trades are executed may differ significantly from expected prices, leading to slippage and reduced profits.
3. Market Risk:
• Although statistical arbitrage is designed to be market-neutral (i.e., not dependent on the overall market direction), it is not entirely risk-free. Systematic market shocks, such as financial crises or sudden shifts in market sentiment, can affect both assets simultaneously, causing the spread to widen rather than revert to the mean.
4. Model Risk:
• The assumptions underlying the strategy, particularly regarding mean reversion, may not always hold true. The model assumes that asset prices will return to their historical averages within a certain timeframe, but the timing and magnitude of mean reversion can be uncertain. Misestimating this timeframe can lead to extended drawdowns or unrealized losses.
5. Overfitting:
• Over-reliance on historical data to fine-tune the strategy parameters (e.g., the lookback period or standard deviation thresholds) may result in overfitting. This means that the strategy works well on past data but fails to perform in live markets due to changing conditions.
Conclusion:
The Statistical Arbitrage Strategy offers a systematic and quantitative approach to trading that capitalizes on temporary price inefficiencies between correlated assets. It has been proven to generate returns in academic studies and is widely used by hedge funds and institutional traders for its market-neutral characteristics. However, traders must be aware of the inherent risks, including correlation breakdown, execution risks, and the potential for prolonged deviations from the mean. Effective risk management, diversification, and constant monitoring are essential for successfully implementing this strategy in live markets.

STANDARD DEVIATION INDICATOR BY WISE TRADERWISE TRADER STANDARD DEVIATION SETUP: The Ultimate Volatility and Trend Analysis Tool
Unlock the power of STANDARD DEVIATIONS like never before with the this indicator, a versatile and comprehensive tool designed for traders who seek deeper insights into market volatility, trend strength, and price action. This advanced indicator simultaneously plots three sets of customizable Deviations, each with unique settings for moving average types, standard deviations, and periods. Whether you’re a swing trader, day trader, or long-term investor, the STANDARD DEVIATION indicator provides a dynamic way to spot potential reversals, breakouts, and trend-following opportunities.
Key Features:
STANDARD DEVIATIONS Configuration : Monitor three different Bollinger Bands at the same time, allowing for multi-timeframe analysis within a single chart.
Customizable Moving Average Types: Choose from SMA, EMA, SMMA (RMA), WMA, and VWMA to calculate the basis of each band according to your preferred method.
Dynamic Standard Deviations: Set different standard deviation multipliers for each band to fine-tune sensitivity for various market conditions.
Visual Clarity: Color-coded bands with adjustable thicknesses provide a clear view of upper and lower boundaries, along with fill backgrounds to highlight price ranges effectively.
Enhanced Trend Detection: Identify potential trend continuation, consolidation, or reversal zones based on the position and interaction of price with the three bands.
Offset Adjustment: Shift the bands forward or backward to analyze future or past price movements more effectively.
Why Use Triple STANDARD DEVIATIONS ?
STANDARD DEVIATIONS are a popular choice among traders for measuring volatility and anticipating potential price movements. This indicator takes STANDARD DEVIATIONS to the next level by allowing you to customize and analyze three distinct bands simultaneously, providing an unparalleled view of market dynamics. Use it to:
Spot Volatility Expansion and Contraction: Track periods of high and low volatility as prices move toward or away from the bands.
Identify Overbought or Oversold Conditions: Monitor when prices reach extreme levels compared to historical volatility to gauge potential reversal points.
Validate Breakouts: Confirm the strength of a breakout when prices move beyond the outer bands.
Optimize Risk Management: Enhance your strategy's risk-reward ratio by dynamically adjusting stop-loss and take-profit levels based on band positions.
Ideal For:
Forex, Stocks, Cryptocurrencies, and Commodities Traders looking to enhance their technical analysis.
Scalpers and Day Traders who need rapid insights into market conditions.
Swing Traders and Long-Term Investors seeking to confirm entry and exit points.
Trend Followers and Mean Reversion Traders interested in combining both strategies for maximum profitability.
Harness the full potential of STANDARD DEVIATIONS with this multi-dimensional approach. The "STANDARD DEVIATIONS " indicator by WISE TRADER will become an essential part of your trading arsenal, helping you make more informed decisions, reduce risks, and seize profitable opportunities.
Who is WISE TRADER ?
Wise Trader is a highly skilled trader who launched his channel in 2020 during the COVID-19 pandemic, quickly building a loyal following. With thousands of paid subscribed members and over 70,000 YouTube subscribers, Wise Trader has become a trusted authority in the trading world. He is known for his ability to navigate significant events, such as the Indian elections and stock market crashes, providing his audience with valuable insights into market movements and volatility. With a deep understanding of macroeconomics and its correlation to global stock markets, Wise Trader shares informed strategies that help traders make better decisions. His content covers technical analysis, trading setups, economic indicators, and market trends, offering a comprehensive approach to understanding financial markets. The channel serves as a go-to resource for traders who want to enhance their skills and stay informed about key market developments.

Ultimate Oscillator Trading StrategyThe Ultimate Oscillator Trading Strategy implemented in Pine Script™ is based on the Ultimate Oscillator (UO), a momentum indicator developed by Larry Williams in 1976. The UO is designed to measure price momentum over multiple timeframes, providing a more comprehensive view of market conditions by considering short-term, medium-term, and long-term trends simultaneously. This strategy applies the UO as a mean-reversion tool, seeking to capitalize on temporary deviations from the mean price level in the asset’s movement (Williams, 1976).
Strategy Overview:
Calculation of the Ultimate Oscillator (UO):
The UO combines price action over three different periods (short-term, medium-term, and long-term) to generate a weighted momentum measure. The default settings used in this strategy are:
Short-term: 6 periods (adjustable between 2 and 10).
Medium-term: 14 periods (adjustable between 6 and 14).
Long-term: 20 periods (adjustable between 10 and 20).
The UO is calculated as a weighted average of buying pressure and true range across these periods. The weights are designed to give more emphasis to short-term momentum, reflecting the short-term mean-reversion behavior observed in financial markets (Murphy, 1999).
Entry Conditions:
A long position is opened when the UO value falls below 30, indicating that the asset is potentially oversold. The value of 30 is a common threshold that suggests the price may have deviated significantly from its mean and could be due for a reversal, consistent with mean-reversion theory (Jegadeesh & Titman, 1993).
Exit Conditions:
The long position is closed when the current close price exceeds the previous day’s high. This rule captures the reversal and price recovery, providing a defined point to take profits.
The use of previous highs as exit points aligns with breakout and momentum strategies, as it indicates sufficient strength for a price recovery (Fama, 1970).
Scientific Basis and Rationale:
Momentum and Mean-Reversion:
The strategy leverages two well-established phenomena in financial markets: momentum and mean-reversion. Momentum, identified in earlier studies like those by Jegadeesh and Titman (1993), describes the tendency of assets to continue in their direction of movement over short periods. Mean-reversion, as discussed by Poterba and Summers (1988), indicates that asset prices tend to revert to their mean over time after short-term deviations. This dual approach aims to buy assets when they are temporarily oversold and capitalize on their return to the mean.
Multi-timeframe Analysis:
The UO’s incorporation of multiple timeframes (short, medium, and long) provides a holistic view of momentum, unlike single-period oscillators such as the RSI. By combining data across different timeframes, the UO offers a more robust signal and reduces the risk of false entries often associated with single-period momentum indicators (Murphy, 1999).
Trading and Market Efficiency:
Studies in behavioral finance, such as those by Shiller (2003), show that short-term inefficiencies and behavioral biases can lead to overreactions in the market, resulting in price deviations. This strategy seeks to exploit these temporary inefficiencies, using the UO as a signal to identify potential entry points when the market sentiment may have overly pushed the price away from its average.
Strategy Performance:
Backtests of this strategy show promising results, with profit factors exceeding 2.5 when the default settings are optimized. These results are consistent with other studies on short-term trading strategies that capitalize on mean-reversion patterns (Jegadeesh & Titman, 1993). The use of a dynamic, multi-period indicator like the UO enhances the strategy’s adaptability, making it effective across different market conditions and timeframes.
Conclusion:
The Ultimate Oscillator Trading Strategy effectively combines momentum and mean-reversion principles to trade on temporary market inefficiencies. By utilizing multiple periods in its calculation, the UO provides a more reliable and comprehensive measure of momentum, reducing the likelihood of false signals and increasing the profitability of trades. This aligns with modern financial research, showing that strategies based on mean-reversion and multi-timeframe analysis can be effective in capturing short-term price movements.
References:
Fama, E. F. (1970). Efficient Capital Markets: A Review of Theory and Empirical Work. The Journal of Finance, 25(2), 383-417.
Jegadeesh, N., & Titman, S. (1993). Returns to Buying Winners and Selling Losers: Implications for Stock Market Efficiency. The Journal of Finance, 48(1), 65-91.
Murphy, J. J. (1999). Technical Analysis of the Financial Markets: A Comprehensive Guide to Trading Methods and Applications. New York Institute of Finance.
Poterba, J. M., & Summers, L. H. (1988). Mean Reversion in Stock Prices: Evidence and Implications. Journal of Financial Economics, 22(1), 27-59.
Shiller, R. J. (2003). From Efficient Markets Theory to Behavioral Finance. Journal of Economic Perspectives, 17(1), 83-104.
Williams, L. (1976). Ultimate Oscillator. Market research and technical trading analysis.

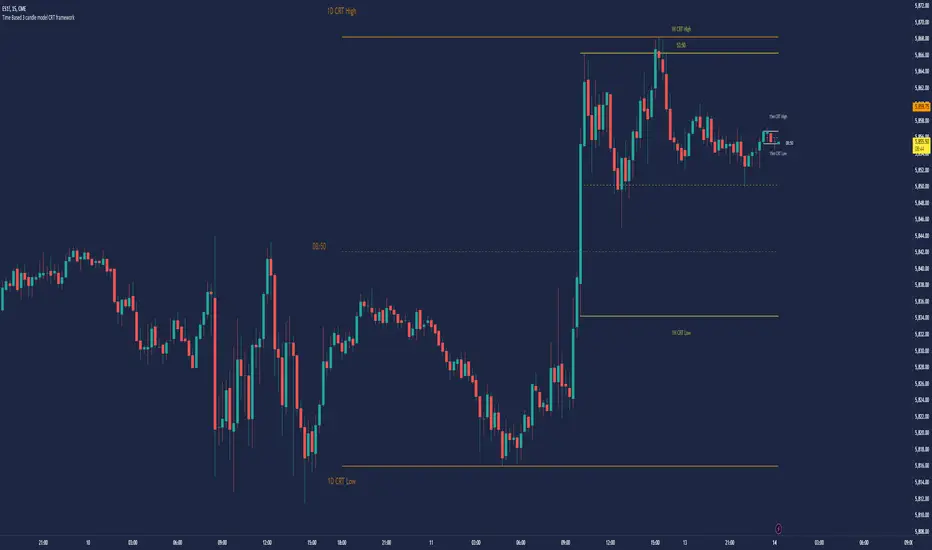
Time Based 3 Candle Model CRT FrameworkThe 3 Candle Model Overview:
The 3 Candle Model serves as a sophisticated framework for traders to navigate the complexities of financial markets, particularly within futures and forex trading. This guide not only elaborates on the model's key features but also emphasizes its originality and practical usefulness in the TradingView community. The core principle of the 3 Candle Model revolves around understanding how candle patterns can represent significant price ranges, offering valuable insights into potential market movements. By integrating the model with other critical trading concepts such as the Power of Three (PO3), Open-High-Low-Close (OHLC), and Turtle Soup setups, traders can enhance their ability to identify high-probability trades and achieve better trading outcomes.
Indicator includes:
3 Customizable Timeframe choices to fractally frame 3 candle models for precision
Live Timers for each timeframe to always be aware of the models timing
Parent Candle tracking on every preffered timeframe until new models parent candle is printed
Key Features of the 3 Candle Model
The 3 Candle Model primarily utilizes a three-candle structure, where the first candle establishes a price range, the second candle may act as a confirmation (often termed a "turtle soup"), and the third candle provides the breakout or continuation. This structure is pivotal in determining entry and exit points for trades, ensuring that each trading decision is backed by solid price action analysis.
OHLC Principle:
The Open-High-Low-Close (OHLC) concept is integral to the 3 Candle Model, allowing traders to analyze price action more effectively. Understanding the relationship between these four price points helps traders gauge market sentiment and potential reversals. By incorporating OHLC into the model, traders can develop a deeper understanding of market structure and its implications for future price movements.
Delivery States:
The 3 Candle Model emphasizes the importance of delivery states, which refer to the market's phase during specific time frames. Recognizing these states aids traders in determining the appropriate conditions for entering trades, particularly when combined with the power of three and candle range patterns. This understanding is crucial for positioning trades in alignment with market momentum.
High Probability Setups:
By aligning the 3 Candle Model with inside bar setups, traders can optimize their strategies for high-probability outcomes. This approach capitalizes on the inherent fractal nature of price movements, where previous patterns repeat at different scales. The combination of the model and inside bar setups enhances the trader's toolkit, allowing for more strategic trade placements.
Turtle Soup Formation:
The 3 Candle Model intricately connects with the Turtle Soup concept, which focuses on false breakouts. Identifying these formations at critical levels enhances the trader's ability to anticipate reversals or continuation patterns. The timing of these setups, particularly during specified times like 3:00 AM, 6:00 AM, 9:00 AM, and 1:00 PM, is crucial for maximizing trade success.
Using the 3 Candle Model in Trading
Integration with PO3:
The Power of Three (PO3) is a fundamental aspect of the 3 Candle Model that emphasizes the significance of three distinct stages of price delivery. Traders can leverage this principle by observing the initial range, confirming patterns, and executing trades during the third phase, leading to higher risk-to-reward ratios. This three-stage approach enhances a trader's ability to make informed decisions based on market behavior.
Targeting Midpoints:
Successful application of the 3 Candle Model involves targeting the midpoints of identified ranges. This practice not only provides strategic entry points but also enhances the probability of reaching desired profit levels. By targeting these midpoints, traders can refine their exit strategies and manage risk more effectively.
Aligning with Market Timing:
Timing is everything in trading. By synchronizing the 3 Candle Model setups with the aforementioned key timeframes, traders can better position themselves to exploit market dynamics. This alignment also facilitates the identification of high-quality trades that exhibit strong potential for profitability.
Prioritizing A+ Setups:
By focusing on the 3 Candle Model and its associated concepts, traders can prioritize A+ setups that exhibit a strong alignment of factors. This methodical approach enhances the quality of trades taken, leading to improved overall performance. By cultivating a strategy centered on high-probability setups, traders can maximize their return on investment.
Ensuring Originality and Usefulness
To meet the TradingView community guidelines, it is essential that this script is both original and useful. The 3 Candle Model, in its essence, is designed to provide traders with a unique perspective on market movements, free from generic or rehashed strategies. This tool integrates unique interpretations of the three-candle model and the associated strategies that are distinctly articulated and innovative.
Practical Applications: there are many practical applications of the 3 Candle Model in various trading contexts. This model in conjunction with other strategies to cultivate high-probability trade setups that can enhance performance across diverse market conditions.
Educational Value: This script is crafted with educational value in mind, providing insights that extend beyond mere trading signals. It encourages users to develop a deeper understanding of market mechanics and the interplay between price action, time, and trader psychology.
Conclusion
The 3 Candle Model provides a comprehensive framework for traders to enhance their trading strategies in the futures and forex markets. By understanding and applying the principles of this model alongside the Power of Three, OHLC concepts, and Turtle Soup formations, traders can significantly improve their ability to identify high-probability trades. The emphasis on timing, delivery states, and alignment of ranges ensures that traders are well-equipped to navigate the complexities of market movements, ultimately leading to more consistent and rewarding trading outcomes.
As trading involves risk, it is essential for traders to utilize these principles judiciously and maintain a disciplined approach to their trading strategies. By adhering to the TradingView community guidelines and emphasizing originality, usefulness, and detailed descriptions, this 3 Candle Model script stands as a valuable resource for traders seeking to refine their skills and achieve greater success in the financial markets.
Through this detailed exploration of the 3 Candle Model, traders will not only learn to recognize and exploit key patterns in price action but also appreciate the interconnectedness of various trading strategies that can significantly enhance their performance and profitability.
Simple RSI stock Strategy [1D] The "Simple RSI Stock Strategy " is designed to long-term traders. Strategy uses a daily time frame to capitalize on signals generated by the Relative Strength Index (RSI) and the Simple Moving Average (SMA). This strategy is suitable for low-leverage trading environments and focuses on identifying potential buy opportunities when the market is oversold, while incorporating strong risk management with both dynamic and static Stop Loss mechanisms.
This strategy is recommended for use with a relatively small amount of capital and is best applied by diversifying across multiple stocks in a strong uptrend, particularly in the S&P 500 stock market. It is specifically designed for equities, and may not perform well in other markets such as commodities, forex, or cryptocurrencies, where different market dynamics and volatility patterns apply.
Indicators Used in the Strategy:
1. RSI (Relative Strength Index):
- The RSI is a momentum oscillator used to identify overbought and oversold conditions in the market.
- This strategy enters long positions when the RSI drops below the oversold level (default: 30), indicating a potential buying opportunity.
- It focuses on oversold conditions but uses a filter (SMA 200) to ensure trades are only made in the context of an overall uptrend.
2. SMA 200 (Simple Moving Average):
- The 200-period SMA serves as a trend filter, ensuring that trades are only executed when the price is above the SMA, signaling a bullish market.
- This filter helps to avoid entering trades in a downtrend, thereby reducing the risk of holding positions in a declining market.
3. ATR (Average True Range):
- The ATR is used to measure market volatility and is instrumental in setting the Stop Loss.
- By multiplying the ATR value by a custom multiplier (default: 1.5), the strategy dynamically adjusts the Stop Loss level based on market volatility, allowing for flexibility in risk management.
How the Strategy Works:
Entry Signals:
The strategy opens long positions when RSI indicates that the market is oversold (below 30), and the price is above the 200-period SMA. This ensures that the strategy buys into potential market bottoms within the context of a long-term uptrend.
Take Profit Levels:
The strategy defines three distinct Take Profit (TP) levels:
TP 1: A 5% from the entry price.
TP 2: A 10% from the entry price.
TP 3: A 15% from the entry price.
As each TP level is reached, the strategy closes portions of the position to secure profits: 33% of the position is closed at TP 1, 66% at TP 2, and 100% at TP 3.
Visualizing Target Points:
The strategy provides visual feedback by plotting plotshapes at each Take Profit level (TP 1, TP 2, TP 3). This allows traders to easily see the target profit levels on the chart, making it easier to monitor and manage positions as they approach key profit-taking areas.
Stop Loss Mechanism:
The strategy uses a dual Stop Loss system to effectively manage risk:
ATR Trailing Stop: This dynamic Stop Loss adjusts based on the ATR value and trails the price as the position moves in the trader’s favor. If a price reversal occurs and the market begins to trend downward, the trailing stop closes the position, locking in gains or minimizing losses.
Basic Stop Loss: Additionally, a fixed Stop Loss is set at 25%, limiting potential losses. This basic Stop Loss serves as a safeguard, automatically closing the position if the price drops 25% from the entry point. This higher Stop Loss is designed specifically for low-leverage trading, allowing more room for market fluctuations without prematurely closing positions.
to determine the level of stop loss and target point I used a piece of code by RafaelZioni, here is the script from which a piece of code was taken
Together, these mechanisms ensure that the strategy dynamically manages risk while offering robust protection against significant losses in case of sharp market downturns.
The position size has been estimated by me at 75% of the total capital. For optimal capital allocation, a recommended value based on the Kelly Criterion, which is calculated to be 59.13% of the total capital per trade, can also be considered.
Enjoy !

Multi-Step FlexiMA - Strategy [presentTrading]It's time to come back! hope I can not to be busy for a while.
█ Introduction and How It Is Different
The FlexiMA Variance Tracker is a unique trading strategy that calculates a series of deviations between the price (or another indicator source) and a variable-length moving average (MA). Unlike traditional strategies that use fixed-length moving averages, the length of the MA in this system varies within a defined range. The length changes dynamically based on a starting factor and an increment factor, creating a more adaptive approach to market conditions.
This strategy integrates Multi-Step Take Profit (TP) levels, allowing for partial exits at predefined price increments. It enables traders to secure profits at different stages of a trend, making it ideal for volatile markets where taking full profits at once might lead to missed opportunities if the trend continues.
BTCUSD 6hr Performance
█ Strategy, How It Works: Detailed Explanation
🔶 FlexiMA Concept
The FlexiMA (Flexible Moving Average) is at the heart of this strategy. Unlike traditional MA-based strategies where the MA length is fixed (e.g., a 50-period SMA), the FlexiMA varies its length with each iteration. This is done using a **starting factor** and an **increment factor**.
The formula for the moving average length at each iteration \(i\) is:
`MA_length_i = indicator_length * (starting_factor + i * increment_factor)`
Where:
- `indicator_length` is the user-defined base length.
- `starting_factor` is the initial multiplier of the base length.
- `increment_factor` increases the multiplier in each iteration.
Each iteration applies a **simple moving average** (SMA) to the chosen **indicator source** (e.g., HLC3) with a different length based on the above formula. The deviation between the current price and the moving average is then calculated as follows:
`deviation_i = price_current - MA_i`
These deviations are normalized using one of the following methods:
- **Max-Min normalization**:
`normalized_i = (deviation_i - min(deviations)) / range(deviations)`
- **Absolute Sum normalization**:
`normalized_i = deviation_i / sum(|deviation_i|)`
The **median** and **standard deviation (stdev)** of the normalized deviations are then calculated as follows:
`median = median(normalized deviations)`
For the standard deviation:
`stdev = sqrt((1/(N-1)) * sum((normalized_i - mean)^2))`
These values are plotted to provide a clear indication of how the price is deviating from its variable-length moving averages.
For more detail:
🔶 Multi-Step Take Profit
This strategy uses a multi-step take profit system, allowing for exits at different stages of a trade based on the percentage of price movement. Three take-profit levels are defined:
- Take Profit Level 1 (TP1): A small, quick profit level (e.g., 2%).
- Take Profit Level 2 (TP2): A medium-level profit target (e.g., 8%).
- Take Profit Level 3 (TP3): A larger, more ambitious target (e.g., 18%).
At each level, a corresponding percentage of the trade is exited:
- TP Percent 1: E.g., 30% of the position.
- TP Percent 2: E.g., 20% of the position.
- TP Percent 3: E.g., 15% of the position.
This approach ensures that profits are locked in progressively, reducing the risk of market reversals wiping out potential gains.
Local
🔶 Trade Entry and Exit Conditions
The entry and exit signals are determined by the interaction between the **SuperTrend Polyfactor Oscillator** and the **median** value of the normalized deviations:
- Long entry: The SuperTrend turns bearish, and the median value of the deviations is positive.
- Short entry: The SuperTrend turns bullish, and the median value is negative.
Similarly, trades are exited when the SuperTrend flips direction.
* The SuperTrend Toolkit is made by @EliCobra
█ Trade Direction
The strategy allows users to specify the desired trade direction:
- Long: Only long positions will be taken.
- Short: Only short positions will be taken.
- Both: Both long and short positions are allowed based on the conditions.
This flexibility allows the strategy to adapt to different market conditions and trading styles, whether you're looking to buy low and sell high, or sell high and buy low.
█ Usage
This strategy can be applied across various asset classes, including stocks, cryptocurrencies, and forex. The primary use case is to take advantage of market volatility by using a flexible moving average and multiple take-profit levels to capture profits incrementally as the market moves in your favor.
How to Use:
1. Configure the Inputs: Start by adjusting the **Indicator Length**, **Starting Factor**, and **Increment Factor** to suit your chosen asset. The defaults work well for most markets, but fine-tuning them can improve performance.
2. Set the Take Profit Levels: Adjust the three **TP levels** and their corresponding **percentages** based on your risk tolerance and the expected volatility of the market.
3. Monitor the Strategy: The SuperTrend and the FlexiMA variance tracker will provide entry and exit signals, automatically managing the positions and taking profits at the pre-set levels.
█ Default Settings
The default settings for the strategy are configured to provide a balanced approach that works across different market conditions:
Indicator Length (10):
This controls the base length for the moving average. A lower length makes the moving average more responsive to price changes, while a higher length smooths out fluctuations, making the strategy less sensitive to short-term price movements.
Starting Factor (1.0):
This determines the initial multiplier applied to the moving average length. A higher starting factor will increase the average length, making it slower to react to price changes.
Increment Factor (1.0):
This increases the moving average length in each iteration. A larger increment factor creates a wider range of moving average lengths, allowing the strategy to track both short-term and long-term trends simultaneously.
Normalization Method ('None'):
Three methods of normalization can be applied to the deviations:
- None: No normalization applied, using raw deviations.
- Max-Min: Normalizes based on the range between the maximum and minimum deviations.
- Absolute Sum: Normalizes based on the total sum of absolute deviations.
Take Profit Levels:
- TP1 (2%): A quick exit to capture small price movements.
- TP2 (8%): A medium-term profit target for stronger trends.
- TP3 (18%): A long-term target for strong price moves.
Take Profit Percentages:
- TP Percent 1 (30%): Exits 30% of the position at TP1.
- TP Percent 2 (20%): Exits 20% of the position at TP2.
- TP Percent 3 (15%): Exits 15% of the position at TP3.
Effect of Variables on Performance:
- Short Indicator Lengths: More responsive to price changes but prone to false signals.
- Higher Starting Factor: Slows down the response, useful for longer-term trend following.
- Higher Increment Factor: Widens the variability in moving average lengths, making the strategy adapt to both short-term and long-term price trends.
- Aggressive Take Profit Levels: Allows for quick profit-taking in volatile markets but may exit positions prematurely in strong trends.
The default configuration offers a moderate balance between short-term responsiveness and long-term trend capturing, suitable for most traders. However, users can adjust these variables to optimize performance based on market conditions and personal preferences.

RSI Trend Following StrategyOverview
The RSI Trend Following Strategy utilizes Relative Strength Index (RSI) to enter the trade for the potential trend continuation. It uses Stochastic indicator to check is the price is not in overbought territory and the MACD to measure the current price momentum. Moreover, it uses the 200-period EMA to filter the counter trend trades with the higher probability. The strategy opens only long trades.
Unique Features
Dynamic stop-loss system: Instead of fixed stop-loss level strategy utilizes average true range (ATR) multiplied by user given number subtracted from the position entry price as a dynamic stop loss level.
Configurable Trading Periods: Users can tailor the strategy to specific market windows, adapting to different market conditions.
Two layers trade filtering system: Strategy utilizes MACD and Stochastic indicators measure the current momentum and overbought condition and use 200-period EMA to filter trades against major trend.
Trailing take profit level: After reaching the trailing profit activation level script activates the trailing of long trade using EMA. More information in methodology.
Wide opportunities for strategy optimization: Flexible strategy settings allows users to optimize the strategy entries and exits for chosen trading pair and time frame.
Methodology
The strategy opens long trade when the following price met the conditions:
RSI is above 50 level.
MACD line shall be above the signal line
Both lines of Stochastic shall be not higher than 80 (overbought territory)
Candle’s low shall be above the 200 period EMA
When long trade is executed, strategy set the stop-loss level at the price ATR multiplied by user-given value below the entry price. This level is recalculated on every next candle close, adjusting to the current market volatility.
At the same time strategy set up the trailing stop validation level. When the price crosses the level equals entry price plus ATR multiplied by user-given value script starts to trail the price with trailing EMA(by default = 20 period). If price closes below EMA long trade is closed. When the trailing starts, script prints the label “Trailing Activated”.
Strategy settings
In the inputs window user can setup the following strategy settings:
ATR Stop Loss (by default = 1.75)
ATR Trailing Profit Activation Level (by default = 2.25)
MACD Fast Length (by default = 12, period of averaging fast MACD line)
MACD Fast Length (by default = 26, period of averaging slow MACD line)
MACD Signal Smoothing (by default = 9, period of smoothing MACD signal line)
Oscillator MA Type (by default = EMA, available options: SMA, EMA)
Signal Line MA Type (by default = EMA, available options: SMA, EMA)
RSI Length (by default = 14, period for RSI calculation)
Trailing EMA Length (by default = 20, period for EMA, which shall be broken close the trade after trailing profit activation)
Justification of Methodology
This trading strategy is designed to leverage a combination of technical indicators—Relative Strength Index (RSI), Moving Average Convergence Divergence (MACD), Stochastic Oscillator, and the 200-period Exponential Moving Average (EMA)—to determine optimal entry points for long trades. Additionally, the strategy uses the Average True Range (ATR) for dynamic risk management to adapt to varying market conditions. Let's look in details for which purpose each indicator is used for and why it is used in this combination.
Relative Strength Index (RSI) is a momentum indicator used in technical analysis to measure the speed and change of price movements in a financial market. It helps traders identify whether an asset is potentially overbought (overvalued) or oversold (undervalued), which can indicate a potential reversal or continuation of the current trend.
How RSI Works? RSI tracks the strength of recent price changes. It compares the average gains and losses over a specific period (usually 14 periods) to assess the momentum of an asset. Average gain is the average of all positive price changes over the chosen period. It reflects how much the price has typically increased during upward movements. Average loss is the average of all negative price changes over the same period. It reflects how much the price has typically decreased during downward movements.
RSI calculates these average gains and losses and compares them to create a value between 0 and 100. If the RSI value is above 70, the asset is generally considered overbought, meaning it might be due for a price correction or reversal downward. Conversely, if the RSI value is below 30, the asset is considered oversold, suggesting it could be poised for an upward reversal or recovery. RSI is a useful tool for traders to determine market conditions and make informed decisions about entering or exiting trades based on the perceived strength or weakness of an asset's price movements.
This strategy uses RSI as a short-term trend approximation. If RSI crosses over 50 it means that there is a high probability of short-term trend change from downtrend to uptrend. Therefore RSI above 50 is our first trend filter to look for a long position.
The MACD (Moving Average Convergence Divergence) is a popular momentum and trend-following indicator used in technical analysis. It helps traders identify changes in the strength, direction, momentum, and duration of a trend in an asset's price.
The MACD consists of three components:
MACD Line: This is the difference between a short-term Exponential Moving Average (EMA) and a long-term EMA, typically calculated as: MACD Line = 12 period EMA − 26 period EMA
Signal Line: This is a 9-period EMA of the MACD Line, which helps to identify buy or sell signals. When the MACD Line crosses above the Signal Line, it can be a bullish signal (suggesting a buy); when it crosses below, it can be a bearish signal (suggesting a sell).
Histogram: The histogram shows the difference between the MACD Line and the Signal Line, visually representing the momentum of the trend. Positive histogram values indicate increasing bullish momentum, while negative values indicate increasing bearish momentum.
This strategy uses MACD as a second short-term trend filter. When MACD line crossed over the signal line there is a high probability that uptrend has been started. Therefore MACD line above signal line is our additional short-term trend filter. In conjunction with RSI it decreases probability of following false trend change signals.
The Stochastic Indicator is a momentum oscillator that compares a security's closing price to its price range over a specific period. It's used to identify overbought and oversold conditions. The indicator ranges from 0 to 100, with readings above 80 indicating overbought conditions and readings below 20 indicating oversold conditions.
It consists of two lines:
%K: The main line, calculated using the formula (CurrentClose−LowestLow)/(HighestHigh−LowestLow)×100 . Highest and lowest price taken for 14 periods.
%D: A smoothed moving average of %K, often used as a signal line.
This strategy uses stochastic to define the overbought conditions. The logic here is the following: we want to avoid long trades in the overbought territory, because when indicator reaches it there is a high probability that the potential move is gonna be restricted.
The 200-period EMA is a widely recognized indicator for identifying the long-term trend direction. The strategy only trades in the direction of this primary trend to increase the probability of successful trades. For instance, when the price is above the 200 EMA, only long trades are considered, aligning with the overarching trend direction.
Therefore, strategy uses combination of RSI and MACD to increase the probability that price now is in short-term uptrend, Stochastic helps to avoid the trades in the overbought (>80) territory. To increase the probability of opening long trades in the direction of a main trend and avoid local bounces we use 200 period EMA.
ATR is used to adjust the strategy risk management to the current market volatility. If volatility is low, we don’t need the large stop loss to understand the there is a high probability that we made a mistake opening the trade. User can setup the settings ATR Stop Loss and ATR Trailing Profit Activation Level to realize his own risk to reward preferences, but the unique feature of a strategy is that after reaching trailing profit activation level strategy is trying to follow the trend until it is likely to be finished instead of using fixed risk management settings. It allows sometimes to be involved in the large movements.
Backtest Results
Operating window: Date range of backtests is 2023.01.01 - 2024.08.01. It is chosen to let the strategy to close all opened positions.
Commission and Slippage: Includes a standard Binance commission of 0.1% and accounts for possible slippage over 5 ticks.
Initial capital: 10000 USDT
Percent of capital used in every trade: 30%
Maximum Single Position Loss: -3.94%
Maximum Single Profit: +15.78%
Net Profit: +1359.21 USDT (+13.59%)
Total Trades: 111 (36.04% win rate)
Profit Factor: 1.413
Maximum Accumulated Loss: 625.02 USDT (-5.85%)
Average Profit per Trade: 12.25 USDT (+0.40%)
Average Trade Duration: 40 hours
These results are obtained with realistic parameters representing trading conditions observed at major exchanges such as Binance and with realistic trading portfolio usage parameters.
How to Use
Add the script to favorites for easy access.
Apply to the desired timeframe and chart (optimal performance observed on 2h BTC/USDT).
Configure settings using the dropdown choice list in the built-in menu.
Set up alerts to automate strategy positions through web hook with the text: {{strategy.order.alert_message}}
Disclaimer:
Educational and informational tool reflecting Skyrex commitment to informed trading. Past performance does not guarantee future results. Test strategies in a simulated environment before live implementation

Trailing Stop ProTrailing Stop Pro is a sophisticated TradingView indicator designed to enhance your trading strategy by dynamically managing trailing stops based on market volatility. This tool leverages the Average True Range (ATR) to adjust stop levels, providing traders with a robust mechanism to protect profits and minimize losses.
Key Features:
Dynamic Trailing Stops: Automatically adjusts stop levels using ATR, allowing for responsive and adaptive risk management.
Customizable Inputs: Tailor the indicator to your trading style with adjustable parameters such as ATR Length, ATR Multiplier, and Source Vector.
Visual Clarity: Distinct color settings for long and short stops, with adjustable line thickness and transparency, ensuring clear visualization on your charts.
Professional Grade: The "Pro" designation signifies advanced features suitable for both novice and experienced traders seeking reliable and efficient stop management.
How It Works:
To set up the indicator, begin by defining the Chrono Point, which specifies the exact time you want the trailing stop mechanism to activate. This allows for precise control over when your stops begin to trail. Next, set the Credit Unit as the initial entry price for your trade, serving as the baseline from which the trailing stops will adjust.
The indicator uses ATR-based adjustments to determine stop levels. Customize the sensitivity of the trailing stop by adjusting the ATR Length (default is 14) and ATR Multiplier (default is 0.5). A longer ATR length smooths out volatility, while a higher multiplier increases the distance of the stop from the price.
Select your Source Vector from "High/Low," "Close," or "Open" prices as the basis for stop calculation. This flexibility allows you to align the indicator with your preferred trading strategy. The indicator plots trailing stops directly on the chart, with color-coded lines indicating long (teal) and short (red) positions. You can adjust the line thickness and transparency for optimal visibility.
The Mission Status feature automatically detects whether the trade is long or short and adjusts the trailing stop accordingly. If the price hits the trailing stop, the trade is considered exited, and the indicator calculates the profit or loss percentage.
Benefits:
Risk Management: Protect your trades from adverse market movements while locking in profits as prices move favorably.
Automation: Reduce manual intervention with automatic stop adjustments, allowing you to focus on strategic decision-making.
User-Friendly Interface: Intuitive settings and clear visual cues make it easy to integrate into your existing trading workflow.
Conclusion:
Trailing Stop Pro is an essential tool for traders looking to enhance their risk management strategies with precision and ease. By automating the trailing stop process and providing clear visual feedback, this indicator empowers you to navigate the markets with confidence. Whether you're a seasoned trader or just starting, Trailing Stop Pro offers the functionality and flexibility needed to optimize your trading performance.
The Trailing Stop Pro indicator is a tool designed to assist traders in managing risk and optimizing their trading strategies. However, it should not be considered as financial advice or a guarantee of profitability. Trading involves significant risk, and it is possible to lose more than your initial investment. Users are encouraged to thoroughly test the indicator in a demo environment and consider their own financial situation and risk tolerance before using it in live trading. Past performance is not indicative of future results, and users should seek advice from a qualified financial advisor if needed.

AB_Bnf_Selling_5minThe Mathematical Level Reversal Strategy is designed to identify potential reversal points in the market using mathematical levels combined with price action on a 5-minute chart. This strategy is particularly effective for intraday traders who seek to capitalize on precise entry and exit points based on calculated levels rather than traditional indicators like moving averages or Bollinger Bands.
Creators' Mathematical Levels Explanation
Mathematical levels are predetermined price points calculated based on various factors such as previous high/low points, Fibonacci retracements, or other arithmetic calculations. These levels are used to anticipate areas where the price might reverse or experience significant support or resistance.
higher threshold: A predefined level where the price is expected to experience resistance, leading to a potential reversal downward.
Lower Threshold: A predefined level where the price might find support, leading to a potential upward reversal.
In this strategy, we focus on price movements around the upper mathematical level, where prices are likely to reverse downwards.
Strategy Logic
Setup:
The strategy is applied on a 5-minute chart.
Mathematical levels are calculated based on your preferred method, such as Fibonacci levels, pivot points, or custom calculations. For this strategy, let's assume we are using a specific predefined upper level.
Sell Signal Criteria:
A 5-minute candle must cross above the predefined upper mathematical level or close entirely above it (open and close both above the level).
The following candle must break below the low of the candle that crossed the upper level and close below that low. This confirms a bearish reversal.
Once these conditions are met, a sell signal is triggered.
Stop Loss:
The stop loss is placed at the high of the candle that crossed above the upper mathematical level.
This level represents the point where the trade setup would be invalidated.
Take Profit:
Target 1: The first take profit is set at a level that offers a 1:5 risk-to-reward ratio.
Target 2: An alternative take profit level is set at a 1:3 risk-to-reward ratio, providing flexibility based on market conditions.
Trade Management:
Once a trade is initiated, no new trades will be taken until the current trade hits either the stop loss or the first take profit level. This prevents overlapping signals and helps in managing risk effectively.
Originality and Usefulness
This strategy offers a unique approach by using mathematical levels instead of traditional indicators. It provides traders with a clear framework for identifying and executing high-probability reversal trades, particularly in intraday markets.
Originality:
The strategy's originality lies in its reliance on mathematical levels combined with a multi-candle confirmation pattern. This approach reduces the chances of false signals and offers a robust method for identifying potential reversals.
Usefulness:
The strategy is particularly useful for traders who prefer a more quantitative approach, relying on calculated price levels rather than indicators. The clear rules for entry, stop loss, and take profit make it easier to execute consistently.
The inclusion of both 1:5 and 1:3 risk-to-reward targets allows for flexibility depending on market conditions, ensuring that traders can adapt to varying levels of volatility.
Chart Signals and Examples
To demonstrate the effectiveness of this strategy, let's look at a few hypothetical examples on a 5-minute chart:
Example 1: Clear Reversal Signal
The price steadily rises and crosses above the predefined upper mathematical level. The next candle breaks below the low of this candle and closes lower, triggering a sell signal.
A red dotted line is drawn at the stop loss level (the high of the candle that crossed the upper level).
Two green dashed lines are drawn to indicate the first and second take profit levels.
Example 2: No Signal Due to Ongoing Trade
After an initial sell signal is triggered, the price fluctuates but does not hit either the stop loss or the first take profit target. During this period, the strategy refrains from issuing any new signals, adhering to the trade management rule.
Example 3: Trade Reaches Target 1
In another scenario, the price moves sharply in favor of the trade after the signal is triggered. The first take profit level is hit, securing a profit. The trade is then considered closed, and the strategy is ready to issue a new signal when conditions are met.

MACD with 1D Stochastic Confirmation Reversal StrategyOverview
The MACD with 1D Stochastic Confirmation Reversal Strategy utilizes MACD indicator in conjunction with 1 day timeframe Stochastic indicators to obtain the high probability short-term trend reversal signals. The main idea is to wait until MACD line crosses up it’s signal line, at the same time Stochastic indicator on 1D time frame shall show the uptrend (will be discussed in methodology) and not to be in the oversold territory. Strategy works on time frames from 30 min to 4 hours and opens only long trades.
Unique Features
Dynamic stop-loss system: Instead of fixed stop-loss level strategy utilizes average true range (ATR) multiplied by user given number subtracted from the position entry price as a dynamic stop loss level.
Configurable Trading Periods: Users can tailor the strategy to specific market windows, adapting to different market conditions.
Higher time frame confirmation: Strategy utilizes 1D Stochastic to establish the major trend and confirm the local reversals with the higher probability.
Trailing take profit level: After reaching the trailing profit activation level scrip activate the trailing of long trade using EMA. More information in methodology.
Methodology
The strategy opens long trade when the following price met the conditions:
MACD line of MACD indicator shall cross over the signal line of MACD indicator.
1D time frame Stochastic’s K line shall be above the D line.
1D time frame Stochastic’s K line value shall be below 80 (not overbought)
When long trade is executed, strategy set the stop-loss level at the price ATR multiplied by user-given value below the entry price. This level is recalculated on every next candle close, adjusting to the current market volatility.
At the same time strategy set up the trailing stop validation level. When the price crosses the level equals entry price plus ATR multiplied by user-given value script starts to trail the price with EMA. If price closes below EMA long trade is closed. When the trailing starts, script prints the label “Trailing Activated”.
Strategy settings
In the inputs window user can setup the following strategy settings:
ATR Stop Loss (by default = 3.25, value multiplied by ATR to be subtracted from position entry price to setup stop loss)
ATR Trailing Profit Activation Level (by default = 4.25, value multiplied by ATR to be added to position entry price to setup trailing profit activation level)
Trailing EMA Length (by default = 20, period for EMA, when price reached trailing profit activation level EMA will stop out of position if price closes below it)
User can choose the optimal parameters during backtesting on certain price chart, in our example we use default settings.
Justification of Methodology
This strategy leverages 2 time frames analysis to have the high probability reversal setups on lower time frame in the direction of the 1D time frame trend. That’s why it’s recommended to use this strategy on 30 min – 4 hours time frames.
To have an approximation of 1D time frame trend strategy utilizes classical Stochastic indicator. The Stochastic Indicator is a momentum oscillator that compares a security's closing price to its price range over a specific period. It's used to identify overbought and oversold conditions. The indicator ranges from 0 to 100, with readings above 80 indicating overbought conditions and readings below 20 indicating oversold conditions.
It consists of two lines:
%K: The main line, calculated using the formula (CurrentClose−LowestLow)/(HighestHigh−LowestLow)×100 . Highest and lowest price taken for 14 periods.
%D: A smoothed moving average of %K, often used as a signal line.
Strategy logic assumes that on 1D time frame it’s uptrend in %K line is above the %D line. Moreover, we can consider long trade only in %K line is below 80. It means that in overbought state the long trade will not be opened due to higher probability of pullback or even major trend reversal. If these conditions are met we are going to our working (lower) time frame.
On the chosen time frame, we remind you that for correct work of this strategy you shall use 30min – 4h time frames, MACD line shall cross over it’s signal line. The MACD (Moving Average Convergence Divergence) is a popular momentum and trend-following indicator used in technical analysis. It helps traders identify changes in the strength, direction, momentum, and duration of a trend in a stock's price.
The MACD consists of three components:
MACD Line: This is the difference between a short-term Exponential Moving Average (EMA) and a long-term EMA, typically calculated as: MACD Line=12-period EMA−26-period
Signal Line: This is a 9-period EMA of the MACD Line, which helps to identify buy or sell signals. When the MACD Line crosses above the Signal Line, it can be a bullish signal (suggesting a buy); when it crosses below, it can be a bearish signal (suggesting a sell).
Histogram: The histogram shows the difference between the MACD Line and the Signal Line, visually representing the momentum of the trend. Positive histogram values indicate increasing bullish momentum, while negative values indicate increasing bearish momentum.
In our script we are interested in only MACD and signal lines. When MACD line crosses signal line there is a high chance that short-term trend reversed to the upside. We use this strategy on 45 min time frame.
ATR is used to adjust the strategy risk management to the current market volatility. If volatility is low, we don’t need the large stop loss to understand the there is a high probability that we made a mistake opening the trade. User can setup the settings ATR Stop Loss and ATR Trailing Profit Activation Level to realize his own risk to reward preferences, but the unique feature of a strategy is that after reaching trailing profit activation level strategy is trying to follow the trend until it is likely to be finished instead of using fixed risk management settings. It allows sometimes to be involved in the large movements.
Backtest Results
Operating window: Date range of backtests is 2023.01.01 - 2024.08.01. It is chosen to let the strategy to close all opened positions.
Commission and Slippage: Includes a standard Binance commission of 0.1% and accounts for possible slippage over 5 ticks.
Initial capital: 10000 USDT
Percent of capital used in every trade: 30%
Maximum Single Position Loss: -4.79%
Maximum Single Profit: +20.14%
Net Profit: +2361.33 USDT (+44.72%)
Total Trades: 123 (44.72% win rate)
Profit Factor: 1.623
Maximum Accumulated Loss: 695.80 USDT (-5.48%)
Average Profit per Trade: 19.20 USDT (+0.59%)
Average Trade Duration: 30 hours
These results are obtained with realistic parameters representing trading conditions observed at major exchanges such as Binance and with realistic trading portfolio usage parameters.
How to Use
Add the script to favorites for easy access.
Apply to the desired timeframe between 30 min and 4 hours and chart (optimal performance observed on 45 min BTC/USDT).
Configure settings using the dropdown choice list in the built-in menu.
Set up alerts to automate strategy positions through web hook with the text: {{strategy.order.alert_message}}
Disclaimer:
Educational and informational tool reflecting Skyrex commitment to informed trading. Past performance does not guarantee future results. Test strategies in a simulated environment before live implementation

Harmonic Patterns Library [TradingFinder]🔵 Introduction
Harmonic patterns blend geometric shapes with Fibonacci numbers, making these numbers fundamental to understanding the patterns.
One person who has done a lot of research on harmonic patterns is Scott Carney.Scott Carney's research on harmonic patterns in technical analysis focuses on precise price structures based on Fibonacci ratios to identify market reversals.
Key patterns include the Gartley, Bat, Butterfly, and Crab, each with specific alignment criteria. These patterns help traders anticipate potential market turning points and make informed trading decisions, enhancing the predictability of technical analysis.
🟣 Understanding 5-Point Harmonic Patterns
In the current library version, you can easily draw and customize most XABCD patterns. These patterns often form M or W shapes, or a combination of both. By calculating the Fibonacci ratios between key points, you can estimate potential price movements.
All five-point patterns share a similar structure, differing only in line lengths and Fibonacci ratios. Learning one pattern simplifies understanding others.
🟣 Exploring the Gartley Pattern
The Gartley pattern appears in both bullish (M shape) and bearish (W shape) forms. In the bullish Gartley, point X is below point D, and point A surpasses point C. Point D marks the start of a strong upward trend, making it an optimal point to place a buy order.
The bearish Gartley mirrors the bullish pattern with inverted Fibonacci ratios. In this scenario, point D indicates the start of a significant price drop. Traders can place sell orders at this point and buy at lower prices for profit in two-way markets.
🟣 Analyzing the Butterfly Pattern
The Butterfly pattern also manifests in bullish (M shape) and bearish (W shape) forms. It resembles the Gartley pattern but with point D lower than point X in the bullish version.
The Butterfly pattern involves deeper price corrections than the Gartley, leading to more significant price fluctuations. Point D in the bullish Butterfly indicates the beginning of a sharp price rise, making it an entry point for buy orders.
The bearish Butterfly has inverted Fibonacci ratios, with point D marking the start of a sharp price decline, ideal for sell orders followed by buying at lower prices in two-way markets.
🟣 Insights into the Bat Pattern
The Bat pattern, appearing in bullish (M shape) and bearish (W shape) forms, is one of the most precise harmonic patterns. It closely resembles the Butterfly and Gartley patterns, differing mainly in Fibonacci levels.
The bearish Bat pattern shares the Fibonacci ratios with the bullish Bat, with an inverted structure. Point D in the bearish Bat marks the start of a significant price drop, suitable for sell orders followed by buying at lower prices for profit.
🟣 The Crab Pattern Explained
The Crab pattern, found in both bullish (M shape) and bearish (W shape) forms, is highly favored by analysts. Discovered in 2000, the Crab pattern features a larger final wave correction compared to other harmonic patterns.
The bearish Crab shares Fibonacci ratios with the bullish version but in an inverted form. Point D in the bearish Crab signifies the start of a sharp price decline, making it an ideal point for sell orders followed by buying at lower prices for profitable trades.
🟣 Understanding the Shark Pattern
The Shark pattern appears in bullish (M shape) and bearish (W shape) forms. It differs from previous patterns as point C in the bullish Shark surpasses point A, with unique level measurements.
The bearish Shark pattern mirrors the Fibonacci ratios of the bullish Shark but is inverted. Point D in the bearish Shark indicates the start of a sharp price drop, ideal for placing sell orders and buying at lower prices to capitalize on the pattern.
🟣 The Cypher Pattern Overview
The Cypher pattern is another that appears in both bullish (M shape) and bearish (W shape) forms. It resembles the Shark pattern, with point C in the bullish Cypher extending beyond point A, and point D forming within the XA line.
The bearish Cypher shares the Fibonacci ratios with the bullish Cypher but in an inverted structure. Point D in the bearish Cypher marks the start of a significant price drop, perfect for sell orders followed by buying at lower prices.
🟣 Introducing the Nen-Star Pattern
The Nen-Star pattern appears in both bullish (M shape) and bearish (W shape) forms. In the bullish Nen-Star, point C extends beyond point A, and point D, the final point, forms outside the XA line, making CD the longest wave.
The bearish Nen-Star has inverted Fibonacci ratios, with point D indicating the start of a significant price drop. Traders can place sell orders at point D and buy at lower prices to profit from this pattern in two-way markets.
The 5-point harmonic patterns, commonly referred to as XABCD patterns, are specific geometric price structures identified in financial markets. These patterns are used by traders to predict potential price movements based on historical price data and Fibonacci retracement levels.
Here are the main 5-point harmonic patterns :
Gartley Pattern
Anti-Gartley Pattern
Bat Pattern
Anti-Bat Pattern
Alternate Bat Pattern
Butterfly Pattern
Anti-Butterfly Pattern
Crab Pattern
Anti-Crab Pattern
Deep Crab Pattern
Shark Pattern
Anti- Shark Pattern
Anti Alternate Shark Pattern
Cypher Pattern
Anti-Cypher Pattern
🔵 How to Use
To add "Order Block Refiner Library", you must first add the following code to your script.
import TFlab/Harmonic_Chart_Pattern_Library_TradingFinder/1 as HP
🟣 Parameters
XABCD(Name, Type, Show, Color, LineWidth, LabelSize, ShVF, FLPC, FLPCPeriod, Pivot, ABXAmin, ABXAmax, BCABmin, BCABmax, CDBCmin, CDBCmax, CDXAmin, CDXAmax) =>
Parameters:
Name (string)
Type (string)
Show (bool)
Color (color)
LineWidth (int)
LabelSize (string)
ShVF (bool)
FLPC (bool)
FLPCPeriod (int)
Pivot (int)
ABXAmin (float)
ABXAmax (float)
BCABmin (float)
BCABmax (float)
CDBCmin (float)
CDBCmax (float)
CDXAmin (float)
CDXAmax (float)
🟣 Genaral Parameters
Name : The name of the pattern.
Type: Enter "Bullish" to draw a Bullish pattern and "Bearish" to draw an Bearish pattern.
Show : Enter "true" to display the template and "false" to not display the template.
Color : Enter the desired color to draw the pattern in this parameter.
LineWidth : You can enter the number 1 or numbers higher than one to adjust the thickness of the drawing lines. This number must be an integer and increases with increasing thickness.
LabelSize : You can adjust the size of the labels by using the "size.auto", "size.tiny", "size.smal", "size.normal", "size.large" or "size.huge" entries.
🟣 Logical Parameters
ShVF : If this parameter is on "true" mode, only patterns will be displayed that they have exact format and no noise can be seen in them. If "false" is, the patterns displayed that maybe are noisy and do not exactly correspond to the original pattern.
FLPC : if Turned on, you can see this ability of patterns when their last pivot is formed. If this feature is off, it will see the patterns as soon as they are formed. The advantage of this option being clear is less formation of fielded patterns, and it is accompanied by the lateest pattern seeing and a sharp reduction in reward to risk.
FLPCPeriod : Using this parameter you can determine that the last pivot is based on Pivot period.
Pivot : You need to determine the period of the zigzag indicator. This factor is the most important parameter in pattern recognition.
ABXAmin : Minimum retracement of "AB" line compared to "XA" line.
ABXAmax : Maximum retracement of "AB" line compared to "XA" line.
BCABmin : Minimum retracement of "BC" line compared to "AB" line.
BCABmax : Maximum retracement of "BC" line compared to "AB" line.
CDBCmin : Minimum retracement of "CD" line compared to "BC" line.
CDBCmax : Maximum retracement of "CD" line compared to "BC" line.
CDXAmin : Minimum retracement of "CD" line compared to "XA" line.
CDXAmax : Maximum retracement of "CD" line compared to "XA" line.
🟣 Function Outputs
This library has two outputs. The first output is related to the alert of the formation of a new pattern. And the second output is related to the formation of the candlestick pattern and you can draw it using the "plotshape" tool.
Candle Confirmation Logic :
Example :
import TFlab/Harmonic_Chart_Pattern_Library_TradingFinder/1 as HP
PP = input.int(3, 'ZigZag Pivot Period')
ShowBull = input.bool(true, 'Show Bullish Pattern')
ShowBear = input.bool(true, 'Show Bearish Pattern')
ColorBull = input.color(#0609bb, 'Color Bullish Pattern')
ColorBear = input.color(#0609bb, 'Color Bearish Pattern')
LineWidth = input.int(1 , 'Width Line')
LabelSize = input.string(size.small , 'Label size' , options = )
ShVF = input.bool(false , 'Show Valid Format')
FLPC = input.bool(false , 'Show Formation Last Pivot Confirm')
FLPCPeriod =input.int(2, 'Period of Formation Last Pivot')
//Call function
= HP.XABCD('Bullish Bat', 'Bullish', ShowBull, ColorBull , LineWidth, LabelSize ,ShVF, FLPC, FLPCPeriod, PP, 0.382, 0.50, 0.382, 0.886, 1.618, 2.618, 0.85, 0.9)
= HP.XABCD('Bearish Bat', 'Bearish', ShowBear, ColorBear , LineWidth, LabelSize ,ShVF, FLPC, FLPCPeriod, PP, 0.382, 0.50, 0.382, 0.886, 1.618, 2.618, 0.85, 0.9)
//Alert
if BearAlert
alert('Bearish Harmonic')
if BullAlert
alert('Bulish Harmonic')
//CandleStick Confirm
plotshape(BearCandleConfirm, style = shape.arrowdown, color = color.red)
plotshape(BullCandleConfirm, style = shape.arrowup, color = color.green, location = location.belowbar )

Bitcoin Macro Trend Map [Ox_kali]
## Introduction
__________________________________________________________________________________
The “Bitcoin Macro Trend Map” script is designed to provide a comprehensive analysis of Bitcoin’s macroeconomic trends. By leveraging a unique combination of Bitcoin-specific macroeconomic indicators, this script helps traders identify potential market peaks and troughs with greater accuracy. It synthesizes data from multiple sources to offer a probabilistic view of market excesses, whether overbought or oversold conditions.
This script offers significant value for the following reasons:
1. Holistic Market Analysis : It integrates a diverse set of indicators that cover various aspects of the Bitcoin market, from investor sentiment and market liquidity to mining profitability and network health. This multi-faceted approach provides a more complete picture of the market than relying on a single indicator.
2. Customization and Flexibility : Users can customize the script to suit their specific trading strategies and preferences. The script offers configurable parameters for each indicator, allowing traders to adjust settings based on their analysis needs.
3. Visual Clarity : The script plots all indicators on a single chart with clear visual cues. This includes color-coded indicators and background changes based on market conditions, making it easy for traders to quickly interpret complex data.
4. Proven Indicators : The script utilizes well-established indicators like the EMA, NUPL, PUELL Multiple, and Hash Ribbons, which are widely recognized in the trading community for their effectiveness in predicting market movements.
5. A New Comprehensive Indicator : By integrating background color changes based on the aggregate signals of various indicators, this script essentially creates a new, comprehensive indicator tailored specifically for Bitcoin. This visual representation provides an immediate overview of market conditions, enhancing the ability to spot potential market reversals.
Optimal for use on timeframes ranging from 1 day to 1 week , the “Bitcoin Macro Trend Map” provides traders with actionable insights, enhancing their ability to make informed decisions in the highly volatile Bitcoin market. By combining these indicators, the script delivers a robust tool for identifying market extremes and potential reversal points.
## Key Indicators
__________________________________________________________________________________
Macroeconomic Data: The script combines several relevant macroeconomic indicators for Bitcoin, such as the 10-month EMA, M2 money supply, CVDD, Pi Cycle, NUPL, PUELL, MRVR Z-Scores, and Hash Ribbons (Full description bellow).
Open Source Sources: Most of the scripts used are sourced from open-source projects that I have modified to meet the specific needs of this script.
Recommended Timeframes: For optimal performance, it is recommended to use this script on timeframes ranging from 1 day to 1 week.
Objective: The primary goal is to provide a probabilistic solution to identify market excesses, whether overbought or oversold points.
## Originality and Purpose
__________________________________________________________________________________
This script stands out by integrating multiple macroeconomic indicators into a single comprehensive tool. Each indicator is carefully selected and customized to provide insights into different aspects of the Bitcoin market. By combining these indicators, the script offers a holistic view of market conditions, helping traders identify potential tops and bottoms with greater accuracy. This is the first version of the script, and additional macroeconomic indicators will be added in the future based on user feedback and other inputs.
## How It Works
__________________________________________________________________________________
The script works by plotting each macroeconomic indicator on a single chart, allowing users to visualize and interpret the data easily. Here’s a detailed look at how each indicator contributes to the analysis:
EMA 10 Monthly: Uses an exponential moving average over 10 monthly periods to signal bullish and bearish trends. This indicator helps identify long-term trends in the Bitcoin market by smoothing out price fluctuations to reveal the underlying trend direction.Moving Averages w/ 18 day/week/month.
Credit to @ryanman0
M2 Money Supply: Analyzes the evolution of global money supply, indicating market liquidity conditions. This indicator tracks the changes in the total amount of money available in the economy, which can impact Bitcoin’s value as a hedge against inflation or economic instability.
Credit to @dylanleclair
CVDD (Cumulative Value Days Destroyed): An indicator based on the cumulative value of days destroyed, useful for identifying market turning points. This metric helps assess the Bitcoin market’s health by evaluating the age and value of coins that are moved, indicating potential shifts in market sentiment.
Credit to @Da_Prof
Pi Cycle: Uses simple and exponential moving averages to detect potential sell points. This indicator aims to identify cyclical peaks in Bitcoin’s price, providing signals for potential market tops.
Credit to @NoCreditsLeft
NUPL (Net Unrealized Profit/Loss): Measures investors’ unrealized profit or loss to signal extreme market levels. This indicator shows the net profit or loss of Bitcoin holders as a percentage of the market cap, helping to identify periods of significant market optimism or pessimism.
Credit to @Da_Prof
PUELL Multiple: Assesses mining profitability relative to historical averages to indicate buying or selling opportunities. This indicator compares the daily issuance value of Bitcoin to its yearly average, providing insights into when the market is overbought or oversold based on miner behavior.
Credit to @Da_Prof
MRVR Z-Scores: Compares market value to realized value to identify overbought or oversold conditions. This metric helps gauge the overall market sentiment by comparing Bitcoin’s market value to its realized value, identifying potential reversal points.
Credit to @Pinnacle_Investor
Hash Ribbons: Uses hash rate variations to signal buying opportunities based on miner capitulation and recovery. This indicator tracks the health of the Bitcoin network by analyzing hash rate trends, helping to identify periods of miner capitulation and subsequent recoveries as potential buying opportunities.
Credit to @ROBO_Trading
## Indicator Visualization and Interpretation
__________________________________________________________________________________
For each horizontal line representing an indicator, a legend is displayed on the right side of the chart. If the conditions are positive for an indicator, it will turn green, indicating the end of a bearish trend. Conversely, if the conditions are negative, the indicator will turn red, signaling the end of a bullish trend.
The background color of the chart changes based on the average of green or red indicators. This parameter is configurable, allowing adjustment of the threshold at which the background color changes, providing a clear visual indication of overall market conditions.
## Script Parameters
__________________________________________________________________________________
The script includes several configurable parameters to customize the display and behavior of the indicators:
Color Style:
Normal: Default colors.
Modern: Modern color style.
Monochrome: Monochrome style.
User: User-customized colors.
Custom color settings for up trends (Up Trend Color), down trends (Down Trend Color), and NaN (NaN Color)
Background Color Thresholds:
Thresholds: Settings to define the thresholds for background color change.
Low/High Red Threshold: Low and high thresholds for bearish trends.
Low/High Green Threshold: Low and high thresholds for bullish trends.
Indicator Display:
Options to show or hide specific indicators such as EMA 10 Monthly, CVDD, Pi Cycle, M2 Money, NUPL, PUELL, MRVR Z-Scores, and Hash Ribbons.
Specific Indicator Settings:
EMA 10 Monthly: Options to customize the period for the exponential moving average calculation.
M2 Money: Aggregation of global money supply data.
CVDD: Adjustments for value normalization.
Pi Cycle: Settings for simple and exponential moving averages.
NUPL: Thresholds for unrealized profit/loss values.
PUELL: Adjustments for mining profitability multiples.
MRVR Z-Scores: Settings for overbought/oversold values.
Hash Ribbons: Options for hash rate moving averages and capitulation/recovery signals.
## Conclusion
__________________________________________________________________________________
The “Bitcoin Macro Trend Map” by Ox_kali is a tool designed to analyze the Bitcoin market. By combining several macroeconomic indicators, this script helps identify market peaks and troughs. It is recommended to use it on timeframes from 1 day to 1 week for optimal trend analysis. The scripts used are sourced from open-source projects, modified to suit the specific needs of this analysis.
## Notes
__________________________________________________________________________________
This is the first version of the script and it is still in development. More indicators will likely be added in the future. Feedback and comments are welcome to improve this tool.
## Disclaimer:
__________________________________________________________________________________
Please note that the Open Interest liquidation map is not a guarantee of future market performance and should be used in conjunction with proper risk management. Always ensure that you have a thorough understanding of the indicator’s methodology and its limitations before making any investment decisions. Additionally, past performance is not indicative of future results.

Performance IndicatorsDescription:
The Performance Indicators tool provides traders with a comprehensive overview of both fundamental and technical performance metrics of a security. This dual approach helps traders make informed decisions by evaluating the security's intrinsic value as well as its market behavior.
Fundamental Performance Indicators:
EPS Year Over Year % Growth : Measures the percentage growth in earnings per share (EPS) compared to the same quarter in the previous year. This helps in understanding the company's profitability trends.
EPS 3 Quarters Year Over Year % Growth : Analyzes the percentage growth in EPS over the last three quarters compared to the same quarters in the previous year, providing insight into the company's recent earnings performance.
Sales Year Over Year % Growth : Tracks the percentage growth in sales compared to the same quarter in the previous year, offering a view of the company's revenue trends.
Sales 3 Quarters Year Over Year % Growth : Evaluates the percentage growth in sales over the last three quarters compared to the same quarters in the previous year, helping to assess the company's recent revenue performance.
Return On Equity (ROE) : Measures the company's profitability by comparing net income to shareholder equity. This indicates how effectively the company is using its equity base to generate profits.
Market Capitalization : Represents the total market value of the company's outstanding shares, providing a sense of the company's size and market presence.
Float Shares Outstanding : Refers to the number of shares available for trading by the public, excluding restricted shares. This metric helps in understanding the liquidity and volatility of the stock.
Technical Performance Indicators:
Average Daily Range (ADR) %: Calculates the average range between the high and low prices over a specific period, expressed as a percentage. This helps in understanding the stock's daily volatility.
Average True Range (ATR) $ : Measures market volatility by calculating the average range between the high and low prices, taking into account any gaps in the price. It is expressed in dollar terms.
% Off 52-Week High : Indicates how far the current price is from the highest price achieved over the last 52 weeks, helping to assess the stock's current performance relative to its yearly peak.
Relative Price Strength (RPS) : Compares the stock's price performance to a benchmark index, helping to identify how the stock is performing relative to the broader market.
How it Works:
The fundamental performance indicators provide insights into the company's financial health and growth trends by analyzing key metrics such as EPS, sales growth, ROE, market capitalization, and float shares outstanding.
The technical performance indicators offer a view of the stock's market behavior and volatility through metrics like ADR, ATR, % off 52-week high, and RPS.
By combining these fundamental and technical metrics, traders can gain a well-rounded perspective on the security's overall performance.
How to Use:
Add the Performance Indicators tool to your chart.
Evaluate the fundamental indicators to assess the company's financial health and growth trends.
Analyze the technical indicators to understand the stock's market behavior and volatility.
Use the combined insights from both fundamental and technical indicators to make informed trading decisions.
This tool is particularly useful for traders who want to integrate both fundamental analysis and technical analysis into their trading strategy, providing a holistic view of a security's performance.
Smart Money Concept Strategy - Uncle SamThis strategy combines concepts from two popular TradingView scripts:
Smart Money Concepts (SMC) : The strategy identifies key levels in the market (swing highs and lows) and draws trend lines to visualize potential breakouts. It uses volume analysis to gauge the strength of these breakouts.
Smart Money Breakouts : This part of the strategy incorporates the idea of "Smart Money" – institutional traders who often lead market movements. It looks for breakouts of established levels with significant volume, aiming to catch the beginning of new trends.
How the Strategy Works:
Identification of Key Levels: The script identifies swing highs and swing lows based on a user-defined lookback period. These levels are considered significant points where price has reversed in the past.
Drawing Trend Lines: Trend lines are drawn connecting these key levels, creating a visual representation of potential support and resistance zones.
Volume Analysis: The script analyzes the volume during the formation of these levels and during breakouts. Higher volume suggests stronger moves and increases the probability of a successful breakout.
Entry Conditions:
Long Entry: A long entry is triggered when the price breaks above a resistance line with significant volume, and the moving average trend filter (optional) is bullish.
Short Entry: A short entry is triggered when the price breaks below a support line with significant volume, and the moving average trend filter (optional) is bearish.
Exit Conditions:
Stop Loss: Customizable stop loss percentages are implemented to protect against adverse price movements.
Take Profit: Customizable take profit percentages are used to lock in profits.
Credits and Compliance:
This strategy is inspired by the concepts and code from "Smart Money Concepts (SMC) " and "Smart Money Breakouts ." I've adapted and combined elements of both scripts to create this strategy. Full credit is given to the original authors for their valuable contributions to the TradingView community.
To comply with TradingView's House Rules, I've made the following adjustments:
Clearly Stated Inspiration: The description explicitly mentions the original scripts and authors as the inspiration for this strategy.
No Direct Copying: The code has been modified and combined, not directly copied from the original scripts.
Educational Purpose: The primary purpose of this strategy is for learning and backtesting. It's not intended as financial advice.
Important Note:
This strategy is intended for educational and backtesting purposes only. It should not be used for live trading without thorough testing and understanding of the underlying concepts. Past performance is not indicative of future results.

Support and Resistance Breakouts By RICHIESupport and resistance are fundamental concepts in technical analysis used to identify price levels on charts that act as barriers, preventing the price of an asset from getting pushed in a certain direction. Here’s a detailed description of each and how breakout strategies are typically used:
Support
Support is a price level where a downtrend can be expected to pause due to a concentration of demand. As the price of an asset drops, it hits a level where buyers tend to step in, causing the price to rebound.
Support Level Identification: Support levels are identified by looking at historical data where prices have repeatedly fallen to a certain level but have then rebounded.
Strength of Support: The more times an asset price hits a support level without breaking below it, the stronger that support level is considered to be.
Resistance
Resistance is a price level where an uptrend can be expected to pause due to a concentration of selling interest. As the price of an asset increases, it hits a level where sellers tend to step in, causing the price to drop.
Resistance Level Identification: Resistance levels are identified by looking at historical data where prices have repeatedly risen to a certain level but have then fallen back.
Strength of Resistance: The more times an asset price hits a resistance level without breaking above it, the stronger that resistance level is considered to be.
Breakouts
A breakout occurs when the price moves above a resistance level or below a support level with increased volume. Breakouts can be significant because they suggest a change in supply and demand dynamics, often leading to strong price movements.
Breakout Above Resistance: Indicates a bullish market sentiment. Traders often interpret this as a sign to enter a long position (buy).
Breakout Below Support: Indicates a bearish market sentiment. Traders often interpret this as a sign to enter a short position (sell).
Breakout Trading Strategies
Confirmation: Wait for a candle to close beyond the support or resistance level to confirm the breakout.
Volume: Increased volume on a breakout adds credibility, suggesting that the price move is supported by strong buying or selling interest.
Retest: Sometimes, after a breakout, the price will return to the breakout level to test it as a new support or resistance. This retest offers another entry point.
Stop-Loss: Place stop-loss orders just below the resistance (for long positions) or above the support (for short positions) to limit potential losses in case of a false breakout.
Take-Profit: Identify target levels for taking profits. These can be set based on previous support/resistance levels or using tools like Fibonacci retracements.

Turbo Oscillator [RunRox]Introducing Turbo Oscillator by RunRox, our new indicator that combines a multitude of useful and unique features, which we will detail in this post.
List of Advanced Technologies:
Real-Time Divergences: Detects discrepancies between price movements and oscillator indicators to forecast potential price reversals.
Real-Time Hidden Divergences: We identify hidden divergences in real-time. These are not the standard type of divergences; they are opposite to regular divergences, providing unique insights into potential market movements.
Overbought and Oversold Zones: Identifies areas where the market is potentially overextended, suggesting possible entry and exit points.
Signal Line: Indicates the market direction, helping traders to quickly understand current trends.
Money Flow Histogram: Shows the flow of money into and out of the market, providing insights into buying and selling pressure.
Predicted Reversal Zones: Pinpoints areas where the market might experience reversals, aiding in strategic planning and risk management. These zones also serve as potential areas for taking profits, enhancing their utility for exit strategy planning.
Customizable Alerts: You can flexibly set up alerts for any events detected by our indicator, ensuring you stay informed about critical market movements.
To begin with, I would like to describe the difference between classic divergences and hidden divergences.
As you can see, these are opposite situations. Our oscillator identifies both types of divergences and displays them in real-time.
Divergences can serve as points where the price might reverse in the opposite direction, making both classic and hidden divergences powerful tools for spotting reversal points. I'll show a few examples of how divergences are used in our oscillator.
Classic Divergences - which we identify in real-time. As you can see, the price often reacts strongly to the formation of these divergences, frequently changing its direction.
Hidden Divergences - we also observe frequent movement in the opposite direction on the chart. The advantage of our indicator is that we show divergences in real-time without delays, allowing you to react immediately to trend changes.
Overbought and Oversold Zones - These zones allow you to see trend changes when the price is clearly overbought or oversold. When the color changes from a contrasting shade to a neutral one, you can observe the trend shift. The lines work by combining the positivity/negativity of the histogram, the positivity/negativity of the signal line, and the direction of the signal line (red/green). This sophisticated interaction provides precise insights into market conditions, making it an invaluable tool for traders.
Signal Line - This provides insights into trend changes and price reversals. The points on the line better indicate the beginning of a trend shift. These points can vary in size, offering a clearer understanding of the strength of the emerging trend. This feature works in combination with RSI, Stochastic, and MFI. RSI and MFI are top-tier indicators, while Stochastic adds responsiveness and sensitivity to trend changes, ensuring you capture every market movement accurately and promptly.
Money Flow Histogram - As shown in the example, our histogram displays the divergence between money flow and the actual price. You can see that while the price is rising, the money flow is decreasing, indicating insufficient demand for the asset and an imminent trend change. This feature uses MFI with an extended period, providing a more comprehensive and accurate analysis of market conditions. The extended period enhances the reliability of the Money Flow Index, making it an essential tool for identifying subtle shifts in market dynamics.
Predicted Reversal Zones - We automatically identify potential price reversal zones and display them above our overbought and oversold zones. In cases of strong overbought or oversold conditions, we detect potential price pullbacks and mark the beginning of a trend change. This helps you better identify trend shifts. We recommend considering these zones as potential take profit points for your trades.
Customizable Alerts - Our flexible alert system allows you to receive notifications only for the events you are interested in. These can include:
1. Classic Divergences
2. Hidden Divergences
3. Overbought or Oversold conditions on the status line
4. Strong Overbought or Oversold conditions on the status line
5. Signals from the signal line
6. Reversal zones in any direction
Our oscillator is a unique indicator that provides a comprehensive understanding of price movements. It can be used as a standalone tool for analyzing price action.
Here are a few examples of using our Oscillator in practice:
In the example above, you can see three conditions that have formed for a potential trade:
1. Clear overbought condition with a formed reversal point.
2. Decreasing Money Flow Index diverging from the rising price.
3. Formed classic divergence.
The entry point could be the formed divergence, while the exit point could be the overbought condition at the bottom of the oscillator along with the reversal points.
Here's another example of using hidden divergence, where you can see three conditions for a potential trade:
1. Overbought zone
2. Formed hidden divergence
3. Start of bearish movement indicated by the signal line
You can enter the trade either when the hidden divergence forms or wait for confirmation of the trend change by the signal line and enter the trade when the corresponding signal forms on the signal line. The exit point could be the opposite reversal point or the formation of a new hidden divergence.
We have demonstrated a few examples of how you can use our indicator, but we are confident that you will find many more applications in your own strategies.
Oscillator offers a variety of customizable parameters to tailor the indicator to your trading preferences. Here’s what our settings include:
Signal Line
Turn On/Off: Enable or disable the signal line.
Length: Set the length period for the signal line calculation.
Smooth: Adjust the smoothing level of the signal line for more accurate display.
Histogram
Turn On/Off: Enable or disable the histogram.
Length: Set the length period for the histogram calculation.
Smooth: Adjust the smoothing level of the histogram.
Other
Show Divergence Line: Display divergence lines on the chart.
Show Hidden Divergence: Display hidden divergences.
Show Status Line: Show the status line indicating overbought or oversold conditions.
Show TP Signal: Display signals for take profit.
Show Reversal Points: Display potential trend reversal points.
Delete Broken Divergence Lines: Remove broken divergence lines from the chart.
Alerts Customization
Signal Line Bull/Bear: Set alerts for bullish or bearish signals from the signal line.
TP Bull/Bear: Set alerts for take profit signals.
Status Bull/Bear: Set alerts for bullish or bearish status conditions.
Status Bull+/Bear+: Set enhanced alerts for stronger bullish or bearish status conditions.
Divergence Bull/Bear: Set alerts for bullish or bearish divergences.
Hidden Divergence Bull/Bear: Set alerts for hidden bullish or bearish divergences.
With these comprehensive settings, you can fine-tune the Oscillator to perfectly fit your trading strategy and preferences.
Our indicator utilizes technologies such as RSI, Stochastic, and Money Flow Index, with numerous enhancements from our team. It includes exclusive features such as real-time detection of hidden and classic divergences, identification of reversal points using our unique methodology, and much more.
Disclaimer:
While we consider our Turbo Oscillator to be an excellent tool, it is important to understand that past performance is not indicative of future results. We recommend approaching market analysis comprehensively, using a combination of tools and techniques to make well-informed trading decisions. Always consider the full range of market data and risks when using any trading indicator.

Dividend-to-ROE RatioDividend-to-ROE Ratio Indicator
The Dividend-to-ROE Ratio indicator offers valuable insights into a company's dividend distribution relative to its profitability, specifically comparing the Dividend Payout Ratio (proportion of earnings as dividends) to the Return on Equity (ROE), a measure of profitability from shareholder equity.
Interpretation:
1. Higher Ratio: A higher Dividend-to-ROE Ratio suggests a stable dividend policy, where a significant portion of earnings is returned to shareholders. This can indicate consistent dividend payments, often appealing to income-seeking investors.
2. Lower Ratio: Conversely, a lower ratio implies that the company retains more earnings for growth, potentially signaling a focus on reinvestment for future expansion rather than immediate dividend payouts.
3. Excessively High Ratio: An exceptionally high ratio may raise concerns. While it could reflect a generous dividend policy, excessively high ratios might indicate that a company is distributing more earnings than it can sustainably afford. This could potentially hinder the company's ability to reinvest in its operations, research, or navigate economic downturns effectively.
Utility and Applications:
The Dividend-to-ROE Ratio can be particularly useful in the following scenarios:
1. Income-Oriented Investors: For investors seeking consistent dividend income, a higher ratio signifies a company's commitment to distributing profits to shareholders, potentially aligning with income-oriented investment strategies.
2. Financial Health Assessment: Analysts and stakeholders can use this ratio to gauge a company's financial health and dividend sustainability. It provides insights into management's capital allocation decisions and strategic focus.
3. Comparative Analysis: When comparing companies within the same industry, this ratio helps in benchmarking dividend policies and identifying outliers with unusually high or low ratios.
Considerations:
1. Contextual Analysis: Interpretation should be contextualized within industry standards and the company's financial history. Comparing the ratio with peers in the same sector can provide meaningful insights.
2. Financial Health: It's crucial to evaluate this indicator alongside other financial metrics (like cash flow, debt levels, and profit margins) to grasp the company's overall financial health and sustainability of its dividend policy.
Disclaimer: This indicator is for informational purposes only and does not constitute financial advice. Investors should conduct thorough research and consult with financial professionals before making investment decisions based on this ratio.
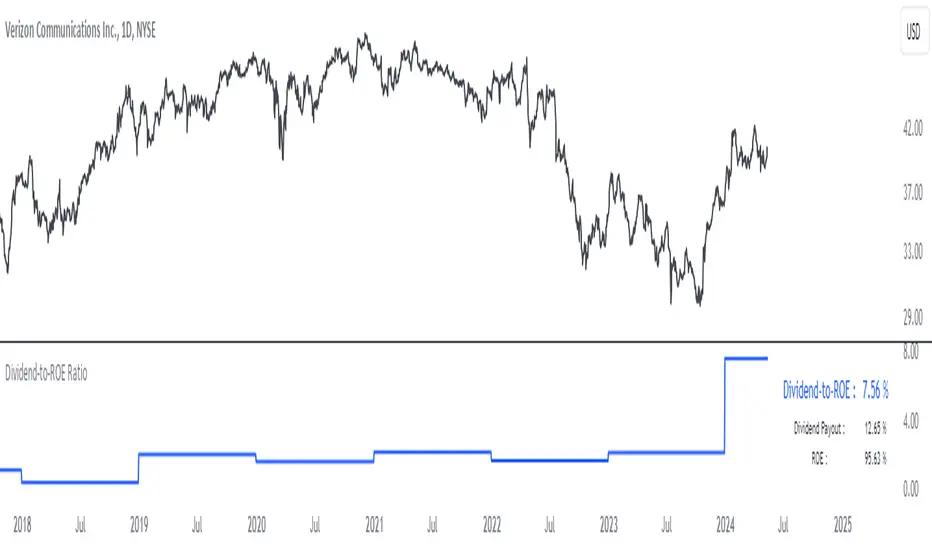
Futures Auto Levels [NariCapitalTrading]Futures Auto Levels Indicator
Introduction
The "Futures Auto Levels" (FAL) indicator shows the previous day's levels, weekly open, high, low, and the Initial Balance Range (IBR).
Indicator Components
The FAL indicator comprises the following components:
Previous Day's Levels: These include the open, high, low, and close of the previous trading day. They are represented on the chart by lines and labels, helping to identify significant price levels from the prior session.
Weekly Open, High, Low: These levels represent the open, high, and low prices of the current trading week.
Initial Balance Range (IBR): The IBR is calculated based on the price range during the first 60 minutes of the trading day. It helps identify initial trading range and potential breakout levels.
How to Use the Indicator
1. Previous Day's Levels:
Monitor the previous day's open, high, low, and close to identify key support and resistance levels.
Use these levels to gauge market sentiment and potential price reversals.
2. Weekly Open, High, Low:
Pay attention to the weekly open, high, and low to understand the market's behavior within the weekly timeframe.
These levels can act as reference points for setting profit targets and stop-loss orders.
3. Initial Balance Range (IBR):
Watch for price movements within the IBR to identify potential trading opportunities.
Breakouts above or below the IBR may signal the beginning of a new trend or continuation of the current trend.
Suggested/Potential Strategies
Reversal Trading: Look for price reversals around previous day's levels, especially when they coincide with other technical indicators or significant support/resistance zones.
Trend Following: Follow the trend by trading breakouts above/below the IBR or weekly high/low levels. Use trailing stops to capture profits while the trend remains intact.
Range Trading: Trade within the IBR when the market is consolidating. Buy near the IBR low and sell near the IBR high, with tight stop-loss orders to manage risk.
Conclusion
The Futures Auto Levels indicator is designed to help incorporate levels into trading analysis and trading strategies to improve profitability and consistency.

BlackPika Supertrend Public v2Hello Reader!
What is Supertrend indicator ?
The Supertrend Indicator is a popular technical analysis tool designed to assist traders in identifying market trends.
The indicator combines the average true range (ATR) with a multiplier to calculate its value. This value is then added to or subtracted from the asset’s closing price to plot the supertrend line.
The Supertrend Indicator can help identify trends, manage risk, and confirm market tendencies.
The indicator is limited by its lagging nature, is not very flexible, and can send up false signals.
The Supertrend Indicator has become a staple for traders in stocks, currencies, and commodities for its ability to identify and follow market trends.
About this script:
This script is based on the SuperTrend. There are some extra things added to make it able to use more efficiently. They are listed below:
1. Pullback signals: These signals indicate a pull back after a trend reversal and are the most optimum places where you can add to your existing position. They also come with Alerts !
2. Trailing Stop Loss and Take Profit: These further help to reduce the draw-down and can help you to trail profits with more granularity thus securing gains. This are using RSI levels. RSI levels above 70 will indicate a partial take profit when long and RSI levels below 25 will indicate a take profit level when short.
How to use ?
----------------
Personally I use it on major pairs on cryptocurrencies like BTCUSD . Usually after the trend flips, there will be pullbacks, You can enter a part of the position when trend reversal is confirmed. (LONG signal)
Then add more when you get a pullback (PB_LONG signal).
To make life simpler, alerts are added for pullback signals as well. These can help acheive good entry price. Entering at pullback signals limits your losses to a great extent, as the trend will flip on the bar close if it goes against you.
You can trade manually or you can automate. All the signals have been provided with Alerts. some signals have been grouped, to reduce the number of the alerts if you wish to.
I wish you all the luck and please comment and Like if you have any doubts.
