Best MA Pair Finder (Crossover Strategy)This indicator automatically identifies the optimal pair of moving averages (MAs) for a crossover strategy using all available historical data. It offers several MA options—including SMA, EMA, and TEMA—allowing users to select the desired type in the settings. The indicator supports two strategy modes: “Long Only” and “Buy & Sell”, which can be chosen via the options.
For each MA pair combination, the indicator performs a backtest and calculates the profit factor, considering only those pairs where the total number of trades meets or exceeds the user-defined "Minimum Trades" threshold. This parameter ensures that the selected optimal pair is based on a statistically meaningful sample rather than on a limited number of trades.
The results provided by this indicator are based on historical data and backtests, which may not guarantee future performance. Users should conduct their own analysis and use proper risk management before making trading decisions.
Cari skrip untuk "profit factor"

TQQQ TradingThis script presents a specialized approach to trading TQQQ using a combination of significant price drops and trend confirmation methods. It identifies potential buying opportunities when TQQQ experiences a substantial correction (15% drop from recent highs) while maintaining strong underlying trend characteristics.
Key Features :
Identifies and measures significant price drops from recent highs
Checks multi-timeframe momentum
Implements a dynamic stop-loss that raises every day
Provides comprehensive trade statistics including win rate, profit factor, and average hold time
The strategy aims to capitalize on TQQQ's leveraged nature by entering during significant corrections when trend conditions remain favorable, rather than trying to catch every minor movement.
Note: This indicator is specifically designed for TQQQ on the daily timeframe

Supply and Demand RebalancingPlease do not use this rudimentary script to lose money. As far as I can tell it has ZERO EDGE on its own.
Supply and Demand Pattern Detection Script
Overview
This script identifies potential supply and demand zones by detecting a specific double-wick pattern formation. It's designed as an educational tool and research aid for traders interested in price action and supply/demand concepts.
Pattern Detection
Looks for consecutive candles with long wicks (tails) that align with each other
The wicks must be larger than a specified percentile of recent wick lengths
The candle bodies must be relatively small compared to their wicks
Volume and volatility filters can be optionally applied
Higher timeframe trend confirmation is available as an optional filter
Visual Aids
Green triangles appear when a long setup is detected
Red triangles appear when a short setup is detected
Boxes show the risk zone (red) and reward zone (green)
Boxes extend until the trade reaches either its target or stop loss
A performance table shows win rate and profit factor statistics
Key Settings
1. Pattern Detection:
Wick Alignment Tolerance: How closely the wicks need to align
Min Wick Length Percentile: Minimum size requirement for wicks
Max Body/Wick Ratio: Controls maximum candle body size relative to wick
2. Additional Filters:
Volume Filter: Optional volume confirmation
ATR Filter: Optional volatility confirmation
Higher Timeframe Confirmation: Optional trend alignment
3. Trade Parameters:
Risk/Reward Ratio: Default 2:1
Bars to Wait for Outcome: How long to track trade results
Important Disclaimers
This is an educational tool and should NOT be used to trade real money without extensive testing and modification. Please do not use this rudimentary script to lose money. As far as I can tell it has zero edge on its own.
Historical backtesting results are not indicative of future performance. The script may miss some valid setups or generate false signals. Trade outcomes are simplified and don't account for:
Slippage
Trading fees
Market liquidity
Gap risk
Real-world execution challenges
Recommended Usage
Use as a learning tool to understand supply/demand concepts
Practice identifying these patterns manually
Paper trade the setups first
Combine with other forms of analysis and risk management
Consider it one tool among many, not a complete trading system
Best Practices
Always use proper risk management
Test thoroughly on demo accounts first
Keep detailed trading logs
Understand why each pattern forms
Study both winning and losing trades to improve pattern recognition
Remember: No trading script can guarantee profits. This tool is meant for educational purposes and should be part of a broader trading education and development process.

DNSE VN301!, SMA & EMA Cross StrategyDiscover the tailored Pinescript to trade VN30F1M Future Contracts intraday, the strategy focuses on SMA & EMA crosses to identify potential entry/exit points. The script closes all positions by 14:25 to avoid holding any contracts overnight.
HNX:VN301!
www.tradingview.com
Setting & Backtest result:
1-minute chart, initial capital of VND 100 million, entering 4 contracts per time, backtest result from Jan-2024 to Nov-2024 yielded a return over 40%, executed over 1,000 trades (average of 4 trades/day), winning trades rate ~ 30% with a profit factor of 1.10.
The default setting of the script:
A decent optimization is reached when SMA and EMA periods are set to 60 and 15 respectively while the Long/Short stop-loss level is set to 20 ticks (2 points) from the entry price.
Entry & Exit conditions:
Long signals are generated when ema(15) crosses over sma(60) while Short signals happen when ema(15) crosses under sma(60). Long orders are closed when ema(15) crosses under sma(60) while Short orders are closed when ema(15) crosses over sma(60).
Exit conditions happen when (whichever came first):
Another Long/Short signal is generated
The Stop-loss level is reached
The Cut-off time is reached (14:25 every day)
*Disclaimers:
Futures Contracts Trading are subjected to a high degree of risk and price movements can fluctuate significantly. This script functions as a reference source and should be used after users have clearly understood how futures trading works, accessed their risk tolerance level, and are knowledgeable of the functioning logic behind the script.
Users are solely responsible for their investment decisions, and DNSE is not responsible for any potential losses from applying such a strategy to real-life trading activities. Past performance is not indicative/guarantee of future results, kindly reach out to us should you have specific questions about this script.
---------------------------------------------------------------------------------------
Khám phá Pinescript được thiết kế riêng để giao dịch Hợp đồng tương lai VN30F1M trong ngày, chiến lược tập trung vào các đường SMA & EMA cắt nhau để xác định các điểm vào/ra tiềm năng. Chiến lược sẽ đóng tất cả các vị thế trước 14:25 để tránh giữ bất kỳ hợp đồng nào qua đêm.
Thiết lập & Kết quả backtest:
Chart 1 phút, vốn ban đầu là 100 triệu đồng, vào 4 hợp đồng mỗi lần, kết quả backtest từ tháng 1/2024 tới tháng 11/2024 mang lại lợi nhuận trên 40%, thực hiện hơn 1.000 giao dịch (trung bình 4 giao dịch/ngày), tỷ lệ giao dịch thắng ~ 30% với hệ số lợi nhuận là 1,10.
Thiết lập mặc định của chiến lược:
Đạt được một mức tối ưu ổn khi SMA và EMA periods được đặt lần lượt là 60 và 15 trong khi mức cắt lỗ được đặt thành 20 tick (2 điểm) từ giá vào.
Điều kiện Mở và Đóng vị thế:
Tín hiệu Long được tạo ra khi ema(15) cắt trên sma(60) trong khi tín hiệu Short xảy ra khi ema(15) cắt dưới sma(60). Lệnh Long được đóng khi ema(15) cắt dưới sma(60) trong khi lệnh Short được đóng khi ema(15) cắt lên sma(60).
Điều kiện đóng vị thể xảy ra khi (tùy điều kiện nào đến trước):
Một tín hiệu Long/Short khác được tạo ra
Giá chạm mức cắt lỗ
Lệnh chưa đóng nhưng tới giờ cut-off (14:25 hàng ngày)
*Tuyên bố miễn trừ trách nhiệm:
Giao dịch hợp đồng tương lai có mức rủi ro cao và giá có thể dao động đáng kể. Chiến lược này hoạt động như một nguồn tham khảo và nên được sử dụng sau khi người dùng đã hiểu rõ cách thức giao dịch hợp đồng tương lai, đã đánh giá mức độ chấp nhận rủi ro của bản thân và hiểu rõ về logic vận hành của chiến lược này.
Người dùng hoàn toàn chịu trách nhiệm về các quyết định đầu tư của mình và DNSE không chịu trách nhiệm về bất kỳ khoản lỗ tiềm ẩn nào khi áp dụng chiến lược này vào các hoạt động giao dịch thực tế. Hiệu suất trong quá khứ không chỉ ra/cam kết kết quả trong tương lai, vui lòng liên hệ với chúng tôi nếu bạn có thắc mắc cụ thể về chiến lược giao dịch này.

Ultimate Oscillator Trading StrategyThe Ultimate Oscillator Trading Strategy implemented in Pine Script™ is based on the Ultimate Oscillator (UO), a momentum indicator developed by Larry Williams in 1976. The UO is designed to measure price momentum over multiple timeframes, providing a more comprehensive view of market conditions by considering short-term, medium-term, and long-term trends simultaneously. This strategy applies the UO as a mean-reversion tool, seeking to capitalize on temporary deviations from the mean price level in the asset’s movement (Williams, 1976).
Strategy Overview:
Calculation of the Ultimate Oscillator (UO):
The UO combines price action over three different periods (short-term, medium-term, and long-term) to generate a weighted momentum measure. The default settings used in this strategy are:
Short-term: 6 periods (adjustable between 2 and 10).
Medium-term: 14 periods (adjustable between 6 and 14).
Long-term: 20 periods (adjustable between 10 and 20).
The UO is calculated as a weighted average of buying pressure and true range across these periods. The weights are designed to give more emphasis to short-term momentum, reflecting the short-term mean-reversion behavior observed in financial markets (Murphy, 1999).
Entry Conditions:
A long position is opened when the UO value falls below 30, indicating that the asset is potentially oversold. The value of 30 is a common threshold that suggests the price may have deviated significantly from its mean and could be due for a reversal, consistent with mean-reversion theory (Jegadeesh & Titman, 1993).
Exit Conditions:
The long position is closed when the current close price exceeds the previous day’s high. This rule captures the reversal and price recovery, providing a defined point to take profits.
The use of previous highs as exit points aligns with breakout and momentum strategies, as it indicates sufficient strength for a price recovery (Fama, 1970).
Scientific Basis and Rationale:
Momentum and Mean-Reversion:
The strategy leverages two well-established phenomena in financial markets: momentum and mean-reversion. Momentum, identified in earlier studies like those by Jegadeesh and Titman (1993), describes the tendency of assets to continue in their direction of movement over short periods. Mean-reversion, as discussed by Poterba and Summers (1988), indicates that asset prices tend to revert to their mean over time after short-term deviations. This dual approach aims to buy assets when they are temporarily oversold and capitalize on their return to the mean.
Multi-timeframe Analysis:
The UO’s incorporation of multiple timeframes (short, medium, and long) provides a holistic view of momentum, unlike single-period oscillators such as the RSI. By combining data across different timeframes, the UO offers a more robust signal and reduces the risk of false entries often associated with single-period momentum indicators (Murphy, 1999).
Trading and Market Efficiency:
Studies in behavioral finance, such as those by Shiller (2003), show that short-term inefficiencies and behavioral biases can lead to overreactions in the market, resulting in price deviations. This strategy seeks to exploit these temporary inefficiencies, using the UO as a signal to identify potential entry points when the market sentiment may have overly pushed the price away from its average.
Strategy Performance:
Backtests of this strategy show promising results, with profit factors exceeding 2.5 when the default settings are optimized. These results are consistent with other studies on short-term trading strategies that capitalize on mean-reversion patterns (Jegadeesh & Titman, 1993). The use of a dynamic, multi-period indicator like the UO enhances the strategy’s adaptability, making it effective across different market conditions and timeframes.
Conclusion:
The Ultimate Oscillator Trading Strategy effectively combines momentum and mean-reversion principles to trade on temporary market inefficiencies. By utilizing multiple periods in its calculation, the UO provides a more reliable and comprehensive measure of momentum, reducing the likelihood of false signals and increasing the profitability of trades. This aligns with modern financial research, showing that strategies based on mean-reversion and multi-timeframe analysis can be effective in capturing short-term price movements.
References:
Fama, E. F. (1970). Efficient Capital Markets: A Review of Theory and Empirical Work. The Journal of Finance, 25(2), 383-417.
Jegadeesh, N., & Titman, S. (1993). Returns to Buying Winners and Selling Losers: Implications for Stock Market Efficiency. The Journal of Finance, 48(1), 65-91.
Murphy, J. J. (1999). Technical Analysis of the Financial Markets: A Comprehensive Guide to Trading Methods and Applications. New York Institute of Finance.
Poterba, J. M., & Summers, L. H. (1988). Mean Reversion in Stock Prices: Evidence and Implications. Journal of Financial Economics, 22(1), 27-59.
Shiller, R. J. (2003). From Efficient Markets Theory to Behavioral Finance. Journal of Economic Perspectives, 17(1), 83-104.
Williams, L. (1976). Ultimate Oscillator. Market research and technical trading analysis.

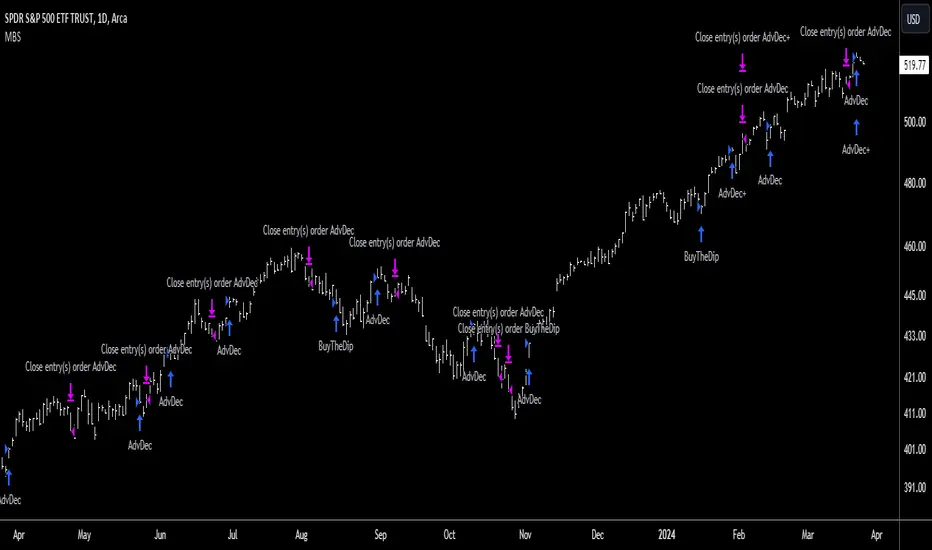
Market Breadth Strategy/Introduction
The Market Breadth Strategy (MBS) is a versatile strategy for trading the US stock market. MBS is suitable for traders with low, medium and high risk tolerance who prefer trading equities as an asset class on the 1 day timeframe. It combines mean reversion with trend following to keep you participating in the stock market for as long as is profitable.
/Signals
The strategy is long only. Four different signals are generated to ensure all opportunities the market presents are seized for profit. The first category of signals are triggered after a prolonged period of falling prices; usually during a bear market or severe correction, open your largest positions on this signal. The second category of signals are triggered at the end of the bear market, early in the recovery. They ensure you do not miss out on an early entry if you get stopped out of your initial positions, size them equal to the first category signal positions. The third category of signals are triggered late in the recovery from a bear market, severe correction or deep pullback. Open your smallest positions on this signal. The fourth category of signals are triggered at all times when the market experiences a significant pullback or time correction, these positions should be medium sized.
For optimum performance, whenever signals are triggered, traders are advised to open at least, a new long position. Buying the index is recommended for traders with low risk tolerance, buying sector, industry or thematic ETFs (after sufficient analysis) is recommended for traders with medium risk tolerance, while buying stocks (after sufficient analysis) is recommended for traders who want to take on higher risk for higher returns. Such traders may also combine positions in indices, groups and individual stocks for better performance.
/Interpretation
MBS will display an upward blue arrow signifying a buy signal after the candle closes. A label below the arrow will describe which signal was triggered and a number depicting the number of positions (they can be deactivated in the style settings). MBS will also display a downwards pink arrow above the candle, after a specified decline from the high, again when the candle closes. All open positions will be closed on this signal, it is the risk management feature of the strategy.
/Construction
The strategy is built using market breadth data from the US Exchanges where stocks are listed, it is not a mash-up of different indicators. A combination of the following data is used:
(i) the number of advancing and declining issues
(ii) the number of issues reaching new highs
(iii) the closing prices of issues relative to key moving averages
This data is analysed and used to generate the four categories of signals described previously, they are named;
(i) Bottom Signal - for buying at the market's potential bottom
(ii) Follow-Up Signal - for ensuring you do not miss the bottom
(iii)Follow-Through Signal - for buying strength after a downtrend
(iv) Buy-The-Dip Signal - for buying throwbacks in uptrends and pullbacks in downtrends
/Settings
This strategy works best with the default settings. Although the input parameters can be changed to suit your needs, it is not advisable to do so as it may affect the strategy's performance.
(i) The market regime filter checks to see if the market is in a regime of rising prices (bull market) or falling prices (bear market), long signals are avoided in bear market conditions.
(ii) The risk size is equivalent to a stop loss. It triggers an exit when price declines by a certain amount.
(iii) 'Downside' measures the participation of issues to the downside during a decline while 'Upside' measures the participation of issues to the upside after the decline; this is called 'follow through'.
(iv) The bottom interval determines the frequency of bottom signals issued in days.
(v) Dip size quantifies the dip to determine if it is large enough for a buy signal, the lower the number, the larger the dip.
(vi) Following interval sets the duration for following up on the bottom.
(vii) Bottoming interval resets the bottom for the next follow-up
/Strategy Results
The backtest results are based on a starting capital of $13,700 (convenient amount for retail traders) with $1000 position size (7% of equity and enough for two shares of SPY) and pyramiding of 10 consecutive positions. Commissions of 0.03% and slippage of 2 ticks are used to ensure the results are representative of real world trading conditions. The backtest results are available to view at the bottom of this page.
Note that past results are not indicative of future results. The strategy is backtested in ideal conditions, it has no predictive abilities and results from live trading may not achieve the 2.235 profit factor shown here as each trader may introduce subjectivity or interfere with its performance or market conditions might change significantly. Since the strategy was designed for the US stock market, it has been backtested on the SPY (representative of the US stock market) ETF (for consistency in price across brokers).
/Tickers
This strategy should be used preferably with the SPY ticker which is the ETF for the S&P500. Alternatively, it could be used with VOO and several other S&P500 ETFs or a CFD ticker such as SPX500USD and several others which are based on the futures product. The strategy may not be suitable for futures tickers like ES according to TradingView.
/Access
The MBS is an Invite-Only script hence, traders interested in this strategy should contact me privately to request access.
Trend Follower Strategy [divonn1994]The Trend Follower Strategy that I made classifies red and green candles into tiny, small, and big sizes and will send buy or sell signals depending on if the candle is classified as "big" so you get into and out of a position when there is a big candle. Out during a big green candle to take profit. Out during a big red candle in case the market is turning down. It also won't enter a position unless there is positive EMA momentum.
For the chart there is a Buy and a Sell signal. Buy = 1, Sell = 0, and when the value crosses above or below 0.5 it will trigger a long position or close the long postion. The graph isn't necessary to the strategy, but can help with visualizing the trade patterns in the past if you like.
This strategy works best so far with BNBUSDT, ETHUSDT, KCSUSDT, HTUSDT, BNBUSDT, BNBBTC, ETHBTC, KCSBTC, LUNABTC, SOLBTC, ADABTC, SANDBTC, HNTBTC, KDABTC.
It can work with other pairings, but these have the healthiest charts in my opinion, as in, the profit factor is high and is greater than a simple buy and hold strategy, and the largest drawdown isn't very high.
Works best on 1 Day charts.

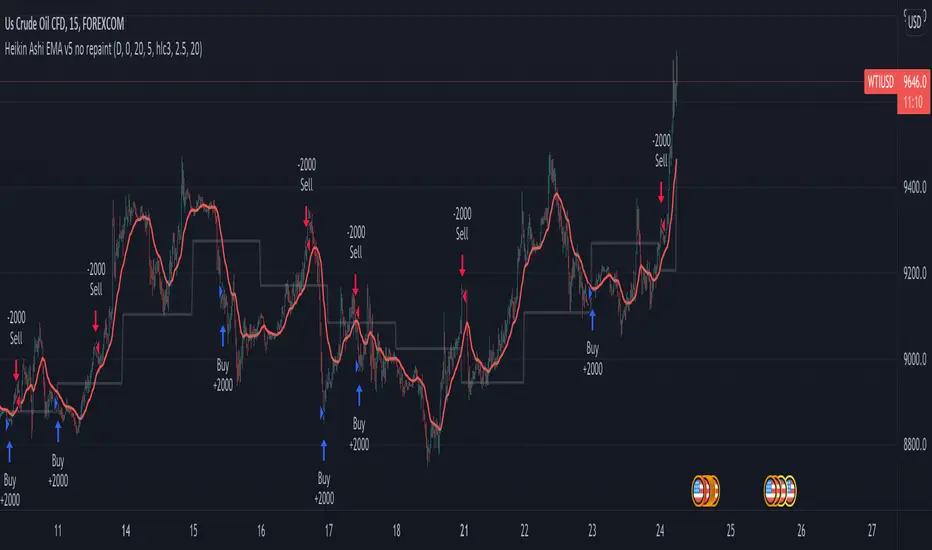
Heikin Ashi EMA v5 no repaint This script was inspired by the "Heikin/Kaufman Strategy" from marco valente built on v2.
The script was rebuilt on the v5 and most importantly removed the repaint function that was driving surrealistic backtesting inflated numbers.
This script is now fully functional and not repainting - At the time of testing worked efficiently 90% WR and 2x profit factor on CFD WTI OIL with a 15m time frame indexed on forex.com price.
You should utilize this script with caution, especially on high volatility cycles you can try plotting against a volatility relative index or stop.
I also strongly recommend understanding the fundamentals of WTI OIL to balance the indications of the strategy with fundamentals.
Thanks to Clovis Warlop and Nilesh Sharma for their contribution.
Cheers,
Gustavo Bramao
GMH : ATH 200d All-Time High Strategy for Tech Stock
In a bull market where valuation is completely neglected. For risk protect we choose a trade set up with stock that is going its break all time high.
Given All-Time High days as input parameter for strategy.
And stoploss by ema crossunder.
Should give decent profit factor for bull run.

EMA RSI ATR Hidden Div Strat - 1 MinHey there!
Hereby I present you the EMA RSI Lowest Low Hidden Divergence strategy, which I discovered on a youtube channel.
He has tested the strategy hundreds of times manually, herewith I try to automate the whole thing.
Since I use the strategy with a bot, it can only enter long positions for now. But in the future I will add the possibility to trade short positions.
The strategy was tested with BTC/ USDT in 1m chart (8 days). The values must be adjusted depending on the timeframe and coin.
-----------------------------------------------------------------------------------
How does the strategy work?
First of all, we need a bullish hidden divergence.
Once this is detected, the following parameters are checked:
The 50 EMA must cross the 250 EMA .
Then, the candle must close above the 50 EMA .
The K line of the RSI STOCH indicator need to crosses the D line.
If the next candle closes above the 50 EMA , a long position is opened.
The stop loss is determined with the "lowest low/highest high lookback".
The profit factor is multiplied by the value of the lowest low/highest high lookback.
The results of the strategy are without commissions and levers.
If you have any questions or feedback, please let me know in the comments.
In the future I will add other types of stop loss / take profits. (ATR; %; eg.)
I wish you good luck with the strategy!

Tripple super Trend + EMA + RSI StrategyGreetings!
Here I show you the Tripple Super Trend Strategy.
I discovered the strategy on a YouTube channel and tried to transfer it as a strategy into a script.
Tested with the currency pair EUR/USD in the one hour chart.
Period: beginning of 2020 until today.
The strategy should also work with cryptocurrencies. But then the settings have to be adjusted.
There is the possibility to activate only long or only short position.
The EMA can be used in a time different from the chart.
-----------------------------------------------------------------------------------
How does the strategy work?
For long positions, the candle must be above the EMA .
The candle must be closed above at least two of the supertrend lines.
The stochastic RSI must show oversold and the k line must cross over the D line.
For short positions, the candle must be below the EMA .
The candle must be closed below at least two of the supertrend lines.
The stochastic RSI must indicate overbought and the K line must cross below the D line.
The stop loss is determined with the "lowest low/highest high lookback".
The profit factor is multiplied by the value of the lowest low/highest high lookback.
The results of the strategy are without commissions and levers.
If you have any questions or feedback, please let me know in the comments.
In the future I will add other types of stop loss / take profits. (ATR; %; eg.)
If you need more information about the strategy and want to know exactly how to apply it, check out my profile.
I wish you good luck with the strategy!

MACD Trendprediction Strategy V1A trend following indicator based on the MACD and EMA. In this case, signals are not generated by crossing the signal lines as with the MACD, but as soon as the distance between the signal lines increases or decreases. A profit factor of 1.6-3.5 is achieved.
Ein Trendfolge-Indikator, auf der Basis des MACD und EMA. Dabei werden Signale nicht wie bei dem MACD per Kreuzung der Signallinien generiert, sondern sobald ein der Abstand der Signallinien zu oder abnimmt.

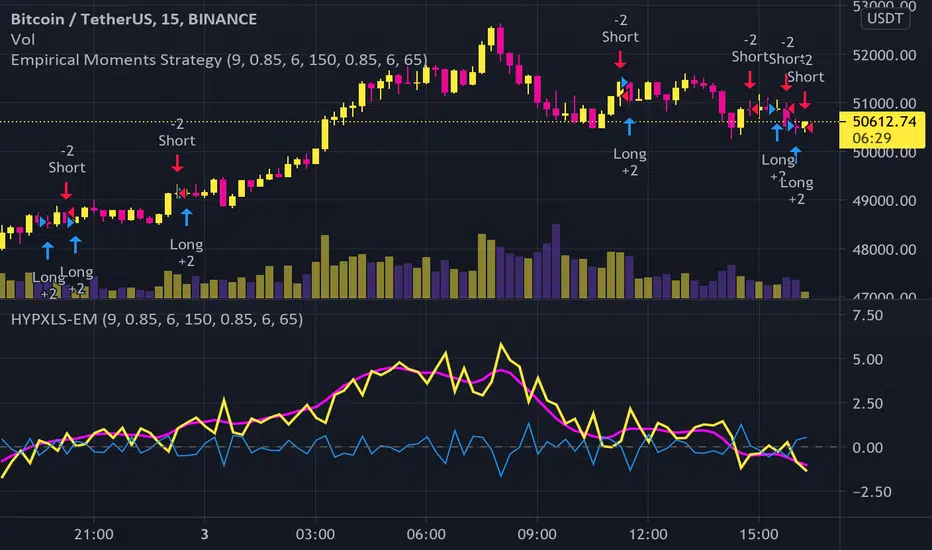
Empirical MomentsBINANCE:BTCUSDT I thought I’d make an indicator for the “fast trader”. This indicator compares the changing high prices with the close prices and in doing so, detects positive “anomalies” (the outlier drift). It gets more complicated than that; the practical indicator is the “empirically weighted drift”, which is a weighted average of the former with its derivatives up to the third order I.e. the “outlier yank”. The empirically weighted drift crossing above and below zero with long and short actions, respectively is used as the strategy. With this strategy, current backtesting for the 15 minute BTCUSDT on the Binance market yields a Sharpe ratio of 1.47 and profit factor of 1.12. Publishing the strategy as well.
Trend Finder V2 StudyStudy version of the script with alert conditions for up and down
Note* The study version will not trigger at the same points the strategy version does due to the strategy limiting the orders to a buy then a sell, back testing didn't seem to change the results to much though
Please experiment with the pyramid function in the strategy script to change how many buy orders can be made in a row before using the alert conditions, a profit factor over 2 is considered good

Phenom 5.3.1This has been a private script until now. I will be sharing it in order to get some feedback until it is ready to be made "invite only"
WHAT IT IS:
This is a scalping method (mostly) that works on nearly all markets and timeframes. THIS IS A BACKTEST SCRIPT! PLAN ACCORDINGLY!
HOW IT WORKS:
This script uses common indicators (5) in non-standard ways. When combined together, they can give fairly accurate results (40-65%) with acceptable Profit Factor ratings (1.7-3+).
This uses CCI, Moving Average, Stochastic, PSAR, and Bollinger Bands.
With these we have 4 base strategies usable.
Each indicator can be disabled (one at a time).
Each indicator has a SL method (stackable).
Each indicator has a TP method (stackable).
BEST RESULTS:
I have received best results as a scalper on 5min or 1HR timeframes. Mostly used on Index CFD's and CRYPTO markets.
NOT RESPONSIBLE FOR MISUSE OR LOST FUNDS! D.Y.O.R

Algonize Pivot Strategy (APS)This study is based on several Price Action parameters of :-
• Pivot Points,
• Higher High and Lower Lows,
• High Low Index ,
• Support and Resistance.
► How To Use This Strategy?
This is a pure scalping strategy and it is advised to use this only with algo trading systems. Due to high trade frequency.
► This Strategy has inbuilt custom time frame backtester, which enables you to test for performance between any date or check for a single day.
► To Create Alerts for algo trading in this strategy simply Check "Activate Algo" from Settings then Create new alert , select your strategy in condition box, and now scroll down to message box and write
{{strategy.order.comment}}
That's it , Just Click on Create Alert Button
Backtest Values Used:-
Initial Capital : 1000000
Order Size (Lots) : 1 (Contract) Lots
Pyramiding : 0 orders
Commission : 0.003%
Sharpe Ratio : 1.741
Profit Factor : 1.174
Test Yourself and give feedback.
PM us to obtain access.

Profit and Stoploss CalculatorThis script is designed to display three stop loss areas to assist either with automation of risk management or identify and alert when price is in a range of a trade for risk to reward ratio.
In this version there are three stop losses and 1 PT. Mainly because i will most likely only be using 1 of the SL to pair with the PT.
Stoploss areas are displayed on both sides of the price for long and short calculations along with the two profit factors but the settings in the indicator it self apply to both sides in terms of percentage.

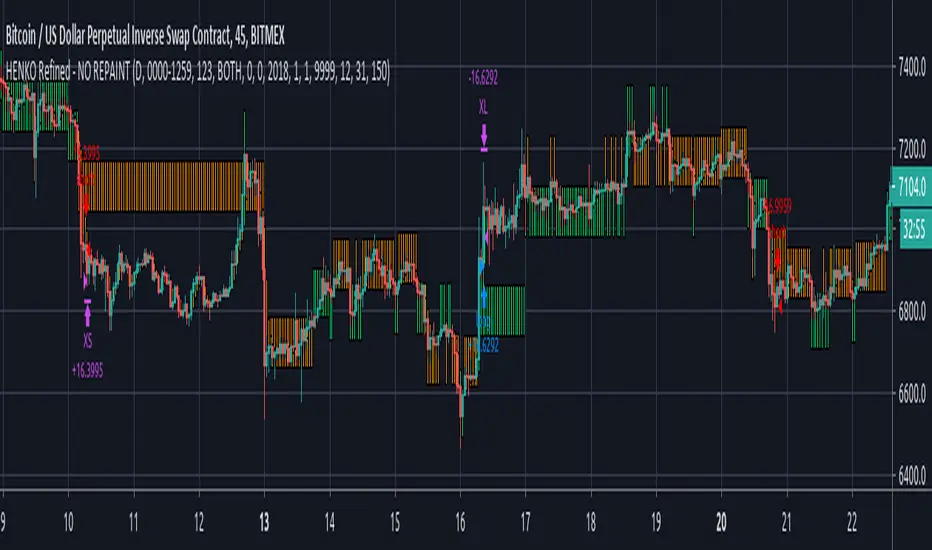
HENKO (Renko + HeikinAshi) -- No RepaintThis particular work is completely mine.
I have not used anyone else's code (not even a fragment).
Parts of the code are used from Open Source library linking to www.investopedia.com and TradingView's example section at www.tradingview.com
The above sources have been used to get Custom Heikin Ashi Candles.
Calculations on Renko bars is completely on me as I have used Daily close and open values to build my own Renko Candles.
Custom Bricksize for Float values has been made available in this public version.
I take no responsibility for the performance of this indicator as I have completely turned off the Repainting in this version of my script.
I am publishing the script for Public use.
I'll be releasing updates for this script in future as the performance is somewhat acceptable.
Profit Factor will decrease with bigger backtest data.
NO REPAINTING issues shall be reported at all costs as the tradingview's default Time based renko has been completely discarded, thus making it rely on its own.
Be advised that as the Renko Bars are calculated at 00:00 UTC, you're not supposed to mess with the timing in the script, unless you're working with Stock markets where it is important that you set your day start and end precisely.
You can play with the Brick Size to see what's more beneficial for you.
No Repaint RENKO
NOTE:= PERFORMANCE OF THIS INDICATOR DEPENDS UPON THE BRICKSIZE OF RENKO BARS.
PivotIntradayStrategy@scorpiomanojFRMThis is an intraday trading strategy using Floor Pivots for BankNifty.
This strategy overlays on the charts with wide variety of drawing floor pivots and previous day levels.
VERY IMPORTANT :
1) LONGS AND SHORTS TO BE TAKEN IN 5 MIN CHART. 15 MIN CHART IS DISPLAYED BECAUSE TV DOESNT ALLOW TO PUBLISH WITH TF LESS THAN 15 MIN.
2) BACKTEST RESULTS ASSUME EXITS AT DAY CLOSE ONLY AND NOT BASED ON ANY OTHER CONDITIONS. HENCE ONCE LONG OR SHORT INITIATED IT IS SUGGESTED TO EXIT USING TRAILING STOP OR YOUR OWN RISK APPETITE. EVEN DAY CLOSE INTRADAY EXITS OFFERS A FAIRLY GOOD RESULT WITH ABOVE AVERAGE SUCCESS RATE AND PROFIT FACTOR IN EXCESS OF 1.75.
3) STRATEGY IS BASED ON COMBINATION OF PATTERNS INVOLVING DAILY PIVOTS AND PREV DAY LEVELS THAT IS FOUND TO REPEAT IN BANKNIFTY.
THE DETAILS OF THE STRATEGY IS CONFIDENTIAL.
4) THIS WILL BE AVAILABLE PUBLICLY ONLY FOR A LIMITED PERIOD. THIS LIMITED PERIOD AVAILABILITY IS TO TEST THE RESULTS AMONG VARIOUS PARTICIPANTS INORDER TO SEE THE CONSISTENCY.
YOU CAN REACH ME AT MY TWITTER ID scorpiomanojfrm or my email scorpiomanojfrm AT gmail DOT com
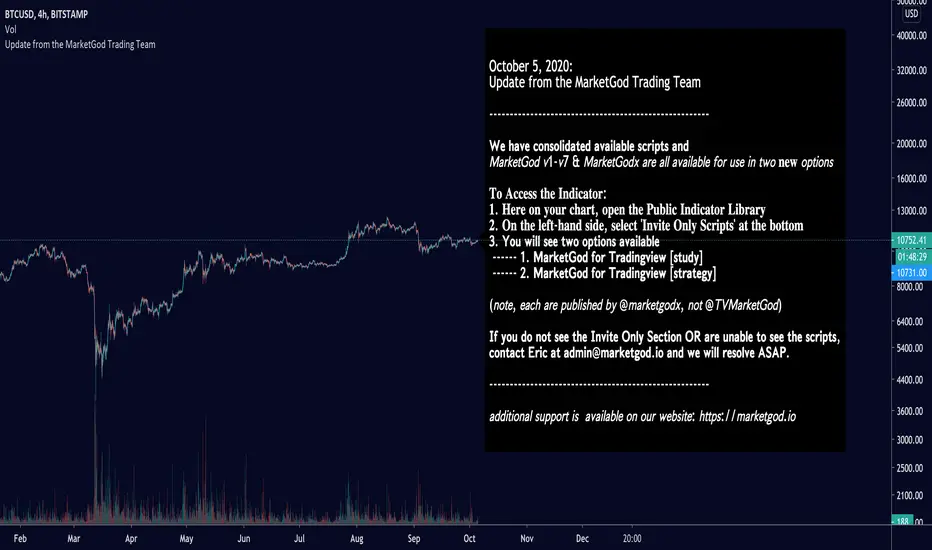
MarketGodv6 Pro//BackTest Strategy//The Backtesting Trader to our Signature MGv6. The results in the table below suggest if one was to start with $1k, and trade with the parameters we've established, the trader would succeed on this timeframe > 70% of the attempted trades, and have a 7x profit factor with their investment for the duration shown here.
You can read about the strategy within the next few days at our website,
marketgod.io
Money Flow AUD/USD 3 DayUsing money flow index combined with relative strength index to pick very close to the tops filtered with an EMA , all parameters can be adjusted to suit any time frame with some fine tuning , set up for a 3 day AUD/USD chart but will work with anything, decent win rate and profit factor, numbers used are enough initial capital to cover twice the amount of contracts, and works best with heikin Ashi chart .

S&P 500 Benchmark Strategy
This strategy is a Benchmark Trend trading strategy. I used it primarily to measure my private algorithms against. It works on a variety of instruments at intervals between 1m and 1d (you'll have to play with some of the ranged variables in these cases). It was primarily designed to trade the 15 minute interval on SPX derived products. S&P E-Mini contract featured above.
It hits what I consider to be key targets when developing an algo:
1. Avg Trade is above $50
2. Profit Factor is above 1.2 (preferably above 1.5)
3. Has a relatively small draw-down
4. Is able to be traded both long and short
Notes/Options:
Can trade within market hours (default), outside market hours (with open inside), or anytime
Can adjust lengths for trend calculations
Algo tries its best to avoid fake-outs by using a volume component, this means that it misses 'slow rises' sometimes
By default it tries to only enter trades between 0930 and 1600. If the trade has left the station, it will wait for the next setup.
Stop loss level has a big impact on performance per instrument - default is 20 ticks but this has to be changed per instrument (I plan on updating this with code to auto-magically generate appropriate stop levels
As a Trend Following algorithm, it is vulnerable to chop zones but has been particularly resilient over the past few months when traded at 15m or 1h intervals. It is designed to trade against the 'current' market that has more frequent whipsaws. When used over generic bull market periods, it fails due to the high number of failed short trades and trimmed long trades. It works in a medium/high volatility environment.

OmenImproved momentum-based trading algorithm based on my previous Merlin V6 script. Adjusted trade filtering rules to improve net return and profit factor on both long and short positions.
Works best with mid time-frame Heikin-Ashi data.
