Pivot and liquidation lines [LM]Hello traders,
I would like to introduce you pivot and liquidation zones. Levels are rendered based on pivot points. We are looking for confluence of liquidation lines in order to have the gist where the market could go. calculation for the liquidation lines are taken from Bybit. It's good to look for line clusters. Indicator doesn't tell you where the market will go but it tells you where are the potential zones of position liquidations
There are several settings:
pivot setting - ordinary pivot lines setting
first leverage - setting for first leverage
second leverage - setting for second leverage
third leverage - setting for first leverage
fourth leverage - setting for second leverage
Hope you will enjoy it.
Cari skrip untuk "pivot"

Pivot Points Strategy🟢 It enters long trades near support zones (S1–S3)
🔴 It enters short trades near resistance zones (R1–R3)
🎯 All positions aim to exit at the central pivot (P).
🚫 It avoids trading when price crosses the pivot during the bar.
🔄 Strategy resets when a new pivot is calculated.
📊 Supports pyramiding up to 5 positions for scaling in.

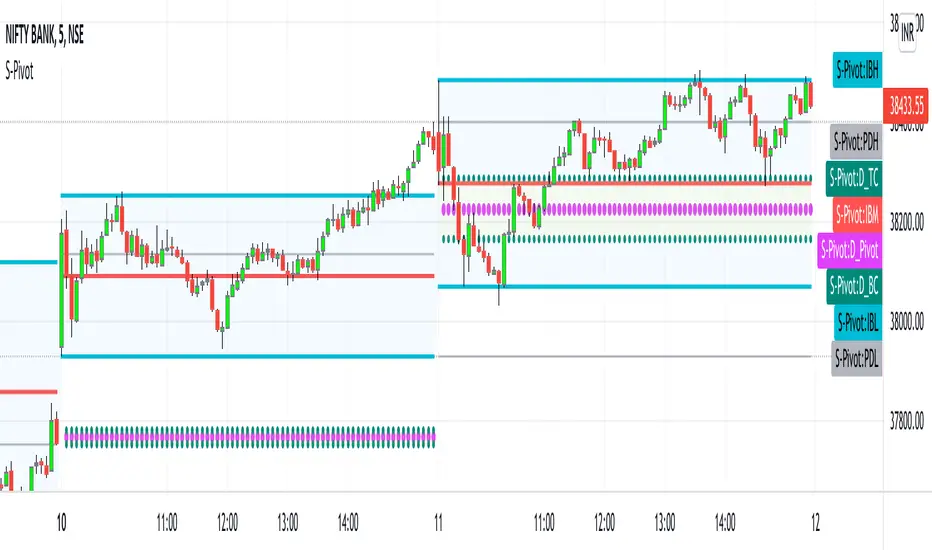
CPR_Previous Day Ranges_Initial BalanceHello Traders,
This script best works on Indian Index (Tested on BANKNIFTY & NIFTY)
This indicator can be used only for day trading (intraday: ex: 5min, 15min Timeframes) on indices.
This script helps to plot
1. Central Pivot Range(CPR)
2. Previous Day Ranges (PDH & PDL)
3. Initial Balance(IB)
brief description of indicators:
1. CPR: Central Pivot Range --> This indicator helps to identify key price points to set up trades. CPR is beneficial for intraday trading.
2.Previous Day Ranges: These ranges will help to understand the current day market.
PDH: Previous Day High value on current day
PDL: Previous Day Low value on current day
3.Initial Balance(IB):This indicator will help in day trading. IB will plot current day first 1hr high, low & mid values.
Disclaimer: This indicator can be used as refrence only. This has been tested on Banknifty and Nifty indices on day trading 5 minutes and 15 minutes timeframe. Understand yourself to knowledge of different trading methods.
Pivot Point BreakoutThis is a strategy taken from Perry Kaufman's book, Trading Systems and Methods.
Just like the title says, it's a breakout strategy. It works by buying when the current high is higher than the last pivot high, and selling when the low is lower than the last pivot low.
It does not have a good success probability, and relies on the good reward to risk ratio. Definitely not recommended for someone with weak hands.

Pivot point labelThis script provides the user with a label containing the high and low pivot points from a period defined by the user.

Camarilla Pivot Points Backtest Pivot point studies highlight prices considered to be a likely turning point
when looking at values from a previous period, whether it be daily, weekly,
quarterly or annual. Each pivot point study has its own characteristics on
how these points are calculated.
Red color = Sell
Green color = Buy
WARNING:
- For purpose educate only
- This script to change bars colors.
Camarilla Pivot Points Strategy Pivot point studies highlight prices considered to be a likely turning point
when looking at values from a previous period, whether it be daily, weekly,
quarterly or annual. Each pivot point study has its own characteristics on
how these points are calculated.
Red color = Sell
Green color = Buy
WARNING:
- For purpose educate only
- This script to change bars colors.

Camarilla Pivot Points V1 Pivot point studies highlight prices considered to be a likely turning point
when looking at values from a previous period, whether it be daily, weekly,
quarterly or annual. Each pivot point study has its own characteristics on
how these points are calculated.
WARNING:
- For purpose educate only
Pivot Points (Scalptrading)Classic Pivotpoints useful for Scalptrading.
Input Timeframes: Hourly, 4-Hourly, Daily

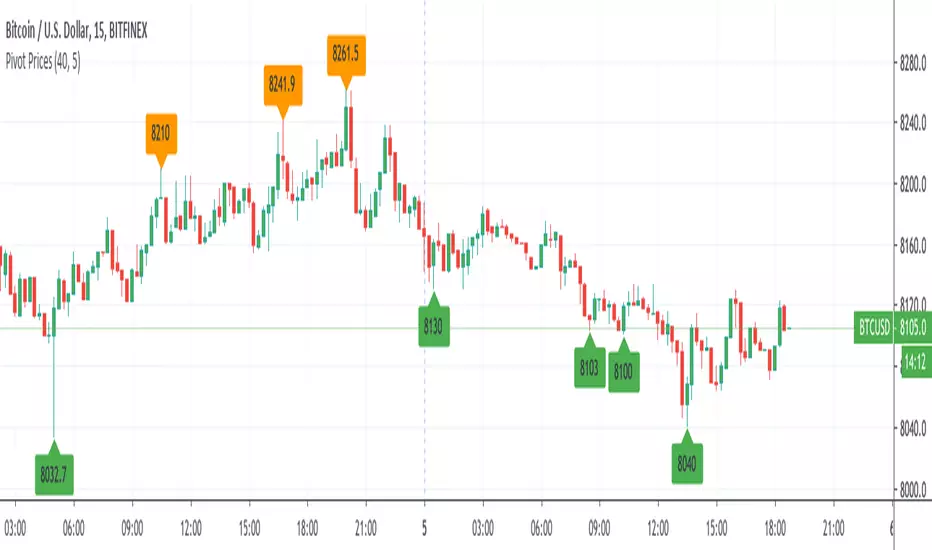
Pivot Prices - ExampleA simple example script showing how to use label.new() to plot pivot prices on the chart.
A full tutorial and commentary is available on the backtest-rookies website.
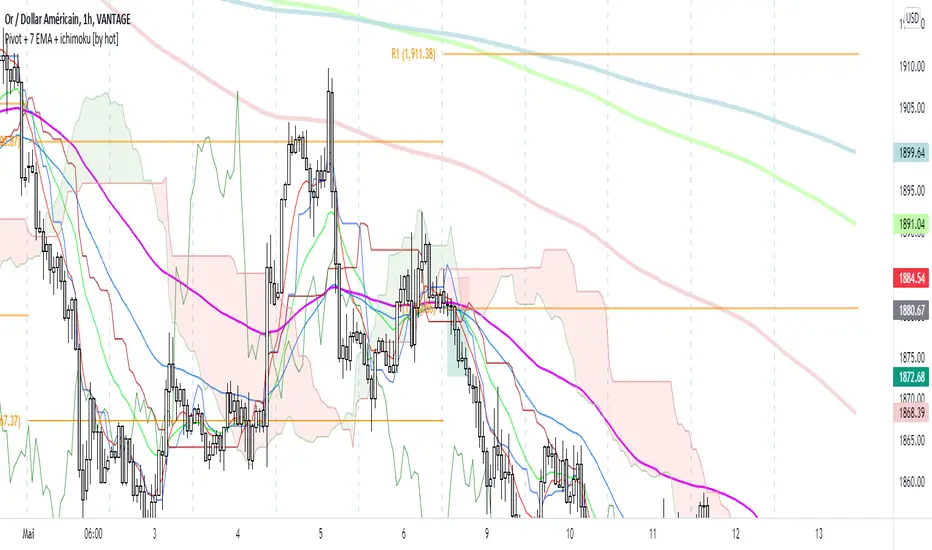
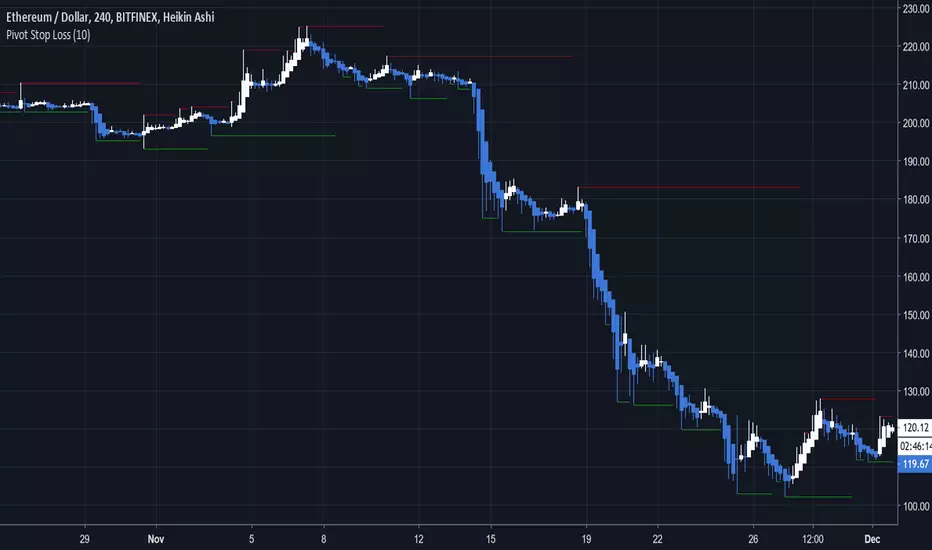
Pivot Stop LossHere we intend to use pivot points for stop loss and take profit. This has the added benefit of helping you to visualize support and resistance levels.
Pivot Range - Fisher's Methodology(1D & 3D & W & M)Pivot Range - Fisher's Methodology(1D & 3D & W & M)
Version 2.00
Created by TWA_TradeWithAmir(TWA_PriceActionTips)
Updated 10/29/2020
Based On Mark B. Fisher's ACD Methodology
* 1D Pivot Range, 3D Pivot Range, Weekly Pivot Range & Monthly Pivot Range


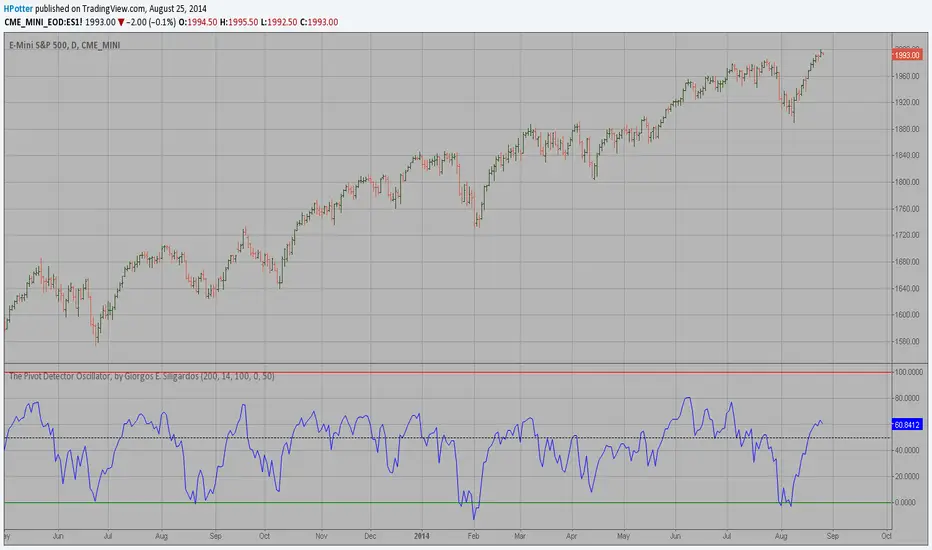
Pivot Detector Oscillator, by Giorgos E. Siligardos The Pivot Detector Oscillator, by Giorgos E. Siligardos
The related article is copyrighted material from Stocks & Commodities 2009 Sep
PivotLibrary222Library "PivotLibrary222"
f_determinePivotStrength(_pivotCandidateRelativeIndex, _type, _maxStrength)
Determines the strength of a pivot (low or high).
Parameters:
_pivotCandidateRelativeIndex (int) : The relative bar index of the pivot candidate.
_type (string) : "low" for a pivot low, "high" for a pivot high.
_maxStrength (int) : The maximum number of bars to check on either side for strength.
Returns: An array containing .
f_getPlotColorForStrength(_strength)
Gets a plotting color based on pivot strength.
Parameters:
_strength (int) : The calculated pivot strength.
Returns: A color for plotting.
f_updateExistingPivotLow(f_pivotLows, f_pivotLowInfoIndex, f_newStrength, f_showLabels)
Updates an existing pivot LOW's strength and its corresponding chart label.
Parameters:
f_pivotLows (array) : The array of pivotLowInfo objects.
f_pivotLowInfoIndex (int) : The index of the pivot to update in the array.
f_newStrength (int) : The new (increased) strength of the pivot.
f_showLabels (bool) : A boolean to control if labels should be updated.
f_updateExistingPivotHigh(f_pivotHighs, f_pivotHighInfoIndex, f_newStrength, f_showLabels)
Updates an existing pivot HIGH's strength and its corresponding chart label.
Parameters:
f_pivotHighs (array) : The array of pivotHighInfo objects.
f_pivotHighInfoIndex (int) : The index of the pivot to update in the array.
f_newStrength (int) : The new (increased) strength of the pivot.
f_showLabels (bool) : A boolean to control if labels should be updated.
f_findPivotLows(f_pivotLows, f_minStrength, f_maxStrength, f_showLabels)
Finds and processes pivot lows.
Parameters:
f_pivotLows (array) : The array of pivotLowInfo objects to read from and modify.
f_minStrength (int) : Minimum strength required for a new pivot to be recorded.
f_maxStrength (int) : Maximum strength to search for when determining pivot strength.
f_showLabels (bool) : A boolean to control if new labels should be created.
f_findPivotHighs(f_pivotHighs, f_minStrength, f_maxStrength, f_showLabels)
Finds and processes pivot highs.
Parameters:
f_pivotHighs (array) : The array of pivotHighInfo objects to read from and modify.
f_minStrength (int) : Minimum strength required for a new pivot to be recorded.
f_maxStrength (int) : Maximum strength to search for when determining pivot strength.
f_showLabels (bool) : A boolean to control if new labels should be created.
pivotHighInfo
Represents a detected pivot high.
Fields:
abs_index (series int)
price (series float)
strength (series int)
label_id (series label)
pivotLowInfo
Represents a detected pivot low.
Fields:
abs_index (series int)
price (series float)
strength (series int)
label_id (series label)
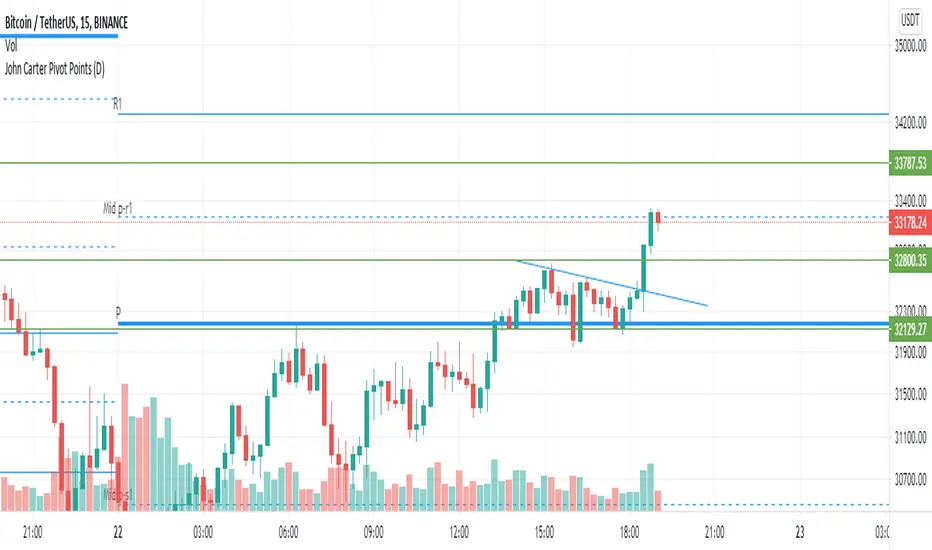
John Carter Pivot Points
This script is based on John Carter Mastering The Trade book. Pivot calculation is based on the previous day high, low, and close.
What Are the Trading Rules for Pivot Buys on Trending Days?
Sells are reversed.
1. Each day I update the appropriate pivot levels on the charts to reflect the previous day’s action. On Mondays, I also
update the weekly pivots, and on the first trading day of a new month, I update the monthly pivots.
2. The first pivot play is done in conjunction with the gap, if there is one. If there is a gap down, then I buy a decline into
the closest pivot level. If there isn’t a playable gap (more than 10 YM points or 1 ES point), then I will wait until
9:45 a.m. eastern to initiate the first play.
3. If the volume on the five-minute ES chart is more than 25,000 contracts, then I’ll wait for the markets to penetrate a
pivot level and move up at least a quarter of the way to the next pivot level. Once this happens, I will then set up a
bid to buy the first retracement back to the violated pivot level.
4. I enter my trades with limit orders only. I place orders “just in front of” the pivot. For the YM, I use 3 points; for the
ES, 0.25 point; for the NQ, 0.50 point; for the TF, 0.20 point; and for individual stocks, 5 cents. For example, if I’m
trading the YM and the pivot level is 10,000, then I would buy a decline to 10,003 and short a rally to 9997
.Sometimes the pivot will be an odd number, such as 1117.38 on the ES. In this case, I always round in the direction of
the trade. So, if I’m bidding for a long, I will round 1117.38 to 1117.50, and my bid will be 1117.75. If I’m offering a
short, I will round 1117.38 down to 1117.25 and place my offer at 1117.00. My stops and targets, then, would be “just
in front of” these appropriate long and short levels.
5. Once filled, I place an order to close the first half at the next pivot level and the second half at the pivot level after
that, using the same “just in front of” parameters.
6. I place a stop at 20 points for the YM, 2 points for the ES, 4 points for the NQ, and 1.50 points for the Russell. For
stocks, I will use a stop based roughly on the price of the stock. If the stock is under $10 a share, I will use a stop of
20 cents. If it is between $10 and $20, I will use a stop of 30 cents; if it is between $20 and $30, I will use a stop of
40 cents, and so on, adding another 10 cents for each $10 increment in price. (A $75 stock would have an 80-cent
stop, for example.)
7. If the first target is hit, I will then move up the stop to my entry-level pivot, minus the “just in front of” fractions
discussed in rule 3. For example, if I get in a YM long at 10,003 and the pivot is at 10,000, then my new stop would
be 9997 once the first target is hit.
8. If I am in a trade at the market close and neither my stop nor my target has been hit, I will close out my position “at the
market” at 4:10 p.m. eastern for futures, and at 3:58 p.m. eastern for stocks.
9. I don’t initiate any new positions after 3:30 p.m. eastern, but I will manage existing positions into the close.
10. The markets rarely have a sustained move above R3 or below S3. If I trade to those levels, I will always fade the
move.
11. After two losers in a row, I’m done with pivots for the day.
What Are the Trading Rules for Pivot Buys on Choppy Days?
Once again, sells are the same, just reversed. The rules for choppy days are identical except for the targets. On choppy days, I
just focus on the YM and the ES. My first target is mechanical: 10 points for the YM and 1 point for the ES on half of my
position. Once this is hit, I will trail up my stop in the same way I would for a trending trade. The second target becomes the
“just in front of” level for the actual next pivot level
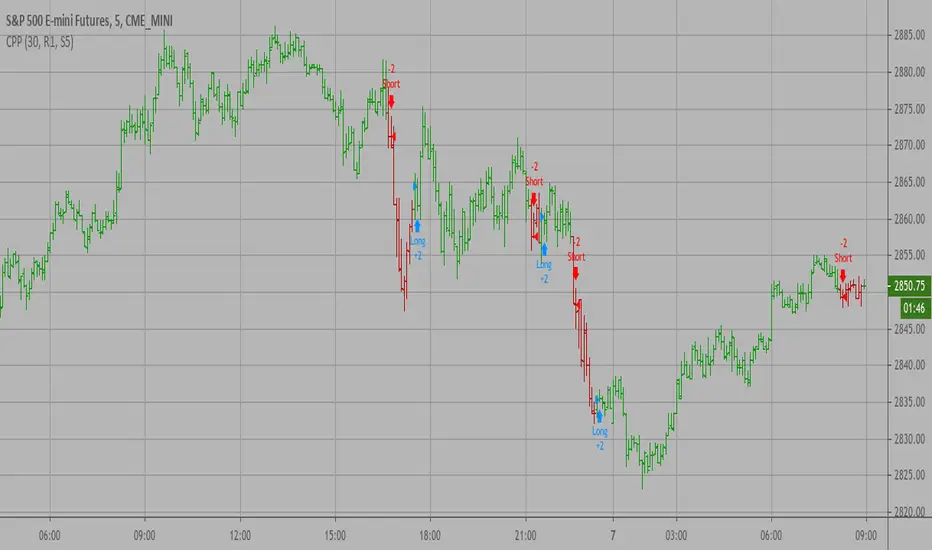
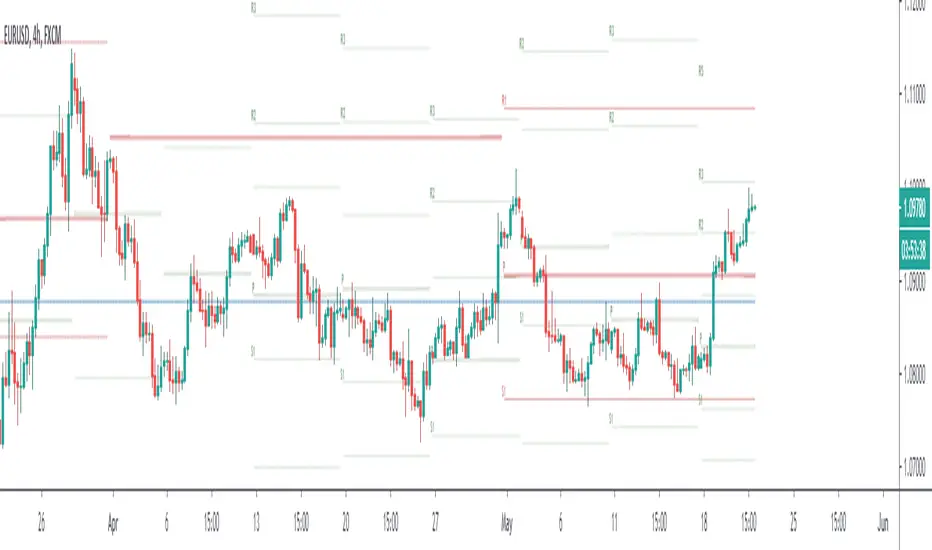
Camarilla Pivot Plays (Lite) [BruzX]█ OVERVIEW
This indicator implements the Camarilla Pivot Points levels and a system for suggesting particular plays. It only 3rd, 4th, and 6th levels, as these are the only ones used by the system. It also optionally shows the Central Pivot Range, which is in fact between S2 and R2. In total, there are 12 possible plays, grouped into two groups of six. The algorithm evaluates in real-time which plays fulfil their precondition and shows the candidate plays. The user must then decide if and when to take the play.
█ CREDITS
The Camarilla pivot plays are defined in a strategy developed by Thor Young, and the whole system is explained in his book "A Complete Day Trading System". This description is self-sufficient for effective use.
█ FEATURES
Display the 3rd, 4th and 6th Camarilla pivot levels
Works for stocks, futures, indices, forex and crypto
Automatically switches between RTH and ETH data based on criteria defined by the system.
Option to force RTH/ETH data and force a close price to be used in the calculation.
Preconditions for the plays can be toggled on/off
Works correctly on both RTH and ETH charts
Well-documented options tooltips
Well-documented and high-quality open-source code for those who are interested
█ HOW TO USE
The defaults work well; at a minimum, just add the indicator and watch the plays being called. For US futures, you will probably want to chat the "Timezone for sessions" to New York and the regular session times to 09:30 - 16:00. The following diagram shows its key features.
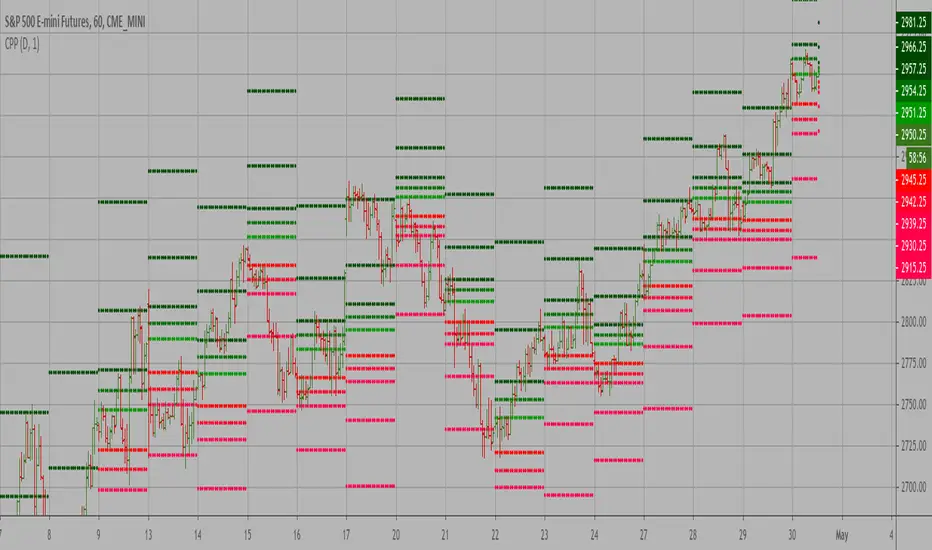
By default, the indicator draws plays 1 days back; this can be changed up to 20 days. The labels can be shifted left/right using the "label offset" option to avoid overlapping with other labels in this indicator or those of another indicator.
An information box at the top-right of the chart shows:
The data currently in use for the main pivots. This can switch in the pre-market if the H/L range exceeds the previous day's H/L, and if it does, you will see that switch at the time that it happens
Whether the current day's pivots are in a higher or lower range compared to the previous day's.
The width of the pivots compared to the previous day
The current candidate plays fulfilling preconditions. You then need to watch the price action to decide whether to take the play.
The resistance pivots are all drawn in the same colour (red by default), as are the support pivots (green by default). You can change the resistance and support colours, but it is not possible to have different colours for different levels of the same kind.
█ CONCEPTS
The indicator is focused around daily Camarilla pivots and evaluates the preconditions for 12 possible plays: 6 when in a higher range, 6 when in a lower range. The plays are labelled by two letters—the first indicates the range, the second indicates the play—as shown in this diagram:
The pivots can be calculated using only RTH (Regular Trading Hours) data, or ETH (Extended Trading Hours) data, which includes the pre-market and post-market. The indicator implements logic to automatically choose the correct data, based on the rules defined by the strategy. This is user-overridable. With the default options, ETH will be used when the H/L range in the previous day's post-market or current day's pre-market exceeds that of the previous day's regular market. In auto mode, the chosen pivots are considered the main pivots for that day and are the ones used for play evaluation. The "other" pivots can also be shown—"other" here meaning using ETH data when the main pivots use RTH data, and vice versa.
The plays must fulfil a set of preconditions. There are preconditions for valid region and range, price sweeps into levels, correct pivot width, opening position, price action, and whether neutral range plays and premarket plays are enabled. When all the preconditions are fulfilled, the play will be shown as a candidate.
█ NOTE FOR FUTURES
Futures don't officially have a pre-market or post-market like equities. Let's take ES on CME as an example. It trades from 18:00 ET Sunday to 17:00 Friday (ET), with a daily pause between 17:00 and 18:00 ET. However, most of the trading activity is done between 09:30 and 16:00, which you can tell from the volume spikes at those times, and this coincides with NYSE/NASDAQ regular hours. So we define a pseudo-pre-market from 18:00 the previous day to 09:30 on the current day, then a pseudo-regular market from 08:30 to 16:00, then a pseudo-post-market from 16:00 to 17:00. The indicator then works exactly the same as with equities—all the options behave the same, just with different session times defined for the pre-, regular, and post-market, with "RTH" meaning just the regular market and "ETH" meaning all three.
█ LIMITATIONS
The pivots are very close to those shown in DAS Trader Pro. They are not to-the-cent exact, but within a few cents. The reasons are:
TradingView provides free real-time data from CBOE One, not full exchange data (you can pay for this though, and it's not expensive), and
the close/high/low are taken from the intraday timeframe you are currently viewing, not daily data—which are very close, but often not exactly the same. For example, the high on the daily timeframe may differ slightly from the daily high you'll see on an intraday timeframe.
Despite these caveats, occasionally large spikes will be seem in one platform and not the other (even with paid data), or the spikes will reach significantly difference prices. Where these spikes create the daily high or low, this can cause significantly different pivots levels. The more traded the stock is, the less the difference tends to be. Highly traded stocks are usually within a few cents (but even they occasionally have large differences in spikes). There is nothing that can be done about this.
The 6th Camarilla level does not have a standard definition and may not match the level shown on other platforms. It does match the definition used by DAS Trader Pro.
Replay mode for stocks does not work correctly. This is due to some important Pine Script variables provided by the TradingView platform and used by the script not being assigned correct values in replay mode. Futures do not use these variables, so they should work in replay mode.
The indicator is an intraday indicator (despite also being able to show weekly and monthly pivots on an intraday chart). It deactivates on a daily timeframe and higher. Sub-minute timeframes are also not supported.
The indicator was developed and tested for US/European stocks, US futures and EURUSD forex and BTCUSD. It should work as intended for stocks and futures in different countries, and for all forex and crypto, but this is tested as much as the security it was developed for.
█ DISCLAIMER
This indicator is provided for information only and should not be used in isolation without a good understand of the system and without considering other factors. You should not take trades using real money based solely on what this indicator says. Any trades you take are entirely at your own risk.

Fibonacci Pivot | SyedFibonacci pivots combine Fibonacci retracement levels with pivot points to provide potential support and resistance levels. This tool is based on the idea that price tends to retrace a predictable portion of a move, after which it often continues in the original direction.
Here’s a breakdown of Fibonacci pivots:
1. Pivot Point (PP)
The central level that acts as the main reference point for support and resistance levels. It’s calculated as the average of the high, low, and close of the previous period (typically a day).
Formula:
𝑃
𝑃
=
(
𝐻
𝑖
𝑔
ℎ
+
𝐿
𝑜
𝑤
+
𝐶
𝑙
𝑜
𝑠
𝑒
)
3
PP=
3
(High+Low+Close)
2. Fibonacci-Based Support and Resistance Levels
These levels are derived by multiplying the range (High - Low) of the previous period with key Fibonacci ratios (23.6%, 38.2%, 61.8%, etc.), then adding or subtracting this result from the Pivot Point.
The Fibonacci ratios used in Fibonacci pivots are typically:
38.2%: A strong retracement level.
61.8%: The golden ratio, a key Fibonacci level that often acts as major support or resistance.
100%: Full retracement from the previous period's high or low.
Fibonacci Support Levels (S1, S2, S3, etc.)
These levels indicate potential areas where the price might find support:
S1 = PP - (Range * 0.382)
S2 = PP - (Range * 0.618)
S3 = PP - (Range * 1)
Fibonacci Resistance Levels (R1, R2, R3, etc.)
These are the areas where price might face resistance:
R1 = PP + (Range * 0.382)
R2 = PP + (Range * 0.618)
R3 = PP + (Range * 1)
Interpretation
R1/R2/R3: Potential resistance levels where price might face selling pressure.
S1/S2/S3: Potential support levels where price might encounter buying interest.
Pivot Point (PP): Acts as the primary level of interest. If the price is above the PP, it suggests bullish sentiment; if below, bearish sentiment.
Example

Simple PivotsSuper Simple Pivots, based on
and adapted from
Will take a low or high point and compare left and right, if its the lowest or highest respectively, a line is drawn forward until another point meets the criteria
The lookback period will delay the formation of new pivots. In the original two indicators, the pivot lines would stop drawing. I have added a line extension from the most recent pivots forward to indicate whether the current market price exceeds or is within the recent pivot point ranges. If the market price is above or below the high or low pivots respectively, the line will become solid. Otherwise, the pivot extension lines will be dotted.
There is an option to place price labels below the historical pivot points. Default is disabled because it clutters the chart.
Removed all alerts and MA from the original two indicators to improve speed.
Let me know if you have any questions!
gkjch

Multi-Timeframe Pivot PointsThis is a MTF pivot point indicator. I was unhappy with the standard pivot point indicator in Trading View as I wanted to be aware of how price was interacting with pivot points on a higher timeframe. For example, if I'm on the 1H time frame looking at daily pivots, I want to be sure that my trading plan to move between these pivots does not contradict what price is trying to do in relation to the weekly pivots. In addition, sometimes daily and weekly pivots will align increasing probability of a bounce
Ultimately its about trying to automate as much as possible to quickly have an awareness of what might be happening on the timeframe above without having to manual enter levels.
I concluded I don't like the results of this script - whilst i clearly see price interacting with pivots on the current timeframe and higher timeframes there is too much screen clutter on the screen for me.
Rather than delete the script I thought I'd make it available for other people to use. I hope its useful to people. Good luck
(For the record it actually takes a little thinking outside the box to make so many pivots display - you can't just plot hlines. If your a pinescript geek you might like the code)
BTC-OTHERS Liquidity PivotBTC-OTHERS Liquidity Map – 1-hour Multi-Asset Pivot Scanner
WHAT IT DOES
This script tracks liquidity shifts between Bitcoin (BTC) and the broader alt-coin market (the OTHERS market-cap index that excludes the top-10 coins). It labels every confirmed 1-hour swing high or low on both assets, then flags four states:
BearPivot – BTC prints a new swing High while OTHERS does not; liquidity crowds into BTC and alts are weak.
BullPivot – BTC prints a swing Low and OTHERS forms a Higher Low; fresh liquidity starts flowing into stronger alts.
BearCon – BTC prints a swing Low and OTHERS forms a Lower Low; down-trend continuation.
BullCon – No new BTC Low while OTHERS makes a Higher High; up-trend continuation.
Signals appear on the actual pivot bar (offset back by the look-back length), so they never repaint after confirmation.
HOW THE PIVOTS ARE FOUND
• Symmetrical window: “Pivot Len” bars to the left and right (default 21).
• Full confirmation on both sides delivers stable, non-repainting pivots at the cost of about Pivot Len bars’ delay.
• Labels are offset –Pivot Len so they sit on the genuine extreme.
INPUTS
Symbols: BTC symbol and an OTHERS symbol so you can switch exchanges or choose another alt index.
Pivot Len: tighten for faster but noisier signals; widen for cleaner pivots.
Style: customise shape and text colours.
PLOTS AND ALERTS
Four labelled shapes (BearPivot, BullPivot, BearCon, BullCon) plot above or below price. Each label is linked to an alertcondition, so you can create one-click alerts and stay informed without watching the screen.
TYPICAL WORKFLOW
1. Attach the script to any 1-hour BTC chart (or leave the script’s timeframe empty to follow your current chart TF).
2. Turn on alerts to receive push/email notifications.
3. Use the labels as a liquidity compass, combining them with volume, funding or your own strategy for actual entries and exits.
Enjoy and trade safe.
