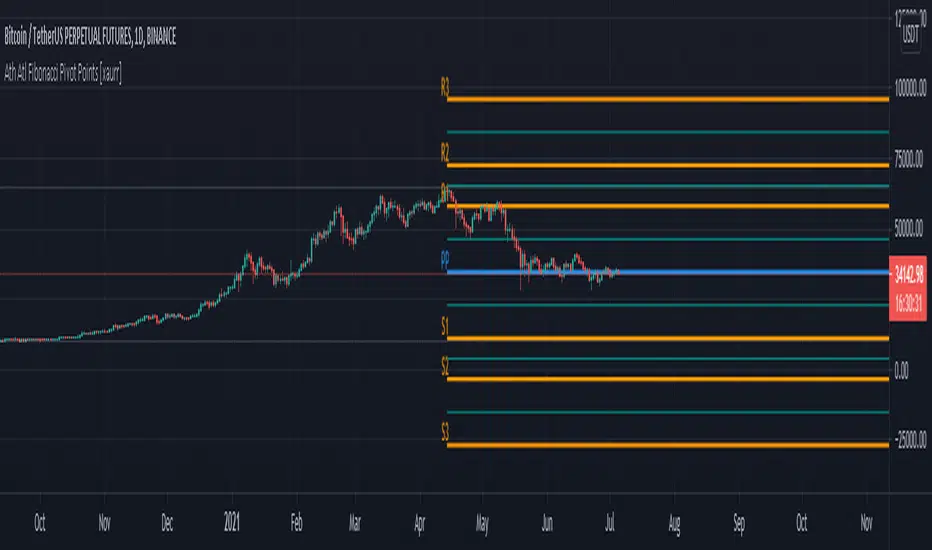
Ath Atl Fibonacci Pivot Points [xaurr]This script draws fibonacci support and ressistance lines according to all time high and low values.
Cari skrip untuk "pivot"
Trend Key PointsEach trend has its high and low key points that are important in the next prices. Sometimes it's hard to find out the keys with a naked eye, so I tried to code a simple indicator to marking these points also, as a bonus, to draw support and resistance lines from previous critical pivot points.
Let me explain the details with a downtrend. If we consider the previous trend, each downtrend starts with a HH and end with a LL. There are always many tries between that HH and LL to turn the trend up. This indicator counts that inner attempts. The higher the number of attempts, the more important move has been started from the beginning (HH). These numbers take their final form when the trend ends and are included in the label at the beginning of each trend.
Key points with 3 and more inner tries are consider as critical point by default but It's alterable and you can change it as you want. The indicator draws lines from critical points too, so you can use that lines as support and resistance in next candles.
Likewise, there are marks below inner LLs and above inner HHs.
This indicator idea is entirely my own and is a product I've really thought about, AND you have allowed to use and share it anywhere to anyone. I did my best to make it useful, even so I am open to any improvement. If you have an idea or a suggestion, don't forget to leave a comment.

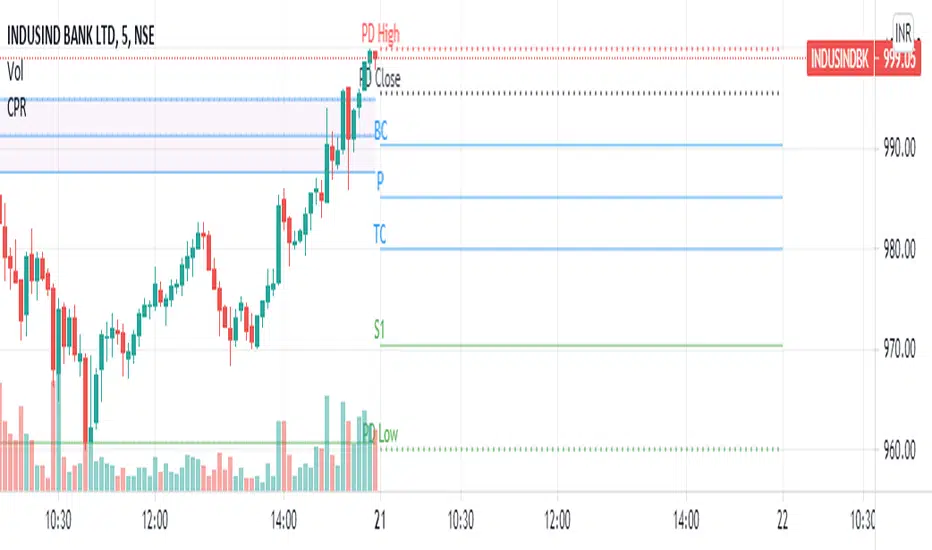
CPR SutradingA simple CPR indicator which plots pivot line, bottom cpr, top cpr, supports , resistances along with previous day high, low and close.
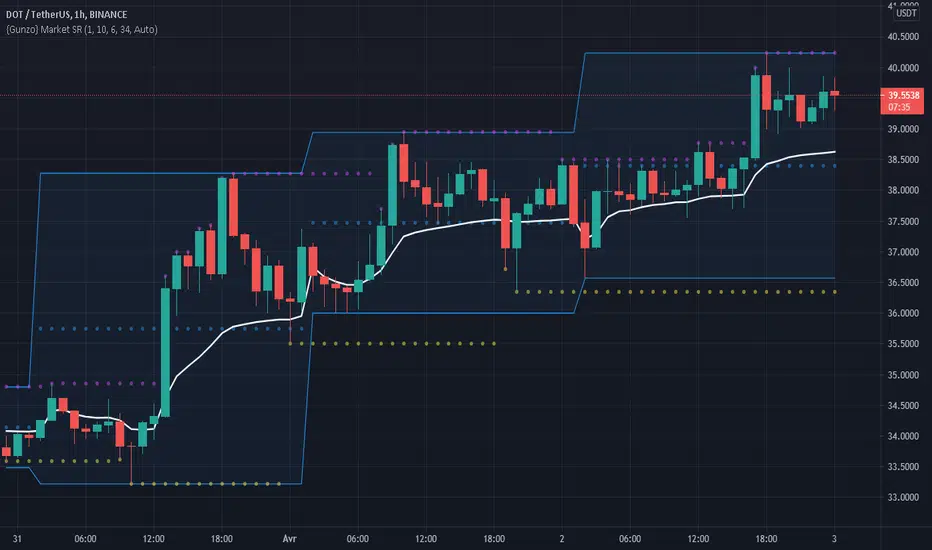
Gunzo Market SRGunzo Market SR is a set of 3 tools combined for trend analysis on day trading strategy.
VWAP (Volume Weighted Average Price) :
The VWAP indicator is generally used for trend analysis. For example if the VWAP line is under the closing price for a long period of time, the trend is strong. In this script, the VWAP has been optimized for day trading as the indicator is calculated inside the daily range, and resets when a new day starts. This way the indicator reflects the daily trend and not the overall trend. You can also use the position of closing price according to the VWAP to find optimal entry points according to the indicator.
Highs / Lows :
The Highs / Lows are generally used for trend analysis too. The High / Lows are mainly used to identify prices that have been key during the past and that we can use as an indication for the following candles. In this script, the Highs / Lows are computed on the daily period and then displayed on the current period (recommended to use on a daily period or lower). This way the indicator reflects the highest point and the lowest point of the day (can be modified to have a longer range of pivot days even if I recommend to stay on 1 day for day trading).
Support / Resistance :
The Support / Resistance is generally used for trend analysis too. The Support / Resistance are found by searching local high and lows. The longer the supports and resistance are, the strongest it can be considered. In this script, the Highs / Lows are computed by default on a lower time frame (usually 3-4 times lower). For example on a 15 minute graph, the Highs / Lows will be computed on the 5 minute graph (can be modified if the displayed result is not optimized for your asset).
How to use this set of tools :
I personally recommend to use this tool at the start of your day of trading. This way you will get a clear vision of the daily situation and try to identify key prices and the trend for the current day. I then suggest to set up an alert on the key price to be notified when you're getting close to it.
Strongholds - Objective & Accurate Reference Points / StructuresVery early in my trading career, I came across Pivot Points only to find out that there are as many calculations as one pleases. It was hard to find out which ones work. Most of them probably did only out of randomness, so I ditched the strategy and looked for something else.
I previously used my Oracle Eye and Reference Points scripts but it is time for an upgrade.
Stronghold is a script I have used for quite some time now. I ditched daily and weekly closing prices as not that important. Instead, Strongholds are equipped with:
►Daily High & Low • Azure color
►Weekly High & Low • Dark blue
►Weekly old High & Low • Semi-transparent dark circles
►Monthly High & Low • Wizardly purple
There is an option to print:
►4h High & Low • Semi-transparent red
►VWAP • Lovely purple
►Weekly VWAP • Black
All of the levels and lines are set for 1m, 5m, 10m, 15m, 30m, 1h, 4h, 1D timeframes. If you use any alien timeframe, you may need to enter the code.
You can opt-in and out for certain timeframes. For example, daily levels are visible from 15m or 30, so the indicator won't draw them unless you want to. However, they will not be seen on higher timeframes as there is no reason to show them and oversaturate the chart with lines.
▬▬▬▬▬▬▬▬▬▬▬▬▬▬▬▬▬▬▬▬▬▬
Remember that if you use this script with auto-scale, you need to tick Scale Price Chart Only . Otherwise, your chart will fly to the moon!
Good luck & have fun!

[JRL] Murrey Math LinesMurrey Math Lines are support and resistance lines based on geometric mathematical formulas developed by T.
H. Murrey. MM lines are a derivation of the observations of W.D. Gann. Murrey's geometry facilitate the use of Gann's theories in a somewhat easier application. According to Gann's theory, price tends to trend and retrace in 1/8th intervals. The most important MM line levels are the 0/8, 4/8 and 8/8 levels, which typically provide strong support and resistance points. The 3/8 and 5/8 levels represent the low and high of the typical trading range. When price is above the typical trading range, it is considered overbought, and when it is below it is considered oversold. The 2/8 and 6/8 levels provide strong pivot points.
Some of the other Murrey Math indicators on TradingView use different formulas and therefore produce varying results. I've checked my indicator against MM indicators on other platforms and it is consistent with those indicators.
This indicator also allows users to switch to alternative timeframes for analysis and it includes labels for the MM lines. If you have any suggestions or comments, please leave them below.
Cheers!

[SCL] True Market StructureSee market structure at a glance with Higher Highs and Lower Lows. Bullish/Bearish/Ranging market bias is automatically derived. Optionally get alerted for breaks in market structure. Uses true Local Highs/Lows instead of simply the highest/lowest "pivot" for x bars. Can be useful as a support for learning market structure or for alerts for a change in structure while you're not at the computer.

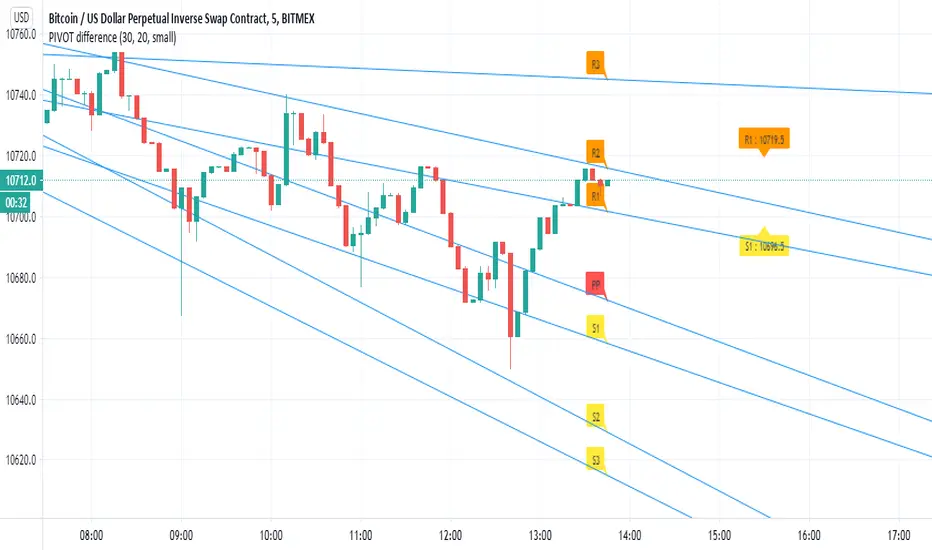
PIVOT differenceall credit to pine coders of TV- www.tradingview.com
this is just example of the new function and how we can make smart pivot system for low TF
on the right side (the normal pivot that we use S1 and R1 level shown)
the lines represent the trend of the pivot and there levels
here i use 30 min pivot MTF on 5 min chart
in this example we can see that we have much more correct way to estimate break up or down
the get price function allow you to make alerts of crossing of the trend line ( I am lazy now so maybe later I add it:) )
you can use same TF as the chart or higher
and then examine where you think you nned to buy and sell
I normaly add linear regression or other method of choice for conformation of buy or sell oppertunity
this is just raw idea but this function can be exploited with any trend line or system that one can think about
this is just example to think on :)
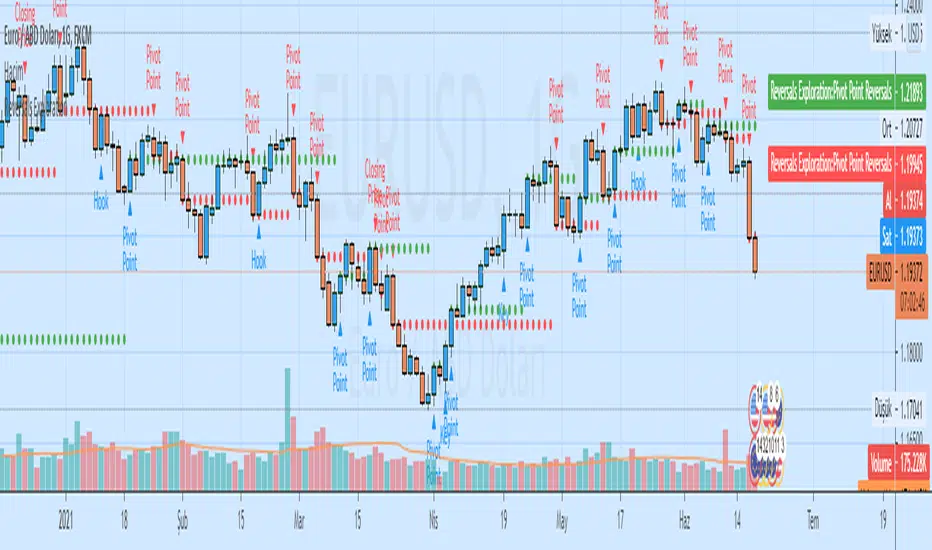
Auto Analysis Short-term Reversals ExplorationAuto Analysis Short-term Reversals Exploration
Based on a study by Larry Lovrencic
Closing Price Reversals Automatic Analysis
Hook Reversals Automatic Analysis
Island Reversals Automatic Analysis
Key Reversals Automatic Analysis
Open/Close Reversals Automatic Analysis
Pivot Point Reversals Automatic Analysis

Next Support and ResistanceSupport and Resistance lines are generated from recent pivot points and shown only when the price gets close to them.

NSDT Auto Support / Resistance LevelsSimple script that automatically plots support and resistance lines based on the pivot points of the number of candles you choose to look back upon.
All options are editable.

Dynamic Support and ResistanceSupport is a price level where a downtrend can be expected to pause due to a concentration of demand or buying interest. As the price of assets or securities drops, demand for the shares increases, thus forming the support line.
Meanwhile, resistance zones arise due to selling interest when prices have increased.s their name implies, dynamic support and resistance levels change their level with each new price-tick.To draw dynamic support and resistance levels, traders usually use moving averages which are automatically drawn by your trading platform. The 200-day exponential moving average (EMA), 100-day EMA, and 20-30-40-50-day EMA are very popular dynamic support and resistance levels.also in some references Williams Fractal level used for dynamic support and resistance levels. and it also includes other support and resistance levels that are projected based on the pivot point calculation. All these levels help traders see where the price could experience support or resistance. Similarly, if the price moves through these levels it lets the trader know the price is trending in that direction.

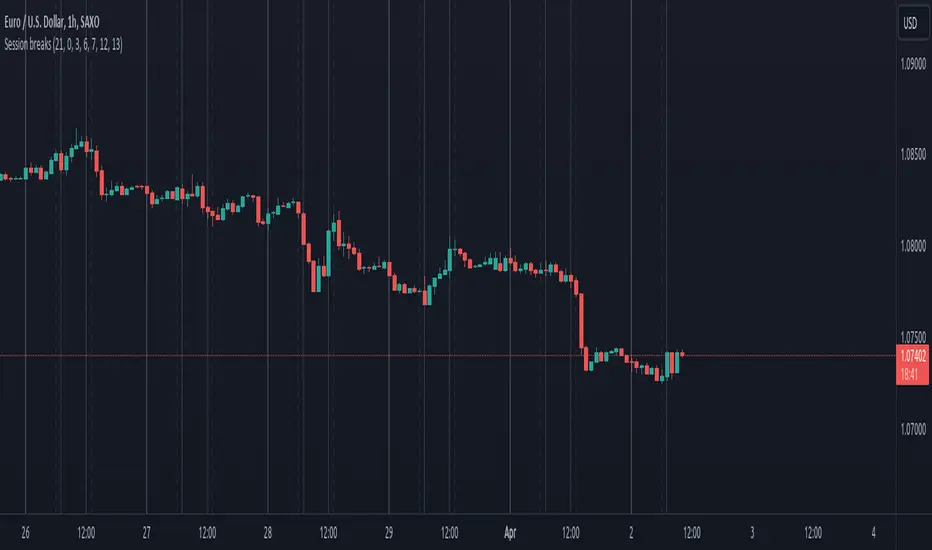
Session breaksThis indicator marks the start of each trading session around the world, starting with Tokyo at 0am UTC, London at 7am UTC, NY at 12pm and Sydney at 9pm, is non-intrusive (light gray vertical lines) and works with both UTC and exchanges' local time and handles DST / timezone offsets as well.
You can easily see that sometimes it acts as pivot-point especially on high volume.
And last, it is supposed to replace the "Session breaks" option that you can find in "Settings - Appearance" that only displays the end of session for the current exchange.
[fikira] Harmonic Patterns 2This is "Harmonic Patterns", part 2 Open Source
(in 2 parts, otherwise many lines are gone because the script is too large):
- Crab
- Bat (+ Alt)
- Butterfly
- Shark
A "Pattern" is created by checking 5 consecutive ( pivot ) points, starting with X, A, B, C, and ending with point D.
At point D all 5 points are compared, calculated and verified.
When confirmed, a "Label" will be plotted at point D, together with the "Entry", "Take Profit" and "Stop Loss" price.
The "Entry", "Take Profit" and "Stop Loss" lines will be plotted as well at point D.
Lastly, a "Drawing" automatically will be displayed which makes the "Pattern" visible.
Please do mind, the "Drawing" is calculated differently, the "Drawing" sometimes can be displayed incorrectly
when prices are too close to each other (for example low Satoshi price changes).
THE "ENTRY", "TAKE PROFIT", "STOP LOSS" PRICES AND LINES ARE NOT AFFECTED AT ALL BY THIS, THEY WILL SHOW CORRECTLY!
- 1 "TP point" can be changed ("TP Level 0.618")
- "Labels", "Lines", "Drawings" can be disabled/enabled
- "Labels" can be made smaller or bigger ("Size Label")
- "Labels" can be placed further or closer to the bar ("Distance TP Label" > higher = closer, lower = further)
- "Lines" can be made thicker or thinner ("TP Linewidth")
- "Drawings" can be made thicker or thinner ("Drawings Linewidth")
- "Drawings" are created by comparing with 100 bars back in history (default), should it be (very rarely) a triangle is displayed flat on the left side,
possibly the first point(s) is/are further than 100 bars ago, in this case increase "Period Drawings" above 100.
- Animal symbols can be enabled/disabled
- When several "Patterns" appear on the chart, the oldest ones won't be displayed anymore, first the "Drawings", then the "Lines"
The last (present) ones will always be displayed in total without a problem!
- If you want to see "Patterns" with less correct measurement, change "Error Marge" 0.9 - 1" and "Error Marge" 1 - 1.1"), this gives max. about 10% extra margin
- Added more settings regarding "Drawing Lines"
Thank you very much!

IMR DAILY FIBGREETINGS TRADERS !!!
TRADE in trend
with support & resistence of fibonachi pivot of daily
usefull for each & every script
built in ema crossovers for safe traders
specialy used for intraday (1-2-3-5 min timeframe )& swing trades SIMPEL & HANDY INDICATOR
tried to kept the function of indicatoer very easy & user freindly
plz use & share your feedback
ENJOY LIKE & SHARE TO OTHERS !!!!

Dynamic Price ChannelsThis indicator plots dynamic price channels based on the security highest close and lowest open.
The default is to display 8 core channels (with the option to plot the sub channel lines, off by default).
It’s simple really—this just divides the price action into equal channels. I’ve found this pattern helpful across all markets.
It’s dynamic because if a new high close or a new low close is created the all channels will adjust.
The key levels are 75% (blue), 50% (aqua), 25% (blue).
In between those key levels is a level separator.
The high close and the low open are both red.
These can all be customized in the settings.
What you’ll typically see at these channel boundaries are price slow downs, reversals, support and resistance.
Turning on sub-channels will provide further channel plots. On these sub-channels you’ll also see the same type of price action activity as mentioned above.
I’ve developed a trading system where this indicator helps identify key pivot areas. Combined with a few other indicators and key EMAs this trade system provides high probability trades around these key channel areas.

Pivot cycles - JDThis indicator tells you how many bars it takes to get from one pivot point to another.
This can give you a probability of when an upward or downward pivot is 'overdue'.
As is the nature of pivot points, this naturally lags by default by half of the pivot length!!
eg. if the pivot length is set to 6 the indicator will give you the pivot point 3 bars later.
JD.
#DYOR
#nottradingadvice

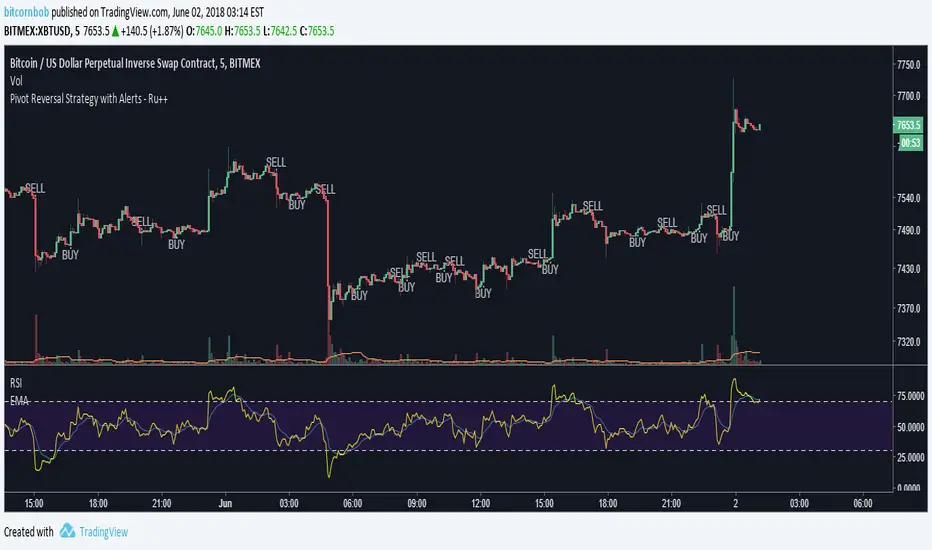
Pivot Reversal Strategy with Alerts - Ru++changing from blue to white for better visibility on dark theme
On Balance True Range and Kalman FilterThis is a modification of On Balance True Range where the plot is made on the chart based on VWAP. Getting the previous day values of this logic is useful in determining the major pivot points during the day. The intra day VWAP is also plotted to know if the price is being traded above or below the average price.
The script also has a Kalman Filter based moving average that acts as a short term moving average.

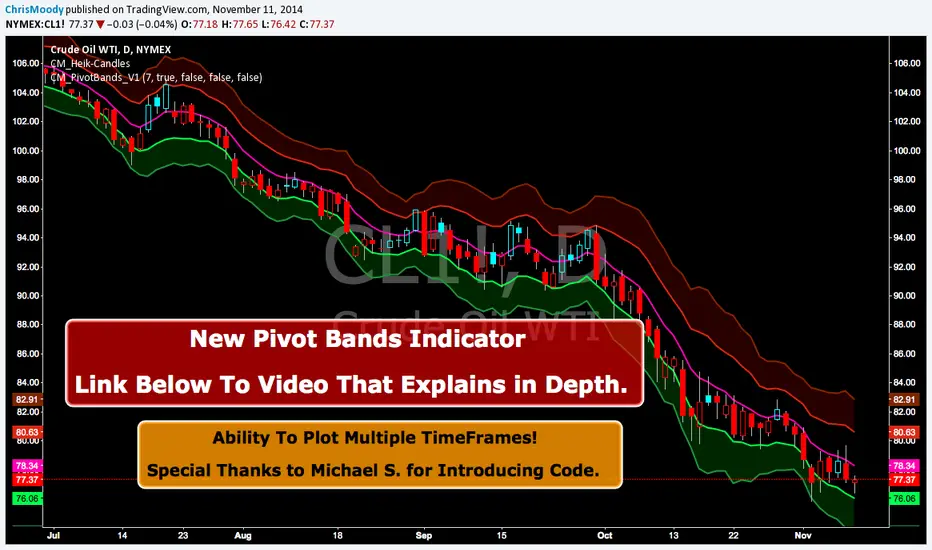
CM Pivot Bands V1CM_Pivot Bands V1
Special Thanks to Michael S for Introducing Code.
Instead of a Long Write Up I Recorded A Video Going Into Detail On V1 Of This Indicator. Please View To See My Initial Findings, My Thoughts For V2, And Items I Need YOUR Help With!!!
In Inputs Tab Indicator Has Ability to Turn On/Off Multiple TimeFrames…Thought Process Explained In Video.
Link To Video:
vimeopro.com
Link To PDF Mentioned In Video:
d.pr
Pivot Points + Day First Candle Breakout + VWAP + Supertrend This indicator amalgamates several key indicators to provide a comprehensive analysis for trading decisions, including SuperTrend, Pivot Points, VWAP, along with the Day First Candle Breakout strategy.
Key Features:
Day First Candle Breakout: Identifies potential breakout opportunities based on the first candle of the trading day. It utilizes the high and low of the initial trading range to determine entry points.
Timeframe Selection: Allows users to select the timeframe for analyzing the first candle (e.g., 5, 15, or 60 minutes).
Previous Day and Week High/Low: Displays the high and low of the previous day and week to provide additional context for trading decisions and assess the strength of the trend.
Trend Strength Analysis: Indicates whether the current price is above or below the previous day's high or low, signaling a stronger bullish or bearish trend respectively.
SuperTrend Indicator: Visualizes the trend direction and potential reversal points based on the SuperTrend indicator. It helps traders to stay aligned with the prevailing trend and avoid premature exits.
Pivot Points: Presents key support and resistance levels derived from Pivot Points, assisting traders in identifying potential reversal or breakout zones.
VWAP (Volume Weighted Average Price): Plots VWAP to provide insight into the average price traded over a given period, aiding in determining the fair value of the asset and potential buying/selling zones.
Trading Signals:
Buy Signal: Triggered when the price exceeds the high of the initial trading range after an upward price gap.
Sell Signal: Generated when the price falls below the low of the initial trading range after a downward price gap.
Caveats for Effective Trading:
Extended Trading Ranges: Adjusts support and resistance levels if the initial trading range extends beyond the defined timeframe.
Morning Noise Consideration: Exercises caution during volatile morning sessions to avoid false breakouts and whipsaws.
Pullbacks and Narrow Range Bars: Looks for opportunities during pullbacks or when the price forms narrow range bars to enter trades, reducing the risk of sudden reversals.
