Wedge BreakoutThe Wedge Breakout indicator is designed to identify and signal potential breakouts from a wedge pattern, a common technical analysis formation. A wedge pattern typically forms when the price moves within converging trendlines, indicating a potential upcoming breakout either upwards (bullish) or downwards (bearish).
Identifying Pivot Points:
The indicator first calculates pivot points, which are significant highs and lows that define the wedge's upper and lower boundaries.
Pivot Lows: It identifies the lowest price points over a specified length (input_len), which serves as the lower boundary of the wedge.
Pivot Highs: Similarly, it identifies the highest price points over the same length, forming the upper boundary of the wedge.
Drawing Trendlines:
The pivot points are connected to form dashed trendlines that represent the upper and lower boundaries of the wedge.
The indicator uses the SimpleTrendlines library to manage and draw these trendlines dynamically:
Green Trendline: Indicates an upward slope (bullish).
Red Trendline: Indicates a downward slope (bearish).
Calculating the Breakout Conditions:
A breakout is confirmed when the price action fulfills two conditions:
The candle's high exceeds the upper trendline's highest point.
The candle's low drops below the lower trendline's lowest point.
This condition suggests that the price is squeezing within the wedge pattern and is about to break out.
Determining Breakout Direction:
The direction of the breakout is determined by the candle's closing position relative to its opening:
Bullish Breakout (Upward): When the candle closes above its opening price (close > open) after breaching both trendlines, it suggests a bullish breakout. This condition is marked with a green upward triangle .
Bearish Breakout (Downward): When the candle closes below its opening price (close < open) after breaching both trendlines, it suggests a bearish breakout. This condition is marked with a red downward triangle.
Visual Representation:
Green Triangle Up: Plotted below the bar to indicate a potential bullish breakout.
Red Triangle Down: Plotted above the bar to indicate a potential bearish breakout.
Used library:
www.tradingview.com
Cari skrip untuk "pivot"

Support and Resistance [CryptoSea]The Support and Resistance Indicator is a powerful tool developed by CryptoSea for traders seeking to identify key market levels with precision. This script leverages advanced pivot and volume analysis to highlight support and resistance zones on the price chart.
Key Features
Multi-Source Pivot Analysis: Choose between wicks or body prices for calculating pivot points, providing flexibility in market analysis.
Volume Spike Detection: Automatically identifies volume spikes using a customizable threshold multiplier, enhancing the accuracy of support and resistance levels.
Dynamic Box Display: Configurable options for extending and graying out boxes based on price interaction, ensuring a clear visual representation of active and invalidated zones.
In the example below, we see a resistance box formed based on wick highs and a volume spike. The box extends to where we see price rejecting from it. In the settings you can change this so the box will stop if price touches it if you prefer.
How it Works
Pivot Point Calculation: The script determines pivot highs and lows using either wicks or body prices over a specified term (Short, Medium, Long), corresponding to 5, 15, or 30 bars.
Volume Analysis: Calculates average volume over twice the pivot length and identifies volume spikes exceeding the user-defined threshold, crucial for confirming support and resistance levels.
Box Management: Maintains arrays of support and resistance boxes, limiting the number based on user settings (All, Recent Few, Recent Several).
Settings Explained
Source: Choose between 'Wicks' or 'Bodies' to determine whether pivot points are calculated using candle wicks or body prices.
Pivot Term: Select 'Short' (5 bars), 'Medium' (15 bars), or 'Long' (30 bars) to adjust the distance for pivot calculation. Longer terms take more bars to confirm support/resistance.
Volume Threshold (multiplier): Set a multiplier of average volume to detect volume spikes, essential for validating support/resistance levels.
Extend Until Price Hits: Enable this to extend support/resistance boxes until the price touches them, providing dynamic levels.
Gray Out Boxes Once Hit: Enable this to gray out the boxes once the price interacts with them, indicating that they are no longer active.
Max Boxes Displayed: Choose 'All', 'Recent Few' (up to 3 boxes each for bull and bear), or 'Recent Several' (up to 10 boxes each for bull and bear) to control the number of visible boxes.
Invalidate Condition: Select 'Touch' to invalidate a box when the price touches it or 'Through' to invalidate when the price passes entirely through the box.
Candle Colors: Option to color candles based on neutral, bullish, or bearish conditions for easier visual analysis.
Application
Strategic Planning: Assists traders in pinpointing potential entry and exit points by marking significant support and resistance zones.
Trend Confirmation: Validates trend strength and potential reversals with volume-based analysis of support and resistance levels.
Customizable Settings: Tailors analysis to various trading strategies with extensive input settings for pivot source, term, volume threshold, and display preferences.
The Support and Resistance Indicator by is an essential addition to any trader’s toolkit, offering robust and customizable market level analysis for improved trading decisions.

ZigZag Multi [TradingFinder] Trend & Wave Lines - Structures🔵 Introduction
"Zigzag" is an indicator that forms based on price changes. Essentially, the function of this indicator is to connect consecutive and alternating High and Low pivots. This pattern assists in analyzing price changes and can also be used to identify classic patterns. "Zigzag" is an analytical tool that, by filtering partial price movements based on the specified period, can identify price waves across different time frames (short or long term).
🔵 Reason for Creation
The combination of "short term zigzag" and "long term zigzag" enhances accuracy and reduces analysis time. In a time frame, "long term zigzag" represents the main trend, while "short term zigzag" depicts short-term waves.
🔵 How to Use
After selecting the desired time frame and adding "zigzag" to the chart, begin utilization. Keep in mind to identify the main market trend from "long term zigzag" and the minor waves from "short term zigzag".
🟣 Important: Additionally, classic patterns such as HH, LH, LL, and HL can be recognized. All traders analyzing financial markets using classic patterns and Elliot Waves can benefit from the "zigzag" indicator to facilitate their analysis.
🔵 Settings
Short term zigzag : In this section, you can adjust settings such as time frame range, display mode, color, and line width of the zigzag lines.
Short term label : This section allows you to activate or deactivate the display of zigzag labels according to your needs. You can also customize their color and size.
Long term zigzag : Here, you can adjust settings for time frame range, display mode, color, and line width of zigzag lines.
Long term label : Similar to short term label settings.
The recommended time frame for "long term zigzag" is between 9 to 15, and for "short term zigzag" is between 3 to 5.
🟣 Important Notes :
Considering the different behaviors of financial markets and various time frames, it is recommended to experiment with different time frame settings when using "zigzag" to find the best settings for each symbol and time frame, thereby preventing potential errors.
🟣 Terminology Explanations :
"HH": When the price is higher than the previous peak (Higher High).
"HL": When the price is higher than the previous low (Higher Low).
"LH": When the price is lower than the previous peak (Lower High).
"LL": When the price is lower than the previous low (Lower Low).

Implied Orderblock Breaker (Zeiierman)█ Overview
The Implied Order Block Breaker (Zeiierman) is a tool designed to identify enhanced order blocks with imbalances. These enhanced order blocks represent areas where there is a rapid price movement. Essentially, this indicator uses order blocks and suggests that a swift price movement away from these levels, breaking the current market structure, could indicate an area that the market has not correctly valued. This technique offers traders a unique method to identify potential market inefficiencies and imbalances, serving as a guide for potential price revisits.
The indicator doesn't scan for imbalances in the traditional sense — where there's an absence of trades between two price levels — but instead, it identifies quick movements away from key levels that suggest where an imbalance might exist. Relying on crossovers and cross-unders in conjunction with pivot points and examining the high/low within the same period provides an innovative method for traders to spot these potentially undervalued or overvalued areas in the market. These inferred imbalances can be crucial for traders looking for price levels where the market might make significant moves.
█ How It Works
Bullish
Crossover: The closing price of a bar crosses above a pivot high, which is an indication that buyers are in control and pushing the price upwards.
New Low Within Period: There is a lower low within the same period as the pivot high. This suggests that after setting a high, the market pulled back to set a new low, potentially leaving a price gap on the way up as the price quickly recovers.
Bearish
Crossunder: The closing price of a bar crosses under a pivot low, indicating that sellers are taking control and driving the price down.
New High Within Period: There is a higher high within the same period as the pivot low. This condition suggests that the market rallied to a new high before falling back below the pivot low, potentially leaving a gap on the way down.
█ How to Use
The enhanced order blocks are often revisited, and the price may aim to 'fill' the potential imbalance created by the rapid price movement, thereby presenting traders with potential entry or exit points. This approach aligns with the idea that imbalances are frequently revisited by the market, and when combined with the context of Order Blocks, it provides even more confluence.
Example
Here, if the price drops rapidly after setting a new high—crossing under the pivot low—it may skip over certain price levels, creating a 'gap' that signifies an area where the price might have been overvalued (imbalance), which the market may revisit for a potential price correction or revaluation.
█ Settings
Period: Determines the number of bars used for identifying pivot highs and lows. A higher value gives more significant but less frequent signals, while a lower value increases sensitivity but might give more false positives.
Pivot Surrounding: Specifies the number of candles to analyze around a pivot point. Increasing this value broadens the analysis range, potentially capturing more setups but possibly including less significant ones.
-----------------
Disclaimer
The information contained in my Scripts/Indicators/Ideas/Algos/Systems does not constitute financial advice or a solicitation to buy or sell any securities of any type. I will not accept liability for any loss or damage, including without limitation any loss of profit, which may arise directly or indirectly from the use of or reliance on such information.
All investments involve risk, and the past performance of a security, industry, sector, market, financial product, trading strategy, backtest, or individual's trading does not guarantee future results or returns. Investors are fully responsible for any investment decisions they make. Such decisions should be based solely on an evaluation of their financial circumstances, investment objectives, risk tolerance, and liquidity needs.
My Scripts/Indicators/Ideas/Algos/Systems are only for educational purposes!

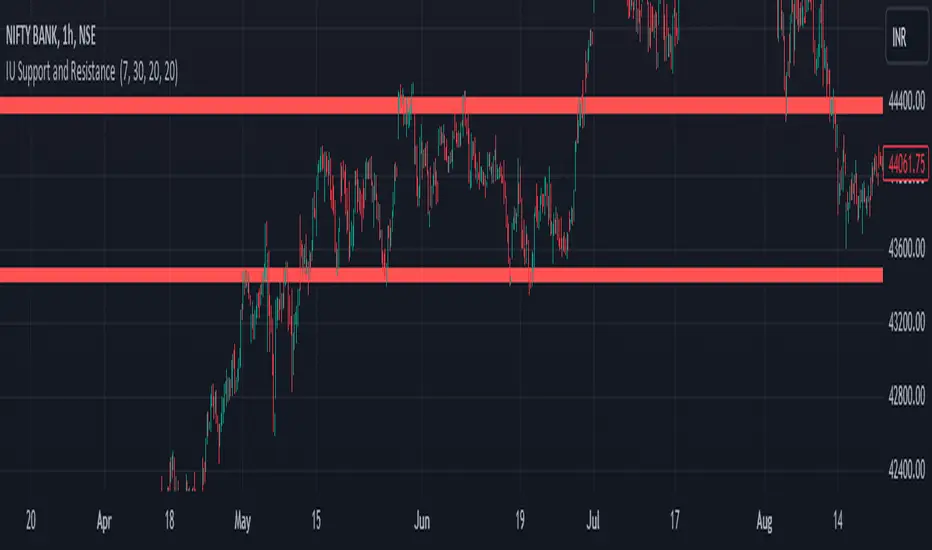
IU Support and Resistance How this script works :
1. This script is an indicator script which calculates the support and resistance based on pivot high and pivot low and plot them as zone onto the chart.
2. The first user input is minimum number of touches which indicates how many time pivot high or pivot low should be tested in order to be a valid support or resistance level.
3.The second user input "Set Buffer" check if the user wants to use a custom buffer or not if it's unchanged then the default is 50% of the 1000 period ATR value .
4. If "Set Buffer" is checked meaning if it's set to true then only the third user input will be execute which is the "buffer" which indicates how much price range user wants his zone to have.
5. After the user input part this script create two arrays to store the pivot high and pivot low values every time he have a new value.
6. This script also creates two arrays to store the bar index of the bar where the new pivot high or pivot low is detected those bar index will be later use while creating the support and resistance zones.
7. Then the script creates four more arrays to store the final support and resistance values and their respective bar index which will be use for creating the support and resistance zones.
8. After this the script check that we are at the last bar of our chart if we are then we sort the support and resistance indices by descending order and store them into an new variable after that we sort the support and resistance arrays by descending order, then we loop through the arrays elements and we check if the previous element comes under the zone of the current element if so we increase the "minimum touch" variable by 1, once we have 5 or more count in our variable and we no longer have a valid zone then we store the element value and the sorted index of the element into our final arrays.
9. Finally the script will loop through the final support and resistance arrays and it will create a box for each support and resistance with respect to extending it on both directions.
10.The green zones are the support and the red zones are the resistance.
How user can benifits from this script:
1. User can automatically identify support and resistance zones and he can plan his trade as per that.
2. User can test how different markets reacts with support and resistance zones.
3. User can plan breakout trade on the break of the support or resistance level.
4. User can adjust he stop loss and take profit as per the support and resistance zones.
Liquidity Breakout - Strategy [presentTrading]- Introduction and How It Is Different
The Liquidity Breakout Strategy is a unique trading strategy that focuses on identifying and leveraging patterns in market price data. This strategy, mainly inspired by the script "Master Pattern" by LuxAlgo, takes a different approach from many traditional strategies that rely on technical indicators or fundamental analysis. Instead, the Liquidity Breakout is based on the concept of contraction detection and liquidity levels. This approach allows traders to identify potential trading opportunities that other strategies might miss.
BTCUSDT 6h
The strategy is different from other trading strategies because it uses a unique combination of pattern detection, liquidity levels, and user-defined trading direction. This combination allows the strategy to adapt to various market conditions and trading styles, making it a versatile tool for traders.
- Strategy: How It Works
1. Contraction Detection: The strategy uses a lookback period defined by the user (default is 10 bars) to identify contractions in the market. A contraction is a period where the market is consolidating, often followed by a significant price movement. The strategy identifies contractions by finding pivot highs and pivot lows within the lookback period. If a pivot high is lower than the previous pivot high and a pivot low is higher than the previous pivot low, a contraction is detected.
2. liquidity Levels:
What are Liquidity levels? Liquidity levels, also known as liquidity pools or zones, are price levels at which there is a significant amount of trading activity. They are often areas where large institutional traders (like banks or hedge funds) have placed orders. These levels are important because they can act as support or resistance levels, and price often reacts at these levels.
In the context of this strategy, liquidity levels are used to identify potential entry and exit points for trades. When the price reaches a liquidity level, it could indicate a potential trading opportunity. For example, if the price breaks through a liquidity level, it could signal the start of a new trend. On the other hand, if the price approaches a liquidity level and then reverses, it could signal a potential reversal.
The strategy uses these two elements to identify potential trading opportunities. When a contraction is detected, the strategy will look for a breakout in the direction of the trend. If the breakout occurs at a liquidity level, the strategy will execute a trade.
The strategy also allows traders to set their stop loss based on either the Average True Range (ATR) or a fixed percentage. This flexibility allows traders to manage their risk according to their personal risk tolerance and trading style.
- Trade Direction
One of the unique features of the Master Pattern Strategy is the ability to choose the trading direction. Traders can choose to trade in the "Long" direction, the "Short" direction, or "Both". This feature allows traders to adapt the strategy to their personal trading style and market outlook.
For example, if a trader believes that the market is in an uptrend, they can choose to trade only in the "Long" direction. Conversely, if the market is in a downtrend, they can choose to trade only in the "Short" direction. If the trader believes that the market is volatile and there are opportunities in both directions, they can choose to trade in "Both" directions.
- Usage
To use the strategy, traders need to input their preferred settings, including the contraction detection lookback period, liquidity levels, stop loss type, and trading direction. Once these settings are input, the strategy will automatically detect potential trading opportunities and execute trades according to the defined parameters.
- Default Settings
The default settings for the Master Pattern Strategy are as follows:
Contraction Detection Lookback: 10
Liquidity Levels: 20
Stop Loss Type: ATR
ATR Length: 20
ATR Multiplier: 3.0
Fixed Percentage: 0.01
Trading Direction: Both
These settings can be adjusted according to the trader's personal preferences and market conditions. It's recommended that traders experiment with different settings to find the ones that work best for their trading style and goals.

Pivot Boss - Advanced Volume IndicatorThis indicator measures "Compression and Expansion" of current bars volume against 10 day average volume(Can be user defined)
Avg Volume = 10 day avg volume
Wide volume = AvgVolume x 1.25 (Volume bar will be Blue color)
Narrow Volume = AvgVolume x 0.65 (Volume bar will be Magenta color)
Yellow line -- 5 bar avg volume
White Line -- 10 bar avg volume

Pivot OBV Reset [LM]Hi traders,
I woud like to introduce new script of obv indicator that resets on creation of new pivot high or low. Note that it resets when it's known that it is a pivot. On the reset candle adds accumulated value from previous candles defined by i_right input.
It has following settings:
pivot setting - here you can infulence pivot detection
obv setting - here you can influence whether it should be multiplied by price or not, if it should show when the reset happen
Hope you'll enjoy it

Floor Pivots_DWMBasic Pivot points.
Script is easy to modify to personal requirements, and explained step-by-step on Kodify.com.
Original script credits: Kodify.com (kodify.net)

Simple AverageSimple average, with builtin plot of a true Weekly, Monthly, Quarterly and Yearly average
(A variation on Pivots, with only the P line (HLC/3))

PivotBoss Wick Reversal SetupPATTERN SUMMARY
1. The body is used to determine the size oftlle reversal wick. A wick tllat is between 2.5 to 3.5 times larger than
the size of the body is ideal.
2. For a bullish reversal wick to exist, tlle close ofthe bar should fall witllin tlle top 35 percent of the overall range
of the candle.
3. For a bearish reversal wick to exist, the close of the bar should fall within the bottom 35 percent of the overall
range of the candle.
PATTERN PSYCHOLOGY
Figure 2-4 shows several types of bullish and bearish reversal wick candlesticks that can all signal
profitable reversal opportunities in the market, especially if these patterns are paired with key pivot levels. In
traditional candlestick jargon, these particular candlesticks would have names ranging from hammer , hanging
man, inverted hammer , shooting star , gravestone doji , or dragonfly doji , depending on where the candle is
placed in a trend. Now you can see why I simply call these candlesticks wicks, or even tails. Instead of fumbling
over the proper naming of these candlesticks , I believe it is more important to know what these patterns
represent. What are they telling you?
Types of Candlestick Reversal Wicks
When the market has been trending lower then suddenly forms a reversal wick candlestick , the likelihood of
a reversal increases since buyers have finally begun to overwhelm the sellers. Selling pressure rules the decline,
but responsive buyers entered the market due to perceived undervaluation. For the reversal wick to open near the
high of the candle, sell off sharply intra-bar, and then rally back toward the open of the candle is bullish , as it
signifies that the bears no longer have control since they were not able to extend the decline of the candle, or the
trend. Instead, the bulls were able to rally price from the lows of the candle and close the bar near the top of its
range, which is bullish - at least for one bar, which hadn't been the case during the bearish trend (see Figure 2.5).
The Stages of a Reversal Wick
Stage 1 Stage 2 Stage 3
Essentially, when a reversal wick forms at the extreme of a trend, the market is telling you that the trend
either has stalled or is on the verge of a reversal. Remember, the market auctions higher in search of sellers, and
lower in search of buyers. When the market over-extends itself in search of market participants, it will find itself
out of value, which means responsive market participants will look to enter the market to push price back toward
an area of perceived value. This will help price find a value area for two-sided trade to take place. When the
market finds itself too far out of value, responsive market participants will sometimes enter the market with
force, which aggressively pushes price in the opposite direction, essentially forming reversal wick candlesticks .
This pattern is perhaps the most telling and common reversal setup, but requires steadfast confirmation in order
to capitalize on its power. Understanding the psychology behind these formations and learning to identify them
quickly will allow you to enter positions well ahead of the crowd, especially if you've spotted these patterns at
potentially overvalued or undervalued areas.

Pivot Range Pivot BossMy first attempt to code something. It's Mark Fischer concept of Pivot Range from his book Logical Trader.
The strategy for using it is actually from Frank Ochoa's book Secrets of a Pivot Boss. Pivot Range is the "meat of the matket" and "the heart beat of the market" according to him.
Besides using the actual pivots the strategy is based on the relationships between 2 day pivot ranges.
Higher Value - Bulish
Overlapping Higher - Moderate Bulish
Lower Value- Bearish
Overlapping Lower - Moderate Bearish
Unchanged - Sideways/Breakout
Outside - Sideways
Inside - Breakout
Pivot Boss 4 EMA Summary:
Creates one indicator with four exponential moving averages based off the central pivot point
which assists you in trading pure price action using floor pivots.
This also helps you to avoid getting chopped up during price confluence.
How to use:
When T-Line cross Green Short EMA it can be used for scalping.
When Short EMA pulls back to Medium EMA you can buy more or sell more
without having to exit your position prematurely before trend direction changes.
This can also be used as position entry points to make sure you are getting the best possible price.
When T-Line, Short EMA and Medium EMA cross over Long EMA you go long or short.

Bulltrapp.com - KEY LEVELSBulltrapp.com - KEY LEVELS
A comprehensive all-in-one key levels indicator designed for serious traders who want to see the most important price levels at a glance.
📊 Features:
Daily Levels
Previous Day High/Low (PDH/PDL)
Daily Open (DO)
Weekly Levels
Current & Previous Week High/Low
Weekly Open (WO)
Monday Range
Monday High/Low - essential for weekly range analysis
Monthly Levels
Current & Previous Month High/Low
Monthly Open (MO)
Quarterly & Yearly Levels
Quarterly Open (QO)
Yearly High/Low/Open with Previous Year levels
Session Levels
Asian, London & New York session High/Low
Customizable session times (UTC based)
Opening Range
NY Opening Range (first 15 min)
London Opening Range (first 15 min)
Automatic Support/Resistance Detection
Pivot-based S/R detection with customizable lookback
Shows levels with the most touches (strongest zones)
Automatic merging of nearby levels to reduce clutter
Configurable sensitivity and history length
⚙️ Customization:
Fully customizable colors for each level type
Adjustable line width and style (Solid/Dashed/Dotted)
Label size options
Toggle each level group on/off independently
Works correctly with Heikin Ashi charts (uses real OHLC data)
📱 Built by Bulltrapp.com
This indicator is brought to you by Bulltrapp.com - your ultimate crypto portfolio tracker!
🚀 Track your entire portfolio across multiple exchanges and wallets in one place
📈 Real-time P&L tracking with detailed analytics
💰 Tax reporting made easy
🔔 Smart alerts for price movements and portfolio changes
Visit bulltrapp.com to take your trading to the next level!
If you find this indicator useful, please give it a ⭐ and leave a comment!

ZigZag Volume Profile [Honestcowboy]The ZigZag Volume Profile Indicator is a combination of 2 very popular trading indicators, the volume profile and zigzag indicator. Instead of using predetermined sessions like traditional volume profile analysis. This indicator expands on zigzag indicators "legs" and draws a volume profile inside each zigzag leg.
What is a Volume Profile?
"Technical analysis tool showing trading volume at specific price levels, creating a horizontal histogram on the side of a chart to reveal areas of high buying/selling interest, unlike traditional volume bars showing volume over time. Key elements include the Point of Control (POC) for most traded price, the Value Area (VAH/VAL), identifying crucial support/resistance, and analyzing profile shapes (like D, B, P) to understand market balance and potential price targets, used by professionals to spot liquidity and market structure."
Key Differences
Does not have a value area but distinguishes each column in relation to the biggest column in percentage terms.
Does not take sessions into account instead using zigzag legs
🟦 CALCULATION
The zigzag volume profile first builds a standard zigzag indicator to find structure in the market. Using pivot points and a minimum % price move threshhold.
Then once it knows the zigzags it will use each leg as a time window to calculate a volume profile inside.
🔹Coloring each column:
The script will find the biggest column in the Profile and use that as a reference for all other columns. It will then decide for each column individually how big it is in % compared to the biggest column. It will use that percentage to decide which color to give it, top 20% will be red, top 40% purple, top 60% blue, top 80% green and all the rest yellow. The user is able to adjust these numbers for further customisation.
🟦 USAGE
The idea behind this indicator is, if you look at markets as different legs (moves) going in a zigzag pattern you might want to look deeper inside your previous moves and see where the actual liquidity/volume was during that move. The hypothesis here is you build trade ideas based on zigzags but then use the volume profiles.
Since volume and market structure are very well known concepts to discretionary traders I'm hoping this indicator might give some different perspective on this relation and help people create a trading approach based on it. Here's some quick cherry picked examples, just as a proof of concept:
🟦 SETTINGS
🔹ZIGZAG SETTINGS
Price Deviotion % : This is the minimum price move in % term from last pivot price needs to move to form a new pivot for the zigzag.
Pivot Legs (Left/Right): The amount of bars a high or a low needs to be higher/lower than to the left and right of the bar. 10 By default to create medium term zigzag
🔹Volume Profile
Profile Rows: The amount of rows in Y axis the zigzag is going to be sliced into to create the volume profile. Higher number is more detailed volume profile but also uses more box objects which is maxed at 500. 25 by default
Profiles to Display: The amount of volume profiles the indicator will draw back in time. Higher number means more history but also longer loading time. 20 by default
🔹Visual Settings
This part is pretty self explanatory and you have can manually select the colors used to create the volume profile. Refer back the the explanation about the "🔹coloring each column" section.

ICT Algo: Sweep + MSS + High Prob FVG/IFVGThis script is a comprehensive execution tool based on Inner Circle Trader (ICT) concepts, specifically designed to identify high-probability entries by combining Liquidity Sweeps, Market Structure Shifts (MSS), and Fair Value Gaps (FVG/IFVG).
Unlike standard FVG indicators that highlight every gap on the chart, this "Algo" version filters for gaps that occur specifically after a liquidity purge and a shift in structure, ensuring you are only looking at setups with institutional backing.
How It Works
The script follows a strict 3-step validation process before plotting a signal:
Liquidity Sweep (The Context): The script tracks Higher Timeframe (HTF) levels including Previous Day High/Low, Weekly High/Low, and Monthly High/Low. A setup is only considered valid if price has recently "swept" one of these levels, indicating a hunt for liquidity.
Market Structure Shift (The Confirmation): Once a sweep occurs, the script looks for a displacement in the opposite direction. It identifies a "Pivot High/Low" (customizable length) and waits for a candle body to close beyond it (MSS).
Filtered Entry (The Trigger): * FVG: Plots a standard Fair Value Gap if it forms within a "Deep Value" zone (Discount for longs, Premium for shorts).
IFVG (Inversion FVG): Highlights failed FVGs that have been reclaimed by price to act as support or resistance.
Key Features
Multi-Timeframe Liquidity Filters: Automatically plots PDH/L, PWH/L, PMH/L, and PYH/L. You can toggle which levels act as your sweep triggers.
Deep Value Logic: The script uses built-in logic to ensure Bullish FVGs are only highlighted when price is below a key liquidity level (Discount), and Bearish FVGs when price is above (Premium).
Dynamic Box Management: To keep your chart clean, boxes for FVGs and IFVGs are automatically shortened ("cut") once they are mitigated by price.
Inversion Logic: Includes a specialized toggle for Inversion Fair Value Gaps, allowing you to trade "failed" gaps that flip their polarity.
Settings & Customization
Entry Setup Bias: Choose to see only Bullish, only Bearish, or Both setups.
MSS Pivot Length: Adjust how "sensitive" the Market Structure Shift detection is. A higher number requires a more significant swing to be broken.
Sweep Lookback: Defines how many bars back the script looks for a liquidity sweep to remain "active" for a setup.
Include Opens: Optional toggle to include Previous Day/Week/Month Opens as liquidity points.
Usage Tips
The Golden Setup: Look for a sweep of a Previous Day High, followed by a Bearish MSS, and an entry at the Red FVG box.
Risk Management: This indicator is designed for entry identification. Always use stop losses (usually placed above/below the candle that created the FVG or the MSS swing point).
Timeframes: Best used on execution timeframes (1m, 5m, 15m) while the script handles the HTF levels automatically.
Disclaimer: This script is an educational tool and does not constitute financial advice. Trading involves significant risk. Past performance of a strategy does not guarantee future results.
Credits: Concepts based on the teachings of Michael J. Huddleston (ICT).

SCOTTGO - Liquidity Zones (Sweeps + Tethers)
SCOTTGO - Liquidity Zones is a high-performance technical analysis tool designed to identify and track Institutional Liquidity Zones, Price Sweeps, and Pivot Levels with a clean, professional-grade interface.
Key Features
Dynamic Liquidity Zones: Automatically identifies Bullish and Bearish zones based on customizable pivot lookbacks.
Identify Liquidity Sweeps: Detects when price "pokes" through a zone but fails to close beyond it, marking the event with a distinct label and a visual tether line.
Active Tracking: Zones and LIQ lines track price in real-time until they are mitigated (broken by a candle close), at which point they visually "deactivate" to reduce clutter.
Professional UI: Features a compact, single-row styling menu (Color, Thickness, and Line Style) that mirrors TradingView’s native design.
Visual Elements
LIQ Lines: Solid or dashed lines tracking the exact pivot price within active zones.
Sweep Tethers: Vertical lines connecting the candle extreme to the "SWEEP" label for precise visual confirmation.
Detailed Tooltips: Hover over LIQ labels or Sweep tags to view specific price data and zone context.
Zone Titles: Clearly labeled "BULL ZONE" and "BEAR ZONE" tags with independent font size controls.
How to Use
Core Logic: Adjust the Pivot Lookback to define the strength of the levels you want to track.
Styling: Use the Inputs Tab for compact, specialized styling of Lines, Borders, and Sweeps.
Analysis: Look for "Sweeps" at zone boundaries as potential signs of reversal or stop-running.

Impulsive Trend Detector [dtAlgo]This advanced Pine Script indicator identifies and tracks impulsive price movements based on Break of Structure (BOS) and Change of Character (CHoCH) concepts from Smart Money trading methodology.
The indicator automatically detects pivot highs and lows, then monitors when price breaks these key levels to signal potential impulsive moves. BOS indicates continuation in the current trend direction, while CHoCH signals potential trend reversals. Each detected move is measured from the break point to the next opposing pivot, providing accurate percentage calculations that match TradingView's measuring tool.
Impulsive moves are categorized into four levels based on magnitude (Level 1: 5-10%, Level 2: 10-15%, Level 3: 15-20%, Level 4: 20%+), with color-coded visual labels and connecting lines displayed directly on the chart.
Comprehensive Session Analysis:
Track moves across 11 distinct trading sessions in Eastern Time: Pre-London/NY, London/NY overlap, NY (with Power Hour and End subdivisions), Sydney, Asia, Sake Time, Asia/London overlap, London, Weekend, and No Session periods.
Three Dynamic Tables provide:
Real-time statistics (bullish/bearish, BOS/CHoCH, levels)
Session breakdown with move counts and average percentages
Event log showing last 10 moves with date, day, session, direction, type, level, percentage, duration, and bar count
Perfect for Smart Money traders seeking data-driven insights into market structure behavior across global trading sessions.

TrendlinesDowntrend lines are one of the most important tools in technical analysis. A downtrend line is created by connecting a series of lower highs which forms a clear visual line where price repeatedly finds resistance. Traders use these lines to understand trend direction, time entries, plan exits, and quickly recognize when momentum is shifting.
This indicator automatically finds and maintains the strongest downtrend lines on any timeframe. It removes the guesswork and inconsistency that comes with manually drawing trendlines.
Unlike most other trendline indicators that just draw lines from swing highs to the current high, this indicator actively scans for new pivot highs, tests each potential line against live price action and only promotes a line to valid status once it has proven itself as a true trendline by price touching or respecting the line a user defined number of times, with the default set to three. This filters out noise and leaves only the most meaningful and reliable trendlines on your chart.
When price eventually breaks a respected downtrend line the indicator highlights the breakout immediately. Traders often use these moments for entries confirmation signals or to prepare for a potential shift in market behavior. The breakout alert is built directly into the indicator so you never miss an important move.
This indicator also works with the Pine Screener to find tickers with current valid trendlines.
How are trendlines determined?
The indicator begins by anchoring to the most recent pivot high. From there it draws a temporary line to the current bar and evaluates every bar between the two points.
Each time a high comes within a user selected buffer zone around that line it is counted as a touch. Once the required number of touches is confirmed and price has never exceeded the buffer to the upside the trendline becomes valid and is displayed on the chart as an active downtrend line.

ULTIMATE ORDER FLOW SYSTEM🔥 ULTIMATE ORDER FLOW SYSTEM
Overview
This comprehensive order flow analysis tool combines **Volume Profile**, **Cumulative Delta**, and **Large Order Detection** to identify high-probability trading setups. The script analyzes institutional order flow patterns and volume distribution to pinpoint key levels where price is likely to react.
📊 Core Components & Methodology
🔥 ULTIMATE ORDER FLOW SYSTEM
Overview
This comprehensive order flow analysis tool combines Volume Profile, Cumulative Delta, and Large Order Detection to identify high-probability trading setups. The script analyzes institutional order flow patterns and volume distribution to pinpoint key levels where price is likely to react.
________________________________________
📊 Core Components & Methodology
1. Volume Profile Analysis
The script constructs a horizontal volume profile by:
• Dividing the price range into configurable rows (default: 20)
• Accumulating volume at each price level over a lookback period (default: 50 bars)
• Separating buy volume (green bars close > open) from sell volume (red bars)
• Identifying three critical levels:
o POC (Point of Control): Price level with highest traded volume - acts as a strong magnet
o VAH/VAL (Value Area High/Low): Contains 70% of total volume - defines fair value zone
o HVN (High Volume Nodes): Resistance zones where institutions accumulated positions
o LVN (Low Volume Nodes): Thin zones that price moves through quickly - ideal targets
Why This Matters: Institutional traders leave footprints through volume. HVN zones show where large players defended levels, making them reliable support/resistance.
________________________________________
2. Cumulative Delta (Order Flow)
Tracks the running total of buying vs selling pressure:
• Bar Delta: Difference between buy and sell volume per candle
• Cumulative Delta: Sum of all bar deltas - shows net directional pressure
• Delta Moving Average: Smoothed delta (20-period) to identify trend
• Delta Divergences:
o Bullish: Price makes lower low, but delta makes higher low (absorption at bottom)
o Bearish: Price makes higher high, but delta makes lower high (exhaustion at top)
How It Works: When cumulative delta trends up while price consolidates, it signals accumulation. Delta divergences reveal when smart money is positioned opposite to retail expectations.
________________________________________
3. Large Order Detection
Identifies institutional-sized orders in real-time:
• Compares current bar volume to 20-period moving average
• Flags orders exceeding 2.5x average volume (configurable multiplier)
• Distinguishes bullish (green circles below) vs bearish (red circles above) large orders
Rationale: Sudden volume spikes at key levels indicate institutional participation - the "fuel" needed for breakouts or reversals.
________________________________________
🎯 Trading Signal Logic
Combined Setup Criteria
The script generates SHORT and LONG signals when multiple conditions align:
SHORT Signal Requirements:
1. Price reaches an HVN resistance zone (within 0.2%)
2. Large sell order detected (volume spike + red candle)
3. Cumulative delta is bearish OR bearish divergence present
4. 10-bar cooldown between signals (prevents overtrading)
LONG Signal Requirements:
1. Price reaches an HVN support zone
2. Large buy order detected (volume spike + green candle)
3. Cumulative delta is bullish OR bullish divergence present
4. 10-bar cooldown enforced
________________________________________
🔧 Customization Options
Setting - Purpose - Recommendation
Volume Profile Rows - Granularity of level detection - 20 (balanced)
Lookback Period - Historical data analyzed - 50 bars (intraday), 200 (swing)
Large Order Multiplier - Sensitivity to volume spikes - 2.5x (standard), 3.5x (conservative)
HVN Threshold - Resistance zone detection - 1.3 (default)
LVN Threshold - Target zone identification - 0.6 (default)
Divergence Lookback - Pivot detection period - 5 bars (responsive)
________________________________________
📈 Dashboard Indicators
The real-time panel displays:
• POC: Current Point of Control price
• Location: Whether price is at HVN resistance
• Orders: Current large buy/sell activity
• Cumulative Δ: Net order flow value + trend direction
• Divergence: Active bullish/bearish divergences
• Bar Strength: % of candle volume that's directional (>65% = strong)
• SETUP: Current trade signal (LONG/SHORT/WAIT)
________________________________________
🎨 Visual System
• Yellow POC Line: Highest volume level - primary pivot
• Blue Value Area Box: Fair value zone (VAH to VAL)
• Red HVN Zones: Resistance/support from institutional accumulation
• Green LVN Zones: Low-liquidity targets for quick moves
• Volume Bars: Green (buy pressure) vs Red (sell pressure) distribution
• Triangles: LONG (green up) and SHORT (red down) entry signals
• Diamonds: Divergence warnings (cyan=bullish, fuchsia=bearish)
________________________________________
💡 How This Script Is Unique
Unlike standalone volume profile or delta indicators, this script:
1. Synthesizes three complementary methods - volume structure, order flow momentum, and liquidity detection
2. Requires multi-factor confirmation - signals only trigger when price, volume, and delta align at key zones
3. Adapts to market regime - delta filters ensure you're trading with the dominant order flow direction
4. Provides context, not just signals - the dashboard helps you understand why a setup is forming
________________________________________
⚙️ Best Practices
Timeframes:
• 5-15 min: Scalping (use 30-50 bar lookback)
• 1-4 hour: Swing trading (use 100-200 bar lookback)
Risk Management:
• Enter on signal candle close
• Stop loss: Beyond nearest HVN/LVN zone
• Target 1: Next LVN level
• Target 2: Opposite value area boundary
Filters:
• Avoid signals during major news events
• Require bar delta strength >65% for aggressive entries
• Wait for delta MA cross confirmation in ranging markets
________________________________________
🚨 Alerts Available
• Long Setup Trigger
• Short Setup Trigger
• Bullish/Bearish Divergence Detection
• Large Buy/Sell Order Execution
________________________________________
📚 Educational Context
This methodology is based on principles used by professional order flow traders:
• Market Profile Theory: Volume distribution reveals fair value
• Tape Reading: Large orders show institutional intent
• Auction Theory: Price seeks areas of liquidity imbalance (LVN zones)
The script automates pattern recognition that discretionary traders spend years learning to identify manually.
________________________________________
⚠️ Disclaimer
This indicator is a trading tool, not a trading system. It identifies high-probability setups based on order flow analysis but requires proper risk management, market context, and trader discretion. Past performance does not guarantee future results.
________________________________________
Version: 6 (Pine Script)
Type: Overlay + Separate Pane (Delta Panel)
Resource Usage: Moderate (500 bars history, 500 lines/boxes)
________________________________________
For questions or support, please comment below. If you find this script valuable, please boost and favorite! 🚀
1. Volume Profile Analysis
The script constructs a horizontal volume profile by:
- Dividing the price range into configurable rows (default: 20)
- Accumulating volume at each price level over a lookback period (default: 50 bars)
- Separating buy volume (green bars close > open) from sell volume (red bars)
- Identifying three critical levels:
- POC (Point of Control): Price level with highest traded volume - acts as a strong magnet
- VAH/VAL (Value Area High/Low): Contains 70% of total volume - defines fair value zone
- HVN (High Volume Nodes): Resistance zones where institutions accumulated positions
- LVN (Low Volume Nodes): Thin zones that price moves through quickly - ideal targets
Why This Matters: Institutional traders leave footprints through volume. HVN zones show where large players defended levels, making them reliable support/resistance.
---
2. Cumulative Delta (Order Flow)
Tracks the running total of buying vs selling pressure:
- **Bar Delta**: Difference between buy and sell volume per candle
- **Cumulative Delta**: Sum of all bar deltas - shows net directional pressure
- **Delta Moving Average**: Smoothed delta (20-period) to identify trend
- **Delta Divergences**:
- **Bullish**: Price makes lower low, but delta makes higher low (absorption at bottom)
- **Bearish**: Price makes higher high, but delta makes lower high (exhaustion at top)
**How It Works**: When cumulative delta trends up while price consolidates, it signals accumulation. Delta divergences reveal when smart money is positioned opposite to retail expectations.
---
### 3. **Large Order Detection**
Identifies **institutional-sized orders** in real-time:
- Compares current bar volume to 20-period moving average
- Flags orders exceeding 2.5x average volume (configurable multiplier)
- Distinguishes bullish (green circles below) vs bearish (red circles above) large orders
**Rationale**: Sudden volume spikes at key levels indicate institutional participation - the "fuel" needed for breakouts or reversals.
---
## 🎯 Trading Signal Logic
### Combined Setup Criteria
The script generates **SHORT** and **LONG** signals when multiple conditions align:
**SHORT Signal Requirements:**
1. Price reaches an HVN resistance zone (within 0.2%)
2. Large sell order detected (volume spike + red candle)
3. Cumulative delta is bearish OR bearish divergence present
4. 10-bar cooldown between signals (prevents overtrading)
**LONG Signal Requirements:**
1. Price reaches an HVN support zone
2. Large buy order detected (volume spike + green candle)
3. Cumulative delta is bullish OR bullish divergence present
4. 10-bar cooldown enforced
---
## 🔧 Customization Options
| Setting | Purpose | Recommendation |
|---------|---------|----------------|
| **Volume Profile Rows** | Granularity of level detection | 20 (balanced) |
| **Lookback Period** | Historical data analyzed | 50 bars (intraday), 200 (swing) |
| **Large Order Multiplier** | Sensitivity to volume spikes | 2.5x (standard), 3.5x (conservative) |
| **HVN Threshold** | Resistance zone detection | 1.3 (default) |
| **LVN Threshold** | Target zone identification | 0.6 (default) |
| **Divergence Lookback** | Pivot detection period | 5 bars (responsive) |
---
## 📈 Dashboard Indicators
The real-time panel displays:
- **POC**: Current Point of Control price
- **Location**: Whether price is at HVN resistance
- **Orders**: Current large buy/sell activity
- **Cumulative Δ**: Net order flow value + trend direction
- **Divergence**: Active bullish/bearish divergences
- **Bar Strength**: % of candle volume that's directional (>65% = strong)
- **SETUP**: Current trade signal (LONG/SHORT/WAIT)
---
## 🎨 Visual System
- **Yellow POC Line**: Highest volume level - primary pivot
- **Blue Value Area Box**: Fair value zone (VAH to VAL)
- **Red HVN Zones**: Resistance/support from institutional accumulation
- **Green LVN Zones**: Low-liquidity targets for quick moves
- **Volume Bars**: Green (buy pressure) vs Red (sell pressure) distribution
- **Triangles**: LONG (green up) and SHORT (red down) entry signals
- **Diamonds**: Divergence warnings (cyan=bullish, fuchsia=bearish)
---
## 💡 How This Script Is Unique
Unlike standalone volume profile or delta indicators, this script:
1. **Synthesizes three complementary methods** - volume structure, order flow momentum, and liquidity detection
2. **Requires multi-factor confirmation** - signals only trigger when price, volume, and delta align at key zones
3. **Adapts to market regime** - delta filters ensure you're trading with the dominant order flow direction
4. **Provides context, not just signals** - the dashboard helps you understand *why* a setup is forming
---
## ⚙️ Best Practices
**Timeframes:**
- 5-15 min: Scalping (use 30-50 bar lookback)
- 1-4 hour: Swing trading (use 100-200 bar lookback)
**Risk Management:**
- Enter on signal candle close
- Stop loss: Beyond nearest HVN/LVN zone
- Target 1: Next LVN level
- Target 2: Opposite value area boundary
**Filters:**
- Avoid signals during major news events
- Require bar delta strength >65% for aggressive entries
- Wait for delta MA cross confirmation in ranging markets
---
## 🚨 Alerts Available
- Long Setup Trigger
- Short Setup Trigger
- Bullish/Bearish Divergence Detection
- Large Buy/Sell Order Execution
---
## 📚 Educational Context
This methodology is based on principles used by professional order flow traders:
- **Market Profile Theory**: Volume distribution reveals fair value
- **Tape Reading**: Large orders show institutional intent
- **Auction Theory**: Price seeks areas of liquidity imbalance (LVN zones)
The script automates pattern recognition that discretionary traders spend years learning to identify manually.
---
## ⚠️ Disclaimer
This indicator is a **trading tool, not a trading system**. It identifies high-probability setups based on order flow analysis but requires proper risk management, market context, and trader discretion. Past performance does not guarantee future results.
---
**Version**: 6 (Pine Script)
**Type**: Overlay + Separate Pane (Delta Panel)
**Resource Usage**: Moderate (500 bars history, 500 lines/boxes)
---
*For questions or support, please comment below. If you find this script valuable, please boost and favorite!* 🚀

Levels[cz]Description
Levels is a proportional price grid indicator that draws adaptive horizontal levels based on higher timeframe (HTF) closes.
Instead of relying on swing highs/lows or pivots, it builds structured support and resistance zones using fixed percentage increments from a Daily, Weekly, or Monthly reference close.
This creates a consistent geometric framework that helps traders visualize price zones where reactions or consolidations often occur.
How It Works
The script retrieves the last HTF close (Daily/Weekly/Monthly).
It then calculates percentage-based increments (e.g., 0.5%, 1%, 2%, 4%) above and below that reference.
Each percentage forms a distinct “level group,” creating layered grids of potential reaction zones.
Levels are automatically filtered to avoid overlap between different groups, keeping the chart clean.
Visibility is dynamically controlled by timeframe:
Level 1 → up to 15m
Level 2 → up to 1h
Level 3 → up to 4h
Level 4 → up to 1D
This ensures the right amount of structural detail at every zoom level.
How to Use
Identify confluence zones where multiple levels cluster — often areas of strong liquidity or reversals.
Use the grid as a support/resistance map for entries, targets, and stop placement.
Combine with trend or momentum indicators to validate reactions at key price bands.
Adjust the percentage increments and reference timeframe to match the volatility of your instrument (e.g., smaller steps for crypto, larger for indices).
Concept
The indicator is based on the idea that markets move in proportional price steps, not random fluctuations.
By anchoring levels to a higher-timeframe close and expanding outward geometrically, Levels highlights recurring equilibrium and expansion zones — areas where traders can anticipate probable turning points or consolidations.
Features
4 customizable percentage-based level sets
Dynamic visibility by timeframe
Non-overlapping level hierarchy
Lightweight on performance
Fully customizable colors, styles, and widths

Orderblocks & BreakersThis indicator identifies potential orderblocks and breakers based on recent swing highs and lows. It is built to offer a structured, customizable, and noise-controlled view of how price interacts with supply and demand levels.
The script applies pivot-based swing detection to identify swing highs and lows.
Bullish Orderblocks: The script Identifies and stores the last down candle before a swing high is breached and confirms and plots the orderblock with a market structure break (close above the swing high).
Bearish Orderblocks: The script Identifies and stores the last up candle before a swing low is breached and confirms and plots the orderblock with a market structure break (close below the swing low).
When price later closes through an existing orderblock, it is reclassified as a Breaker and recolored accordingly. (all colors can be changed in the settings)
What Makes It Different
Unlike most orderblock tools that simply mark every swing-based block, this version introduces:
1. Chop Control – automatically hides breakers that price repeatedly closes through (2 closes after the orderblock becomes a breaker), keeping only relevant zones visible.
2. Recent Block Filtering – limits how many of the recent orderblocks or breakers are displayed, preventing chart clutter.
3. Dynamic Updating – orderblocks automatically convert to breakers when price closes beyond them, with clear color changes.
These features make it easier to study cleaner price structure without manually managing old or invalid zones. The optional Chop Control filter can reduce overlapping or repeatedly invalidated zones to keep the chart clearer.
Customizable Parameters
- Swing detection length (shorter means more aggressive pivot detection, longer means less aggressive so less highs/lows detected)
- Number of recent blocks to display
- Visibility toggles for orderblocks or breakers
- Color and transparency controls for each type
Alerts
Alerts can be set to trigger when price tests any defined zone.
Purpose
This indicator is designed as a price structure visualization and study tool.
It may assist in understanding how price interacts with previously active regions, but it does not produce signals or trade recommendations.

BE-Fib Channel 2 Sided Trading█ Overview:
"BE-Fib Channel 2 Sided Trading" indicator is built with the thought of 2 profound setups named "Cup & Handle (C&H)" and "Fibonacci Channel Trading (FCT)" with the context of "day trading" or with a minimum holding period.
█ Similarities, Day Trading Context & Error Patterns:
While the known fact is that both C&H and FCT provide setups with lesser risk with bigger returns, they both share the similar "Base Pattern".
Note: Inverse of the above Image shall switch the setups between long vs short.
Since the indicator is designed for smaller time-frame candles, there may be instances where the "base pattern" does not visually resemble a Cup & Handle (C&H) pattern. However, patterns are validated using pivot points. The points labeled "A" and "C" can be equal or slightly slanted. Settings of the Indicator allows traders a flexibility to control the angle of these points to spot the strategies according to set conditions. Therefore, understanding the nuances of these patterns is crucial for effective decision-making.
█ 2 Sided Edge: FCT suggests to take trade closer to the yellow line to get better RR ratio. this leaves a small chance of doubt as to; what if price is intended to break the Yellow line thereby activating the C&H.
Wait for the confirmation is a Big FOMO with a compromised RR.
Hence, This indicator is designed to handle both the patterns based on the strength, FIFO and pattern occurring delay.
█ How to Use this Indicator:
Step 1: Enable the Show Sample Sensitivity option to understand the angle of yellow line shown in the sample image. By enabling this option, On the last bar you shall see 4 lines being plotted depicting the max angle which is acceptable for both long and short trades.
Note: Angle can be controlled via setting "Sensitivity".
Higher Sensitivity --> Higher Setup identification --> can lead to failed setups due to 2 sided trading.
Lower Sensitivity --> Lower Setup identification --> can increase the changes of being right.
Step 2: Adjust the look back & look forward periods which shall be used for identifying patterns.
Note: Smaller values can lead to more setups being identified but can hamper the performance of the indicator while increasing the chances of failures. larger values identifies more significant setup but leads to more waiting period thereby compromising on the RR.
Step 3: Adjust the Base Range.
Note: Smaller values can lead to more setups being identified but can hamper the performance of the indicator while increasing the chances of failures. larger values identifies more significant setup but leads to more Risk on play.
Step 4: set the Entry level for FCT & Set the SL for Both FCT & C&H and Target Reward ratio for C&H.
█ Features of Indicator & How it works:
1. Patterns are being identified using Pivot Points method.
2. Tracks & validates both the setups simultaneously on every candle and traded one at a time based on FIFO, New setups found in-between, Defined Entry Levels while on wait for the other pattern to get activated.
3. Alerts added for trade events.
4. FCT setups are generally traded with trailed SL level and increasing Target level on every completed bar. while C&H has the standard SL & TP level with no Trail SL option.
DISCLAIMER: No sharing, copying, reselling, modifying, or any other forms of use are authorized for our documents, script / strategy, and the information published with them. This informational planning script / strategy is strictly for individual use and educational purposes only. This is not financial or investment advice. Investments are always made at your own risk and are based on your personal judgement. I am not responsible for any losses you may incur. Please invest wisely.
Happy to receive suggestions and feedback in order to improve the performance of the indicator better.
